


 , Tiantian Sang 1,2,†, Zuozhi Li 1, Naqiang Lv 1, Jinxing Liu 1, Yingzhen Gu 1, Xiaorong Han 1, Wei Zhang 1, Aimin Dang 1,*
1 Department of Cardiology, Fuwai Hospital, National Center for Cardiovascular Diseases, Chinese Academy of Medical Sciences and Peking Union Medical College, 100037 Beijing, China
2 Department of Geriatrics, Beijing Jishuitan Hospital, Capital Medical University, 100035 Beijing, China
†These authors contributed equally.
Abstract
While the association between estimated glomerular filtration rate (eGFR) and cardiovascular disease has been well established in younger populations, the prognostic significance of this marker in older individuals remains less well defined. Thus, this study aimed to evaluate the predictive value of eGFR in patients aged 80 years or older with acute coronary syndrome (ACS).
We enrolled 551 patients aged ≥80 years hospitalized for ACS, who had the eGFR calculated at admission. The participants were further stratified into three groups by eGFR levels: Low-eGFR group (L-eGFR, eGFR < the 20th percentile), Medium-eGFR group (M-eGFR, the 20th percentile ≤ eGFR < the 80th percentile), and High-eGFR group (H-eGFR, eGFR ≥ the 80th percentile). Major adverse cardiovascular events (MACEs) were recorded during the follow-up period.
During a median 63-month follow-up, the L-eGFR group exhibited a higher cumulative incidence of MACEs, while the H-eGFR group showed a relatively improved prognosis compared with the M-eGFR group. A multivariate Cox regression analysis revealed that reduced eGFR levels remained independently predictive for long-term MACEs. Compared with the M-eGFR group, the L-eGFR group showed a higher risk (hazard ratio (HR) 1.542, 95% confidence interval (CI): 1.104–2.155). The H-eGFR group exhibited a protective effect (HR 0.643, 95% CI: 0.438–0.943).
Reduced eGFR levels were independent predictors for long-term MACEs in older ACS patients. The H-eGFR group had an improved prognosis, suggesting that further exploration of the underlying mechanism linking renal function and prognosis is warranted.
Keywords
- glomerular filtration rate
- aged, 80 and over
- acute coronary syndrome
- prognosis
Coronary artery disease (CAD) stands as a predominant contributor to global morbidity and mortality, representing a critical public health challenge [1, 2]. Acute coronary syndrome (ACS) is a serious type of CAD with a poor prognosis, especially in the elderly [3]. Despite the promotion of healthy lifestyles, controlling cardiovascular risk factors and appropriate antithrombotic treatments, ischemic events still occur [4]. This fact suggests that targeting traditional risk factors may not be sufficient to improve clinical outcomes, and new targets and therapies need to be identified.
Chronic kidney disease (CKD) imposes a growing burden on public health and is closely linked to cardiovascular disease (CVD) [5, 6]. Estimated glomerular filtration rate (eGFR) serves as a common clinical indicator for renal function. Several studies have shown that lower eGFR was associated with an increased cardiovascular risk [7, 8, 9, 10, 11]. However, emerging evidence points to a U-shaped relationship between eGFR and mortality, suggesting that renal hyperfiltration might be a powerful predictor for poor cardiovascular prognosis [12, 13].
The World Health Organization (WHO) defines the population aged 80 and above as “oldest-old”, who are rapidly increasing worldwide and have different physiological status from younger populations due to aging, frailty, malnutrition and comorbidities [14]. Advanced age is associated with a rising prevalence of chronic conditions such as hypertension and diabetes. The cumulative effect of these diseases and their complications significantly diminishes the quality of life and increases the susceptibility to adverse clinical outcomes in older individuals. Frailty is a common geriatric syndrome reflecting decreased physiological reserve and increased vulnerability to stressors [15] and poses a higher risk of readmission and mortality [16]. A community-based study in China reported an overall frailty prevalence of 9.9% in the elderly, which rose sharply to 26% among those aged 80 and above [17]. Despite growing research interest in the elderly, advanced-age patients are still systematically excluded from large clinical trials. Less than 10% of ACS trials include patients over 75 [18], leading to limited generalizability of findings in this population. To address this gap, the present study aimed to determine the prognostic role of baseline eGFR in ACS patients aged 80 years and older.
This study included patients aged 80 years or above with a primary diagnosis of ACS, who were admitted to Fuwai Hospital (Beijing, China) between January 2011 and February 2016. The exclusion criteria were: history of malignant tumors, acute or chronic infection, in-hospital death or life expectancy less than 1 month after discharge, and patients with incomplete data. The final study population comprised 551 individuals, of whom 44 were lost to follow-up (Fig. 1).
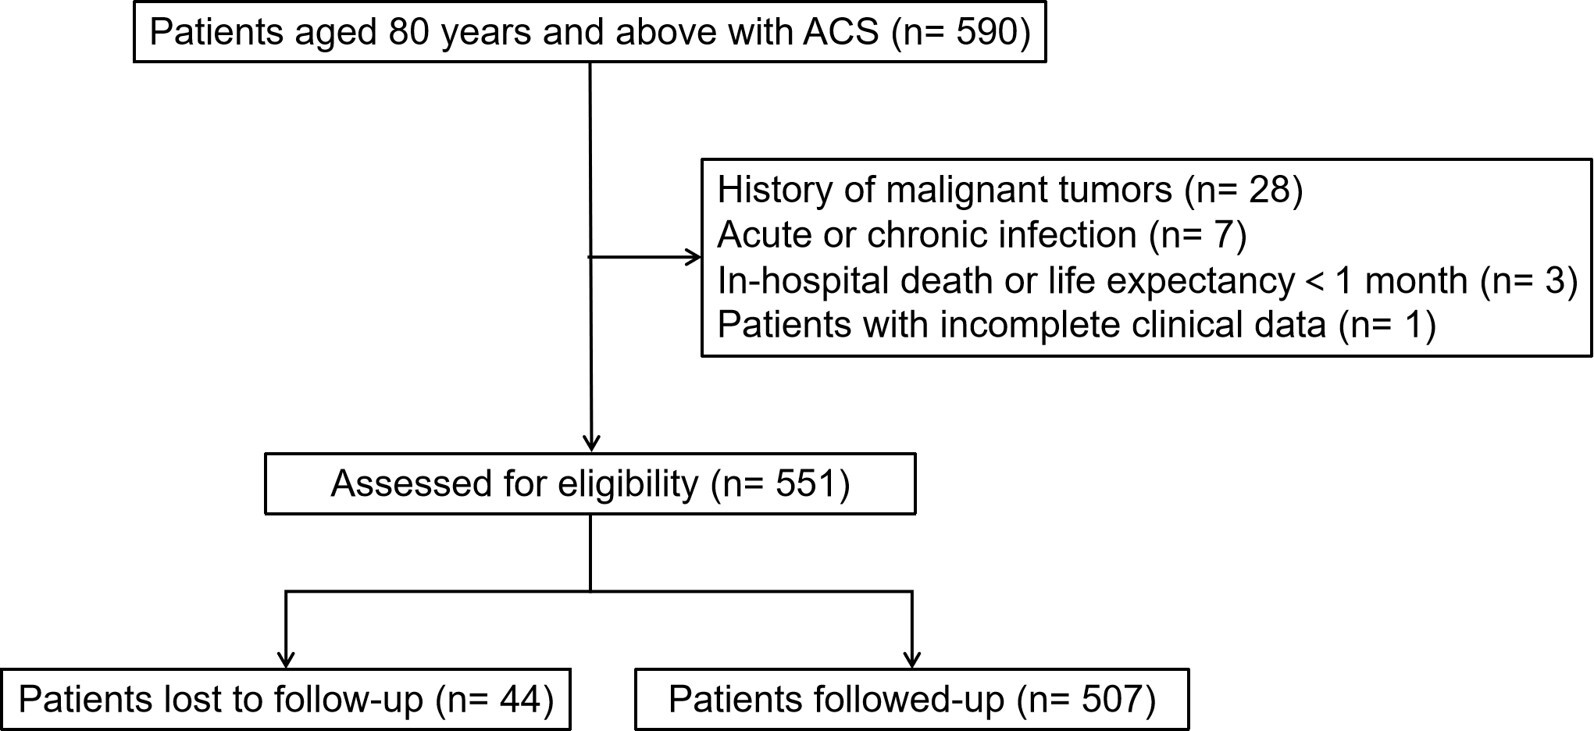 Fig. 1.
Flow diagram of patient selection. ACS, acute coronary syndrome.
According to the eGFR levels calculated at admission, the participants were
further divided into three groups: Low-eGFR group (L-eGFR, eGFR
The demographic and clinical data was collected through electronic medical records by trained physicians. The data included gender, age, height, weight, cardiovascular risk factors, medical history, and vital signs measured at admission. Fasting venous blood samples were obtained from all enrolled participants. All laboratory assays were subsequently performed by the clinical chemistry department of the Fuwai Hospital.
Definitions for related diseases and conditions were as follows: (1)
Hypertension: systolic blood pressure
Body mass index (BMI) was calculated as the ratio of weight to height squared
(kg/m2). The eGFR was calculated using the Modification of Diet in Renal
Disease (MDRD) formula: eGFR (mL/min per 1.73 m2) = 186
Follow-up was performed by trained physicians via clinic visits or phone calls in September 2020. The endpoint of this study was major adverse cardiovascular events (MACE), including all-cause mortality, non-fatal myocardial infarction, unplanned target vessel revascularization, non-fatal stroke/transient ischemic attack (TIA), and readmission due to heart failure.
Continuous variables were tested for normal distribution with the
Kolmogorov-Smirnov test. Based on their distribution, they were expressed as mean
A total of 551 patients were enrolled, with a median age of 81 years and a male predominance of 62.1%. In this cohort, hypertension and dyslipidemia were prevalent in nearly 80%, while diabetes mellitus was present in more than one-third.
Table 1 summarizes the baseline characteristics of the study population, which
were classified into three groups: the L-eGFR group (eGFR
| Variables | Overall (N = 551) | L-eGFR (N = 111) | M-eGFR (N = 330) | H-eGFR (N = 110) | p value | |
| Male, n (%) | 342 (62.1%) | 49 (44.1%)* | 219 (66.4%) | 74 (67.3%) | ||
| Age, years | 81.00 (80.00, 83.00) | 82.00 (80.00, 83.00) | 81.00 (80.00, 83.00) | 81.00 (80.00, 82.00) | 0.018 | |
| BMI, kg/m2 | 24.4 |
24.9 |
24.4 |
23.8 |
0.173 | |
| Hypertension, n (%) | 438 (79.5%) | 96 (86.5%) | 257 (77.9%) | 85 (77.3%) | 0.123 | |
| Dyslipidemia, n (%) | 441 (80.0%) | 97 (87.4%) | 259 (78.5%) | 85 (77.3%) | 0.092 | |
| Diabetes, n (%) | 194 (35.2%) | 46 (41.4%) | 106 (32.1%) | 42 (38.2%) | 0.158 | |
| Smoking, n (%) | 229 (41.6%) | 38 (34.2%) | 148 (44.8%) | 43 (39.1%) | 0.123 | |
| Prior MI, n (%) | 128 (23.2%) | 37 (33.3%)* | 73 (22.1%) | 18 (16.4%) | 0.009 | |
| History of stroke/TIA, n (%) | 140 (25.4%) | 29 (26.1%) | 79 (23.9%) | 32 (29.1%) | 0.551 | |
| Atrial fibrillation, n (%) | 92 (16.7%) | 28 (25.2%) | 58 (17.6%) | 6 (5.5%) | ||
| Classification of ACS | 0.043 | |||||
| Unstable angina, n (%) | 381 (69.1%) | 65 (58.6%) | 238 (72.1%) | 78 (70.9%) | ||
| NSTEMI, n (%) | 85 (15.4%) | 20 (18.0%) | 51 (15.5%) | 14 (12.7%) | ||
| STEMI, n (%) | 85 (15.4%) | 26 (23.4%) | 41 (12.4%) | 18 (16.4%) | ||
| HR, bpm | 67 (62, 75) | 68 (62, 76) | 67 (62, 75) | 68 (61, 77) | 0.974 | |
| SBP, mmHg | 130 (120, 140) | 130 (120, 141) | 130 (120, 141) | 130 (120, 140) | 0.088 | |
| DBP, mmHg | 70 (63, 80) | 70 (60, 79) | 70 (63, 80) | 70 (67, 80) | 0.057 | |
| Leukocyte, ×109/L | 6.49 (5.46, 7.83) | 7.28 (6.08, 8.53) | 6.45 (5.44, 7.79) | 5.96 (5.03, 7.09) | ||
| Albumin, g/L | 39.4 (36.7, 42.5) | 39.2 (36.7, 42.0) | 39.7 (36.7, 42.9) | 39.1 (36.8, 42.5) | 0.556 | |
| TG, mmol/L | 1.28 (0.94, 1.71) | 1.50 (1.13, 2.07)* | 1.26 (0.95, 1.67) | 1.09 (0.88, 1.48) | ||
| TC, mmol/L | 3.84 (3.31, 4.46) | 3.99 (3.49, 4.59) | 3.82 (3.30, 4.38) | 3.68 (3.13, 4.38) | 0.086 | |
| HDL-C, mmol/L | 1.08 (0.91, 1.30) | 1.05 (0.87, 1.24) | 1.10 (0.92, 1.30) | 1.08 (0.93, 1.35) | 0.100 | |
| LDL-C, mmol/L | 2.23 (1.80, 2.69) | 2.29 (1.78, 2.82) | 2.23 (1.80, 2.68) | 2.09 (1.67, 2.60) | 0.182 | |
| eGFR, mL/min per 1.73 m2 | 88.98 |
56.28 |
87.88 |
125.29 |
||
| Uric acid, µmol/L | 345.14 (280.56, 414.28) | 427.25 (344.07, 506.90)* | 346.42 (291.89, 406.65)* | 273.59 (242.86, 344.02)* | ||
| hsCRP, mg/L | 2.37 (1.20, 7.39) | 4.21 (1.54, 11.12) | 2.21 (1.05, 6.19) | 1.93 (1.22, 4.60) | ||
| HbA1c, % | 6.2 (5.8, 6.8) | 6.4 (5.9, 7.5) | 6.2 (5.8, 6.7) | 6.2 (5.9, 6.9) | 0.257 | |
| NT-proBNP, pg/mL | 692.8 (366.2, 1230.2) | 1016.1 (500.6, 2145.0)* | 680.2 (371.0, 1200.9) | 601.4 (270.1, 845.5) | ||
| LVEF, % | 60.0 (56.0, 65.0) | 58.6 (52.0, 62.0)* | 60.4 (56.6, 65.0) | 60.1 (56.0, 65.0) | ||
Abbreviations: ACS, acute coronary syndrome; BMI, body mass index; DBP, diastolic blood pressure; eGFR, estimated glomerular filtration rate; L-eGFR, Low-eGFR; M-eGFR, Medium-eGFR; H-eGFR, High-eGFR; HbA1c, hemoglobin A1c; HDL-C, high-density lipoprotein cholesterol; HR, heart rate; hsCRP, high-sensitivity C-reactive protein; LDL-C, low-density lipoprotein cholesterol; LVEF, left ventricular ejection fraction; MI, myocardial infarction; NSTEMI, non-ST-segment elevation myocardial infarction; NT-proBNP, N-terminal pro-brain natriuretic peptide; SBP, systolic blood pressure; STEMI, ST-segment elevation myocardial infarction; TC, total cholesterol; TG, triglyceride; TIA, transient ischemic attack. The asterisk “*” indicates statistical significance compared to the other two groups based on post-hoc pairwise comparisons with Bonferroni correction.
Over a median follow-up of 63 (44–79) months, 44 patients were lost to follow-up. There were no significant differences in demographic characteristics, traditional cardiovascular risk factors, or renal function between the follow-up and lost populations (Supplementary Table 1). Out of 507 follow-up patients, 247 individuals developed MACE, who had a higher incidence of smoking, prior myocardial infarction, atrial fibrillation, and previous stroke/TIA. The patients in the MACE group had decreased renal function (Supplementary Table 2).
As shown in Fig. 2, Kaplan Meier curves indicated that long-term clinical
outcomes varied among groups (Log-rank p
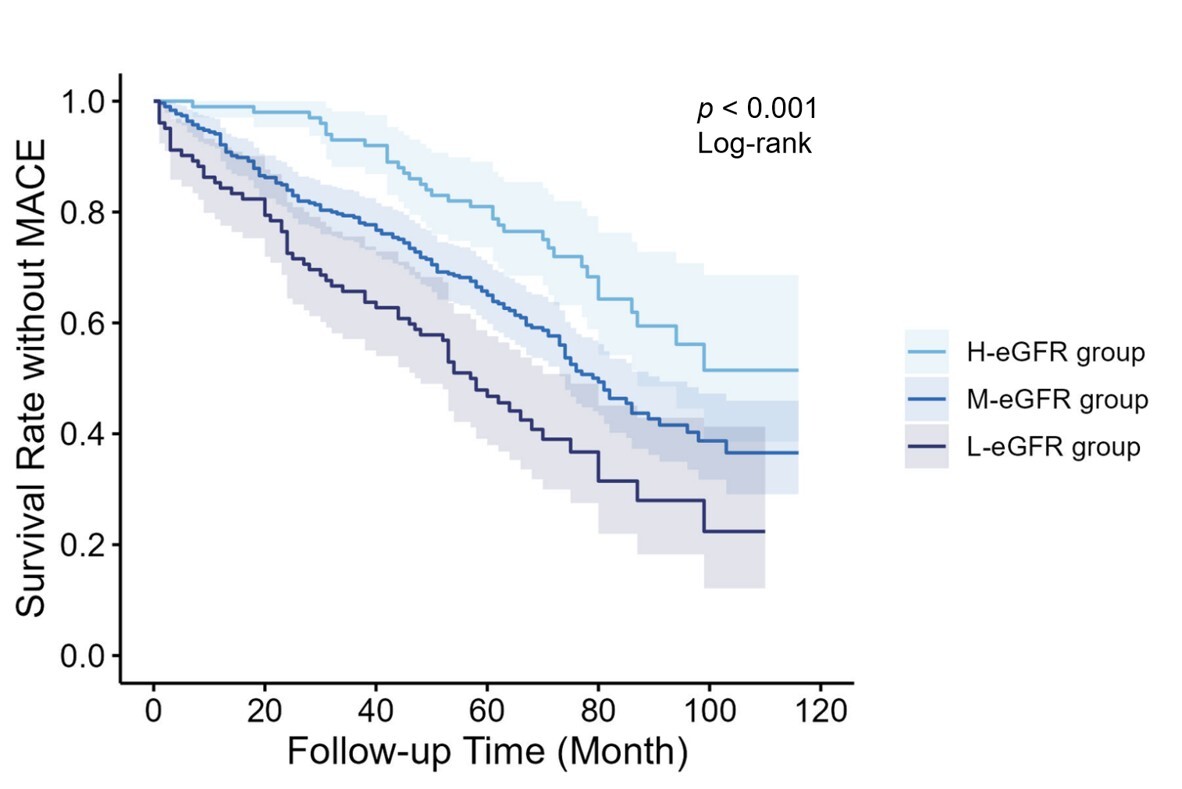 Fig. 2.
Kaplan Meier survival curves for different groups. eGFR, estimated glomerular filtration rate; MACE, major adverse cardiovascular events.
After adjustment in several models in RCS, eGFR did not show a nonlinear correlation with long-term MACE (Supplementary Fig. 1). For a more intuitive clinical risk stratification, the eGFR was converted into a categorical variable for subsequent analysis.
Cox regression analysis models were established to explore predictors for MACE (Table 2). Univariate Cox analysis showed that age, higher uric acid levels, reduced eGFR levels and left ventricular ejection fraction (LVEF) were associated with an increased risk of long-term MACE. After adjustment for gender, age, BMI, albumin and uric acid levels, lower eGFR persisted as an independent risk factor. Compared with the M-eGFR group, L-eGFR was an independent predictor for long-term MACE (hazard ratio (HR) 1.542, 95% confidence interval (CI): 1.104–2.155, p = 0.011). Conversely, H-eGFR showed a protective effect (HR 0.643, 95% CI: 0.438–0.943, p = 0.024).
| Variables | HR | 95% CI | p value | |
| Univariate | ||||
| Age | 1.074 | (1.017–1.134) | 0.010 | |
| Gender | 1.052 | (0.812–1.363) | 0.700 | |
| BMI | 1.013 | (0.974–1.054) | 0.510 | |
| Hypertension | 1.093 | (0.789–1.514) | 0.593 | |
| Diabetes mellitus | 1.264 | (0.979–1.632) | 0.072 | |
| Smoke | 1.252 | (0.974–1.609) | 0.080 | |
| HR | 1.008 | (0.996–1.019) | 0.197 | |
| SBP | 1.005 | (0.999–1.012) | 0.110 | |
| Albumin | 0.975 | (0.946–1.004) | 0.095 | |
| HDL-C | 0.701 | (0.463–1.060) | 0.092 | |
| LDL-C | 0.996 | (0.849–1.169) | 0.963 | |
| Uric acid | 1.003 | (1.001–1.004) | ||
| eGFR | 0.987 | (0.982–0.993) | ||
| HbA1c | 1.090 | (0.972–1.223) | 0.141 | |
| LVEF | 0.964 | (0.950–0.977) | ||
| M-eGFR group | Reference | |||
| L-eGFR group | 1.729 | (1.287–2.322) | ||
| H-eGFR group | 0.579 | (0.399–0.840) | 0.004 | |
| Multivariate | ||||
| Model 1 | ||||
| eGFR | 0.988 | (0.982–0.993) | ||
| M-eGFR group | Reference | |||
| L-eGFR group | 1.767 | (1.304–2.396) | ||
| H-eGFR group | 0.601 | (0.413–0.876) | 0.008 | |
| Model 2 | ||||
| eGFR | 0.991 | (0.985–0.997) | 0.006 | |
| M-eGFR group | Reference | |||
| L-eGFR group | 1.542 | (1.104–2.155) | 0.011 | |
| H-eGFR group | 0.643 | (0.438–0.943) | 0.024 | |
Model 1: adjusted for age, gender and BMI; Model 2: adjusted for model 1 plus albumin and uric acid. HR, hazard ratio; CI, confidence interval.
Individuals were grouped based on gender, BMI (
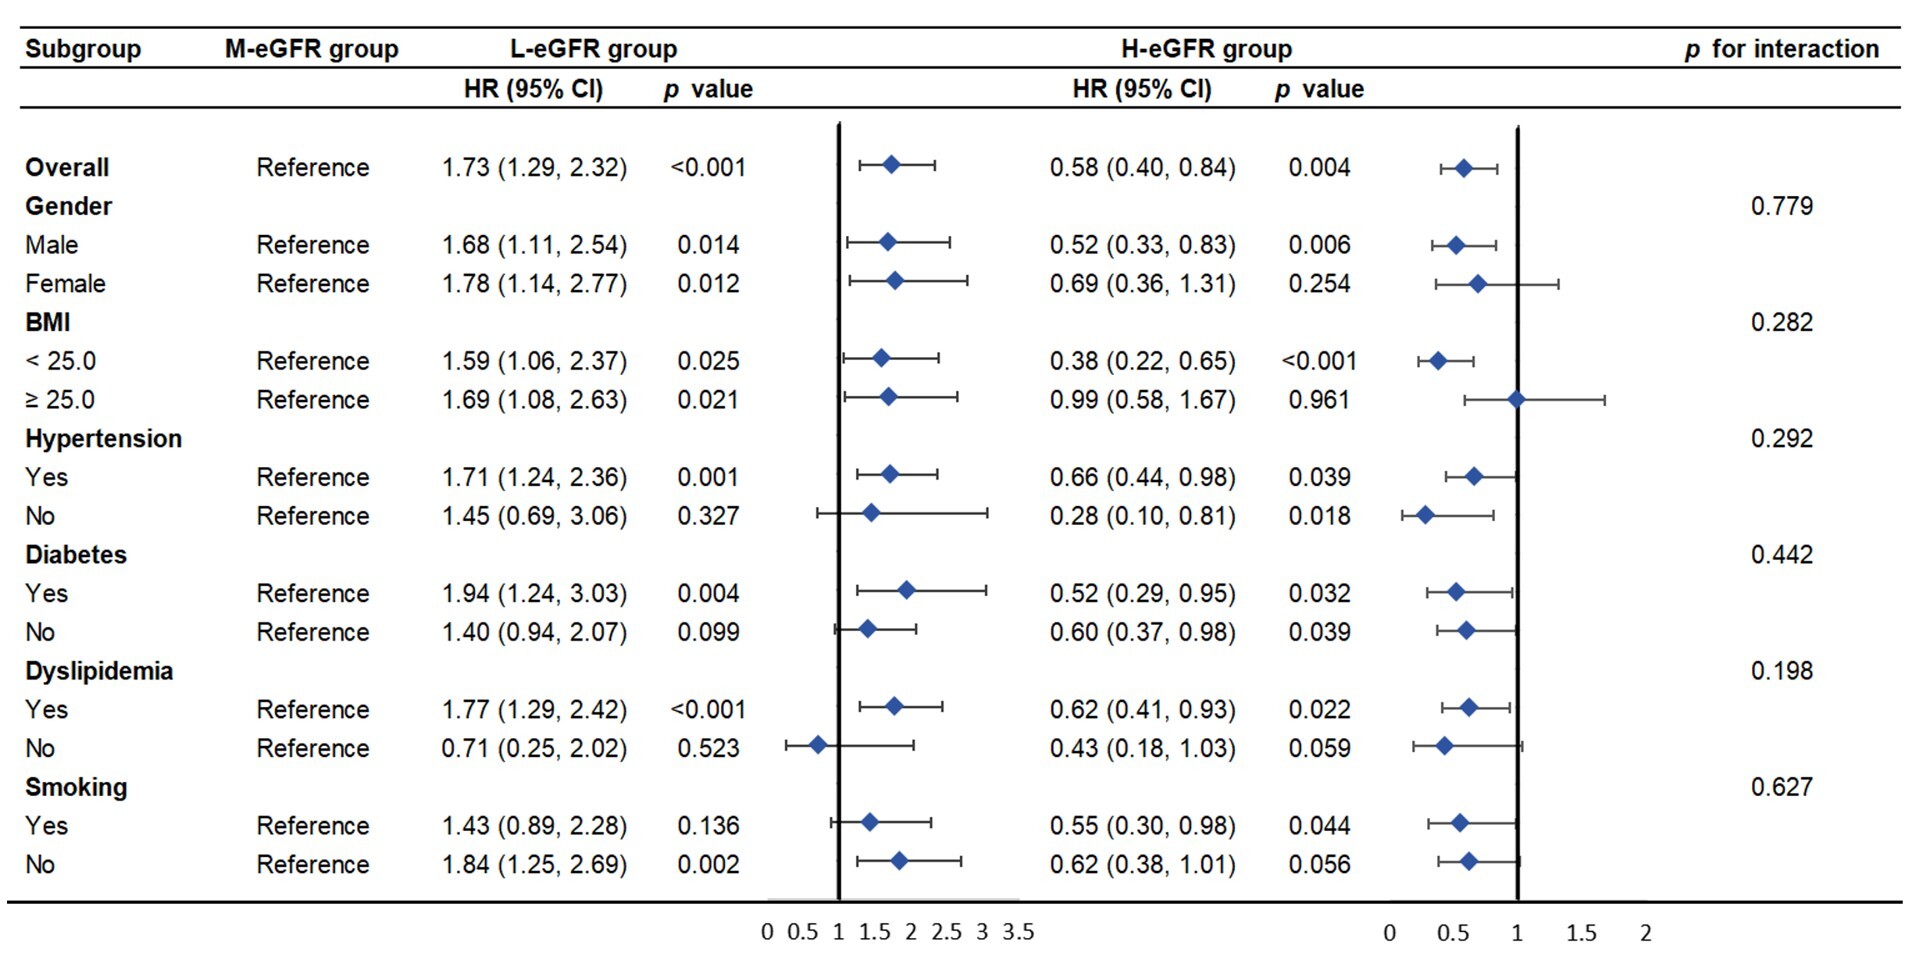 Fig. 3.
Subgroup analysis of the association between eGFR and MACE among older participants with ACS.
Sensitivity analysis was performed using two distinct eGFR categorizations.
First, patients were stratified by eGFR tertiles (T1 group:
These analyses support a linear trend between eGFR and MACE, and further suggest a potential plateau in the protective effect at higher eGFR levels, which is also reflected in the RCS analysis.
Advancing age is an important predictor of adverse outcomes following ACS [20].
However, large-scale randomized controlled trials mostly excluded the elderly
population
In recent years, eGFR has emerged as a predictor of cardiovascular risk in
different populations. Based on the data of the UK Biobank, Lees et al.
[21] reported that the incidence of cardiovascular events gradually increased
with the decline of eGFR. A Chinese cohort study of 28,187 individuals yielded
similar conclusions [22]. In patients with ACS, reduced eGFR predicts not only
the risk of in-hospital death [23], but also adverse long-term outcomes [24, 25].
Nevertheless, there is limited data supporting eGFR as a predictor of
cardiovascular outcome in older populations, especially those over 80 years. Our
study, including more than 550 ACS patients aged
Recently, renal hyperfiltration has also shown predictive value for adverse
clinical outcomes in several studies, which might be related to the activation of
the renin-angiotensin-aldosterone system and the increased activity of the
sympathetic nervous system [27]. Patients with type 2 diabetes and an eGFR
In our study, the L-eGFR and H-eGFR groups were defined by the 20th and 80th percentiles of the eGFR levels. Contrary to prior reports, the H-eGFR group which represented patients with renal hyperfiltration, did not show the same effect. Instead, our data revealed an association between H-eGFR and a reduced risk of MACE in the very elderly ACS patients. This seemingly paradoxical finding could be explained by several factors specific to our study population. First, the eGFR calculated by MDRD equation depended on serum creatinine concentration, which might be lower due to the decrease in muscle mass in the elderly [31]. Considering that the muscle mass of males is generally higher than that of females, there is reason to doubt that patients in the M-eGFR and H-eGFR groups, whose proportion of males was higher than that of the L-eGFR group, had better overall condition and lower risk of frailty. Additionally, given the physiological decline in renal function associated with aging, the cut-off for ‘high’ eGFR in our study may merely represent the upper end of the normal range for younger populations, rather than a truly pathological hyperfiltration state. Furthermore, our study specifically focused on a very elderly ACS population, in which survival bias is likely to be a significant factor. The higher eGFR may not represent a pathological state but rather indicate greater renal functional reserve. Lastly, the follow-up time of this study was considerably longer. For example, the hypertension in the very elderly (HYVET) trial reported a U-shaped relationship between eGFR and later cardiovascular events and mortality, which followed participants for a mean of only 2.1 years [32]. Our longer follow-up may have been necessary to uncover the distinct long-term prognostic role of high eGFR in this population. Therefore, the relationship between renal hyperfiltration and prognosis of advanced-age ACS patients remains unclear and further investigations into the underlying mechanisms are needed.
Our study has several limitations. First, as a single-center, retrospective observational study conducted in China with a relatively small sample size, our findings may lack generalizability to broader elderly ACS populations, and causality between eGFR and MACE cannot be inferred. Second, the lack of dynamic eGFR monitoring during follow-up is a constraint. Relying solely on baseline eGFR measurements to predict long-term prognosis is inherently limited. Third, commonly used cardiovascular medications, such as antiplatelet agents, statins, and renin-angiotensin-aldosterone system inhibitors, can influence both renal function and cardiovascular outcomes. However, accurate data on the use of medications were unavailable, as patients or family members could not provide specific details concerning their treatment. Fourth, while malnutrition is highly prevalent in the very oldest, our assessment was restricted to BMI and albumin levels, lacking more comprehensive nutritional indicators. Finally, the MDRD formula calculated eGFR based on serum creatinine, which is influenced by muscle mass and dietary protein intake in the elderly. Moreover, since the MDRD formula was primarily derived from populations with a mean age under 70 years, its application in our study cohort may have systematically underestimated the true glomerular filtration rate.
Reduced eGFR levels were independently associated with an increased risk for long-term MACE in advanced-age patients with ACS, implying that measurement of eGFR at admission may serve as a prognostic tool. Moreover, the H-eGFR group showed a better prognosis. Therefore, further investigations are warranted to investigate the underlying mechanism between renal hyperfiltration and prognosis in elderly ACS patients to help guide us to improve clinical outcomes through treatments targeting renal function.
The data that support the findings of this study are not openly available due to reasons of sensitivity and are available from the corresponding author upon reasonable request.
YFL, TTS and AMD designed the research study. YFL and TTS performed the research and analyzed the data. YFL wrote the manuscript. YZG, XRH and WZ provided help and advice on data collection. ZZL, NQL and JXL made substantial contributions to analysis and interpretation of data, and reviewed it critically for important intellectual content. AMD reviewed and edited the final manuscript. All authors contributed to editorial changes in the manuscript. All authors read and approved the final manuscript. All authors have participated sufficiently in the work and agreed to be accountable for all aspects of the work.
The study was conducted in accordance with the Declaration of Helsinki and approved by the Medical Ethics Committee of Fuwai Hospital [Approval Number: 2021-1461]. Given that the research involved only analysis of existing medical records without additional patient risk, and all data were anonymized, the requirement for written informed consent was formally waived by the Institutional Review Board.
We gratefully acknowledge all the participants and colleagues who took part in the study for their valuable contributions.
This research was funded by grants from the National Key Research and Development Program of China [grant number 2022YFC3602400, 2022YFC3602405], the Key Projects of the National Health Commission of China [grant number 2020-ZD13], and the Projects of the National Health Commission [grant number 2020-ZYB03].
The authors declare no conflict of interest.
Supplementary material associated with this article can be found, in the online version, at https://doi.org/10.31083/RCM45446.
References
Publisher’s Note: IMR Press stays neutral with regard to jurisdictional claims in published maps and institutional affiliations.