


 , Danchun Hu 1,†, Baoxin Yan 1,2, Jinhao Chen 1,2, Weiwen Li 1,2, Ying Lin 1,2, Run Lin 3, Junjun Ye 1,2, Jiating Su 1,2, Shuangshuang Tong 1,2, Xiaojun Huang 1, Bin Xie 1, Xiaodong Zhuang 4, Jianying Chen 5,*
 , Jilin Li 1,*
1 Department of Cardiology, Second Affiliated Hospital of Shantou University Medical College, 515000 Shantou, Guangdong, China
2 Shantou University Medical College, 515041 Shantou, Guangdong, China
3 Center for Cardiovascular Diseases, Meizhou People's Hospital, Meizhou Academy of Medical Sciences, 514031 Meizhou, Guangdong, China
4 Department of Cardiology, The First Affiliated Hospital of Sun Yat-Sen University, 510080 Guangzhou, Guangdong, China
5 Department of Cardiology, Affiliated Hospital of Guangdong Medical University, 524001 Zhanjiang, Guangdong, China
†These authors contributed equally.
Abstract
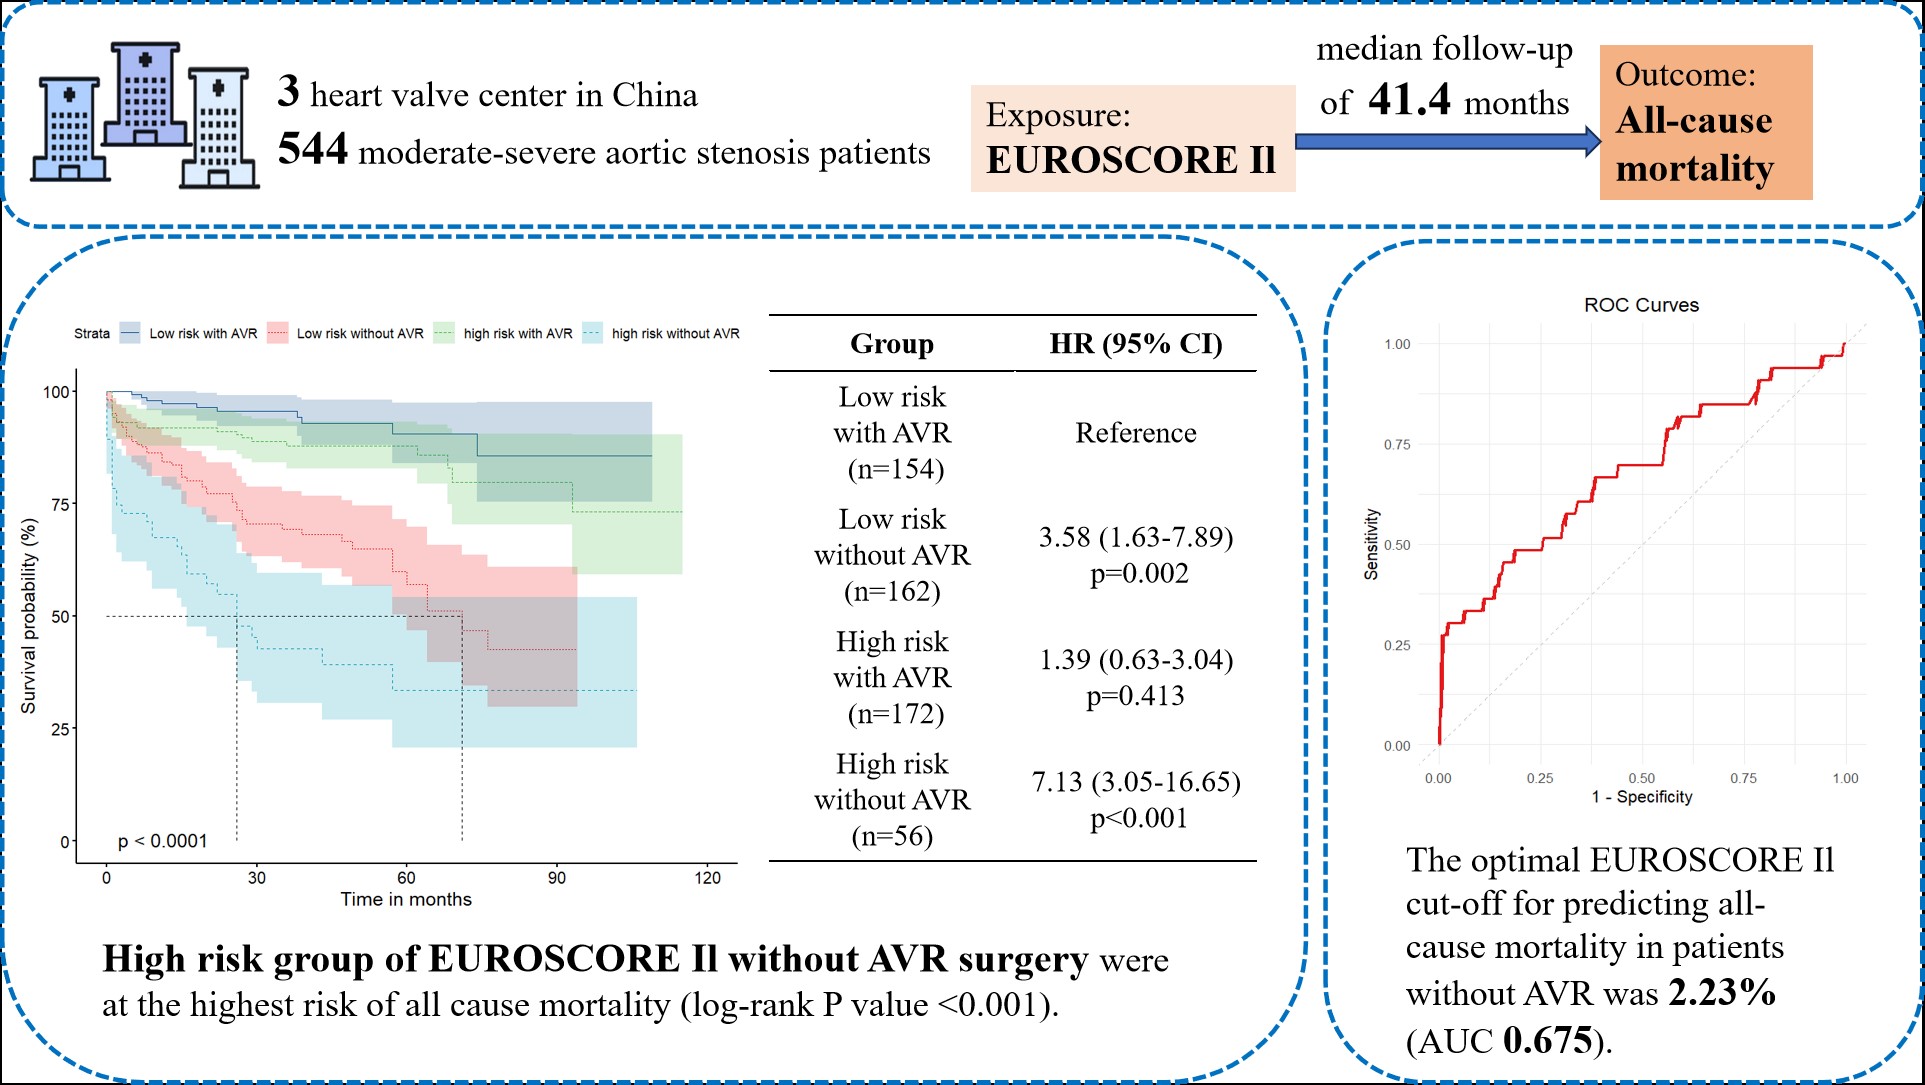
Aortic stenosis (AS) is a prevalent heart valve disease; however, morbidity and mortality are significantly reduced by aortic valve replacement (AVR). The European System for Cardiac Operative Risk Evaluation II (EuroSCORE II) is used to assess perioperative mortality risk in patients with severe AS undergoing AVR. This study aimed to evaluate the prognostic value of EuroSCORE II for long-term all-cause mortality in Chinese patients with moderate-to-severe AS, determine whether AVR affects this prognostic value, and identify the best cut-off value for low-risk EuroSCORE II patients without AVR.
A total of 544 patients with moderate-to-severe AS were divided into four groups based on the associated EuroSCORE II value (cut-off of 4%) and whether the patient had previously undergone AVR. Kaplan–Meier survival analysis, Cox regression, and subgroup analyses were performed to assess the association between EuroSCORE II and all-cause mortality. A receiver operating characteristic (ROC) analysis was used to determine the optimal cut-off value for predicting mortality.
A total of 132 (24.3%) participants reached the endpoint during a median follow-up of 3.45 years. Patients with a EuroSCORE II ≥4% who did not undergo AVR had significantly higher all-cause mortality rates compared to other groups (55.4% vs. 6.5%, 32.7%, and 13.4%; p < 0.001). Kaplan–Meier analysis confirmed these findings (log-rank test, p < 0.001). Cox regression showed a 6.89-fold increased risk in patients without AVR and higher EuroSCORE II values (hazard ratio (HR), 6.891; 95% confidence interval (CI), 3.083–15.401; p < 0.001). The optimal cut-off value for predicting mortality in patients without AVR was 2.23% (area under the curve (AUC), 0.675).
Both EuroSCORE II (cut-off value of 4%) and AVR status were independently associated with the long-term prognosis of patients with moderate-to-severe AS.
NCT06069232, https://clinicaltrials.gov/study/NCT06069232.
Graphical Abstract
Keywords
- aortic valve stenosis
- EuroSCORE II
- all-cause mortality
- aortic valve replacement
Aortic stenosis (AS) is the most prevalent heart valve disease, causing significant morbidity and mortality in the elderly due to aging of the population [1, 2, 3]. Its prevalence exceeds 10% in individuals aged over 65 in US and European populations [4, 5, 6], although the prevalence in China may be lower, according to the results of a single-centre retrospective study of the echocardiographic data of 287,556 patients [7]. The initial stages of the disease are characterized by the progression of valvular lesions, involving endothelial cell damage, infiltration with lipids and macrophages, lipid oxidation, and subsequent fibrosis and calcification, which ultimately leads to obstruction of the aortic valve [6, 8].
To date, due to the lack of specific medications for treating or preventing the progression of AS, aortic valve replacement (AVR) which includes surgical aortic valve replacement (SAVR) and transcatheter aortic valve implantation (TAVI) is recommended for patients with severe symptomatic disease [9, 10].
EuroSCORE II is a logistic risk model developed in 2011 from 22,381 patients in 22 European centers and weights 18 peri-operative variables (age, renal function, cardiac status, etc.) [11]. It was originally developed for perioperative risk stratification in cardiac surgery [11, 12], but had also been validated for predicting in-hospital mortality and short-to-medium-term mortality after AVR [13], coronary artery bypass grafting (CABG) [14]. However, there are limited studies assessing the long-term prognostic value of EuroSCORE II for patients with moderate-to-severe AS, regardless of whether they undergo AVR (SAVR or transcatheter aortic valve replacement (TAVR)), especially in Chinese patients.
This study aimed to explore the relationships between EuroSCORE II, AVR status, and all-cause mortality in patients with moderate-to-severe AS, and to identify the optimal EuroSCORE II cut-off value for prognostic use in patients without AVR.
This retrospective study included 1033 patients with moderate-to-severe AS from three heart valve centers (Second Affiliated Hospital of Shantou University Medical College, First Affiliated Hospital of Sun Yat-sen University, and Affiliated Hospital of Guangdong Medical University) between January 2014 and July 2023. The data were derived from the ARISTOTLE database. The study followed the Declaration of Helsinki and was approved by the Ethics Review Committee. Inclusion criteria were: (1) initial diagnosis of moderate-to-severe AS without severe dysfunction or malignancy of other organs; (2) no prior AVR history. Exclusion criterion was missing baseline data.
Patients were divided into high-risk and low-risk groups using a EuroSCORE II cut-off value of 4%, following the 2017 ESC/EACTS guidelines [15]. Four groups were created based on AVR and EuroSCORE II. The study was approved by the Ethics Review Committee of Shantou University Medical College, following the Declaration of Helsinki. Data were collected from 3 hospital records, and follow-up was via visits or calls. Verbal consent was obtained, approved by the Ethics Review Committee (ERB number: 2024-23).
Patient characteristics (age, sex, height, body mass, smoking, and alcohol
history) and preoperative comorbidities (hypertension, diabetes, extra-cardiac
artery lesions, stroke, etc.) were validated by medical professionals using blood
tests or imaging. AVR surgery details were obtained from electronic records or
interviews. Laboratory tests within 24 hours of admission included (white blood
cell (WBC), hemoglobin (Hb), creatinine, uric acid, cholesterol levels, etc.).
Medication use (anti-platelet drugs, statins,
Transthoracic echocardiography followed American Society of Echocardiography
guidelines [12]. AS severity was defined as [3, 4]: (1) moderate AS: 1 cm2
The primary endpoint was all-cause mortality from the time of the diagnosis. The secondary endpoints were cardiovascular-related mortality and aortic stenosis-related mortality. The duration of follow-up was date of AS diagnosis to date of death or end of follow-up. And the trained medical staff collected the information through telephone contact with the participants or their families which was completed in July 2023.
Continuous data were tested for normality using the Shapiro-Wilk method and
presented as mean
A total of 963 participants met the inclusion criteria. After excluding 419
patients without EuroSCORE II or baseline data, 544 participants (300 males, 244
females; mean age 66.00 years-old (interquartile range 57.00 to 74.00) were
included in the study (Fig. 1, Table 1). Between the included (n = 544) and
excluded (n = 489) cohorts, the difference was observed in the primary exposure,
EuroSCORE II, potentially due to the extent of missing data. However, key
covariates such as hypertension, diabetes, and chronic obstructive pulmonary
disease (COPD) showed no significant differences (p
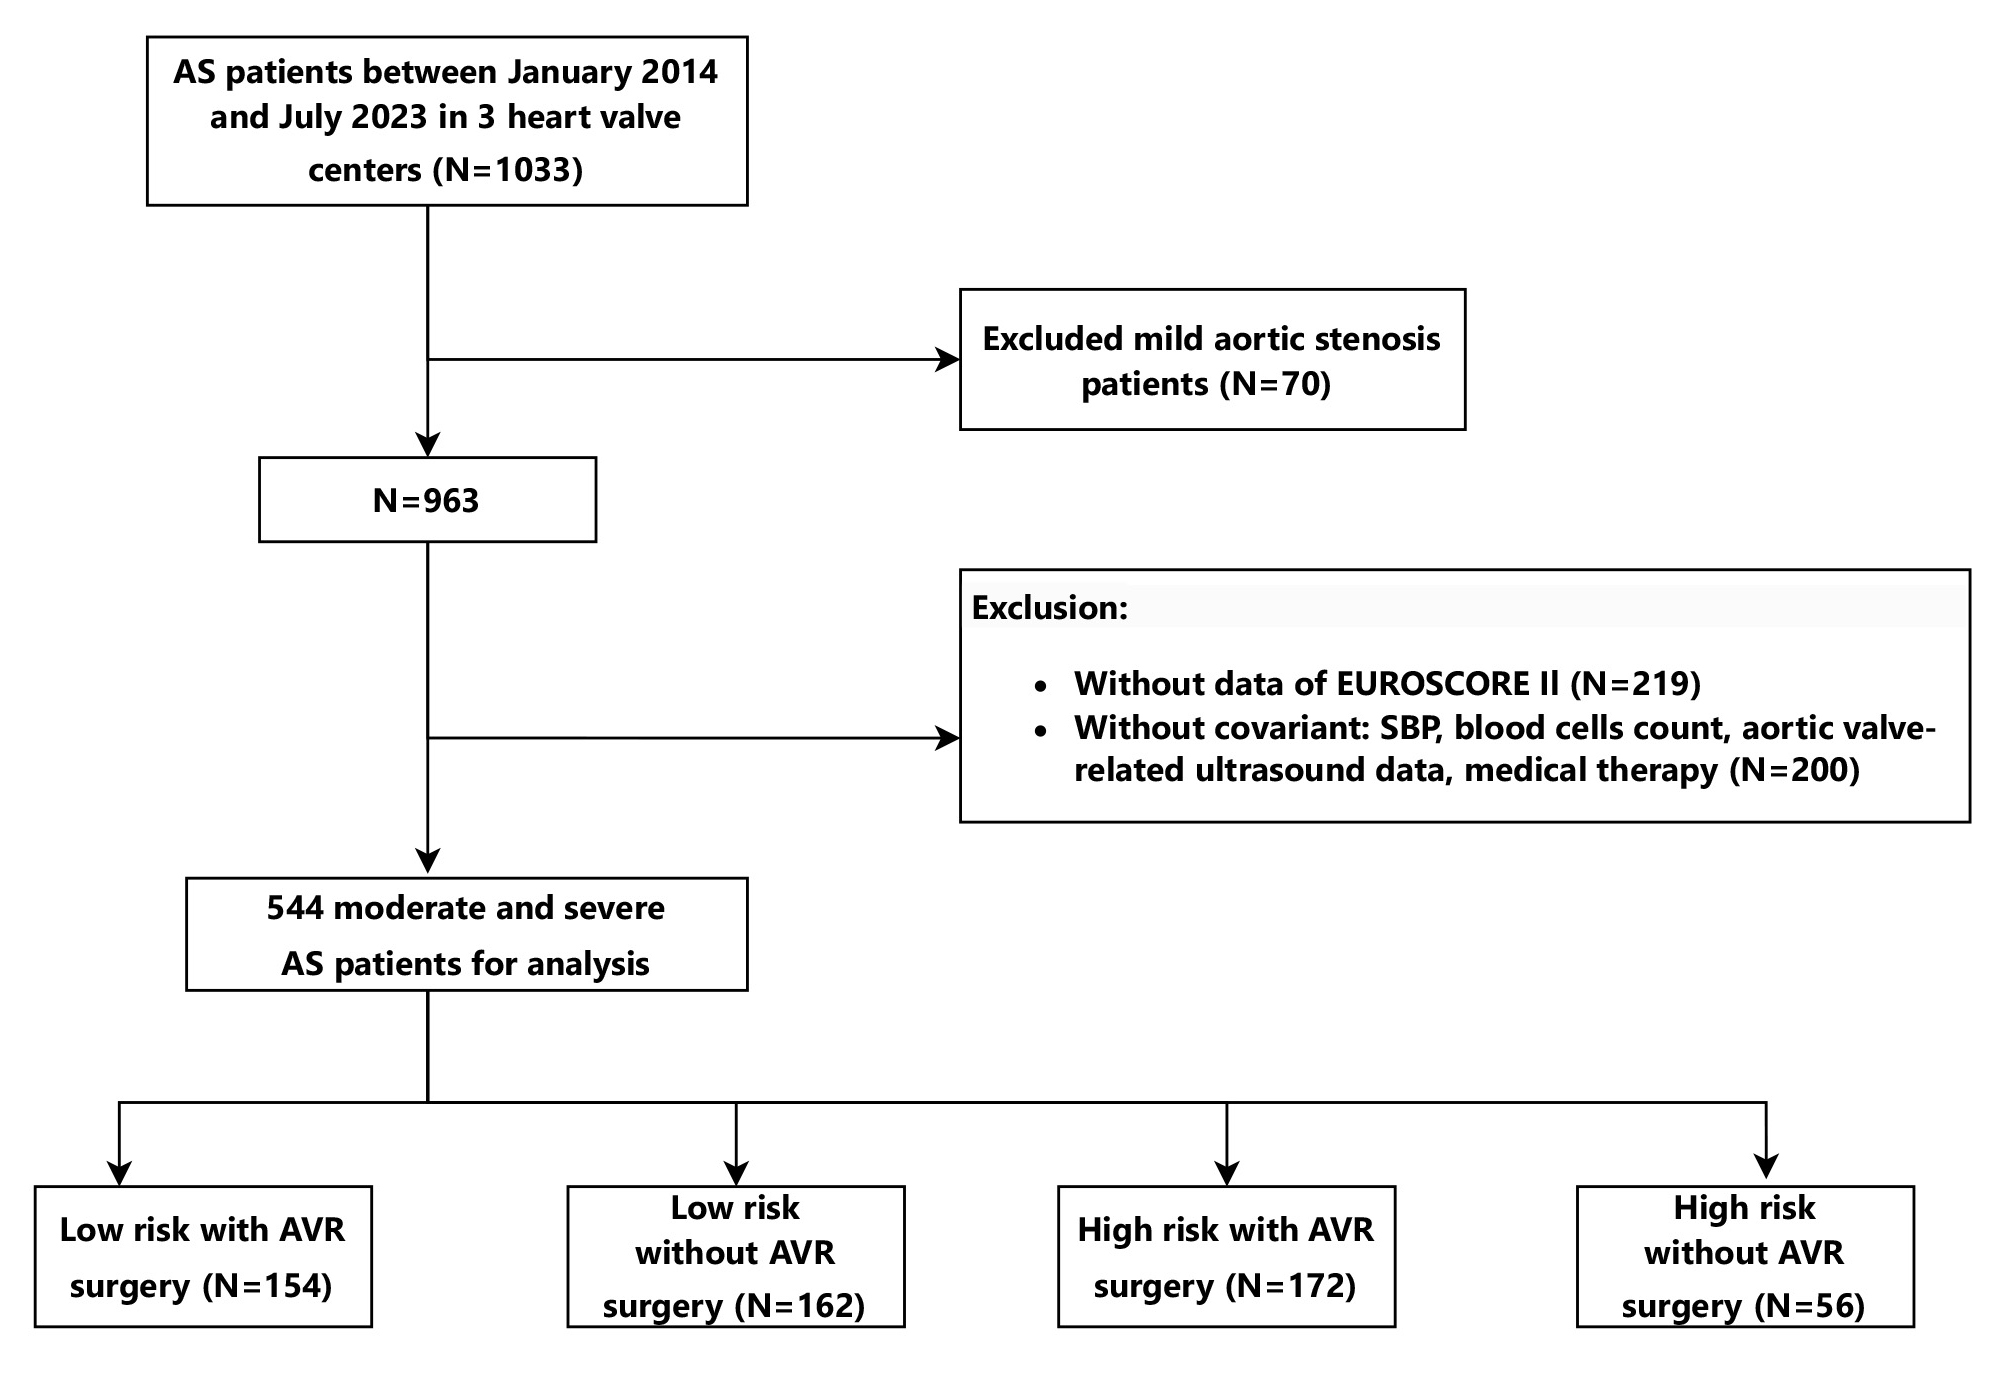 Fig. 1.
Flow diagram describing the study sample. The study was performed at three heart valve centers: the Second Affiliated Hospital of Shantou University Medical College, the First Affiliated Hospital of Sun Yat-sen University, and the Affiliated Hospital of Guangdong Medical University. Three heart valve centers are derived from a database called Aortic Valve Diseases RISk facTOr assessmenT and Prognosis modeL Construction (ARISTOTLE). 544 moderate-to-severe AS patients enrolled between January 2014 and July 2023 were allocated to four groups using the standard of cut-off value of 4% of EuroSCORE II dividing high-risk or low-risk and with/without AVR. AS, aortic valve stenosis; AVR, aortic valve replacement.
| Total | Low risk with AVR | Low risk without AVR | High risk with AVR | High risk without AVR | p value | |||
| (N = 544) | (N = 154) | (N = 162) | (N = 172) | (N = 56) | ||||
| EuroSCORE II | 3.35 (1.72–5.34) | 2.38 (1.31–3.30) | 1.72 (1.12–2.69) | 5.95 (4.82–8.99) | 5.34 (4.46–6.97) | |||
| All-cause mortality (%) | 117 (21.5) | 10 (6.5) | 53 (32.7) | 23 (13.4) | 31 (55.4) | |||
| General characteristics | ||||||||
| Hospital (%) | ||||||||
| A | 29 (5.33) | 9 (5.84) | 8 (4.94) | 5 (2.91) | 7 (12.50) | 0.101 | ||
| B | 454 (83.46) | 124 (80.52) | 138 (85.19) | 146 (84.88) | 46 (82.14) | |||
| C | 61 (11.21) | 21 (13.64) | 16 (9.88) | 21 (12.21) | 3 (5.36) | |||
| Age (years) | 66.00 (57.00–74.00) | 61.50 (54.00–67.75) | 69.00 (60.00–76.00) | 64.00 (56.00–70.00) | 78.00 (66.75–83.25) | |||
| Gender (%) | ||||||||
| Male | 300 (55.15) | 105 (68.18) | 92 (56.79) | 79 (45.93) | 24 (42.86) | |||
| Female | 244 (44.85) | 49 (31.82) | 70 (43.21) | 93 (54.07) | 32 (57.14) | |||
| SBP (mmHg) | 126.00 (111.00–140.00) | 122.00 (112.00–135.00) | 134.50 (119.00–149.00) | 120.00 (106.75–135.00) | 127.50 (112.00–148.75) | |||
| Weight (kg) | 58.00 (50.00–65.00) | 61.00 (52.00–67.00) | 59.00 (53.00–65.00) | 55.00 (48.22–62.78) | 53.50 (47.75–62.25) | |||
| State assessment | ||||||||
| Status at the first clinic visit (%) | ||||||||
| Elective | 518 (95.22) | 154 (100.00) | 162 (100.00) | 159 (92.44) | 43 (76.79) | |||
| Urgent | 26 (4.78) | 0 (0.00) | 0 (0.00) | 13 (7.56) | 13 (23.21) | |||
| The urgency of the surgery (%) | ||||||||
| 0 | 264 (48.53) | 70 (45.45) | 146 (90.12) | 6 (3.49) | 42 (75.00) | |||
| Non-CABG | 276 (50.74) | 84 (54.55) | 16 (9.88) | 164 (95.35) | 12 (21.43) | |||
| 2 | 3 (0.55) | 0 (0.00) | 0 (0.00) | 2 (1.16) | 1 (1.79) | |||
| 3+ | 1 (0.18) | 0 (0.00) | 0 (0.00) | 0 (0.00) | 1 (1.79) | |||
| NYHA of first visit (%) | ||||||||
| I | 129 (23.71) | 40 (25.97) | 62 (38.27) | 13 (7.56) | 14 (25.00) | |||
| II | 176 (32.35) | 64 (41.56) | 59 (36.42) | 44 (25.58) | 9 (16.07) | |||
| III | 194 (35.66) | 46 (29.87) | 36 (22.22) | 92 (53.49) | 20 (35.71) | |||
| IV | 45 (8.27) | 4 (2.60) | 5 (3.09) | 23 (13.37) | 13 (23.21) | |||
| Comorbidities | ||||||||
| Hypertension (%) | 213 (39.15) | 42 (27.27) | 87 (53.70) | 51 (29.65) | 33 (58.93) | |||
| Rheumatic heart disease (%) | 92 (16.91) | 25 (16.23) | 26 (16.05) | 36 (20.93) | 5 (8.93) | 0.199 | ||
| Coronary disease (%) | 113 (20.77) | 31 (20.13) | 43 (26.54) | 29 (16.86) | 10 (17.86) | 0.157 | ||
| Previous major cardiac surgery (%) | 210 (38.60) | 60 (38.96) | 0 (0.00) | 142 (82.56) | 8 (14.29) | |||
| Atrial fibrillation (%) | 88 (16.18) | 17 (11.04) | 27 (16.67) | 28 (16.28) | 16 (28.57) | 0.025 | ||
| Stroke (%) | 36 (6.62) | 6 (3.90) | 18 (11.11) | 6 (3.49) | 6 (10.71) | 0.010 | ||
| CKD (%) | 33 (6.07) | 4 (2.60) | 11 (6.79) | 10 (5.81) | 8 (14.29) | 0.018 | ||
| Extra-cardiac artery lesions (%) | 33 (6.07) | 1 (0.65) | 12 (7.41) | 9 (5.23) | 11 (19.64) | |||
| COPD (%) | 22 (4.04) | 4 (2.60) | 8 (4.94) | 3 (1.74) | 7 (12.50) | 0.003 | ||
| Diabetes mellitus (%) | 82 (15.07) | 18 (11.69) | 33 (20.37) | 17 (9.88) | 14 (25.00) | 0.005 | ||
| History of gout (%) | 20 (3.68) | 1 (0.65) | 10 (6.17) | 3 (1.74) | 6 (10.71) | 0.001 | ||
| History of smoking (%) | 149 (27.39) | 50 (32.47) | 43 (26.54) | 42 (24.42) | 14 (25.00) | 0.395 | ||
| History of drinking (%) | 84 (15.44) | 26 (16.88) | 25 (15.43) | 27 (15.70) | 6 (10.71) | 0.750 | ||
| Laboratory parameters | ||||||||
| Hb (g/L) | 126.00 (113.00–139.00) | 132.50 (119.00–143.75) | 126.00 (114.00–138.75) | 126.00 (109.00–138.00) | 116.00 (104.00–125.00) | |||
| WBC (109/L) | 6.96 (5.58–8.49) | 7.03 (5.76–8.27) | 6.86 (5.54–8.53) | 6.93 (5.56–8.67) | 6.86 (5.59–8.63) | 0.958 | ||
| TC (mmol/L) | 4.53 (3.80–5.10) | 4.53 (4.00–5.30) | 4.53 (3.82–5.40) | 4.53 (3.70–4.70) | 4.14 (3.42–4.62) | 0.010 | ||
| HDL-C (mmol/L) | 1.14 (0.95–1.28) | 1.14 (0.99–1.27) | 1.14 (0.94–1.36) | 1.14 (0.95–1.19) | 1.13 (0.93–1.32) | 0.767 | ||
| LDL-C (mmol/L) | 2.87 (2.34–3.26) | 2.87 (2.45–3.45) | 2.87 (2.38–3.44) | 2.87 (2.33–2.89) | 2.57 (2.01–3.02) | 0.013 | ||
| TG (mmol/L) | 1.23 (0.86–1.40) | 1.27 (0.91–1.43) | 1.21 (0.84–1.53) | 1.27 (0.84–1.27) | 1.06 (0.77–1.27) | 0.024 | ||
| Cr (µmol/L) | 82.00 (69.00–100.00) | 78.90 (68.00–91.97) | 81.00 (69.00–98.50) | 83.50 (69.00–104.25) | 98.55 (81.25–124.25) | |||
| eGFR (mL/min/1.73 m2) | 59.30 (44.53–77.61) | 71.89 (57.67–90.22) | 58.87 (46.81–74.62) | 56.86 (42.85–74.01) | 39.78 (30.03–47.90) | |||
| UREA (mmol/L) | 6.30 (4.90–8.00) | 6.20 (4.82–7.15) | 6.15 (4.80–7.68) | 6.45 (4.90–8.33) | 7.66 (5.95–10.57) | 0.001 | ||
| TBIL (µmol/L) | 12.80 (9.70–18.20) | 12.50 (9.72–16.30) | 11.50 (8.83–15.35) | 13.80 (10.50–19.73) | 13.55 (10.45–23.08) | 0.004 | ||
| Blood glucose (mmol/L) | 5.00 (4.40–5.80) | 4.90 (4.30–5.44) | 5.00 (4.30–5.84) | 4.90 (4.50–5.93) | 5.25 (4.70–6.16) | 0.037 | ||
| Uric acid (µmol/L) | 411.00 (325.00–494.15) | 404.35 (328.50–468.65) | 402.90 (303.50–486.75) | 416.36 (321.75–533.72) | 447.50 (359.00–511.25) | 0.104 | ||
| Elevated NT-proBNP (%) | 275 (50.55) | 64 (41.56) | 91 (56.17) | 80 (46.51) | 40 (71.43) | |||
| Troponin40 (%) | 15 (2.76) | 6 (3.90) | 2 (1.23) | 4 (2.33) | 3 (5.36) | 0.299 | ||
Continuous datasets were tested for normality using the Shapiro–Wilk method,
and the data are presented as mean
Group 1 (low risk (EuroSCORE II index
SBP, systolic blood pressure; CABG, coronary artery bypass grafting; COPD, chronic obstructive pulmonary disease; Hb, haemoglobin; eGFR, estimated glomerular filtration rate; UREA, urea nitrogen; NT-proBNP, N-Terminal pro-Brain Natriuretic Peptide; WBC, white blood cell; TC, total cholesterol; HDL-C, high-density lipoprotein-cholesterol; LDL-C, lowdensity lipoprotein-cholesterol; TG, triglyceride; Cr, creatinine; TBIL, total bilirubin; CKD, chronic kidney disease.
Participants were divided into two groups based on EuroSCORE II: low-risk
(
When divided into four groups (Group 1: low risk with AVR; Group 2: low risk
without AVR; Group 3: high risk with AVR; Group 4: high risk without AVR), Group
4 patients were older, had lower weight and higher NYHA scores, more
comorbidities (hypertension, AF, stroke, chronic kidney disease (CKD),
extra-cardiac artery lesions, COPD, diabetes), higher levels of creatinine (Cr), total bilirubin (TBIL), and
blood glucose, and lower levels of LDL-C and TG (all p
| Variables | Low risk with surgery | Low risk without surgery | High risk with surgery | High risk without surgery | p value |
| (N = 154) | (N = 162) | (N = 172) | (N = 56) | ||
| Model 1 | Reference | 5.541 (2.737–11.216) | 1.899 (0.896–4.025) | 10.058 (4.632–21.840) | |
| Model 2 | Reference | 4.211 (2.053–8.637) | 1.450 (0.673–3.125) | 8.168 (3.704–18.015) | |
| Model 3 | Reference | 4.064 (1.958–8.433) | 1.321 (0.605–2.887) | 7.342 (3.281–16.427) | |
| Model 4 | Reference | 3.492 (1.583–7.703) | 1.333 (0.605–2.936) | 6.605 (2.817–15.486) |
Further adjustment for potential confounders in Model 1–4 (Table 2). The fully
adjusted HR and 95% CI in Model 4 for groups 2–4 vs. group 1 were
3.492 (1.583–7.703), 1.333 (0.605–2.936), and 6.605 (2.817–15.486),
respectively (p
Model 1 was adjusted for smoking status, alcohol consumption status, diabetes,
atrial fibrillation, hypertension, gout, systolic blood pressure, and body mass;
Model 2 was adjusted for the parameters in model 1, with the addition of WBC,
RBC, PLT, LDLC, TG, TBIL, NTproBNP, troponin, and albumin; Model 3 was adjusted
for the parameters in model 2, plus aortic valve deformity, rheumatic heart
disease, AV-Vmax, AV-MG, the degree of AVA mitral insufficiency, and mitral
stenosis; Model 4 was adjusted for the parameters in Model 3, with the addition
of anti-platelet agent, statin, ACEI, ARB,
When divided by EuroSCORE II in patients without AVR, the high-risk group had
higher all-cause mortality than the low-risk group (p
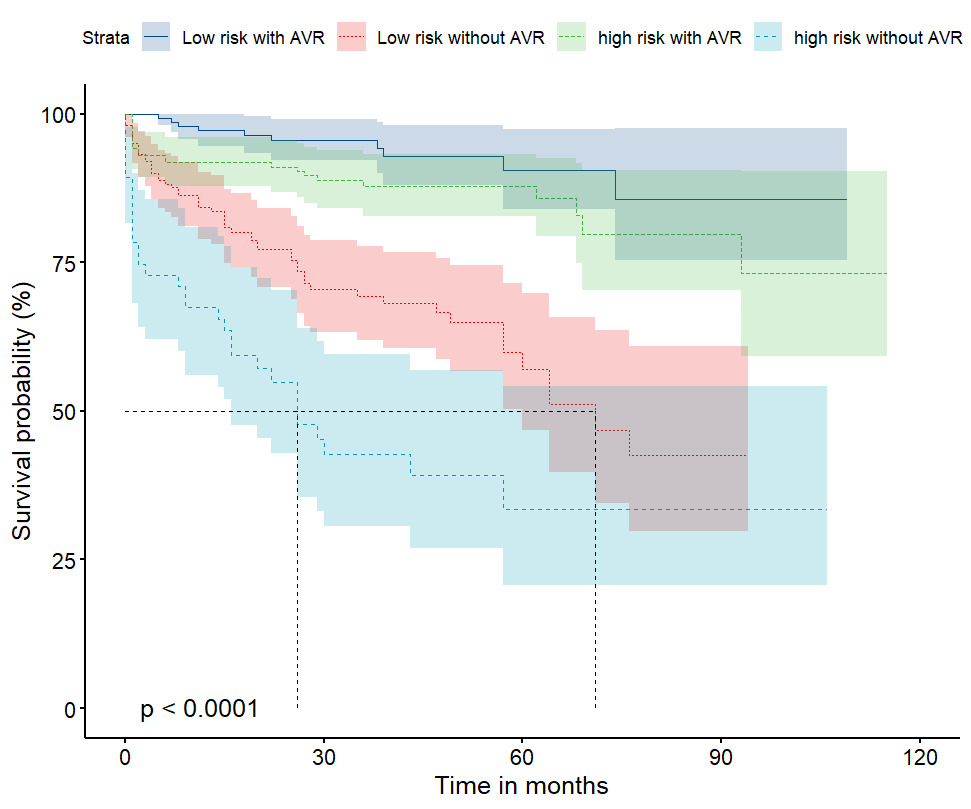 Fig. 2.
Kaplan–Meier survival curves for the participants, categorized
according to their EuroSCORE II and their AVR status (total 544 participants).
The analysis demonstrated that the participants in the group with high EuroSCORE
II and who had not undergone AVR were at the highest risk of all-cause mortality
of the four groups (log-rank p
Univariate regression analysis (Supplementary Table 4) identified age,
coronary artery disease (CAD), CKD, COPD, diabetes, AF, hypertension, albumin,
critical status, urgency of surgery, LVEF, pulmonary hypertension, statin use,
ACEI/ARB use, and insulin use as predictors of all-cause mortality, with Group 2
and Group 4 exhibiting a 5.97-fold (HR 5.966, 95% CI 3.033–11.737, p
Fig. 3 shows a subgroup analysis of all-cause mortality. In patients without
AVR, EuroSCORE II was correlated with mortality in younger (
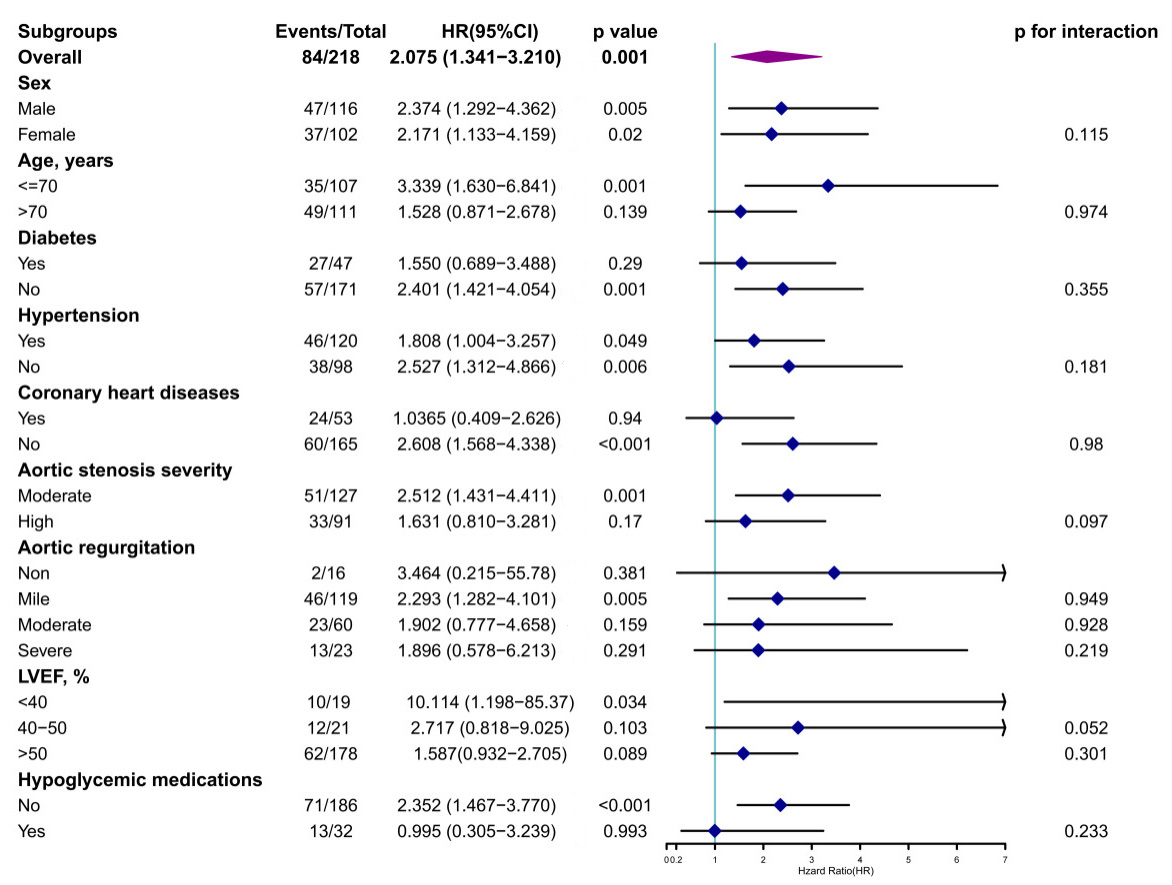 Fig. 3.
Results of the subgroup analysis of the association between
EuroSCORE II and the lack of AVR. Further subgroup analyses were performed after
the stratification of the participants according to baseline sex, age (
For the participants who had not performed AVR, the optimal cut-off value of
EuroSCORE II identified for predicting the outcome was 2.23% (AUC 0.675, 95% CI
0.609–0.74, p
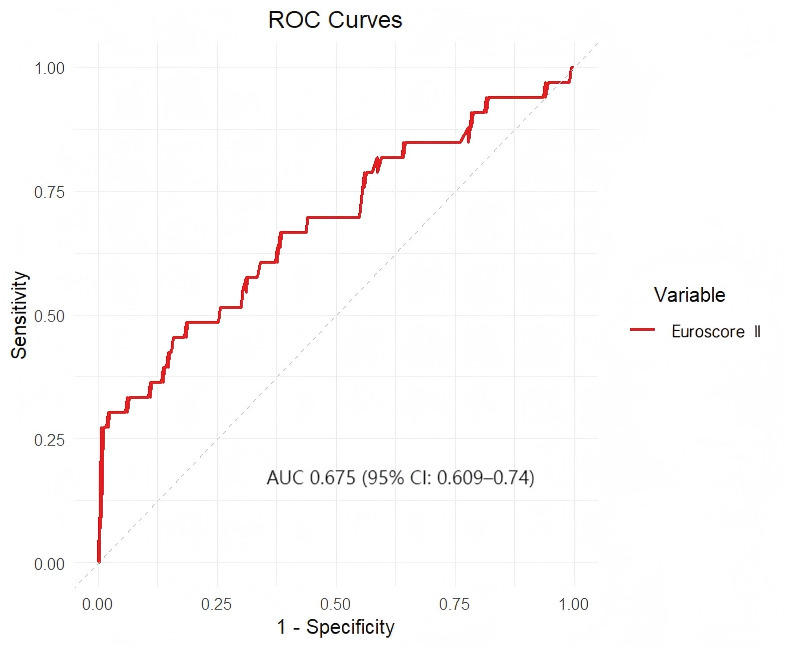 Fig. 4.
ROC curve for the use of EuroSCORE II to evaluate the prognosis of the participants who had not undergone AVR. The optimal cut-off value of EuroSCORE II identified for the prediction of the primary outcome in the participants who had not undergone AVR was 2.23%, which was associated with an AUC of 0.675 (95% CI: 0.609–0.74).
A growing body of evidence demonstrates that patients with symptomatic severe AS
have a poor prognosis if they do not undergo surgery, with a mean survival time
of
The study found that high-risk group (EuroSCORE II
It is this comprehensive physiological decline that renders patients too vulnerable to withstand the persistent hemodynamic stress of untreated severe aortic stenosis, ultimately leading to the observed extremely high mortality [18]. The pathophysiological overlap between cardiovascular risk factors and AS progression—particularly the roles of chronic inflammation, endothelial dysfunction, and calcification [19]—suggests that EuroSCORE II may be used for not only surgical risk but also underlying disease severity and systemic vascular health.
While the STS score is another widely used risk model, a meta-analysis of 22 studies involving 145,592 cardiac surgery procedures showed that the overall discriminatory ability of the EuroSCORE II is good and similar to that of the STS risk score. However, the STS risk score has shown a suboptimal calibration in some validation studies, particularly in European cardiac surgical populations [20]. Future studies directly comparing these models in Chinese patients with AS would be valuable.
In this context, our study extends the utility of EuroSCORE II beyond the
perioperative setting, demonstrating its prognostic value for long-term mortality
within the past 10 years in Chinese patients with moderate-to-severe AS,
regardless of AVR status. We found that patients in the high-risk group
(EuroSCORE II
Moreover, moderate-to-severe aortic stenosis patients with a low-risk EuroSCORE
II (
Notably, the PARTNER2 study [26] and the SURTAVI study [27] using TAVR in
low-risk patients performed by the American College of Cardiology (ACC),
including the PARTNER 3 study (using the SAPIEN-3 ultra transcatheter heart
valve) and the Evolut Low Risk Trial study (using the self-expanding Evolute R
valve) [28] showed TAVR’s non-inferiority or superiority to SAVR in short to
medium-term outcomes. After 5 years of follow-up, the PARTNER 3 study revealed
similar annual rates of cardiovascular mortality, stroke, and re-hospitalization
for both TAVR and SAVR (approximately 1%, 1%, and 3%, respectively). These
findings support recommending either procedure for low EuroSCORE II patients,
offering benefits such as shorter hospital stays and lower mortality risks [29].
Therefore, surgical or transcatheter AVR (SAVR/TAVI) is recommended for low-risk
patients to achieve a clear survival benefit, aligning with international
guidelines and providing real-world validation in a Chinese population. Our study
confirms that SAVR and TAVI have similar outcomes for moderate-to-severe AS. The
prospective NOTION trial (N = 280) showed no significant differences in 2-year
all-cause (8.0% vs. 9.8%; p = 0.54) or cardiovascular mortality (6.5%
vs. 9.1%; p = 0.40) between TAVR and SAVR [30]. Moreover, the NOTION
trial’s extended data revealed no significant all-cause mortality difference over
8 years [15]. The 2021 ESC/EACTS guidelines recommend SAVR for patients under 75,
and TAVR for those over 75, high-risk (STS-PROM or EuroSCORE II
A key validation study demonstrated EuroSCORE II’s inaccuracies in predicting mortality
for cardiac surgery patients, either underestimating for high-risk or
overestimating for low-risk groups [32]. Our ROC analysis identified a EuroSCORE
II cut-off of 2.23% (AUC, 0.675) for moderate-to-severe AS patients without AVR,
validated by Kaplan-Meier (log-rank p
The study’s strengths include its multi-centre observational design with verifiable external validity, a 9-year follow-up period, and robust adjustment for confounders, confirming the significant association between EuroSCORE II and all-cause mortality in moderate-to-severe AS patients. These findings enrich the clinical utility of EuroSCORE II in predicting AS outcomes, potentially improving patient outcomes and reducing disease burden.
Our study has the following strengths: firstly, our research uniquely examines the predictive value of EUROSCORE II for both moderate and severe aortic stenosis (AS) patients, expanding the scope beyond the commonly studied severe AS population and providing insights into a broader spectrum of disease severity. Secondly, our study is based on multi-center data sourced from three centers within a database jointly collected by multiple Chinese valve centers, ensuring the diversity and representativeness of the sample. Additionally, our study benefits from a long follow-up period of up to 9.09 years, with a wide-ranging span that enhances the stability and reliability of our conclusions. Importantly, we innovatively propose modifying the EUROSCORE II cut-off value to 2.23% for moderate-to-severe AS patients without AVR surgery, addressing a gap in the literature and offering a novel perspective on risk stratification.
However, limitations exist. This study is a Chinese-based retrospective cohort which has its inherent selection bias and our sample size was relatively limited, thus lacking generalization and necessitating external validation. Additionally, the applicability of EuroSCORE II is limited by etiological differentiation (e.g., degenerative calcific vs. rheumatic) for aortic stenosis due to lacking historical records data. Moreover, echocardiographic and laboratory parameters were static, risking bias from measurement errors or inter-center criteria differences.
Finally, though EuroSCORE II was associated with mortality without AVR, its modest accuracy demands supplementation with clinical and imaging data for reliable risk stratification.
In conclusion, both the EuroSCORE II (cut-off value 4%) and AVR status were
independently associated with the long-term prognosis of patients with
moderate-to-severe AS. Patients with a low-risk EuroSCORE II (
EuroSCORE II, European System for Cardiac Operative Risk Evaluation; SBP, systolic blood pressure; CKD, chronic kidney disease; COPD, chronic obstructive pulmonary disease; HB, haemoglobin; TC, total cholesterol; HDL-C, high-density lipoprotein-cholesterol; LDL-C, low-density lipoprotein-cholesterol; TG, triglyceride; Cr, creatinine; CC, creatinine clearance; TBIL, total bilirubin; LVEF, left ventricular ejection fraction; AV-Vmax, maximum velocity of blood flow through the aortic valve; AV-MG, mean gradient across the aortic valve; AVA, aortic valve area; PAH, pulmonary arterial hypertension; ACEI, angiotensin converting enzyme inhibitor; ARB, angiotensin receptor blocker; CCB, calcium channel blocker.
Our heart valvular disease intervention center construction unit from The Second Affiliated Hospital of Shantou University Medical College is part of the National Clinical Medical Research Center for Radiology and Therapy, Interventional Center for Valvular Disease, Dongfang Huaxia Cardiovascular Health Institute, Suzhou Industrial Park. Our data were from Three heart valve centers, which are derived from a database called Aortic Valve Diseases RISk facTOr assessmenT and Prognosis modeL Construction (ARISTOTLE). The datasets used and analyzed during the current study are available from the corresponding authors upon reasonable request.
XC and DH contributed to the manuscript equally. They are responsible for studying conceptualization, data curation, data analysis and writing the original draft. BY and JC are responsible for formal analysis, accessing and verifying the data and writing editing. WL, YL and RL are responsible for investigation, software, data curation and editing. JY, JS and ST are responsible for investigation, software, data curation and editing. XH and BX are responsible for investigation, software, data curation and methodology. XZ, JC and JL are responsible for conceptualization and data curation. JL is also responsible for conceptualization and writing reviews or editing. All authors reviewed the manuscript. All authors contributed to editorial changes in the manuscript. All authors read and approved the final manuscript. All authors have participated sufficiently in the work and agreed to be accountable for all aspects of the work.
The study was carried out in accordance with the guidelines of the Declaration of Helsinki and approved by the Ethics Review Committee of the Second Affiliated Hospital of Shantou University Medical College (ERB number: 2024-23). Patient follow-up was conducted via telephone contact, with verbal informed consent approved by the institutional ethics committee.
We thank Mark Cleasby, PhD from Liwen Bianji (Edanz) for editing the language of a draft of this manuscript.
This research received no external funding.
The authors declare no conflict of interest.
Supplementary material associated with this article can be found, in the online version, at https://doi.org/10.31083/RCM42757.
References
Publisher’s Note: IMR Press stays neutral with regard to jurisdictional claims in published maps and institutional affiliations.