

 , Yongnan Lyu 2,†, Wen Dai 1, Yan Li 1,*
1 Department of Clinical Laboratory, Renmin Hospital of Wuhan University, 430060 Wuhan, Hubei, China
2 Department of Cardiology, Renmin Hospital of Wuhan University, 430060 Wuhan, Hubei, China
†These authors contributed equally.
Abstract
Growth differentiation factor-15 (GDF-15) has emerged as a novel biomarker for coronary artery disease (CAD). Although the hypercoagulable state is recognized as a biological mechanism that triggers cardiac events in CAD, the relationship between GDF-15 and coagulation parameters in patients with CAD remains unclear. Thus, this study aimed to investigate the potential relationship between GDF-15 and coagulation parameters in male Chinese patients with CAD.
In total, 892 subjects were enrolled between January 2020 and December 2020, including 592 with CAD and 300 controls. The serum levels of GDF-15, blood cell count, glucose, serum lipids, and coagulation parameters were measured. Kruskal–Wallis or one-way ANOVA with post hoc tests (Holm–Sidak and Dunn's tests), as well as univariate/multivariate linear regression analyses, were used to determine the correlation between GDF-15 and coagulation parameters in male patients with CAD.
Compared to controls, patients with acute myocardial infarction (AMI) and stable angina (SA) showed significantly higher levels of GDF-15 (p < 0.05). Multivariate linear regression revealed that GDF-15 levels were positively associated with activated partial thromboplastin time (APTT) in patients with CAD (β = 0.109, p = 0.024), and inversely associated with antithrombin III (AT3) (β = –0.113, p = 0.028) in an adjusted multivariate regression model. Meanwhile, in a multivariate regression model adjusted for other variables, the GDF-15 levels in patients with SA were inversely associated with AT3 (β = –0.191, p = 0.036). After adjusting for confounders, the GDF-15 levels were positively associated with APTT (β = 0.174, p = 0.002) and inversely associated with monocyte count (β = –0.159, p = 0.025) in patients with AMI.
Elevated levels of GDF-15 in male CAD patients are associated with altered coagulation parameters, suggesting that GDF-15 may serve as a compensatory marker for coagulation parameter instability. These results underscore the potential clinical value of GDF-15 as a novel biomarker for assessing the coagulation status in patients with CAD, especially in the acute coronary syndrome (ACS) subgroup.
Keywords
- growth differentiation factor-15
- coronary artery disease
- coagulation
- acute coronary syndrome
Coronary artery disease (CAD), the leading cause of death worldwide, is characterized by reversible myocardial ischemia due to demand/supply mismatch [1]. Acute coronary syndromes (ACS), the primary clinical manifestation of coronary atherosclerosis, are typically caused by plaque rupture and subsequent thrombus formation in epicardial arteries, leading to acute occlusion [2]. Thrombosis plays a central role in the pathophysiology of ACS, which is driven by interrelated mechanisms, such as endothelial dysfunction, inflammation, and coagulation. Systemic inflammation promotes a proatherogenic state by upregulating prothrombotic factors and cell adhesion molecules, thereby activating platelets and facilitating clot formation [3]. Thus, coagulation status critically affects the development and progression of CAD.
Growth differentiation factor-15 (GDF-15), a member of the transforming growth
factor-
The prognostic value of GDF-15 in CAD, which predicts mortality and disease progression [9], makes it clinically relevant [19, 20]. Concurrently, assessing the coagulation status is vital for managing the risk of thrombosis/bleeding. Elevated levels of GDF-15 after ACS are associated with bleeding risk [15], and thrombogenesis in acute myocardial infarction (AMI) alters peripheral vascular responses compared to stable CAD [21]. GDF-15 combined with conventional coagulation markers, such as activated partial thromboplastin time (APTT), which correlates with the clinical presentation of patients undergoing angiography [22], may help guide the management of CAD. Although no studies have directly investigated the association between GDF-15 and coagulation in CAD.
This study is the first to investigate the associations between GDF-15 and coagulation parameters (prothrombin time, (PT), APTT, fibrinogen, thrombin time (TT), D-dimer, and antithrombin III (AT3)) in male patients with CAD, including those with ACS and SA subgroups.
This retrospective cross-sectional study enrolled male patients who underwent
elective coronary angiography for suspected CAD (including SA and ACS) at the
Renmin Hospital of Wuhan University between January 2020 and December 2020.
Individuals with other severe comorbidities, such as active infection, pulmonary
edema, chronic/acute kidney injury, or those undergoing recent thrombolysis, were
excluded. In total, 892 patients were finally enrolled. Participants with
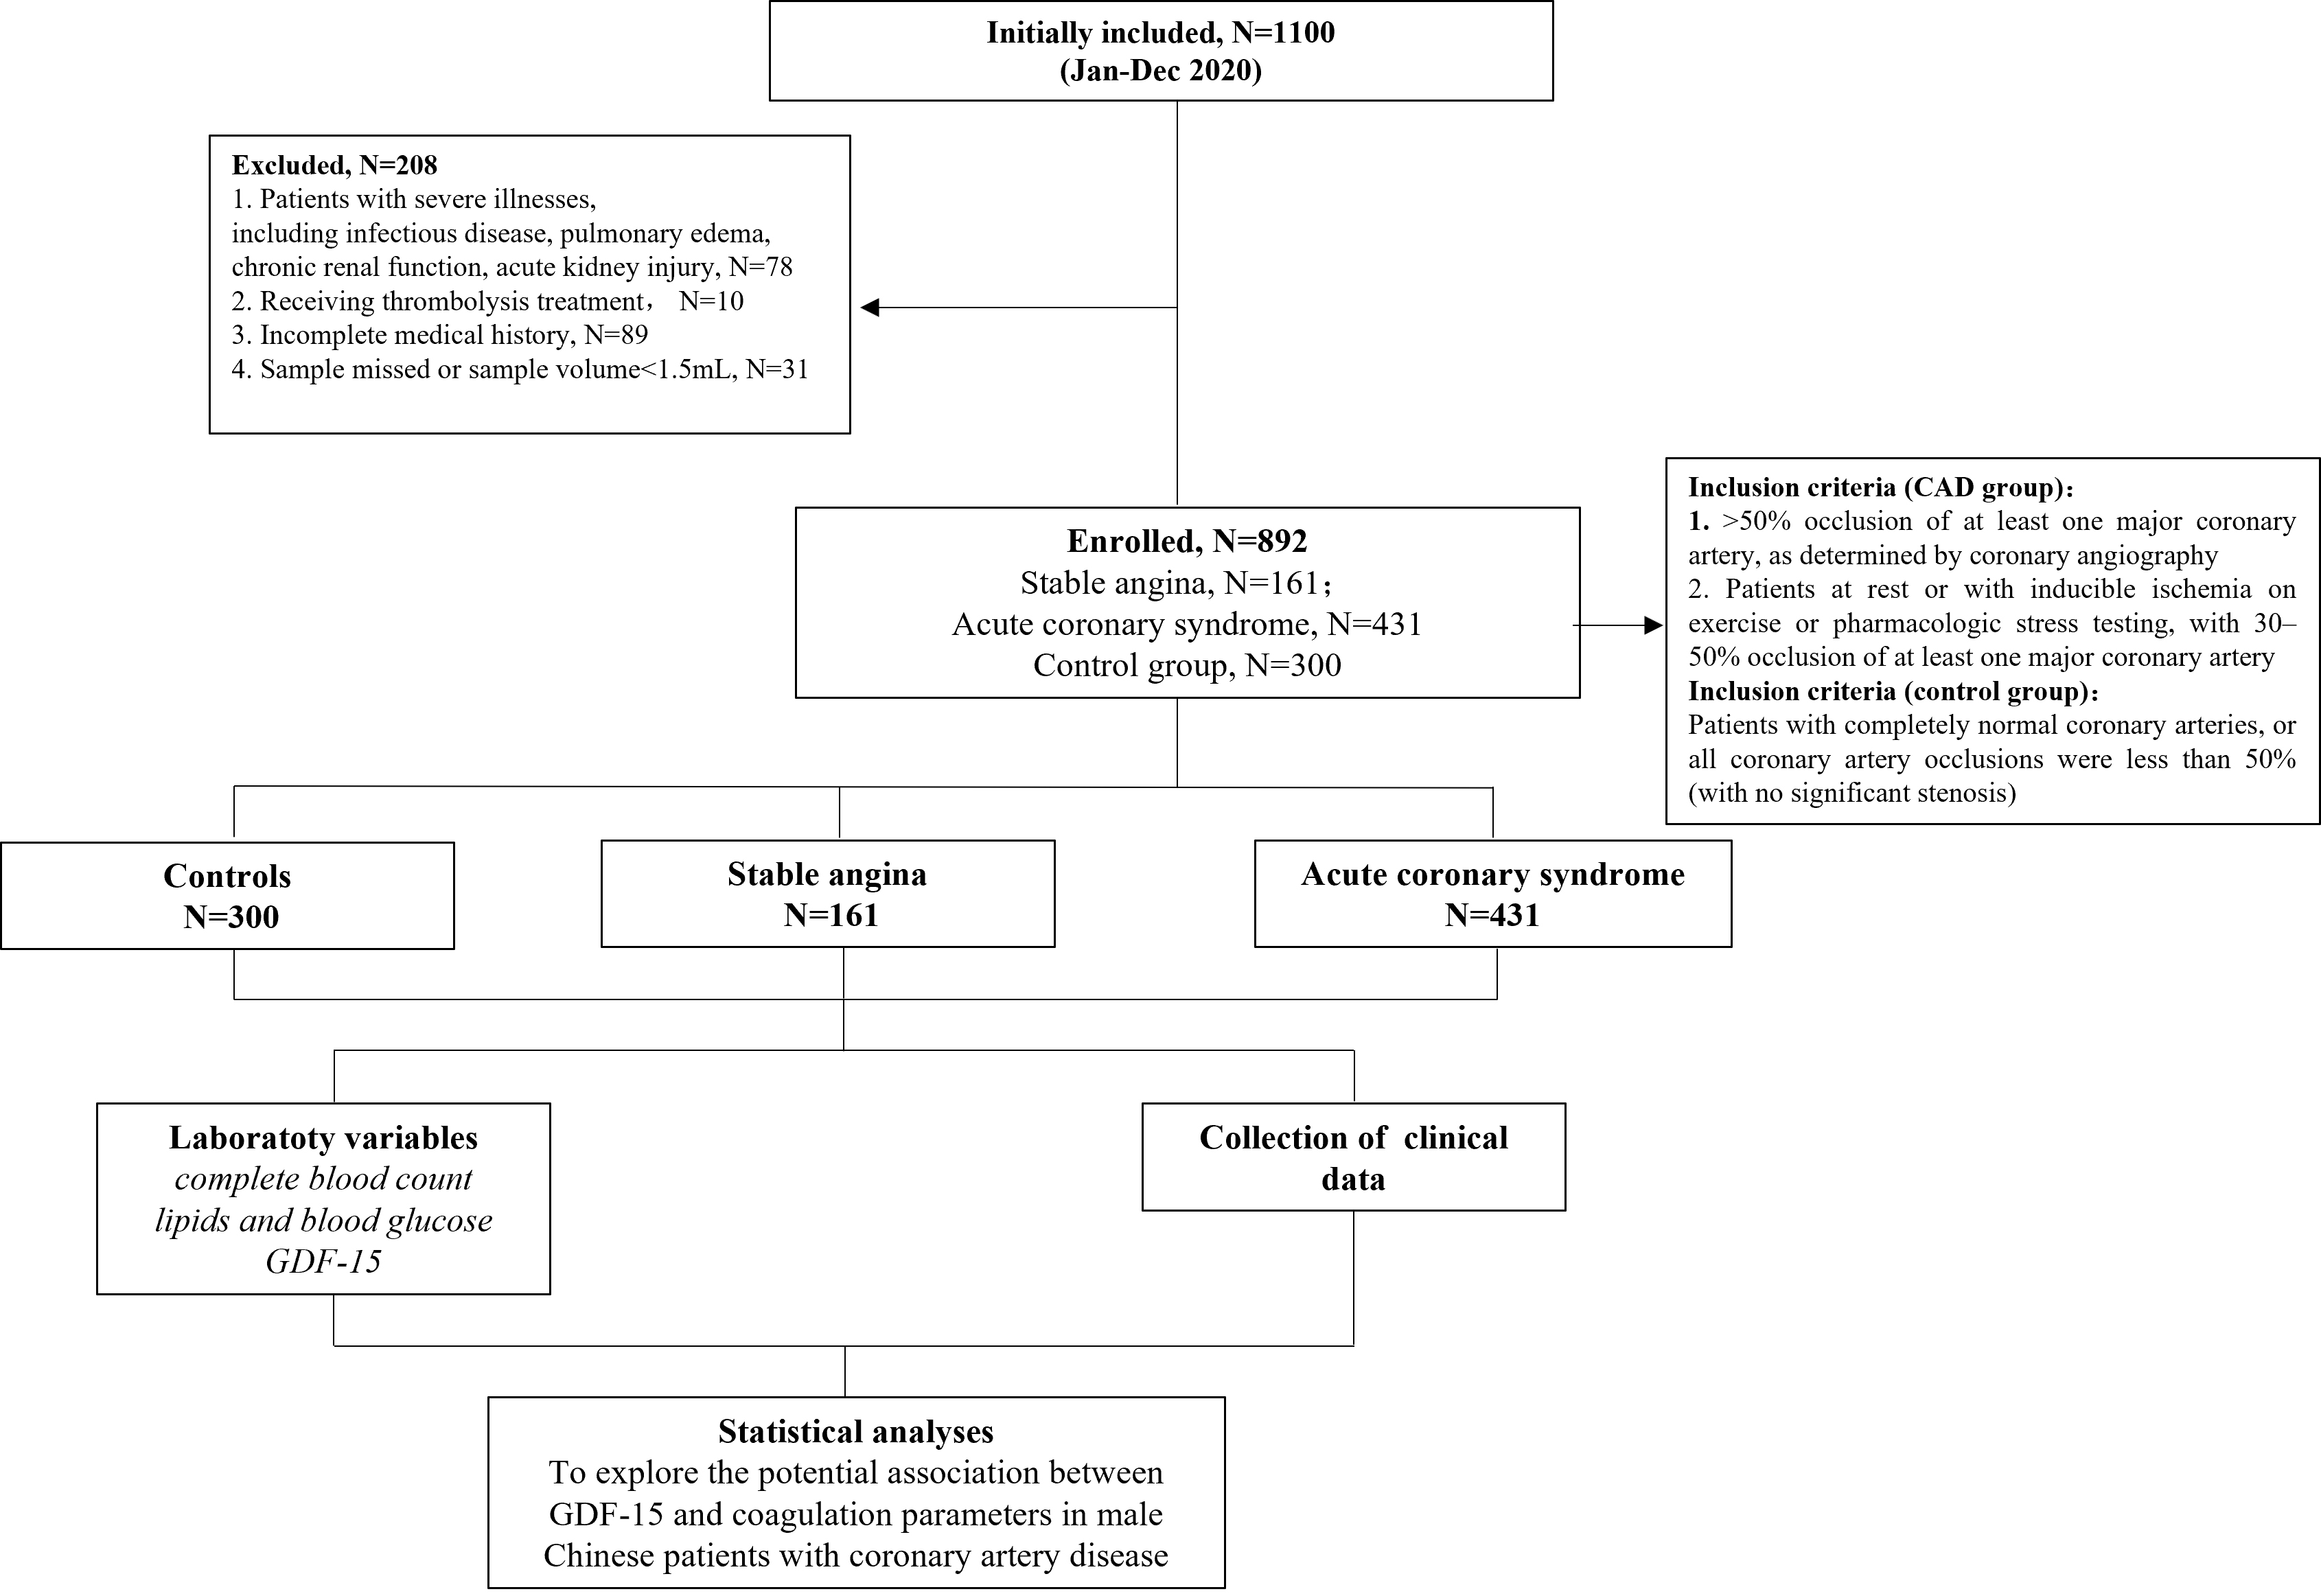 Fig. 1.
Diagram of patient selection. GDF-15, growth differentiation factor-15; CAD, coronary artery disease.
The study protocol was approved by the Medical Ethics Review Committee of Renmin Hospital, Wuhan University, and complied with the Declaration of Helsinki. Written informed consent was obtained from all participants.
Two blinded radiologists evaluated the severity of stenosis based on the Gensini score [23]. Vascular disease was classified as 0–3 based on the affected arteries (left anterior descending, left circumflex, right coronary). Left main trunk involvement was scored as 2-vessel disease.
In this study, SA was defined as a myocardial ischemia/hypoxia due to
Blood samples from patients with AMI were collected immediately upon hospitalization due to the urgency of their medical condition. For other patients, venipuncture was conducted in the morning after an overnight fast. Venous blood sample was drawn into plain tubes, centrifuged at 3500 rpm/min at 25 °C for 15 minutes, and the separated plasma/serum was stored at –80 °C until analysis.
Complete blood count (white blood count (WBC), neutrophils (Neu), monocytes (Mono), and lymphocytes (Lym)) was analyzed using a Sysmex XN-20 hematology analyzer (Kobe, Japan). Serum biochemical parameters (total cholesterol (TC), triglyceride (TG), high-density lipoprotein cholesterol (HDL-c), low-density lipoprotein cholesterol (LDL-c), and glucose) were quantified using an ADVIA 2400 biochemistry analyzer (Siemens, Munich, Germany). GDF-15 levels were measured via Elecsys® electrochemiluminescent immunoassay (Roche Diagnostics, Basel, Switzerland; research-use-only in China; detection range: 400–20,000 ng/L). Coagulation tests (APTT, PT, TT, and fibrinogen) were conducted on a CS-5100 analyzer (Sysmex, Kobe, Japan) using the clotting method, while D-dimer (immunoturbidimetry) and AT3 (chromogenic substrate method) were assayed on the same platform.
All procedures were conducted strictly following the specifications by the manufacturer and package insert guidelines.
Continuous variables are presented as median (interquartile range [IQR]) or mean
A two-sided p-value
There were no significant differences in terms of the distribution of age,
hypertension, diabetes and smoking among patients with SA, those with ACS, and
controls (p
| Characteristics | Controls (n = 300) | SA (n = 161) | ACS (n = 431) | p-value |
| Age, years | 61.00 (56.00–67.0) | 56.00 (51.00–62.00) | 65.00 (58.00–71.00) | 0.170 |
| Diabetes, n (%) | 69 (23.00) | 40 (24.84) | 117 (27.15) | 0.271 |
| Hypertension, n (%) | 170 (56.67) | 93 (57.76) | 267 (61.95) | 0.258 |
| Smoking, n (%) | 158 (52.67) | 102 (63.35) | 248 (57.54) | 0.073 |
| WBC (109/L) | 5.81 (5.05–6.66) | 6.63 (5.65–7.43) | 6.70 (5.39–8.38) | |
| Neu (109/L) | 3.25 (2.55–3.86) | 4.01 (3.10–4.90) | 4.12 (3.15–5.60) | |
| Lym (109/L) | 2.01 |
1.71 |
1.61 |
|
| Mono (109/L) | 0.43 (0.37–0.53) | 0.48 (0.41–0.63) | 0.56 (0.44–0.69) | |
| PLT (109/L) | 221.96 |
205.91 |
205.14 |
0.002 |
| Glu (mmol/L) | 4.51 (4.18–4.89) | 4.90 (4.52–5.85) | 5.20 (4.55–6.86) | |
| TC | 4.39 (3.93–4.80) | 3.84 (3.26–4.66) | 3.67 (3.08–4.41) | |
| TG | 1.11 |
1.63 |
1.63 |
0.001 |
| HDL-c | 1.26 |
0.98 |
0.96 |
|
| LDL-c | 2.48 |
2.15 |
2.13 |
0.562 |
| GDF-15 (pg/mL) | 700.00 (545.00–985.00) | 775.00 (655.50–960.50) | 1617.00 (1164.00–2286.00) |
Data are expressed as median (25th–75th percentile) or mean
We also analyzed the characteristics of patients with CAD stratified by GDF-15
tertiles (Table 2). Patients with the higher tertile of GDF-15 were more likely
to have diabetes and hypertension, higher levels of inflammatory markers (WBC,
Neu, and Mono) and lipids (high TC, TG, and low HDL-c), and a high Gensini score.
No significant differences were observed among the three subgroups in terms of
glucose, LDL-c, and PLT (p
| Characteristics | GDF-15 level | p-value | ||
| Low (n = 195) | Medium (n = 196) | High (n = 201) | ||
| 999.35–1690.52 pg/mL | ||||
| Age, years, median (IQR) | 56.00 (51.00–62.00)a | 64.00 (57.00–70.00)b | 69.00 (63.00–75.00)c | |
| Diabetes, n, (%) | 36 (18.46)a | 55 (28.06)b | 66 (32.84)b | |
| Hypertension, n, (%) | 102 (52.31)a | 121 (61.73)b | 137 (68.16)b | 0.005 |
| Statin use, n (%) | 47 (24.10)a | 49 (25.00)a | 52 (25.87)a | 0.921 |
| Aspirin use, n (%) | 82 (42.05)a | 77 (39.29)a | 82 (40.80)a | 0.856 |
| Smoking, n, (%) | 111 (56.92)a | 109 (55.61)a | 130 (64.68)a | 0.138 |
| PT (s) | 10.6 (10.2–11.3)a | 10.8 (10.2–11.6)a | 11.4 (10.8–12.4)b | |
| APTT (s) | 27.6 (25.1–29.7)a | 27.7 (25.3–30.1)a | 28.5 (26.2–31.8)b | 0.003 |
| TT (s) | 17.9 (17.0–18.4)a | 17.7 (16.9–18.5)a | 17.3 (16.5–18.0)b | |
| FIB (g/L) | 2.5 (2.1–3.0)a | 2.7 (2.3–3.3)b | 3.0 (2.5–3.8)c | |
| D-dimer (mg/L) | 0.20 (0.14–0.40)a | 0.30 (0.18–0.46)b | 0.57 (0.31–1.27)c | |
| AT3 (%) | 98.2 (91.2–104.9)a | 93.1 (84.1–100.0)b | 88.4 (78.9–99.9)b | |
| PLT | 210.12 |
202.73 |
203.34 |
0.524 |
| WBC (109/L) | 6.50 (5.38–7.55)a | 6.70 (5.33–7.98)a,b | 6.75 (5.54–8.77)b | 0.043 |
| Neu (109/L) | 3.90 (2.99–4.81)a | 4.01 (3.30–5.30)a | 4.39 (3.34–6.05)b | 0.001 |
| Lym (109/L) | 1.70 (1.33–2.12)a | 1.64 (1.30–2.04)b | 1.33 (1.03–1.88)b | |
| Mono (109/L) | 0.48 (0.41–0.61)a | 0.54 (0.44–0.67)b | 0.59 (0.45–0.72)b | |
| Glu (mmol/L) | 4.91 (4.52–5.71)a | 5.20 (4.56–6.98)a,b | 5.29 (4.49–7.01)b | 0.050 |
| TC (mmol/L) | 3.58 (3.10–4.24)a | 3.84 (3.07–4.66)a,b | 3.84 (3.21–4.68)b | 0.026 |
| TG (mmol/L) | 1.21 (0.90–1.76)a | 1.33 (0.95–1.81)b | 1.56 (1.05–2.14)b | 0.001 |
| HDL-c (mmol/L) | 0.93 (0.83–1.14)a | 0.95 (0.79–1.11)a | 0.88 (0.72–1.08)b | 0.006 |
| LDL-c (mmol/L) | 2.11 (1.52–2.69)a | 2.00 (1.41–2.78)a | 2.00 (1.50–2.60)b | 0.737 |
| Gensini Score | 16.50 (4.50–33.75)a | 22.50 (8.00–55.00)b | 32.00 (14.50–77.25)c | |
Data are expressed as median (25th–75th percentile); Kruskal-Wallis test and one-way ANOVA were used for comparison.
Different lowercase letters indicate significant differences between the groups (Dunn’s test or LSD test).
PT, prothrombin time; APTT, activated partial thromboplastin time; TT, thrombin time; FIB, fibrinogen; AT3, antithrombin III; IQR, interquartile range.
Univariate linear regression analyses were conducted to determine the correlations among GDF-15 levels, inflammatory markers, and blood lipids in all participants and subgroups. GDF-15 was positively correlated with age, leukocyte, neutrophil, monocyte count, PT, APTT, and D-dimer, and negatively correlated with lymphocyte count, TC, and AT3 in all patients with CAD and in the AMI subgroup (Tables 3,4). In contrast, in patients with SA, only age was positively correlated with GDF-15 levels (Table 5).
| Independent variables | Unstandardized coefficient (B) | 95% CI for B | Standardized coefficient ( |
p-value |
| Age | 65.590 | 49.639 to 81.542 | 0.315 | |
| WBC | 243.657 | 187.005 to 300.309 | 0.333 | |
| Neu | 294.139 | 236.025 to 352.254 | 0.384 | |
| Lym | –699.972 | –972.952 to 426.992 | –0.206 | |
| Mono | 1361.550 | 754.810 to 1968.289 | 0.181 | |
| PLT | –0.755 | –3.270 to 1.761 | –0.025 | 0.556 |
| Glu | –0.185 | –11.419 to 11.049 | –0.001 | 0.974 |
| TC | –181.127 | –344.696 to –17.559 | –0.093 | 0.030 |
| TG | –26.504 | –73.442 to 20.433 | –0.047 | 0.268 |
| HDL-c | –10.144 | –47.787 to 27.490 | –0.024 | 0.597 |
| LDL-c | 7.253 | –192.378 to 206.885 | 0.003 | 0.943 |
| PT | 151.416 | 99.414 to 203.418 | 0.235 | |
| APTT | 47.264 | 25.066 to 69.462 | 0.178 | |
| TT | –11.955 | –38.776 to 14.866 | –0.038 | 0.382 |
| FIB | 130.204 | 4.691 to 255.716 | 0.088 | 0.042 |
| D-dimer | 70.064 | 11.553 to 128.574 | 0.101 | 0.019 |
| AT3 | –3.301 | –6.555 to –0.046 | –0.095 | 0.047 |
Univariate linear regression analyses were employed to test the correlation between GDF-15 and each parameter in all patients with CAD.
| Independent variables | Unstandardized coefficient (B) | 95% CI for B | Standardized coefficient ( |
p-value |
| Age | 57.480 | 35.389 to 79.571 | 0.240 | |
| WBC | 252.800 | 185.770 to 319.829 | 0.340 | |
| Neu | 308.308 | 239.442 to 377.174 | 0.395 | |
| Lym | –788.630 | –1134.704 to –442.556 | –0.214 | |
| Mono | 1171.101 | 453.298 to 1888.904 | 0.155 | 0.001 |
| PLT | –0.731 | –3.887 to 2.425 | –0.022 | 0.649 |
| Glu | 39.726 | –28.593 to 108.045 | 0.057 | 0.254 |
| TC | –193.291 | –417.650 to 31.067 | –0.085 | 0.091 |
| TG | –48.209 | –137.355 to 40.937 | –0.053 | 0.288 |
| HDL-c | –601.281 | –1497.877 to 295.316 | –0.070 | 0.188 |
| LDL-c | 10.100 | –245.250 to 265.451 | 0.004 | 0.938 |
| PT | 172.638 | 107.154 to 238.122 | 0.250 | |
| APTT | 46.476 | 20.580 to 72.373 | 0.177 | |
| TT | –61.691 | –199.128 to 75.746 | –0.045 | 0.378 |
| FIB | 67.170 | –80.111 to 214.452 | 0.046 | 0.370 |
| D-dimer | 151.982 | 58.323 to 245.642 | 0.160 | 0.002 |
| AT3 | –34.680 | –51.718 to –17.642 | –0.224 |
Univariate linear regression analyses were employed to investigate the correlation between GDF-15 and each parameter among patients with AMI.
| Independent variables | Unstandardized coefficient (B) | 95% CI for B | Standardized coefficient ( |
p-value |
| Age | 17.917 | 12.950 to 22.883 | 0.492 | |
| WBC | 19.294 | –6.496 to 45.085 | 0.120 | 0.141 |
| Neu | 25.537 | –0.778 to 51.852 | 0.155 | 0.057 |
| Lym | –70.783 | –156.050 to 14.483 | –0.133 | 0.103 |
| Mono | 124.182 | –176.464 to 424.828 | 0.067 | 0.416 |
| PLT | –0.636 | –1.376 to 0.103 | –0.138 | 0.091 |
| Glu | 0.141 | –1.513 to 1.795 | 0.014 | 0.866 |
| TC | –2.677 | –43.920 to 38.566 | –0.011 | 0.898 |
| TG | 1.779 | –6.536 to 10.094 | 0.035 | 0.673 |
| HDL-c | 0.616 | –4.279 to 5.510 | 0.021 | 0.804 |
| LDL-c | –5.128 | –64.172 to 53.915 | –0.014 | 0.864 |
| PT | –7.427 | –24.456 to 9.602 | –0.070 | 0.390 |
| APTT | –2.692 | –14.815 to 9.432 | –0.036 | 0.661 |
| TT | –1.060 | –5.132 to 3.012 | –0.042 | 0.608 |
| FIB | 44.864 | –30.448 to 120.176 | 0.096 | 0.241 |
| D-dimer | –5.451 | –17.128 to 6.225 | –0.075 | 0.358 |
| AT3 | –0.403 | –0.896 to 0.089 | –0.142 | 0.108 |
Univariate linear regression analyses were employed to measure the correlation between GDF-15 and each parameter in patients with SA.
Multivariate linear regression analyses were conducted to determine the
associations between GDF-15 levels, inflammatory markers, and blood lipids among
all participants with CAD and subgroups of CAD. In patients with CAD, GDF-15
levels were positively associated with neutrophil count (
| Independent variables | Unstandardized coefficient (B) | 95% CI for B | Standardized coefficient ( |
p |
| Age | 54.677 | 36.511 to 72.843 | 0.293 | |
| Neu | 233.028 | 168.621 to 297.434 | 0.330 | |
| APTT | 50.316 | 6.594 to 94.039 | 0.109 | 0.024 |
| AT3 | –14.993 | –28.379 to –1.606 | –0.113 | 0.028 |
Multivariate linear regression analyses were employed to determine the associations among GDF-15 levels, inflammatory markers, and blood lipids among all participants with CAD.
Analyses were adjusted for hypertension, diabetes, and smoking status.
| Independent variables | Unstandardized coefficient (B) | 95% CI for B | Standardized coefficient ( |
p |
| Age | 17.387 | 11.845 to 22.930 | 0.527 | |
| Mono | 623.158 | 371.734 to 874.581 | 0.400 | |
| TG | 9.072 | 2.567 to 15.576 | 0.247 | 0.007 |
| AT3 | –3.884 | –7.507 to –0.260 | –0.191 | 0.036 |
Multivariate linear regression analyses were employed to investigate the associations between GDF-15 levels, inflammatory markers, and blood lipids in all patients with SA.
Analyses were adjusted for hypertension, diabetes, and smoking status.
| Independent variables | Unstandardized coefficient (B) | 95% CI for B | Standardized coefficient ( |
p |
| Age | 49.890 | 26.182 to 73.597 | 0.234 | |
| Neu | 317.840 | 217.330 to 418.350 | 0.439 | |
| Mono | –1007.947 | –1885.992 to –129.903 | –0.159 | 0.025 |
| APTT | 86.766 | 31.477 to 142.056 | 0.174 | 0.002 |
Multivariate linear regression analyses were used to assess the associations between GDF-15 levels, inflammatory markers, and blood lipids among all patients with AMI.
Analyses were adjusted for hypertension, diabetes, and smoking status.
This retrospective study analyzed data from 592 patients with CAD to investigate the relationship between circulating GDF-15 levels and coagulation parameters. The results showed a positive association between GDF-15 and APTT and and inverse association between GDF-15 and AT3 after controlling for potential confounders. To our best knowledge, this was the first study to investigate the relationship between GDF-15 and coagulation parameters among male patients with CAD.
GDF-15 is typically expressed at low levels in various organs, including the liver, lungs, and kidneys, but is upregulated in chronic diseases [27]. A substantial body of research indicates that elevated GDF-15 level is a strong and independent predictor of mortality and disease progression in patients with atherosclerosis and CAD, such as SA and ACS [28, 29, 30]. Importantly, CAD is an age-related condition associated with chronic inflammation. Inflammation was shown to affect the development of atherosclerosis, including its initiation, progression, rupture and thrombosis [31]. Angiogenesis plays a significant role in the progression of atherosclerotic plaques and complications [32, 33]. The local inflammatory response of atherosclerotic plaques promotes angiogenesis by activating endothelial cells, releasing chemokines, cytokines, growth factors, lipid mediators, and proteases and increasing endothelial metabolism. Angiogenesis allows the extravasation of plasma components, leading to thromboembolic events [34]. Plaque angiogenesis and intraplaque hemorrhage are the key factors leading to unstable lesions [35]. De Jager et al. [12] and Bonaterra et al. [13] suggested that GDF-15 may modulate monocyte and macrophage activation, contributing to a prothrombotic state via cytokine-driven endothelial dysfunction and tissue factor expression. Moreover, Dong et al. [36] revealed that GDF-15 can phosphorylate Src and its downstream pathways to induce the pro-angiogenic effects. These findings imply the regulatory role of GDF-15 in angiogenesis and cell proliferation in atherosclerosis [36]. Based on these findings, GDF-15 may affect coagulation pathways by regulating inflammation and angiogenesis in CAD, especially in ACS.
GDF-15 increases the risk of atherosclerosis through multiple mechanisms. For
instance, it promotes CCR2-mediated macrophage chemotaxis toward atherosclerotic
plaques and interleukin-6-dependent inflammatory responses [12, 13]. In this
study, the ACS and SA groups exhibited significantly higher levels of
inflammatory markers (WBC, Neu, and Mono), glucose, and lipids (TG) and lower Lym
count compared to controls (p
In addition to its associations with inflammation and stress, elevated levels of GDF-15 have been independently linked to an increased risk of stroke, systemic embolic events, and major bleeding [50, 51, 52]. Notably, Siegbahn et al. [53] found that high concentrations of GDF-15 significantly predict major bleeding in patients with atrial fibrillation receiving anticoagulants. Furthermore, Matusik et al. [46] reported that elevated levels of GDF-15 independently predict impaired fibrin clot lysis in patients with atrial fibrillation, possibly due to its association with prothrombotic alterations. Together, these studies highlight the importance of GDF-15 in coagulation.
Several limitations of this study should be acknowledged. Firstly, there was a lack of data regarding the relationship between GDF-15 levels and clinical outcomes, including survival and major adverse cardiovascular events (MACE). Secondly, the study exclusively enrolled male patients with CAD. Although this approach was adopted to control for gender-specific confounding factors, significant gender differences exist regarding the prevalence of CAD. Thirdly, as a case-control study with a relatively small sample size, the present study can only demonstrate an association between GDF-15 and coagulation parameters, but could not establish a causal relationship. Future studies with larger sample sizes or longitudinal designs are warranted to elucidate this relationship. Finally, this study only assessed the use of aspirin and ignored other antiplatelet (e.g., ticagrelor, clopidogrel) or anticoagulant agents (e.g., NOACs, warfarin), and future study is required for further investigation of this relationship.
In summary, this study showed significant associations between elevated serum levels of GDF-15 and multiple coagulation parameters, particularly APTT and AT3. These findings suggest that GDF-15 can serve as a compensatory marker for coagulation instability. These results underscore the potential clinical application of GDF-15 as a novel biomarker for assessing the coagulation status in male patients with CAD, especially in the ACS subgroup.
WBC, white blood cell; Neu, neutrophil, Lym, lymphocyte; Mono, monocyte; Glu, glucose; TC, total cholesterol; TG, triglycerides; HDL-c, high-density lipoprotein cholesterol; LDL-c, low-density lipoprotein cholesterol; GDF-15, growth differentiation factor-15; PT, prothrombin time; APTT, activated partial thromboplastin time; TT, thrombin time; FIB, fibrinogen; AT3, antithrombin III; PLT, platelet; CAD, coronary artery disease; SA, stable angina; ACS, acute coronary syndrome; AMI, acute myocardial infarction; GNDF, glial-cell-line-derived neurotrophic factor.
The paper is listed as, “Association between Growth Differentiation Factor-15 and Coagulation Parameters in Male Chinese Coronary Artery Disease Patients” as a preprint on medRxiv at: https://www.medrxiv.org/content/10.1101/2025.05.08.25327206v1.full/.
All data generated or analyzed during this study are included in this article. Further studies should be directed toward the corresponding authors.
HL, YNL and YL conceived the study design. HL and YNL performed most of the experiments, and wrote the manuscript. HL and WD collected the samples. YL and WD performed statistical analysis. All authors contributed to editorial changes in the manuscript. All authors read and approved the final manuscript. All authors have participated sufficiently in the work and agreed to be accountable for all aspects of the work.
This study was conducted in strict accordance with the Declaration of Helsinki and approved by the ethics committee of Renmin Hospital of Wuhan University (No.WDRY2020-K001). All participants signed an informed consent form before enrollment.
Medical editing assistance was provided by Dr. Xue Wu funded by Roche Diagnostics (Shanghai) Limited. The GDF-15 assay was sponsored by Roche Diagnostics (Shanghai, China).
This study was supported by Fundamental Research Funds for Central Universities (Grant Number: 2042021kf0109).
The authors declare no conflict of interest.
References
Publisher’s Note: IMR Press stays neutral with regard to jurisdictional claims in published maps and institutional affiliations.