


1 Department of Cardiology, Aoyang Hospital Affiliated to Jiangsu University, 215600 Zhangjiagang, Jiangsu, China
Abstract
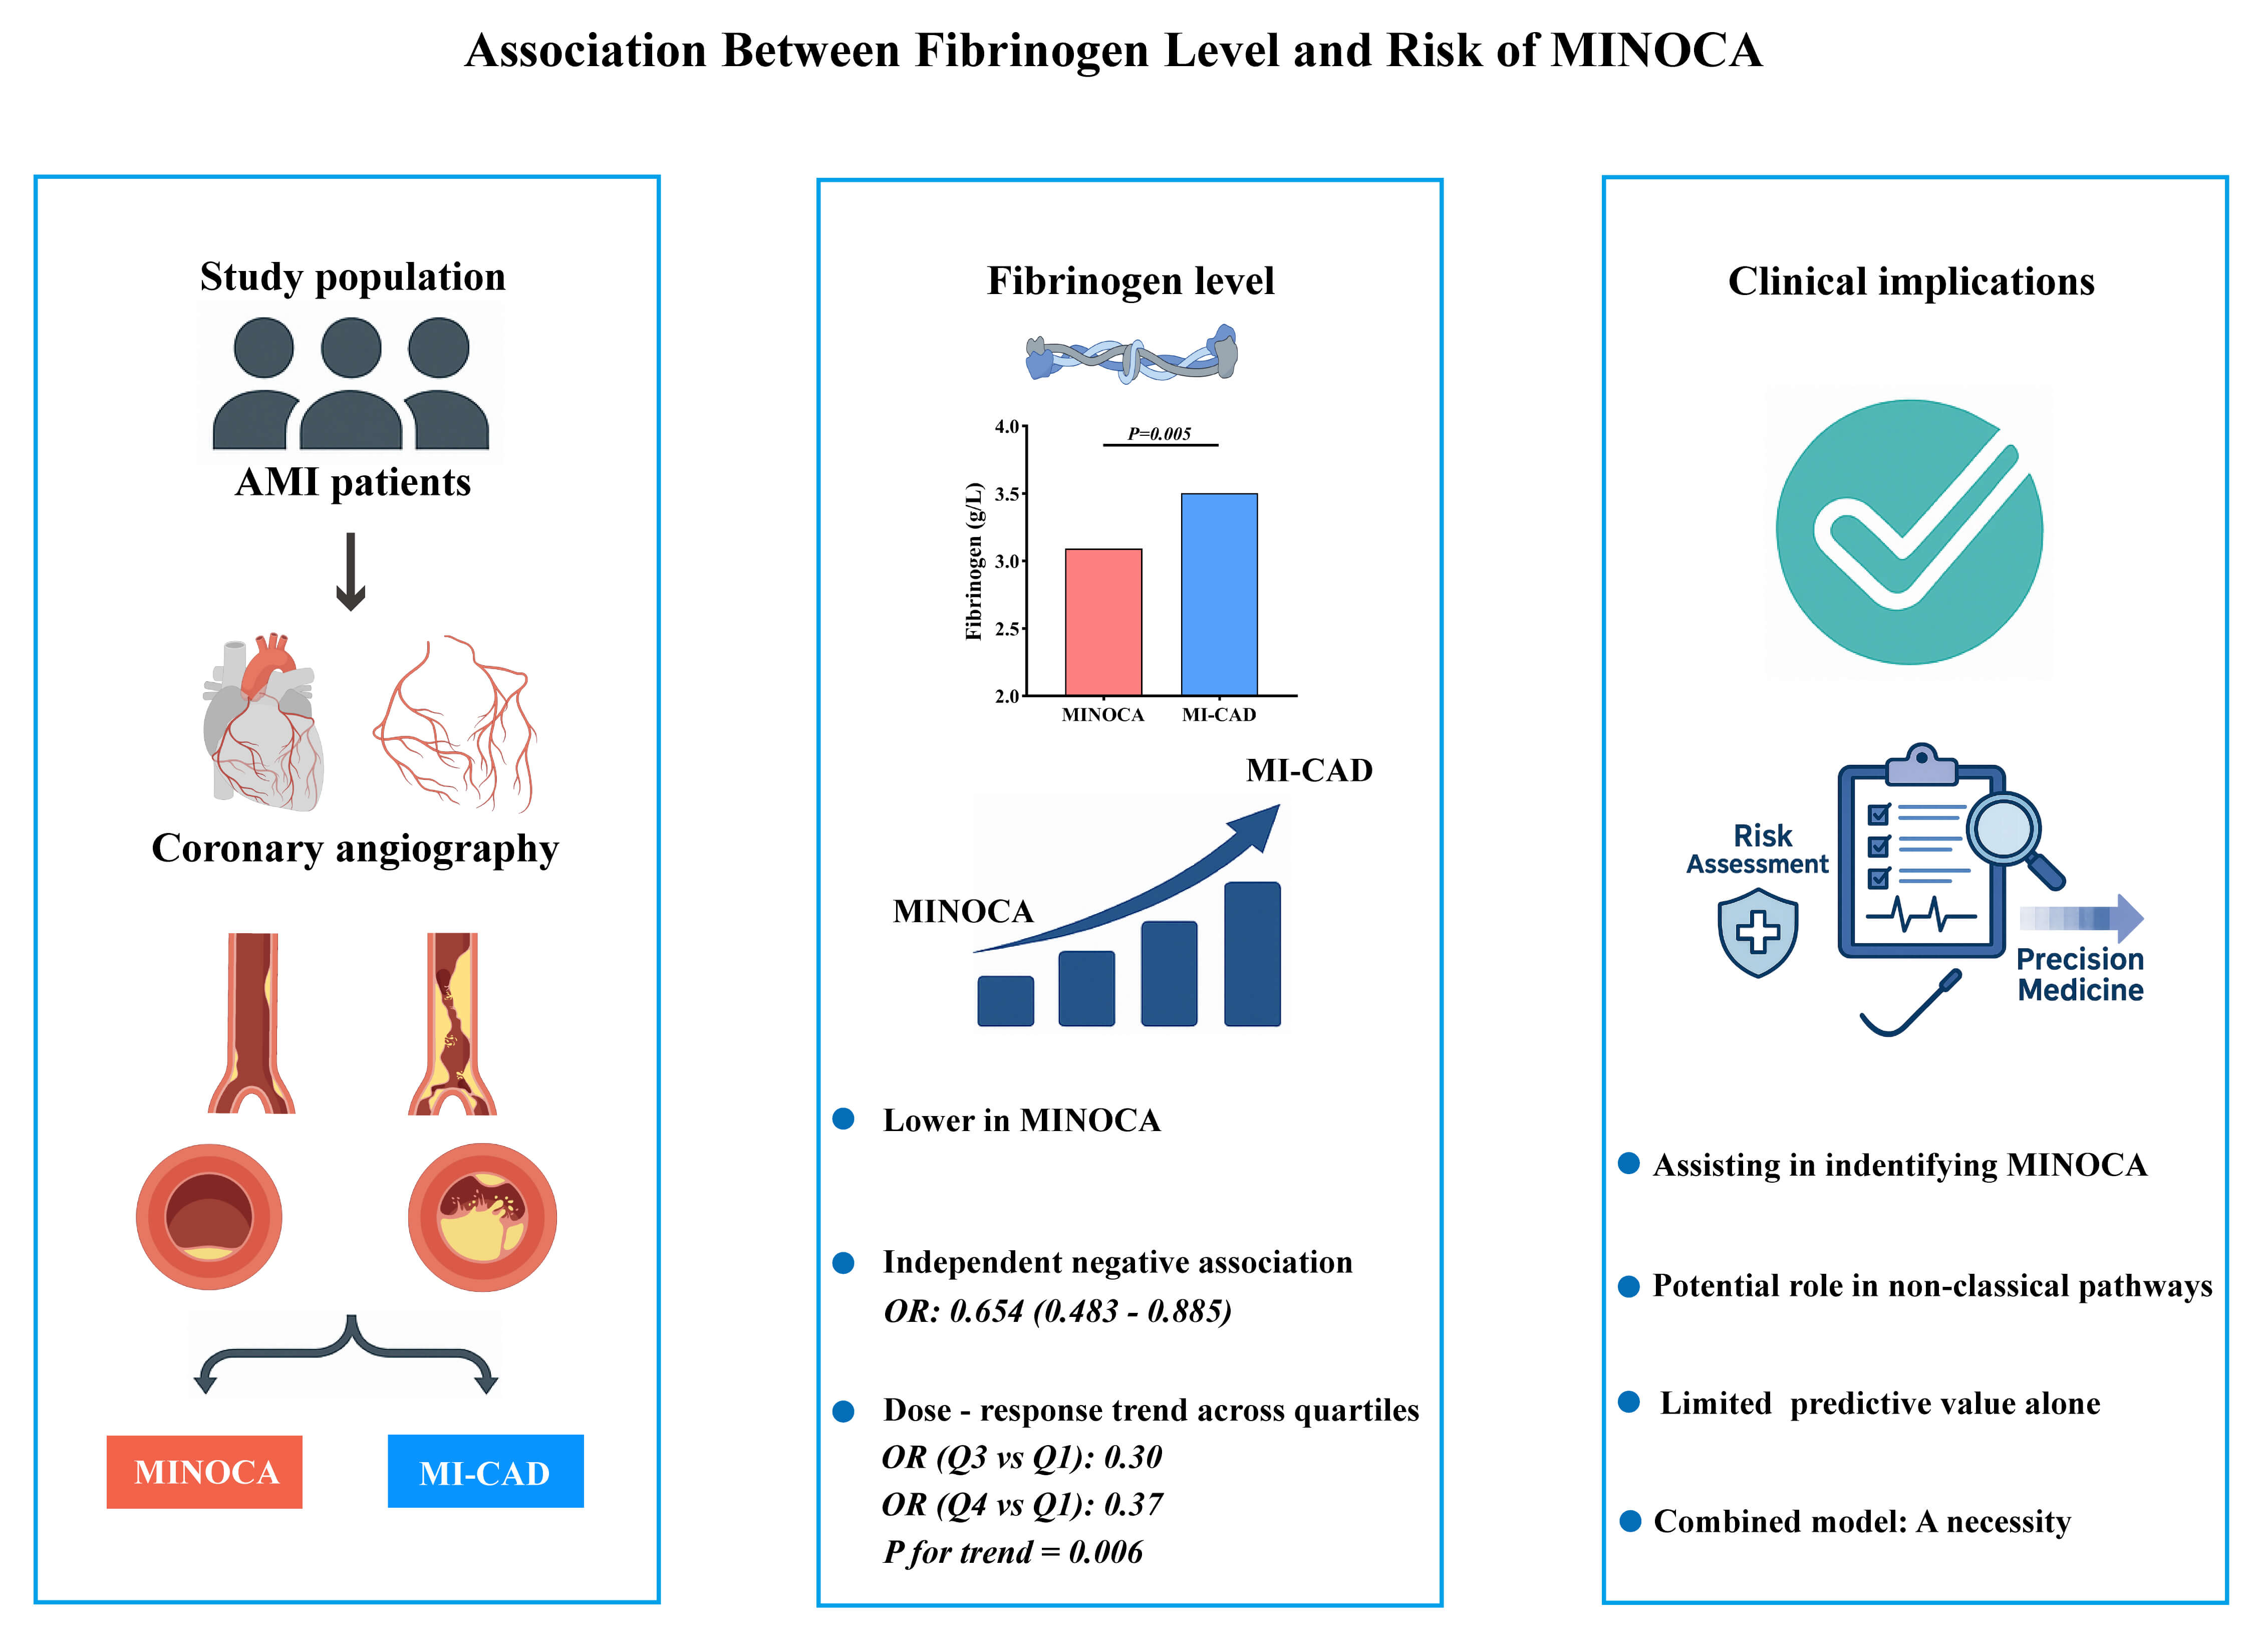
Myocardial infarction with non-obstructive coronary arteries (MINOCA) represents a heterogeneous clinical entity with an unclear pathophysiological basis. Fibrinogen is a key coagulation factor and inflammatory marker that has been associated with atherosclerotic burden in myocardial infarction (MI). However, the role of fibrinogen in MINOCA remains to be established. Therefore, this study aimed to investigate the association between plasma fibrinogen levels and the occurrence of MINOCA, and to evaluate the potential value of fibrinogen assessment in clinical characterization and early identification.
This retrospective study initially screened 1759 patients diagnosed with acute myocardial infarction (AMI) who underwent coronary angiography. A total of 287 patients were analyzed after applying the inclusion and exclusion criteria: 87 with MINOCA and 200 with the MI alongside obstructive coronary artery disease (MI-CAD). A logistic regression analysis was used to assess the association between fibrinogen levels and MINOCA, with subgroup and interaction analyses performed. Receiver operating characteristic (ROC) and restricted cubic spline (RCS) analyses were conducted as supplementary evaluations.
Fibrinogen levels were significantly lower in the MINOCA group compared to the MI-CAD group (p = 0.005). Lower fibrinogen levels were independently associated with increased odds of MINOCA in the multivariate analysis (odds ratio (OR): 0.654, 95% confidence interval (CI): 0.483–0.885; p = 0.006). Quartile analysis revealed a significant inverse trend between fibrinogen levels and risk of MINOCA (p for trend = 0.006), which was further confirmed by a consistent dose–response relationship in the spline analysis (p for overall = 0.035; p for nonlinear = 0.590). The association remained robust across several subgroups. Fibrinogen alone showed a limited discriminative ability (area under the curve (AUC) = 0.605, 95% CI: 0.534–0.675; p = 0.005).
Lower plasma fibrinogen levels were independently associated with the occurrence of MINOCA, suggesting a potential role in its pathophysiology and the early identification of this condition. Fibrinogen alone has limited discriminative utility; however, fibrinogen may contribute to multi-marker approaches for determining and managing MINOCA patients.
Graphical Abstract
Keywords
- fibrinogen
- MINOCA
- non-obstructive coronary artery disease
- myocardial infarction
Acute myocardial infarction (AMI) is primarily caused by atherosclerotic coronary artery disease (CAD), which leads to luminal narrowing or occlusion and subsequent myocardial ischemia or necrosis. Due to its abrupt onset and high fatality, AMI remains a significant public health concern worldwide. Early identification and timely intervention are essential for preserving myocardial tissue and improving patient outcomes.
In the 1980s, DeWood et al. [1] reported that approximately 90% of AMI
patients undergoing coronary angiography had significant coronary obstruction,
defined as
Fibrinogen is a key coagulation factor and acute-phase reactant that plays a critical role in thrombosis and inflammation. A previous study demonstrated a positive correlation between fibrinogen levels and the severity of CAD, as assessed by the Gensini score [9]. In addition, elevated fibrinogen has been closely associated with long-term mortality in patients with CAD or obstructive AMI [10, 11]. Nonetheless, the potential association between fibrinogen level and MINOCA has yet to be specifically investigated.
In this context, the present study aims to characterize the clinical features of MINOCA patients, evaluate the association between plasma fibrinogen level and the risk of MINOCA, and explore potential interactions with other clinical risk factors to improve clinical characterization and support early identification of MINOCA.
A total of 1759 patients diagnosed with AMI [12] and undergoing coronary angiography at our regional chest pain center between October 2015 and September 2017 were consecutively enrolled. After excluding 256 patients who did not meet the inclusion criteria, 1503 patients were included in the study cohort.
After a comprehensive evaluation of clinical and cardiac magnetic resonance
(CMR) imaging data to exclude overt non-ischemic myocardial injury (e.g.,
Takotsubo cardiomyopathy or myocarditis), a total of 87 patients with
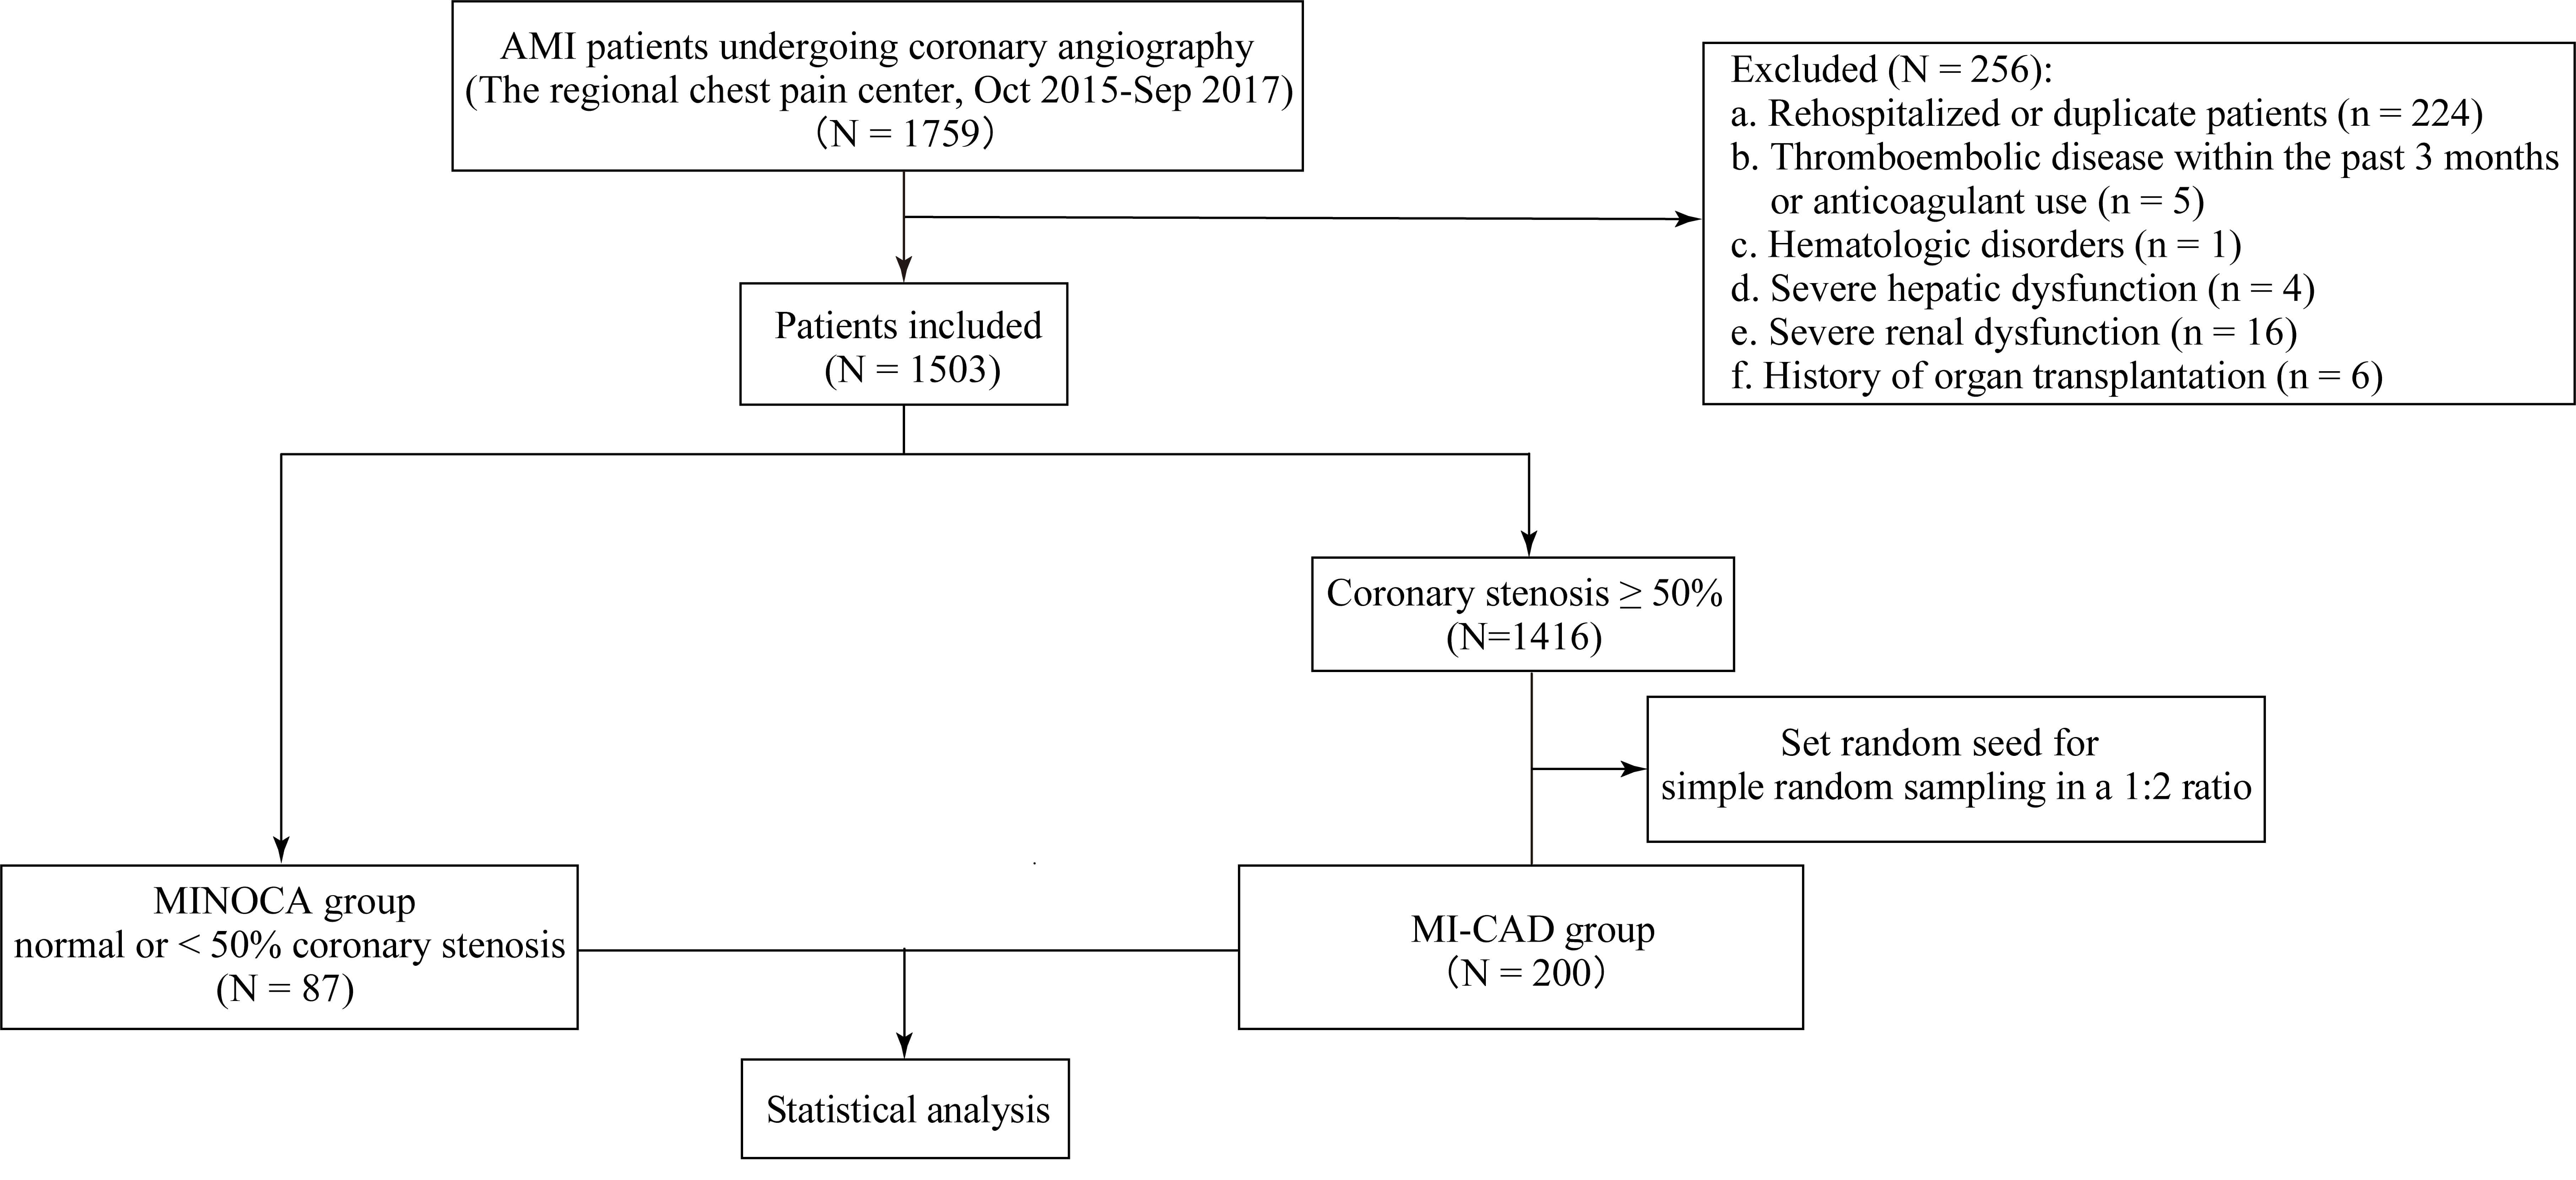 Fig. 1.
Flowchart of patient selection and study design. MINOCA, myocardial infarction with non-obstructive coronary arteries; MI-CAD, myocardial infarction with obstructive coronary artery disease; AMI, acute myocardial infarction.
The following data were collected from the hospital database: demographic
information, medical history, blood test results on admission (including complete
blood count and related hematological parameters, biochemical markers,
coagulation profile, and troponin I), and left ventricular ejection fraction
(LVEF) on admission as measured by transthoracic echocardiography (Philips
Medical Systems iE33, Andover, MA, USA). The coagulation profile was based on
test results obtained before the administration of antithrombotic drugs or
coronary angiography on the day of admission. Data entry and verification were
performed collaboratively by two investigators. Coronary angiography was
performed using a Philips digital subtraction angiography (DSA) system (Philips
Healthcare, Best, The Netherlands) after puncturing the right radial or femoral
artery, as per the standards set by the American Heart Association (AHA) [13].
Two experienced interventional cardiologists reviewed and confirmed the results,
with each independently performing over 50 coronary interventions annually. For
patients with
Normality was assessed using the Shapiro–Wilk test. Continuous variables with a
normal distribution were expressed as the mean (standard deviation, SD), while
non-normally distributed variables were expressed as the median (interquartile
range, IQR). Categorical variables were presented as a frequency (percentage).
Statistical tests included the t-test for continuous variables, the
Chi-square or Fisher’s exact test for categorical variables, and the
Mann–Whitney U test for non-normally distributed variables. All pairwise
comparisons were conducted using one-way ANOVA or the Kruskal–Wallis test,
followed by Bonferroni post hoc correction, or chi-square partitioning with a
Bonferroni-adjusted significance threshold of p
Of the 1759 AMI patients who underwent coronary angiography during the study period, 1503 were included in the cohort. Among them, 87 patients were identified as having MINOCA. For comparative analysis, 200 patients with MI-CAD were randomly selected at a 1:2 ratio. The baseline characteristics of the study population are presented in Table 1. No statistically significant differences were observed between the two groups in terms of age, sex, or body mass index (BMI). Similarly, heart rate, systolic blood pressure, and diastolic blood pressure were comparable across both groups. The prevalence of common cardiovascular comorbidities and risk factors, including smoking, alcohol consumption, hypertension, chronic obstructive pulmonary disease (COPD), family history of CAD, hyperthyroidism, and atrial fibrillation, did not differ significantly between the two groups. However, the prevalence of diabetes mellitus (p = 0.018) and ST-segment elevation (p = 0.006) on electrocardiogram was considerably lower in the MINOCA group compared to the MI-CAD group. Notably, plasma fibrinogen levels were significantly lower in patients with MINOCA compared to those with MI-CAD (p = 0.005), as shown in Fig. 2.
| All subjects | MINOCA | MI-CAD | p value | |
| N = 287 | N = 87 | N = 200 | ||
| Age, years | 64.0 (54.0, 73.0) | 61.0 (52.0, 71.0) | 66.0 (55.0, 73.0) | 0.105 |
| Male, n (%) | 221 (77.0) | 61 (70.1) | 160 (80.0) | 0.067 |
| BMI, kg/m2 | 24.5 (21.2, 28.1) | 24.1 (20.4, 27.1) | 24.5 (21.5, 28.7) | 0.307 |
| Smoking, n (%) | 164 (57.1) | 45 (51.7) | 119 (59.5) | 0.221 |
| Alcohol, n (%) | 84 (29.3) | 30 (34.5) | 54 (27.0) | 0.200 |
| COPD, n (%) | 23 (8.0) | 7 (8.0) | 16 (8.0) | 0.989 |
| Hypertension, n (%) | 177 (61.7) | 51 (58.6) | 126 (63.0) | 0.483 |
| Diabetes mellitus, n (%) | 65 (22.6) | 12 (13.8) | 53 (26.5) | 0.018 |
| Hyperthyroidism, n (%) | 7 (2.4) | 2 (2.3) | 5 (2.5) | |
| Atrial fibrillation, n (%) | 21 (7.3) | 7 (8.0) | 14 (7.0) | 0.754 |
| ST-segment elevation, n (%) | 144 (50.2) | 33 (37.9) | 111 (55.5) | 0.006 |
| Family History of CAD, n (%) | 22 (7.7) | 7 (8.0) | 15 (7.5) | 0.873 |
| Systolic BP, mmHg | 145.0 (121.0, 162.5) | 142.0 (121.5, 161.0) | 148.0 (120.8, 163.0) | 0.972 |
| Diastolic BP, mmHg | 78.0 (63.0, 91.0) | 74.0 (59.0, 90.5) | 79.0 (65.0, 91.0) | 0.166 |
| Heart rate (times/min) | 90.0 (75.0, 111.0) | 91.0 (75.0, 112.0) | 90.0 (75.0, 109.0) | 0.885 |
Data are presented as mean (SD), median (Q1, Q3), or number of patients (%), as appropriate.
BMI, body mass index; COPD, chronic obstructive pulmonary disease; CAD, coronary artery disease; BP, blood pressure; SD, standard deviation; Q1, first quartile; Q3, third quartile.
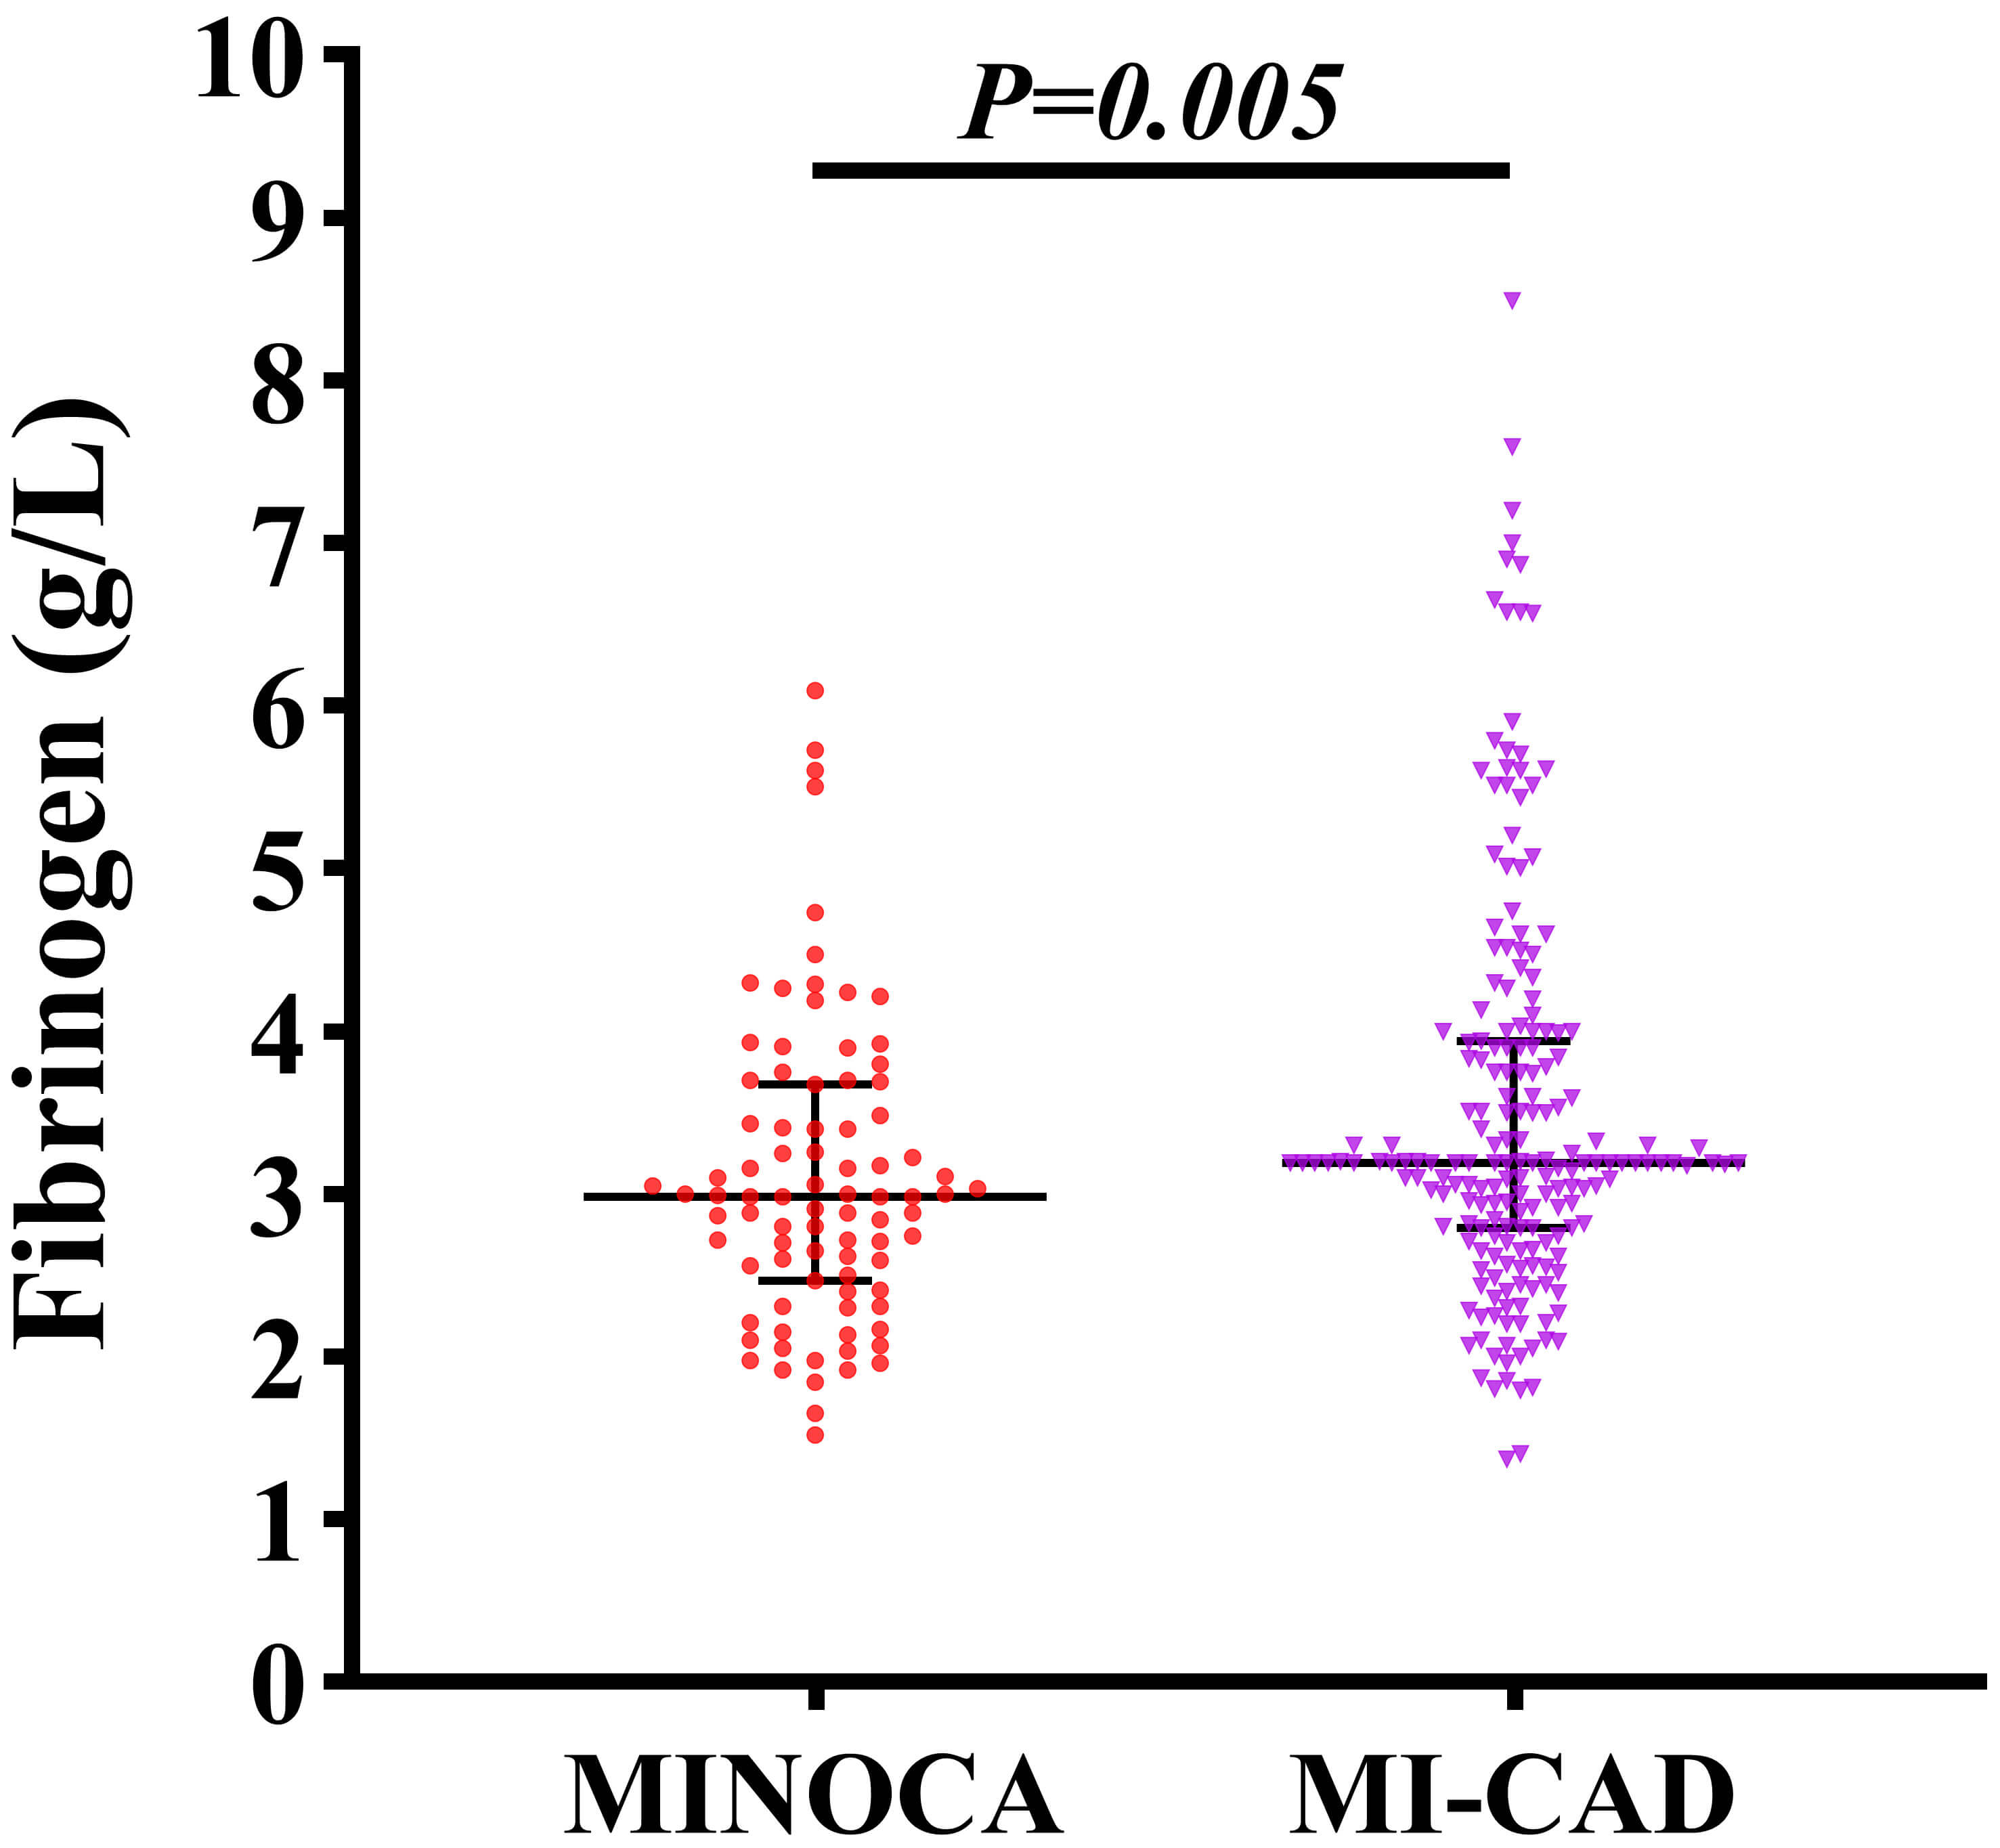 Fig. 2.
Comparison of plasma fibrinogen levels between patients with MINOCA and MI-CAD.
As presented in Table 2, univariate logistic regression analysis identified four
clinical variables that were significantly associated with the occurrence of
MINOCA: white blood cell count (WBC), fibrinogen, cardiac troponin I, and LVEF.
Specifically, the association with MINOCA were: WBC (OR: 0.836, 95% CI:
0.765–0.915, p
| Variables | Univariate analysis | Multivariate analysis | ||
| OR (95% CI) | p value | OR (95% CI) | p value | |
| Age, years | 0.587 (0.330–1.042) | 0.069 | ||
| Sex | 0.985 (0.967–1.004) | 0.115 | ||
| BMI, kg/m2 | 0.969 (0.913–1.028) | 0.298 | ||
| Smoking | 0.729 (0.439–1.210) | 0.222 | ||
| Alcohol | 1.423 (0.828–2.445) | 0.201 | ||
| WBC (×109/L) | 0.836 (0.765–0.915) | 0.998 (0.904–1.103) | 0.971 | |
| PLT (×109/L) | 0.999 (0.996–1.002) | 0.527 | ||
| MPV, fL | 1.047 (0.871–1.257) | 0.625 | ||
| PDW, % | 1.000 (0.905–1.103) | 0.992 | ||
| Plateletcrit, % | 0.459 (0.019–11.334) | 0.634 | ||
| Hemoglobin, g/L | 0.993 (0.979–1.007) | 0.301 | ||
| RDW, % | 0.847 (0.608–1.179) | 0.325 | ||
| Prothrombin Time, s | 0.904 (0.725–1.128) | 0.373 | ||
| Fibrinogen, g/L | 0.700 (0.540–0.908) | 0.007 | 0.654 (0.483–0.885) | 0.006 |
| Calcium, mmol/L | 1.585 (0.398–6.313) | 0.514 | ||
| Potassium, mmol/L | 0.581 (0.308–1.098) | 0.094 | ||
| BUN, mmol/L | 0.957 (0.877–1.045) | 0.331 | ||
| Uric acid, µmol/L | 1.000 (0.998–1.002) | 0.824 | ||
| Creatinine, µmol/L | 0.992 (0.981–1.003) | 0.140 | ||
| Albumin, g/L | 0.978 (0.914–1.046) | 0.507 | ||
| Globulin, g/L | 0.990 (0.934–1.049) | 0.732 | ||
| TC, mmol/L | 0.953 (0.702–1.294) | 0.757 | ||
| TG, mmol/L | 0.894 (0.669–1.193) | 0.447 | ||
| Troponin I, ng/mL | 0.946 (0.927–0.966) | 0.954 (0.934–0.974) | ||
| NT-proBNP, pg/mL | 1.000 (1.000–1.000) | 0.260 | ||
| LVEF, % | 1.094 (1.061–1.128) | 1.056 (1.022–1.091) | 0.001 | |
WBC, white blood cell count; PLT, platelet count; MPV, mean platelet volume; PDW, platelet distribution width; RDW, red cell distribution width; BUN, blood urea nitrogen; TC, total cholesterol; TG, triglycerides; NT-proBNP, N-terminal pro-B-type natriuretic peptide; LVEF, left ventricular ejection fraction; OR, odds ratio; CI, confidence interval.
Participants were stratified into quartiles based on plasma fibrinogen levels:
Q1 (
| Variables | Fibrinogen | p value | |||
| Q1 ( |
Q2 (2.66–3.17) | Q3 (3.17–3.84) | Q4 ( | ||
| N = 72 | N = 73 | N = 71 | N = 71 | ||
| Age, years | 61.6 (13.4) | 61.4 (13.9) | 65.8 (11.6) | 63.1 (14.3) | 0.127 |
| Male, n (%) | 59 (81.9) | 59 (80.8) | 56 (78.9) | 47 (66.2) | 0.093 |
| BMI, kg/m2 | 23.0 (19.8, 27.2) | 24.7 (21.6, 27.8) | 24.4 (21.2, 28.9) | 25.8 (22.0, 28.7) | 0.082 |
| Smoking, n (%) | 42 (58.3) | 41 (56.2) | 39 (54.9) | 42 (59.2) | 0.954 |
| Alcohol, n (%) | 21 (29.2) | 22 (30.1) | 18 (25.4) | 23 (32.4) | 0.828 |
| Atrial fibrillation, n (%) | 4 (5.6) | 5 (6.8) | 7 (9.9) | 5 (7.0) | 0.792 |
| COPD, n (%) | 5 (6.9) | 5 (6.8) | 7 (9.9) | 6 (8.5) | 0.898 |
| Hypertension, n (%) | 38 (52.8) | 50 (68.5) | 43 (60.6) | 46 (64.8) | 0.243 |
| Diabetes mellitus, n (%) | 15 (20.8) ac | 9 (12.3) a | 16 (22.5) ac | 25 (35.2) bc | 0.012 |
| Hyperthyroidism, n (%) | 0 (0) | 1 (1.4) | 3 (4.2) | 3 (4.2) | 0.238 |
| ST-segment elevation, n (%) | 39 (54.2) | 30 (41.1) | 41 (57.7) | 34 (47.9) | 0.200 |
| Family History of CAD, n (%) | 4 (5.6) | 6 (8.2) | 8 (11.3) | 4 (5.6) | 0.532 |
| Systolic BP, mmHg | 136.0 (119.0, 155.3) | 148.0 (117.0, 167.0) | 148.0 (117.0, 163.5) | 148.0 (127.5, 163.0) | 0.261 |
| Diastolic BP, mmHg | 75.0 (62.0, 95.0) | 78.0 (65.0, 90.0) | 80.0 (66.0, 93.0) | 79.0 (60.5, 90.0) | 0.634 |
| Heart rate (times/min) | 92.0 (75.0, 111.0) | 90.0 (76.0, 112.0) | 88.0 (76.0, 106.50) | 91.0 (74.0, 112.5) | 0.969 |
| WBC (×109/L) | 7.9 (6.5, 10.6) ab | 7.5 (6.0, 9.8) b | 9.0 (7.2, 11.2) a | 9.5 (7.7, 12.1) a | 0.001 |
| PLT (×109/L) | 196.5 (163.5, 222.5) | 195.0 (155.0, 238.0) | 196.0 (150.0, 238.5) | 223.0 (164.0, 259.0) | 0.102 |
| MPV, fL | 10.9 (10.3, 12.1) | 10.8 (10.0, 11.7) | 11.0 (10.2, 12.0) | 10.9 (10.1, 11.9) | 0.688 |
| PDW, % | 15.8 (12.7, 16.5) | 15.9 (12.9, 16.5) | 15.8 (13.4, 16.5) | 15.7 (13.4, 16.3) | 0.985 |
| Plateletcrit, % | 0.2 (0.1, 0.2) ac | 0.2 (0.1, 0.2) a | 0.2 (0.1, 0.2) ac | 0.2 (0.2, 0.3) bc | 0.044 |
| Hemoglobin, g/L | 136.4 |
138.6 |
134.6 |
133.8 |
0.397 |
| RDW, % | 12.8 (12.4, 13.3) | 12.7 (12.4, 13.1) | 12.9 (12.6, 13.4) | 12.9 (12.5, 13.4) | 0.257 |
| Prothrombin Time, s | 12.2 (11.6, 12.9) ab | 11.9 (11.3, 12.5) b | 12.2 (11.5, 12.6) b | 12.7 (12.0, 13.5) a | |
| Calcium, mmol/L | 2.2 (2.1, 2.3) | 2.2 (2.2, 2.3) | 2.2 (2.1, 2.3) | 2.2 (2.1, 2.3) | 0.195 |
| Potassium, mmol/L | 3.9 (3.8, 4.1) | 3.7 (3.6, 4.1) | 3.9 (3.7, 4.1) | 3.9 (3.6, 4.1) | 0.306 |
| BUN, mmol/L | 5.2 (4.5, 7.2) | 5.3 (4.2, 6.9) | 5.1 (4.2, 6.6) | 5.6 (4.6, 7.7) | 0.444 |
| Uric acid, µmol/L | 353.0 (295.8, 418.3) | 369.0 (302.0, 412.0) | 325.0 (260.5, 404.5) | 375.0 (275.0, 471.5) | 0.211 |
| Creatinine, µmol/L | 74.0 (64.0, 81.0) | 73.5 (65.0, 86.0) | 72.0 (62.0, 83.0) | 75.0 (64.0, 92.5) | 0.801 |
| Albumin, g/L | 39.7 (3.5) | 40.2 (3.3) | 39.3 (4.1) | 38.7 (3.9) | 0.119 |
| Globulin, g/L | 24.9 (22.4, 27.0) a | 25.9 (23.5, 28.4) ac | 25.6 (24.0, 28.3) ac | 28.1 (24.9, 31.3) bc | |
| TC, mmol/L | 4.5 (3.9, 5.1) | 4.2 (3.5, 5.0) | 4.5 (3.9, 5.1) | 4.3 (3.8, 5.1) | 0.338 |
| TG, mmol/L | 1.3 (1.0, 1.8) | 1.4 (1.1, 2.4) | 1.2 (0.9, 1.8) | 1.4 (1.0, 1.8) | 0.210 |
| Troponin I, ng/mL | 7.0 (1.4, 78.4) | 4.6 (1.1, 32.1) | 15.5 (1.6, 48.3) | 10.0 (2.2, 31.1) | 0.763 |
| NT-proBNP, pg/mL | 789.8 (234.5, 971.8) b | 971.8 (371.5, 1450.0) bc | 971.8 (553.0, 2100.0) ac | 1521.0 (971.8, 4302.0) a | |
| LVEF, % | 48.5 (45.0, 59.8) ac | 54.0 (48.0, 60.5) a | 51.0 (45.0, 60.0) ac | 48.0 (41.0, 57.0) bc | 0.024 |
| MINOCA, n (%) | 28 (38.9) a | 29 (39.7) a | 14 (19.7) a | 16 (22.5) a | 0.010 |
Data are presented as mean (SD), median (Q1, Q3), or number of patients (%), as appropriate.
Q1, first quartile; Q2,
second quartile; Q3, third quartile; Q4, fourth quartile. All pairwise
comparisons were conducted using one-way ANOVA or the Kruskal-Wallis test,
followed by Bonferroni post hoc correction, or chi-square partitioning with a
Bonferroni-adjusted significance threshold of p
The association between plasma fibrinogen levels and the risk of MINOCA was
further evaluated by stratifying participants into quartiles and applying
logistic regression models, as shown in Table 4. The lowest fibrinogen quartile
(Q1,
| Models | OR (95% CI) | p for trend | |||
| Q1 ( |
Q2 (2.66–3.17) | Q3 (3.17–3.84) | Q4 ( | ||
| N = 72 | N = 73 | N = 71 | N = 71 | ||
| Model 1 | 1.0 | 1.036 (0.532–2.017) | 0.386 (0.182–0.819) | 0.457 (0.220–0.950) | 0.005 |
| p value | 0.918 | 0.013 | 0.036 | ||
| Model 2 | 1.0 | 1.023 (0.520–2.015) | 0.400 (0.186–0.863) | 0.396 (0.186–0.844) | 0.003 |
| p value | 0.947 | 0.019 | 0.016 | ||
| Model 3 | 1.0 | 0.875 (0.435–1.760) | 0.403 (0.184–0.881) | 0.403 (0.185–0.878) | 0.005 |
| p value | 0.708 | 0.023 | 0.022 | ||
| Model 4 | 1.0 | 0.722 (0.316–1.652) | 0.303 (0.123–0.745) | 0.371 (0.153–0.902) | 0.006 |
| p value | 0.441 | 0.009 | 0.029 | ||
Model 1: crude, no adjustment; Model 2: adjusting for age and sex; Model 3: adjusting for age, sex, ST-segment elevation, and diabetes mellitus; Model 4: adjusting for age, sex, ST-segment elevation, diabetes mellitus, troponin I, and left ventricular ejection fraction.
Stratified analyses were conducted across key clinical subgroups to explore the
robustness of the association between fibrinogen and MINOCA. The results are
summarized in Table 5. Statistically significant associations were observed among
patients aged
| Variables | OR (95% CI) | p for interaction | |
| Age, years | 0.385 | ||
| 0.557 (0.357–0.868) | |||
| 0.736 (0.471–1.151) | |||
| Sex | 0.477 | ||
| Male, N = 221 | 0.582 (0.388–0.873) | ||
| Female, N = 66 | 0.716 (0.416–1.231) | ||
| ST-segment elevation | 0.127 | ||
| Yes, N = 144 | 0.838 (0.533–1.316) | ||
| No, N = 143 | 0.502 (0.313–0.806) | ||
| Diabetes mellitus | 0.268 | ||
| Yes, N = 65 | 0.498 (0.198–1.247) | ||
| No, N = 222 | 0.679 (0.482–0.957) | ||
| Troponin I, ng/mL | 0.088 | ||
| 0.547 (0.371–0.806) | |||
| 1.208 (0.665–2.194) | |||
| LVEF, % | 0.108 | ||
| 0.758 (0.421–1.365) | |||
| 0.532 (0.355–0.798) | |||
Analyses were adjusted for age, sex, ST-segment elevation, diabetes mellitus, troponin I, and left ventricular ejection fraction, except when used as stratification variables. Interaction terms were also assessed for fibrinogen with these covariates, with adjustments for the same variables. Troponin I was categorized into two groups based on the overall median.
ROC analysis was performed as a supplementary evaluation, yielding an area under the curve (AUC) of 0.605 (95% CI: 0.534–0.675, p = 0.005), suggesting that fibrinogen alone has limited discriminatory ability for identifying MINOCA.
This study evaluated the association between plasma fibrinogen level and the risk of MINOCA. We found the fibrinogen level was significantly lower in patients with MINOCA compared to those with MI-CAD. In univariate and multivariate logistic regression analyses, lower fibrinogen level was independently associated with higher odds of MINOCA. Further analysis using fibrinogen quartiles revealed a consistent inverse trend, i.e., patients in higher fibrinogen quartiles exhibited a significantly lower risk of MINOCA, with a dose-response relationship confirmed across multiple adjusted models. This inverse association was further supported by RCS analysis, which demonstrated a significant overall linear trend. Subgroup analyses demonstrated this association remained stable across various clinical strata. Although fibrinogen alone had only limited predictive power, its significant independent association with MINOCA highlights its potential relevance as a pathophysiological or early identification marker.
MINOCA is now recognized as a distinct clinical entity within the AMI spectrum.
Unlike obstructive CAD, which is characterized by significant luminal narrowing
due to atherosclerotic plaque rupture, MINOCA occurs in the absence of
obstructive epicardial lesions (defined as
Fibrinogen is a key plasma glycoprotein involved in both thrombosis and inflammation, two fundamental processes in the pathophysiology of CAD. Upon vascular injury, fibrinogen is cleaved by thrombin to form fibrin, the backbone of the thrombus, which facilitates platelet aggregation by binding to glycoprotein IIb/IIIa receptors on activated platelets [21]. Additionally, fibrinogen serves as an acute-phase reactant, and its level is elevated in systemic inflammatory states. High fibrinogen levels have been consistently associated with an increased risk of atherosclerotic cardiovascular disease and AMI. Several studies have demonstrated that higher fibrinogen concentrations correlate with prothrombotic clot characteristics, such as dense fibrin networks with reduced permeability and resistance to fibrinolysis, which are predictive of worse cardiovascular outcomes [22]. These findings suggest that fibrinogen is not merely a biomarker of inflammation but also an active contributor to thrombus formation and stability, thus playing a dual role in the development and progression of CAD. Given these mechanistic links, fibrinogen may serve as a valuable indicator of thrombotic risk and a potential target for cardiovascular risk stratification. Inevitably, as the mechanisms of MINOCA may involve vascular inflammation, microvascular dysfunction, and transient thrombosis with spontaneous lysis, it is reasonable to consider that fibrinogen could also play a role in this distinct form of CAD.
Although fibrinogen has been extensively studied in obstructive MI, its relevance in the context of MINOCA is still not well defined. Unlike classic atherothrombotic mechanisms in MI-CAD, MINOCA encompasses diverse etiologies such as coronary vasospasm, microvascular dysfunction, and spontaneous thrombolysis, where the thrombotic burden may be less prominent or qualitatively different. A previous study suggested a higher prevalence of prothrombotic conditions, including antiphospholipid syndrome (APS), among MINOCA patients, particularly in younger and non-STEMI subgroups [23]. In contrast, another investigation found no significant differences in thrombin generation potential between MINOCA and MI-CAD patients, meaning the thrombotic burden in MINOCA is still an open question [24]. These uncertainties further obscure the role of fibrinogen in MINOCA. A recent meta-analysis reported elevated fibrinogen levels in MINOCA patients compared to those with MI-CAD [25]. On the contrary, the present study revealed that MINOCA patients had significantly lower fibrinogen concentrations compared to those with MI-CAD. This inverse association remained robust after multivariable adjustment and across multiple subgroups. One reason for this discrepancy may be the diagnostic approach. Prior study used a working diagnosis of MINOCA, which could include cases of non-ischemic myocardial injury, such as myocarditis or Takotsubo syndrome. In our study, MINOCA was further confirmed by CMR, thereby minimizing confounding factors and providing a clearer picture of fibrinogen levels in this group. Several plausible mechanisms could underlie our observation. First, in the absence of overt plaque rupture or large-vessel thrombosis, as seen in many MINOCA cases, there may be less acute-phase stimulation or fibrinogen consumption. Second, the inflammatory response may be less intense in vasospasm- or microvascular-driven MINOCA than in MI-CAD. Third, subclinical coagulopathies, endothelial dysfunction, or early thrombus lysis may contribute to a lower circulating fibrinogen profile. Collectively, these mechanisms suggest that low fibrinogen levels may reflect a distinct biological phenotype within the MINOCA population, potentially related to non-obstructive and non-thrombotic pathways.
Previous studies have consistently reported that MINOCA disproportionately affects females [2, 3, 4]. Several underlying mechanisms have been proposed to contribute to this sex-specific vulnerability, including CMD, endothelial dysfunction, and hormonal influences, such as estrogen-mediated vasomotor modulation. Female patients with MINOCA are also more likely to exhibit non-classical presentations, such as atypical chest pain or emotional triggers, and may have a higher prevalence of coronary vasospasm than male patients. In our study, although the proportion of female patients in the MINOCA group was higher than in the MI-CAD group (29.9% vs. 20.0%), the difference did not reach statistical significance (p = 0.067). Our findings appear to contradict the prevailing notion of a female predominance in MINOCA. Several factors may underlie this finding in our cohort. First, the relatively modest sample size, particularly for the female subgroup (n = 66), may have limited the statistical power to detect sex-based differences. Second, the use of CMR-confirmed criteria rather than a working diagnosis, while enhancing diagnostic specificity, may have diluted the apparent female predominance. Third, our cohort may underrepresent specific female-predominant pathophysiological subtypes of MINOCA, such as SCAD or CMD. Accordingly, considering the established relevance of sex-based mechanisms in MINOCA, sex was purposely included as an adjustment factor in our multivariate models to enhance the robustness of the observed association between fibrinogen and MINOCA.
We found that lower plasma fibrinogen levels were independently associated with the occurrence of MINOCA. This inverse relationship, which differs from the well-described positive association of fibrinogen with obstructive CAD and MI, suggests that fibrinogen may reflect a distinct biological phenotype within the MINOCA spectrum, in which inflammation and thrombotic load are qualitatively different. Further research into the causal role of fibrinogen across different pathophysiological subtypes of MINOCA could provide new perspectives, potentially supporting a fibrinogen-driven approach to more individualized clinical management within this entity of AMI.
Several limitations must be acknowledged. First, the study employed a retrospective, single-center design with a moderate sample size, which may limit the generalizability of our findings. Second, the lack of intracoronary imaging (e.g., OCT, IVUS) limited the investigation of mechanisms underlying individual cases of MINOCA to determine whether the association of fibrinogen differs across specific pathophysiological subtypes. Third, the lack of serial fibrinogen measurements limited the assessment of its dynamic changes and potential causal links with MINOCA.
Future studies should include larger, prospective, multicenter cohorts to validate our findings. In addition, evaluating longitudinal changes in fibrinogen and their associations with distinct pathophysiological subtypes of MINOCA may provide deeper mechanistic insights and help clarify causal relationships. Such knowledge could ultimately support more personalized and mechanism-based management strategies for MINOCA patients. Furthermore, the development of multi-marker models incorporating fibrinogen and other readily available clinical parameters may enhance the early recognition of MINOCA in routine practice.
In this retrospective study, lower plasma fibrinogen levels were independently associated with the occurrence of MINOCA, and this inverse relationship remained robust after multivariable adjustment and across clinical subgroups. Although fibrinogen alone shows limited discriminatory power, its biological plausibility suggests that it may serve as an adjunctive biomarker for the early recognition of MINOCA.
The datasets in our study are available from the corresponding author upon reasonable request.
ZQX, DL, ZPJ, and JJD were responsible for data collection and analysis. ZQX and DL drafted the initial version of the manuscript. All authors contributed to the conception and design of the study. All authors critically revised the manuscript for important intellectual content, approved the final version, and agree to be accountable for all aspects of the work.
The study was carried out in accordance with the guidelines of the Declaration of Helsinki and approved by the Ethics Committee of Aoyang Hospital (Ethics Approval No. 011, 2024). Given the study’s retrospective nature, informed consent was waived.
Not applicable.
This work was supported by the Science and Technology Project of Zhangjiagang City (ZKYL2347), the Zhangjiagang City Health Youth Science and Technology Project (ZJGQNKJ202255, ZJGQNKJ202113), and Suzhou Science and Technology Development Plan (SKJYD2021006).
The authors declare no conflict of interest.
Supplementary material associated with this article can be found, in the online version, at https://doi.org/10.31083/RCM42845.
References
Publisher’s Note: IMR Press stays neutral with regard to jurisdictional claims in published maps and institutional affiliations.