


 , Tao Wang 2, Qin Wei 1, Qing Hao 3, Fuchao Yu 1, Xuan Xu 1, Penghao Zhen 1
1 Department of Cardiology, Zhongda Hospital, School of Medicine, Southeast University, 210009 Nanjing, Jiangsu, China
2 Department of Cardiology, The First Affiliated Hospital of Soochow University, 215006 Suzhou, Jiangsu, China
3 State Key Laboratory of Bioelectronics, School of Biological Science and Medical Engineering, Southeast University, 211100 Nanjing, Jiangsu, China
Abstract
Despite advances in treatment and the potential role of serum albumin as a prognostic biomarker, the mortality rate of individuals with coronary heart disease (CHD) continues to increase. Thus, this study aimed to assess the relationship between serum albumin levels and the risk of all-cause mortality and cardiovascular death in individuals with CHD.
This large-scale retrospective cohort study included 1556 participants diagnosed with CHD from the National Health and Nutrition Examination Survey spanning 1999 to 2015. We conducted multivariate Cox regression, subgroup and sensitivity analyses, and restricted cubic spline (RCS) plots to examine the link between serum albumin levels and all-cause mortality and cardiovascular death.
After gradually adjusting the confounding variables, serum albumin consistently demonstrated a strong link to increased overall and cardiovascular-related mortality risk when employed as a continuous variable (hazard ratio [HR]: 0.938, 95% confidence interval [CI]: 0.912–0.964; p < 0.001; HR: 0.921, 95% CI: 0.884–0.960; p < 0.001; respectively); meanwhile, serum albumin as a three-category variable, with Tertile 1 (T1, ≤40 g/L), Tertile 2 (T2, 40–43 g/L), and Tertile 3 (T3, >43 g/L), was only closely related to the risk of all-cause death (T2 vs. T1, HR: 0.771, 95% CI: 0.633–0.939; p = 0.010; T3 vs. T1, HR: 0.761, 95% CI: 0.612–0.947; p = 0.014; respectively). Subgroup analysis showed that serum albumin was linked to all-cause mortality across most groups (≤60 or >60 years, male or female, and without hypertension, diabetes, or chronic kidney disease); however, its correlation with cardiovascular death was observed only in the subgroup without hypertension (p < 0.05). The sensitivity analysis indicated that excluding participants with an estimated glomerular filtration rate <30 mL/min/1.73 m2 did not alter the association between serum albumin and the risk of all-cause and cardiovascular mortality. Moreover, the RCS analysis further supported a consistent negative linear trend between serum albumin levels and mortality risks (p for nonlinearity >0.05).
The serum albumin levels in individuals with CHD were inversely and linearly related to all-cause mortality and cardiovascular death risk.
Keywords
- coronary heart disease
- serum albumin
- cardiovascular disease
- cardiovascular death
- all-cause death
Cardiovascular disease (CVD) has become one of the most important public health problems in the world, and it is also one of the most important causes of death in the world, among which the prevalence and mortality of coronary heart disease (CHD) are the highest [1, 2]. Although the medical treatment and surgical treatment of CHD have become standardized, the prognosis is still not optimistic, and the mortality rate is still gradually rising in patients with CHD [3]. Therefore, screening and early intervention of reversible risk factors is very important to improve the prognosis and quality of life of patients with CHD.
Serum albumin is the most abundant multifunctional protein in the blood. It not only plays a vital role in the regulation of colloid osmotic pressure, but also has antioxidant properties, and can also respond to various diseases as an acute phase reaction protein [4, 5, 6, 7]. However, unlike other acute phase reactive proteins, its concentration is at a low level in the acute phase [5]. In addition, albumin is a biomarker reflecting nutritional status. Hypoalbuminemia is due mainly to the decline in liver synthesis, decreased intake and chronic inflammation, which can be seen in many diseases [8, 9]. Recent research has indicated that serum albumin is strongly associated with the outcome and mortality of many chronic diseases, including cirrhosis, chronic heart failure and chronic obstructive pulmonary disease [10, 11, 12, 13, 14, 15]. Moreover, serum albumin and its composite indicators play a significant role in assessing cardiovascular risk and predicting clinical outcomes [16]. Several studies have demonstrated that serum albumin, whether used alone or in combination with other clinical parameters, is strongly associated with no-reflow and new-onset atrial fibrillation following percutaneous coronary intervention in patients with acute myocardial infarction [17, 18]. It has also been linked to left ventricular hypertrophy in individuals with hypertension [19]. Additionally, lower albumin levels have been shown to predict long-term all-cause mortality in patients with dual-chamber permanent pacemakers [20]. However, the relationship between serum albumin and mortality risk in patients with coronary heart disease remains unclear.
Therefore, based on the current research background and knowledge gaps, and to provide therapeutic strategies for the management of albumin in the prognosis of CHD, we used data from the 1999–2015 National Health and Nutrition Examination Survey (NHANES), to examine the association between serum albumin levels and the death risks for CHD patients.
As outlined in Fig. 1, based on data from the NHANES between 1999 and 2015, a
total of 1556 individuals were included. Inclusion criteria: (1) Adults aged
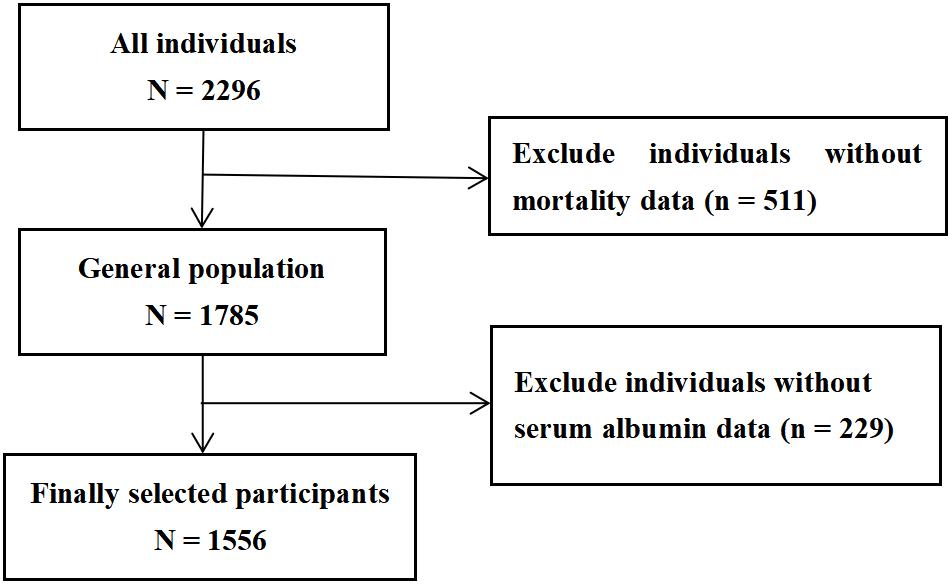 Fig. 1.
Flow chart of selected participants.
This research is a retrospective cohort study based on cross-sectional NHANES data linked to mortality records from the National Death Index (NDI). The fundamental step was gathering baseline data, which was carried out in line with the pre-determined research design. The collected data covered various aspects, including demographic information, physical examination data, details about complications, drug treatment records, and biomarker data. For instance, smoking status was simply categorized as a binary variable—whether an individual was currently smoking or not.
Hypertension was defined by a documented diagnosis, elevated systolic blood
pressure (SBP
Participants in the study were tracked from the date of their initial NHANES interview until December 31, 2015. During this follow-up period, the outcomes assessed were all-cause mortality and cardiovascular death, which were classified using ICD-10 codes. This period allowed for the collection of comprehensive data on mortality risks, offering valuable insights into the long-term health implications of the variables under study. The use of ICD-10 coding ensured standardized and reliable classification of the causes of death, which was essential for the analysis of mortality patterns in the cohort.
For this analysis, participants were grouped based on serum albumin tertiles: T1
(
As presented in Table 1, individuals with higher serum albumin levels were
younger, were more likely to be males, had a lower prevalence of diabetes and
all-cause mortality, uses significantly less hypoglycemic drugs, had lower BMI,
lower levels of white blood cell, platelets, fibrinogen, CRP, FPG, HbA1c, and
higher levels of DBP, triglycerides, total cholesterol, hemoglobin, abnormal
liver function and eGFR (p
| All participants | T1 ( |
T2 (40–43 g/L) | T3 ( |
p value | ||
| N | 1556 | 522 | 568 | 466 | ||
| Age, years | 68.66 |
69.58 |
69.20 |
66.96 |
0.001 | |
| Sex, male, n (%) | 1048 (67.40) | 316 (60.50) | 388 (68.30) | 344 (73.80) | ||
| Smoking, n (%) | 0.110 | |||||
| Yes | 268 (17.20) | 109 (20.90) | 89 (15.70) | 70 (15.00) | ||
| No | 735 (47.20) | 236 (45.20) | 271 (47.70) | 228 (48.90) | ||
| Missing | 553 (35.50) | 177 (33.90) | 208 (36.60) | 168 (36.10) | ||
| Comorbidities, n (%) | ||||||
| Hypertension | 0.094 | |||||
| Yes | 1125 (72.30) | 394 (75.50) | 405 (71.30) | 326 (70.00) | ||
| No | 425 (27.30) | 124 (23.80) | 162 (28.50) | 139 (29.80) | ||
| Missing | 6 (0.40) | 4 (0.80) | 1 (0.20) | 1 (0.20) | ||
| Diabetes | ||||||
| Yes | 491 (31.60) | 204 (39.10) | 178 (31.30) | 109 (23.40) | ||
| No | 1063 (68.30) | 318 (60.90) | 390 (68.70) | 355 (76.20) | ||
| Missing | 2 (0.10) | 0 (0) | 0 (0) | 2 (0.40) | ||
| Hypercholesterolemia | 0.315 | |||||
| Yes | 1046 (67.20) | 336 (64.40) | 395 (69.50) | 315 (67.60) | ||
| No | 429 (27.60) | 152 (29.10) | 147 (25.90) | 130 (27.90) | ||
| Missing | 81 (5.20) | 34 (6.50) | 26 (4.60) | 21 (4.50) | ||
| Stroke | 0.162 | |||||
| Yes | 238 (15.30) | 92 (17.60) | 89 (15.70) | 57 (12.20) | ||
| No | 1316 (84.60) | 429 (82.20) | 478 (84.20) | 409 (87.80) | ||
| Missing | 2 (0.10) | 1 (0.20) | 1 (0.10) | 0 (0) | ||
| Treatment, n (%) | ||||||
| Hypotensive drugs | 0.266 | |||||
| Yes | 1025 (65.90) | 358 (68.60) | 367 (64.60) | 300 (64.40) | ||
| No | 476 (30.60) | 144 (27.60) | 178 (31.30) | 154 (33.00) | ||
| Missing | 55 (3.50) | 20 (3.80) | 23 (4.00) | 12 (2.60) | ||
| Hypoglycemic drugs | ||||||
| Yes | 458 (29.40) | 197 (37.70) | 165 (29.00) | 96 (20.60) | ||
| No | 1097 (70.50) | 325 (62.30) | 403 (71.00) | 369 (79.20) | ||
| Missing | 1 (0.10) | 0 (0) | 0 (0) | 1 (0.20) | ||
| Cholesterol-lowering drugs | 0.167 | |||||
| Yes | 916 (58.90) | 291 (55.70) | 357 (62.90) | 268 (57.50) | ||
| No | 478 (30.70) | 170 (32.60) | 158 (27.80) | 150 (32.20) | ||
| Missing | 162 (10.40) | 61 (11.70) | 53 (9.30) | 48 (10.30) | ||
| Body mass index, kg/m2 | 29.41 |
30.59 |
29.40 |
28.13 |
||
| Systolic blood pressure, mmHg | 132.69 |
132.32 |
132.06 |
133.85 |
0.404 | |
| Diastolic blood pressure, mmHg | 66.97 |
65.00 |
67.17 |
68.83 |
||
| Triglycerides, mmol/L | 1.46 (1.03, 2.15) | 1.40 (0.95, 2.06) | 1.60 (1.14, 2.32) | 1.67 (1.16, 2.33) | 0.020 | |
| Total cholesterol, mmol/L | 4.69 |
4.55 |
4.71 |
4.82 |
0.002 | |
| LDL‑C, mmol/L | 2.58 |
2.49 |
2.60 |
2.66 |
0.150 | |
| HDL‑C, mmol/L | 1.24 |
1.24 |
1.23 |
1.25 |
0.777 | |
| White blood cell, ×109/L | 7.42 |
7.63 |
7.44 |
7.18 |
0.023 | |
| Hemoglobin, g/dL | 14.03 |
13.43 |
14.13 |
14.58 |
||
| Platelets, ×109/L | 227.91 |
234.26 |
227.28 |
221.56 |
0.015 | |
| Alanine transaminase, U/L | 21.00 (16.00, 27.00) | 19.00 (15.00, 25.00) | 21.50 (18.00, 26.25) | 24.00 (18.00, 30.00) | ||
| Aspartate aminotransferase, U/L | 24.00 (20.00, 28.00) | 22.00 (19.00, 27.00) | 23.50 (20.00, 28.25) | 26.00 (22.00, 31.00) | ||
| Total bilirubin, umol/L | 12.74 |
11.79 |
12.87 |
13.63 |
||
| eGFR, mL/min/1.73 m2 | 77.79 |
70.80 |
78.94 |
84.23 |
||
| Fibrinogen, g/L | 4.03 |
4.48 |
3.99 |
3.80 |
||
| C-reactive protein, mg/L | 0.26 (0.12, 0.61) | 0.39 (0.15, 0.92) | 0.25 (0.11, 0.52) | 0.20 (0.08, 0.37) | ||
| Fasting plasma glucose, mmol/L | 6.85 |
7.13 |
6.95 |
6.37 |
0.005 | |
| Hemoglobin A1c, % | 6.20 |
6.48 |
6.17 |
5.92 |
||
| Outcomes, n (%) | ||||||
| All-cause death | 0.001 | |||||
| Yes | 604 (38.80) | 238 (45.60) | 201 (35.40) | 165 (35.40) | ||
| No | 952 (61.20) | 284 (54.40) | 367 (64.60) | 301 (64.60) | ||
| Cardiovascular death | 0.174 | |||||
| Yes | 244 (15.70) | 92 (17.60) | 90 (15.80) | 62 (13.30) | ||
| No | 1312 (84.30) | 430 (82.40) | 478 (84.20) | 404 (86.70) | ||
Missing values for smoking, comorbidities, and medication use were shown in the table. LDL-C, low-density lipoprotein cholesterol; HDL-C, high-density lipoprotein cholesterol; eGFR, estimated glomerular filtration rate.
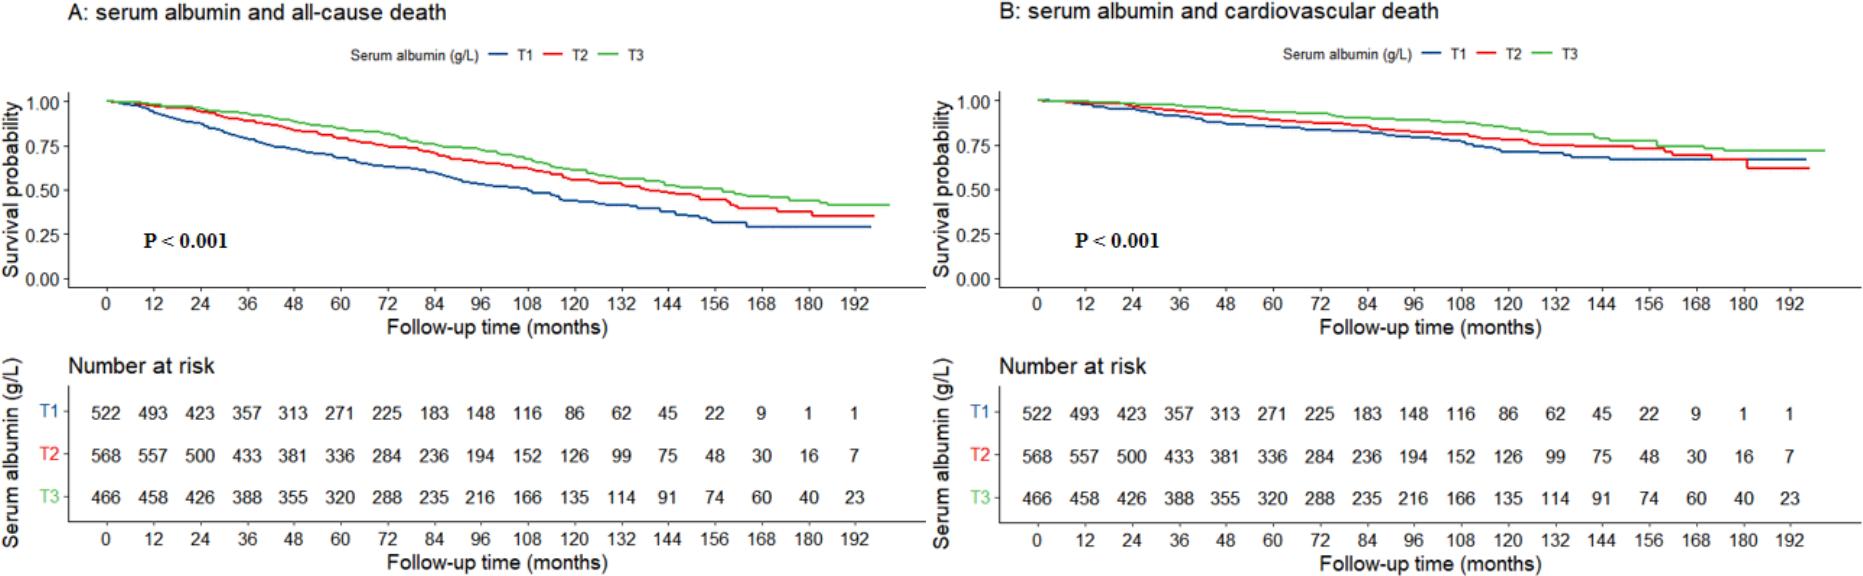 Fig. 2.
The association between serum albumin levels and all-cause mortality (A) as well as cardiovascular death (B) shown through Kaplan-Meier survival curves.
As shown in Table 2. In the unadjusted model 1, the Cox regression analysis
indicated that elevated serum albumin levels were significantly associated with a
reduced risk of both all-cause and cardiovascular death. This relationship was
observed whether albumin was analyzed as a continuous or categorized variable.
For continuous measurements, the hazard ratios (HR) were 0.909 (95% CI:
0.889–0.930, p
| Model 1 | Model 2 | Model 3 | |||||
| HR (95% CI) | p value | HR (95% CI) | p value | HR (95% CI) | p value | ||
| All-cause death | |||||||
| T1 | Ref. | - | Ref. | - | Ref. | - | |
| T2 | 0.659 (0.546, 0.795) | 0.676 (0.560, 0.816) | 0.771 (0.633, 0.939) | 0.010 | |||
| T3 | 0.543 (0.444, 0.663) | 0.589 (0.482, 0.720) | 0.761 (0.612, 0.947) | 0.014 | |||
| per 1 unit increment | 0.909 (0.889, 0.930) | 0.908 (0.886, 0.930) | 0.938 (0.912, 0.964) | ||||
| Cardiovascular death | |||||||
| T1 | Ref. | - | Ref. | - | Ref. | - | |
| T2 | 0.765 (0.571, 1.023) | 0.071 | 0.785 (0.587, 1.050) | 0.103 | 0.893 (0.658, 1.211) | 0.466 | |
| T3 | 0.532 (0.385, 0.737) | 0.580 (0.418, 0.803) | 0.001 | 0.734 (0.518, 1.040) | 0.082 | ||
| per 1 unit increment | 0.904 (0.873, 0.936) | 0.905 (0.871, 0.940) | 0.921 (0.884, 0.960) | ||||
HR, hazard ratio.
Subgroup analysis of Table 3 revealed that serum albumin was linked to the
likelihood of mortality from all causes across several subgroups, including
participants aged
| All-cause death | Cardiovascular death | ||||||||||||
| T1 | T2 | T3 | T1 | T2 | T3 | ||||||||
| Ref. | HR (95% CI) | p value | HR (95% CI) | p value | p trend | Ref. | HR (95% CI) | p value | HR (95% CI) | p value | p trend | ||
| Age | |||||||||||||
| 1.0 | 0.375 (0.184, 0.765) | 0.007 | 0.442 (0.228, 0.859) | 0.016 | 0.012 | 1.0 | 0.879 (0.266, 2.909) | 0.833 | 1.099 (0.300, 4.019) | 0.887 | 0.936 | ||
| 1.0 | 0.816 (0.663, 1.005) | 0.055 | 0.766 (0.607, 0.966) | 0.025 | 0.052 | 1.0 | 0.913 (0.664, 1.255) | 0.575 | 0.721 (0.500, 1.040) | 0.080 | 0.203 | ||
| Sex | |||||||||||||
| Male | 1.0 | 0.815 (0.641, 1.035) | 0.094 | 0.717 (0.548, 0.937) | 0.015 | 0.045 | 1.0 | 1.045 (0.717, 1.523) | 0.819 | 0.844 (0.555, 1.284) | 0.429 | 0.536 | |
| Female | 1.0 | 0.641 (0.440, 0.934) | 0.021 | 0.899 (0.602, 1.343) | 0.603 | 0.060 | 1.0 | 0.659 (0.370, 1.174) | 0.157 | 0.563 (0.281, 1.130) | 0.106 | 0.185 | |
| Hypertension | |||||||||||||
| Yes | 1.0 | 0.789 (0.621, 1.003) | 0.053 | 0.772 (0.593, 1.005) | 0.055 | 0.081 | 1.0 | 0.975 (0.684, 1.390) | 0.890 | 0.837 (0.562, 1.248) | 0.383 | 0.647 | |
| No | 1.0 | 0.539 (0.374, 0.777) | 0.001 | 0.572 (0.387, 0.847) | 0.005 | 0.002 | 1.0 | 0.480 (0.249, 0.923) | 0.028 | 0.480 (0.230, 1.003) | 0.051 | 0.054 | |
| Diabetes | |||||||||||||
| Yes | 1.0 | 0.787 (0.563, 1.099) | 0.159 | 0.732 (0.490, 1.092) | 0.126 | 0.224 | 1.0 | 0.944 (0.572, 1.560) | 0.824 | 0.650 (0.338, 1.247) | 0.195 | 0.405 | |
| No | 1.0 | 0.749 (0.582, 0.965) | 0.026 | 0.744 (0.569, 0.973) | 0.031 | 0.041 | 1.0 | 0.942 (0.638, 1.390) | 0.762 | 0.844 (0.555, 1.284) | 0.427 | 0.723 | |
| Chronic kidney disease | |||||||||||||
| Yes | 1.0 | 0.734 (0.527, 1.022) | 0.067 | 0.790 (0.545, 1.145) | 0.214 | 0.150 | 1.0 | 0.759 (0.456, 1.264) | 0.289 | 0.855 (0.485, 1.505) | 0.587 | 0.560 | |
| No | 1.0 | 0.759 (0.587, 0.982) | 0.036 | 0.706 (0.532, 0.938) | 0.016 | 0.037 | 1.0 | 0.997 (0.666, 1.494) | 0.987 | 0.717 (0.451, 1.140) | 0.159 | 0.225 | |
| Model 1 | Model 2 | Model 3 | |||||
| HR (95% CI) | p value | HR (95% CI) | p value | HR (95% CI) | p value | ||
| All-cause death | |||||||
| T1 | Ref. | - | Ref. | - | Ref. | - | |
| T2 | 0.678 (0.557, 0.825) | 0.691 (0.567, 0.840) | 0.740 (0.603, 0.908) | 0.004 | |||
| T3 | 0.562 (0.456, 0.692) | 0.602 (0.488, 0.742) | 0.726 (0.580, 0.908) | 0.005 | |||
| p for trend | - | - | - | 0.005 | |||
| per 1 unit increment | 0.914 (0.892, 0.935) | 0.914 (0.891, 0.937) | 0.932 (0.906, 0.959) | ||||
| Cardiovascular death | |||||||
| T1 | Ref. | - | Ref. | - | Ref. | - | |
| T2 | 0.798 (0.588, 1.083) | 0.147 | 0.828 (0.610, 1.123) | 0.225 | 0.911 (0.662, 1.255) | 0.570 | |
| T3 | 0.555 (0.396, 0.779) | 0.001 | 0.612 (0.436, 0.859) | 0.005 | 0.734 (0.511, 1.055) | 0.095 | |
| p for trend | - | 0.002 | - | 0.016 | - | 0.236 | |
| per 1 unit increment | 0.913 (0.880, 0.948) | 0.912 (0.876, 0.950) | 0.923 (0.885, 0.962) | ||||
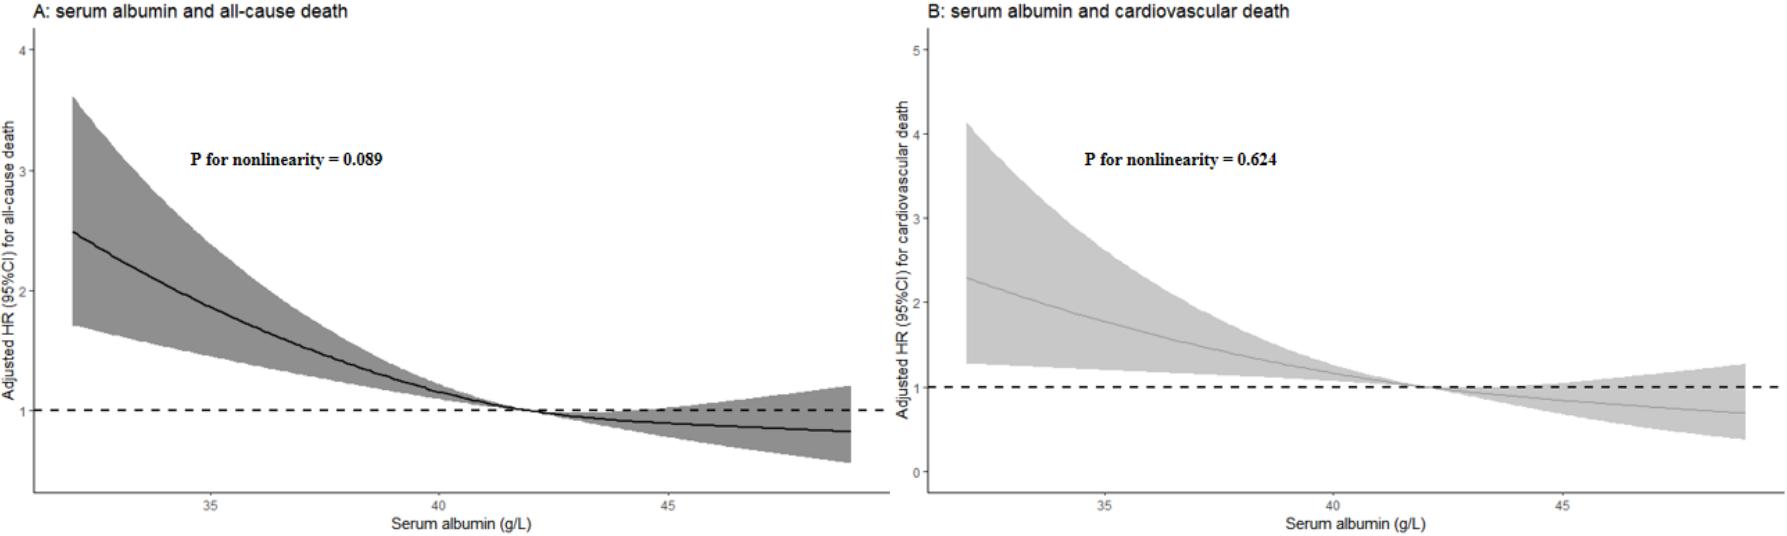 Fig. 3.
Restricted cubic spline plots showing the relationship between serum albumin levels and all-cause (A) as well as cardiovascular death (B).
In this large, retrospective cohort study, our findings indicated that serum albumin was significantly associated with both all-cause mortality and cardiovascular death among those suffering from CHD. Moreover, this association presented a linear negative correlation pattern. These results not only emphasized the significance of serum albumin in the prognostic assessment and care of CHD patients, but also suggested that for individuals with hypoalbuminemia, appropriate supplementation of exogenous albumin might have potential clinical value in improving the prognosis of patients with CHD and even CVD. However, whether higher concentrations of serum albumin will improve patient outcomes will require further study to identify those subgroups of patients who will benefit most from this therapy.
Several studies have verified the relationship between serum albumin and the
prognosis of certain chronic diseases. In a clinical trial involving 559
participants, Feng et al. [10] demonstrated an independent negative
correlation between 4-year all-cause mortality and baseline serum albumin levels
in heart failure patients. In a cohort study of 3398 patients with severe chronic
obstructive pulmonary disease, Ling et al. [11] identified a negative
relationship between serum albumin levels and in-hospital mortality. In a
case-control study of 1383 patients with nonalcoholic fatty liver diagnosed
hepatic biopsies, Takahashi et al. [23] found that individuals with
moderate or lower serum albumin levels had a higher likelihood of death or
requiring a liver transplant compared to those with higher serum albumin levels.
Another large prospective cohort study also reported that acute inpatients with
serum albumin levels
Our study has several limitations. First, the study population reflected a small percentage of the American population. Second, due to the limitations of population survey data, the research data did not include echocardiography and coronary angiography data. Thirdly, due to the limitation of the database, we failed to investigate the association between serum albumin and additional outcomes of individuals with CHD, such as major adverse cardiovascular events. Fourth, serum albumin levels were measured at baseline during the NHANES survey, while CHD diagnosis was based on self-reported or physician-confirmed history, meaning that albumin measurements may have occurred after the onset of CHD. This raises the possibility of reverse causality—where CHD itself may contribute to lower albumin levels through mechanisms such as chronic inflammation or malnutrition—potentially biasing the observed associations. Fifth, due to the limitations of the NHANES dataset, we were unable to compare serum albumin with other established cardiovascular biomarkers, such as B-type natriuretic peptide or high-sensitivity troponin, which were not systematically collected. This limits our ability to evaluate the relative prognostic value of albumin in the context of risk stratification. We have acknowledged this as a limitation and suggest that future studies incorporate a wider range of biomarkers for a more comprehensive assessment. Sixth, although our study covered a 16-year period, the NHANES dataset does not provide dynamic measures of serum albumin or detailed records of evolving CHD management strategies over time. As a result, we were unable to assess whether secular trends in albumin levels or treatment practices influenced the observed associations. We have acknowledged this limitation and suggest that future research based on long-term follow-up data is needed to explore the potential impact of temporal changes. Finally, we might have overlooked some potential risk factors, such as genetic susceptibility, socioeconomic status, dietary nutrition, and environmental factors, associated with increased risk in CHD patients.
In this retrospective cohort study utilizing the survey data from the general population, we discovered not only that serum albumin levels were significantly associated with the likelihood of all-cause and cardiovascular mortality in individuals with CHD, but also that this association exhibited a linear negative correlation pattern. These results help to define the effects of serum albumin on CVD, and remind us of the importance to monitor serum albumin levels in patients with CHD to improve the adverse outcomes of patients with CVD.
All raw data used in this study can be accessed on the NHANES website (https://wwwn.cdc.gov/nchs/nhanes/default.aspx).
JT: Conceptualization, Investigation, Data curation, Formal analysis, Visualization, Writing-original draft, Writing-review & editing, Validation, Funding acquisition, Project administration, Supervision. TW: Conceptualization, Methodology, Software, Data curation, Formal analysis, Writing-review and editing. QW, QH, FY, XX, and PZ: Conceptualization, Validation, Writing-review and editing. All authors contributed to editorial changes in the manuscript. All authors read and approved the final manuscript. All authors have participated sufficiently in the work and agreed to be accountable for all aspects of the work.
The research scheme was approved by the National Center for Health Statistics of the Center for Disease Control and Prevention Institutional Review Board (Protocol #98-12, #2005-06). Participants have signed the informed consent form. The research program and content were in line with the Declaration of Helsinki.
Not applicable.
This research received no external funding.
The authors declare no conflict of interest.
References
Publisher’s Note: IMR Press stays neutral with regard to jurisdictional claims in published maps and institutional affiliations.