


 , Meng Wei 1,2,†, Pengjie Xue 1,2, Yanmei Lu 1,2, Baopeng Tang 1,2,*
1 Department of Cardiac Pacing and Electrophysiology, The First Affiliated Hospital of Xinjiang Medical University, 830000 Urumqi, Xinjiang, China
2 Xinjiang Key Laboratory of Cardiac Electrophysiology and Cardiac Remodeling, The First Affiliated Hospital of Xinjiang Medical University, 830000 Urumqi, Xinjiang, China
†These authors contributed equally.
Abstract
The high prevalence and mortality rate of combined atrial fibrillation (AF) and obstructive sleep apnea syndrome (OSAS) impose a significant disease burden on public healthcare systems. However, there is currently a lack of risk-assessment tools for all-cause mortality in patients with both AF and OSAS. Therefore, this study utilized clinical data from patients at the First Affiliated Hospital of Xinjiang Medical University to establish a predictive model and address this gap.
This study included 408 patients with AF and OSAS, randomly divided into a training set (n = 285) and a validation set (n = 123). Subsequently, the training set was split into deceased and surviving groups to analyze in-hospital indicators.
A total 10 variables were selected from an initial 64 variables in patients with AF and OSAS identified through Lasso regression screening, including hypoxemia, catheter ablation (CA), red blood cell count (RBC), lymphocyte count, basophil granulocyte count, total bile acids, D-dimer, free triiodothyronine, N-terminal pro-brain natriuretic peptide (NT-proBNP), and chronic obstructive pulmonary disease. Variables identified as significant in the univariate logistic regression analysis were included in the multivariable logistic regression analysis, which revealed that CA (odds ratio (OR) = 0.21) was an independent protective factor. In contrast, moderate-to-severe hypoxemia (OR = 11.11), RBC <3.8 × 10¹²/L (OR = 20.70), and D-dimer ≥280 ng/mL (OR = 7.07) were independent risk factors. Based on this, receiver operating characteristic (ROC) curves were plotted, showing area under the curve (AUC) values of 0.96 for the training set and 0.91 for the validation set, indicating the model exhibited good predictive ability. A risk-scoring system was developed to assess the overall mortality risk of patients with AF and OSAS. The percentage bar chart demonstrated an increase in mortality rate and a decrease in survival rate as the risk level increased.
The predictive model and risk scoring system developed in this study exhibit good predictive abilities in evaluating all-cause mortality in patients with AF and OSAS, providing valuable clinical guidance and reference.
Keywords
- atrial fibrillation
- catheter ablation
- hypoxemia
- obstructive sleep apnea syndrome
Atrial fibrillation (AF) is one of the most common cardiac arrhythmias in adults, affecting 2–4% of the global adult population and 1.6% of Chinese adults [1, 2, 3]. Due to its frequent association with advanced age and comorbid chronic conditions (such as hypertension, diabetes, and obesity), the prevalence of AF has been progressively increasing annually [4, 5]. Obstructive sleep apnea syndrome (OSAS) is also a common chronic condition, being the most prevalent sleep-related breathing disorder; it is characterized by recurrent episodes of sleep apnea leading to periodic hypoxemia and hypercapnia [6]. Globally, OSAS affects over a billion people, with some countries experiencing prevalence rates exceeding 50% [7]. AF and OSAS often share common risk factors, including hypertension, coronary artery disease, and congestive heart failure (HF) [8]. The two are closely related, with an AF prevalence of approximately 21–87% among OSAS patients [5], and OSAS being present in about 50% of AF patients [9]. Having both AF and OSAS (AF + OSAS) can worsen patients’ outcomes; with a link between AF and higher mortality rates [10], severe OSAS is significantly associated with an increased risk of all-cause mortality in patients [11]. In addition to the above, AF + OSAS imposes significant economic burdens on patients’ families and the public healthcare system. In the United States, the annual cost of treating AF and its complications exceeds $28 billion [12], and a study in Italy indicated an annual treatment cost of over €234M for patients with OSAS [13].
For many years, antiarrhythmic drugs have been the mainstay of treatment for AF. Catheter ablation (CA), since the introduction of in 1994, has provided AF patients with additional treatment options and hope. A meta-analysis has shown that CA significantly reduces cardiovascular and all-cause mortality rates in AF patients [14], but the recurrence rate after CA in patients with AF + OSAS can be as high as 80% [15]. Continuous positive airway pressure (CPAP) therapy, the primary treatment for OSAS patients, has not yet shown an impact on survival rates in OSAS patients [16]. The effectiveness of current mainstream treatment options in improving all-cause mortality rates in patients with AF + OSAS remains unclear.
As mentioned earlier, both AF and OSAS are significantly associated with increased all-cause mortality rates, with intricate and complex underlying mechanisms. Despite this, effective preventive strategies for all-cause mortality in patients with AF + OSAS have not been established so far, which has raised significant concerns. With the aging population trend increasing the incidence of AF + OSAS, this undoubtedly places a heavy burden on the public healthcare system in terms of disease and economic pressure. To our knowledge, there is currently no dedicated risk-assessment tool for all-cause mortality in patients with AF + OSAS.
As the largest healthcare institution in the region, we have access to the highest quality healthcare resources and the largest patient population. Our medical center serves patients of various races and is equipped with a comprehensive Hospital Information System (HIS). Therefore, our research focused on using routine clinical characteristics, laboratory parameters, and imaging findings readily available in the HIS to construct predictive models and scoring systems. These tools were used to assess the all-cause mortality risk in patients with AF + OSAS, with the goal of optimizing patient prognosis and quality of life. Additionally, by identifying high-risk patients, healthcare professionals can adopt more proactive monitoring and intervention measures. Understanding the mechanisms of all-cause mortality in patients with AF + OSAS and developing new approaches to enhance survival rates is a promising area for future in-depth research.
The present study was a retrospective case-control study that included a total
of 446 patients with AF + OSAS who were hospitalized and diagnosed at the First
Affiliated Hospital of Xinjiang Medical University from January 1, 2012, to
August 31, 2024. The inclusion criteria for the study were: (1) age
This study was approved by the Ethics Committee of the First Affiliated Hospital of Xinjiang Medical University with the ethics review number K202409-07. Due to the retrospective nature of this study and data collection solely through the HIS, the application for exempting informed consent signing was granted by the Ethics Committee of the First Affiliated Hospital of Xinjiang Medical University. Furthermore, patient consent was obtained during telephone follow-ups, and those who did not consent were excluded from the study. The detailed patient selection process is shown in Fig. 1.
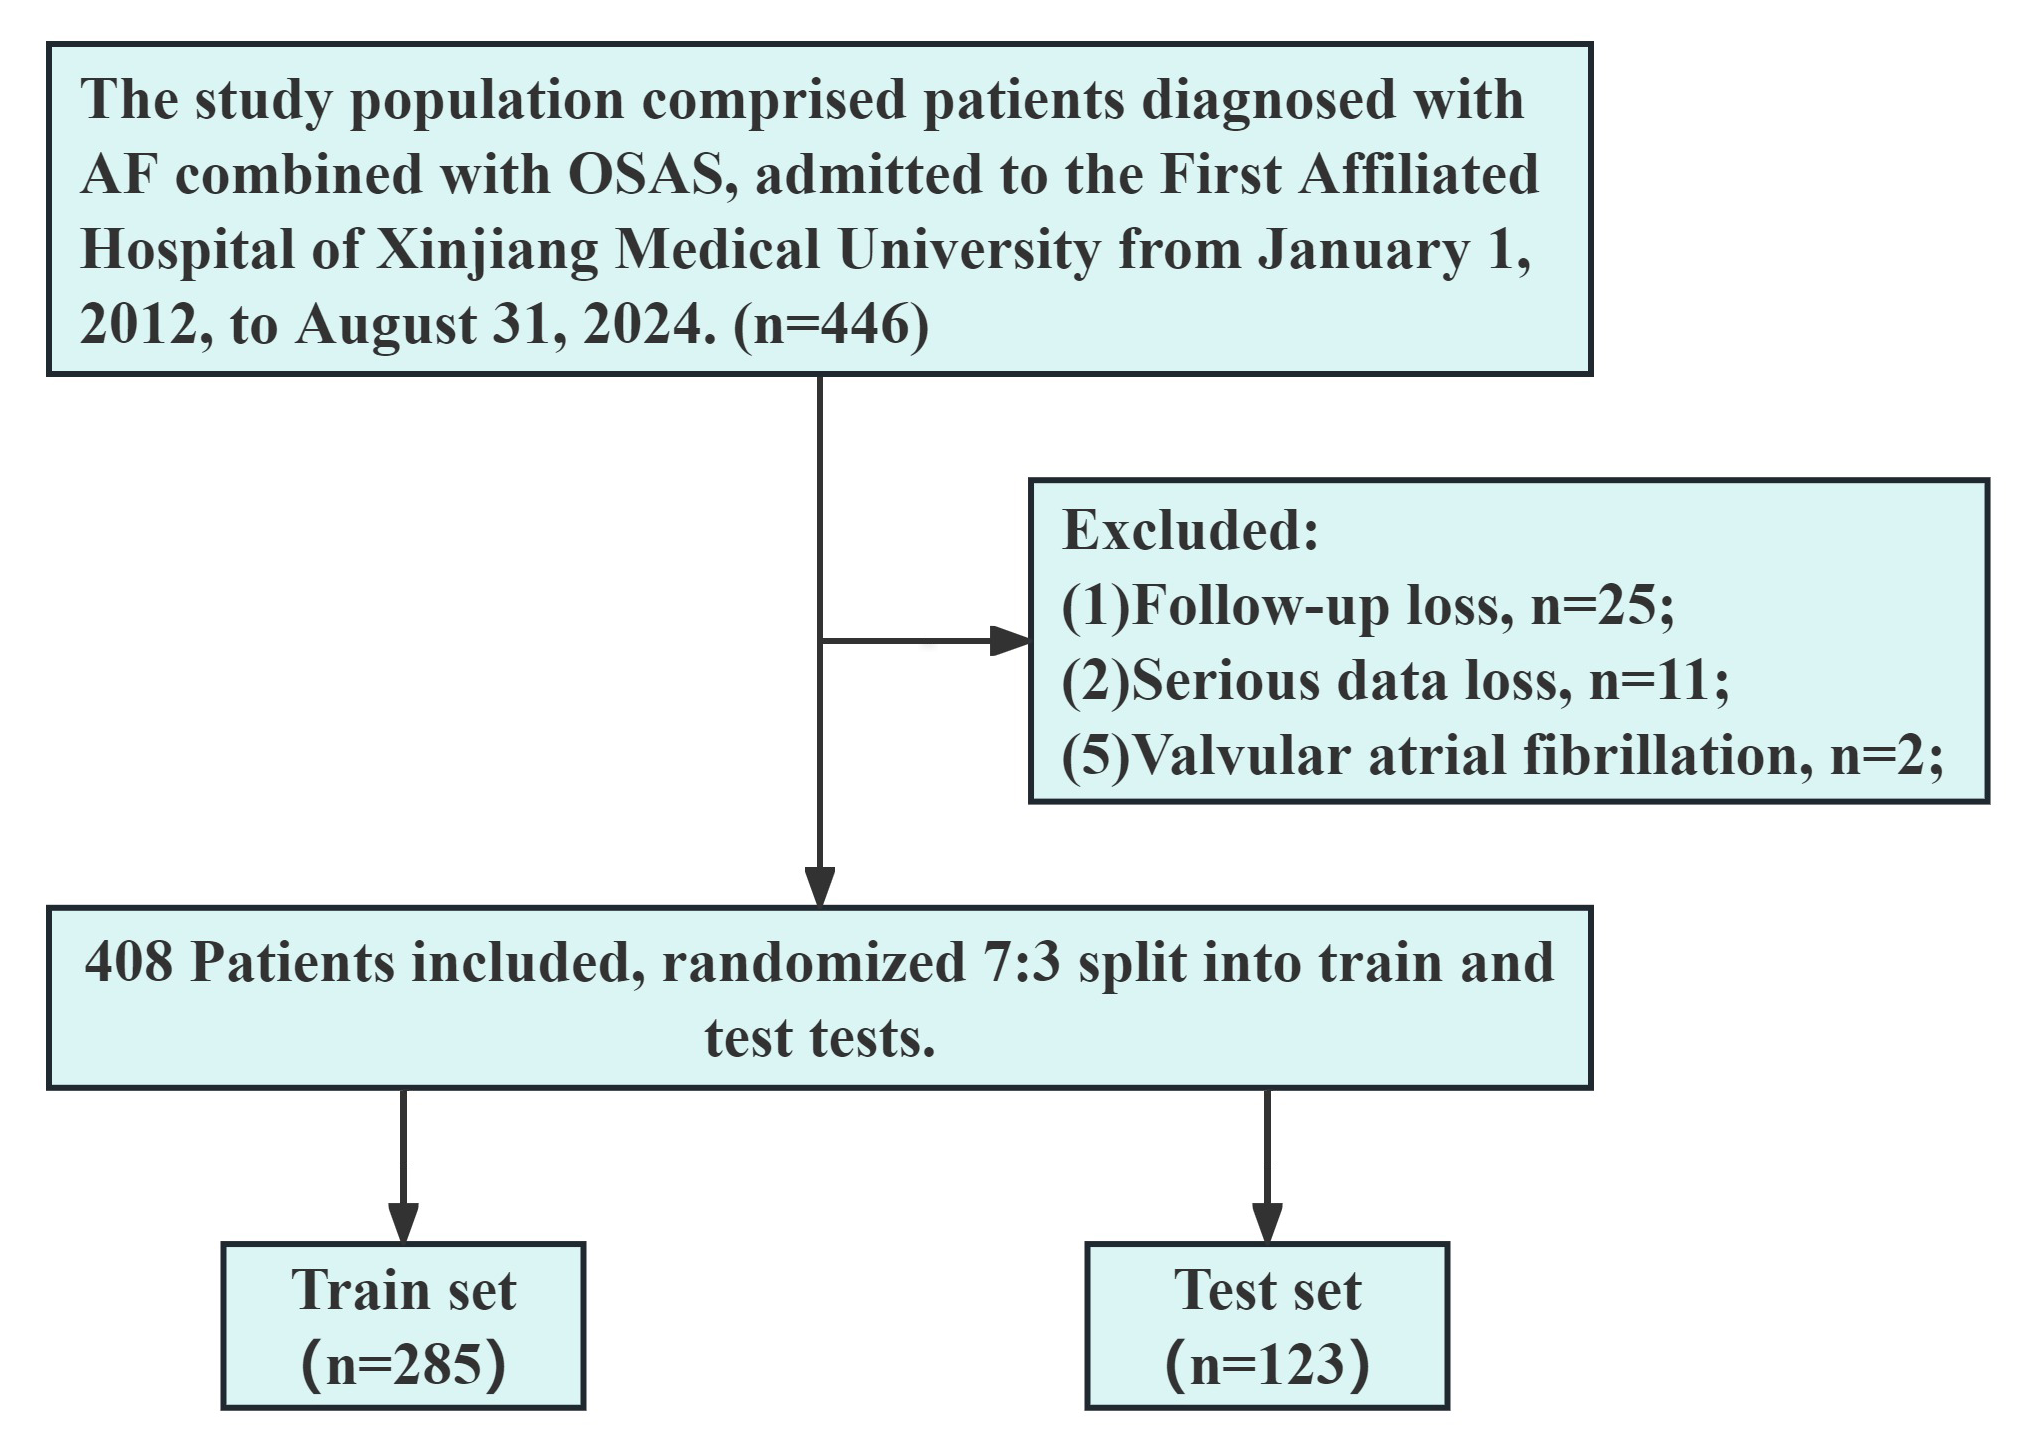 Fig. 1.
Flowchart outlining the screening process for study subjects. OSAS, obstructive sleep apnea syndrome; AF, atrial fibrillation.
The data were collected from the initial hospital admission records of patients
with AF + OSAS, including: (1) Basic characteristics: age, sex, smoking,
drinking; (2) Underlying diseases: hypertension, coronary artery disease,
diabetes, stroke, chronic obstructive pulmonary disease (COPD); (3) Physical
examination results: heart rate, lower extremity edema, body mass index, pulse
pressure difference ; (4) Examination findings: blood laboratory tests, noting
red blood cell count (RBC) and white blood cell counts, coefficient of variation
of red blood cell distribution width, counting of lymphocytes, monocytes,
neutrophils, eosinophils, basophil granulocyte (Baso), and platelets, hemoglobin;
Liver function tests: alanine and aspartate aminotransferases,
The outcome of the present study was the all-cause mortality rate of patients with AF + OSAS, which refers to the rate or occurrence of all deaths caused by any reasons during the study period [3]. The follow-up regarding patient mortality status was conducted by telephone contact and HIS.
Statistical analyses were performed using SPSS 22.0 (IBM Corp., Armonk, NY, USA) and R (version 4.2.1; R Foundation for Statistical Computing, Vienna, Austria). R packages (https://cran.r-project.org/) that were used included: glmnet [4.1.7]; pROC [1.18.0]; ggplot2 [3.3.6]; rms [6.4.0]; Resource Selection [0.3–5]; and rmda [1.6]. Statistical analysis of continuous variables was conducted using SPSS, with mean (SD) reported for normally distributed variables and independent sample t-tests for variables meeting the conditions for t-tests. Skewed variables were described using the median and interquartile range [P50 (P25, P75)], and between-group comparisons were performed using the Wilcoxon-Mann-Whitney test. Categorical variables were described as n (%) and between-group comparisons were performed using the Chi-square test or Fisher’s exact probability test.
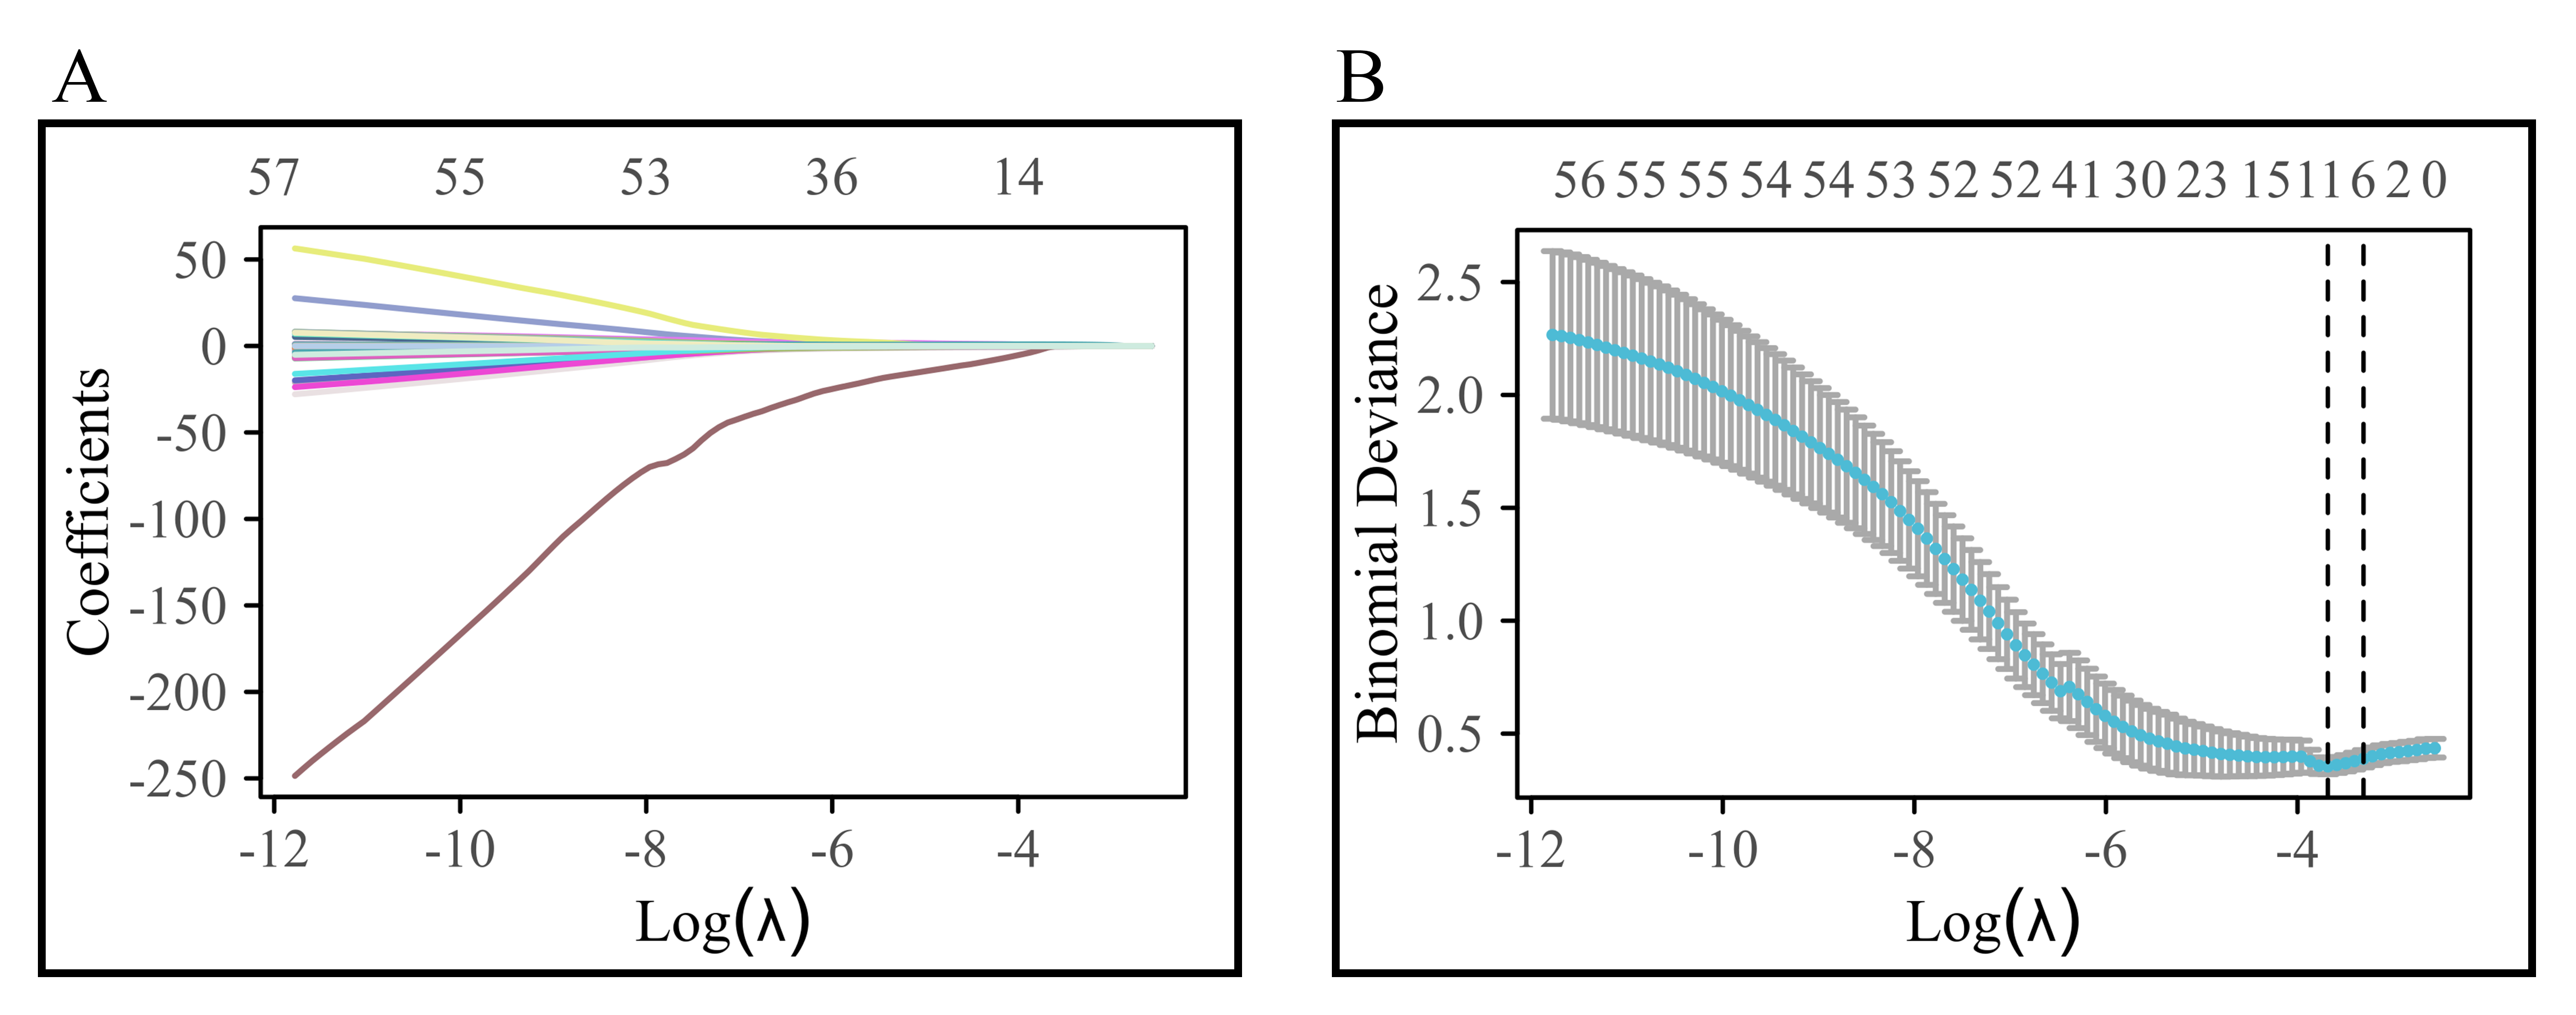
In the present study, data on a total of 64 variables were collected from patient records. Lasso regression, incorporating an L1 norm constraint into the cost function of the linear regression model, was used. Tuning of the lambda parameter was carried out to aid in variable selection and to adjust complexity. To address high-dimensional data and feature selection for constructing the logistic regression model, 10-fold cross-validation was used. Variable selection was guided by the optimal evaluation index represented by the lambda value (lambda.min). In the Lasso regression, we used a 10-fold cross-validation. We randomly allocated patients in a 7:3 ratio using a random number table, with the random number being 1. We developed the research model using the training set and then validated the model with the testing set. Further details on the diagnostic Lasso coefficient selection process and variable trajectory can be found in the initial section of the results.
The variables that were selected through Lasso regression were incorporated into
the study, with dummy variables assigned to the original variables. After that, a
univariate logistic regression analysis was performed on the dummy variables to
assess the patients’ all-cause mortality rates. Variables exhibiting a p
In this study, decision curve analysis (DCA) was used to assess the predictive performance of the clinical prediction model. Calibration analysis and visualization were performed by constructing a generalized linear model and establishing a binary logistic model to uncover discrepancies between predicted probabilities and actual observed outcomes, thereby evaluating the model’s goodness of fit. A diagnostic nomogram was developed by integrating predictive indicators with scaled line segments, which were plotted on a plane to elucidate the interrelationships among variables within the predictive model. The model’s calibration was evaluated using the Hosmer-Lemeshow Goodness-of-Fit Test.
Using the results of multivariate regression, a risk-score chart for all-cause
mortality in patients with AF + OSAS was constructed based on the risk-score
functions derived from The Framingham Study [17]. Furthermore, an analysis of
score impact was carried out. The
After Lasso regression selection, 10 variables were chosen from the initial 64 variables of patients with AF + OSAS, comprising: Hypoxemia, CA, RBC count, lymphocyte count, Baso count, TBA, D-dimer, FT3, NT-proBNP, and COPD. The variable trajectory and selection process of Lasso regression are illustrated in Fig. 2.
 Fig. 2.
Variable trajectory and selection process of Lasso regression. (A) shows the variable trajectory diagram; (B) shows the selection flowchart of Lasso regression.
Comparisons revealed no differences in all-cause mortality, CA, RBC count, lymphocyte count, Baso count, TBA, D-dimer, FT3, NT-proBNP, or COPD, both before and after assignment, between the training and testing sets. There were 23 patient deaths and 385 patient survivals in this study. The mortality rate of patients with AF and OSAS was 5.64%, with all-cause mortality rates of 6.67% in the training set and 3.25% in the testing set. Details of the assignment can be found in Table 1, and Tables 2,3 provide a comprehensive comparison between the training and testing sets.
| Variables | Rules for assigning dummy variables |
| All-cause mortality | No = 0, Yes = 1 |
| Hypoxemia | Mild = 0, Moderate & Severe = 1 |
| CA | No = 0, Yes = 1 |
| RBC, 1012/L | [3.8, 5.1] = 0, |
| Lymphocyte, 109/L | [1.1, 3.2] = 0, |
| Baso, 109/L | |
| TBA, µmol/L | |
| D-dimer, ng/mL | |
| FT3, pmol/L | [3.1, 6.8] = 0, |
| NT-proBNP, ng/L | |
| COPD | No = 0, Yes = 1 |
Notes: CA, catheter ablation; RBC, red blood cell; Baso, basophil granulocyte; TBA, total bile acids; FT3, free triiodothyronine; COPD, chronic obstructive pulmonary disease; NT-proBNP, N-terminal pro-brain natriuretic peptide.
| Variables | Total (n = 408) | Test (n = 123) | Train (n = 285) | t/Z/χ2 | p | |
| RBC, mean (SD) | 4.76 (0.62) | 4.80 (0.63) | 4.74 (0.61) | 0.81 | 0.42 | |
| Lymphocyte, Med (Q1, Q3) | 1.91 (1.49, 2.32) | 1.91 (1.52, 2.38) | 1.91 (1.48, 2.28) | –0.67 | 0.504 | |
| Baso, Med (Q1, Q3) | 0.03 (0.02, 0.05) | 0.03 (0.02, 0.04) | 0.03 (0.02, 0.05) | –0.34 | 0.734 | |
| TBA, Med (Q1, Q3) | 3.89 (2.21, 6.38) | 3.58 (2.08, 6.34) | 3.89 (2.29, 6.42) | –0.65 | 0.518 | |
| D-dimer, Med (Q1, Q3) | 84.00 (48.00, 198.50) | 84.00 (51.00, 207.00) | 84.00 (46.00, 181.00) | –0.94 | 0.348 | |
| FT3, Med (Q1, Q3) | 4.57 (4.08, 5.11) | 4.57 (4.05, 5.11) | 4.57 (4.10, 5.11) | –0.25 | 0.803 | |
| NT-proBNP, Med (Q1, Q3) | 798.00 (181.25, 1945.75) | 847.00 (195.00, 1896.00) | 737.00 (182.00, 1960.00) | 0.00 | 1 | |
| Death, n (%) | 1.88 | 0.17 | ||||
| No | 385 (94.36) | 119 (96.75) | 266 (93.33) | |||
| Yes | 23 (5.64) | 4 (3.25) | 19 (6.67) | |||
| Hypoxemia, n (%) | 0.17 | 0.682 | ||||
| Mild | 163 (39.95) | 51 (41.46) | 112 (39.30) | |||
| Moderate & Severe | 245 (60.05) | 72 (58.54) | 173 (60.70) | |||
| CA, n (%) | 0.02 | 0.894 | ||||
| No | 144 (35.29) | 44 (35.77) | 100 (35.09) | |||
| Yes | 264 (64.71) | 79 (64.23) | 185 (64.91) | |||
| COPD, n (%) | 0.28 | 0.598 | ||||
| No | 379 (92.89) | 113 (91.87) | 266 (93.33) | |||
| Yes | 29 (7.11) | 10 (8.13) | 19 (6.67) | |||
Notes: SD, standard deviation; Med, median; Q1: 1st Quartile; Q3: 3st Quartile;
t: t-test; Z: Mann-Whitney test;
| Variables | Total (n = 408) | Test (n = 123) | Train (n = 285) | χ2 | p | |
| CA, n (%) | 0.02 | 0.894 | ||||
| No | 144 (35.29) | 44 (35.77) | 100 (35.09) | |||
| Yes | 264 (64.71) | 79 (64.23) | 185 (64.91) | |||
| Death, n (%) | 1.88 | 0.17 | ||||
| No | 385 (94.36) | 119 (96.75) | 266 (93.33) | |||
| Yes | 23 (5.64) | 4 (3.25) | 19 (6.67) | |||
| Hypoxemia, n (%) | 0.17 | 0.682 | ||||
| Mild | 163 (39.95) | 51 (41.46) | 112 (39.30) | |||
| Moderate & Severe | 245 (60.05) | 72 (58.54) | 173 (60.70) | |||
| RBC, n (%) | 0.71 | 0.702 | ||||
| [3.8, 5.1] | 278 (68.14) | 87 (70.73) | 191 (67.02) | |||
| 17 (4.17) | 4 (3.25) | 13 (4.56) | ||||
| 113 (27.70) | 32 (26.02) | 81 (28.42) | ||||
| Lymphocyte, n (%) | 0.72 | 0.699 | ||||
| [1.1, 3.2] | 362 (88.73) | 111 (90.24) | 251 (88.07) | |||
| 30 (7.35) | 7 (5.69) | 23 (8.07) | ||||
| 16 (3.92) | 5 (4.07) | 11 (3.86) | ||||
| Baso, n (%) | 0.11 | 0.746 | ||||
| 372 (91.18) | 113 (91.87) | 259 (90.88) | ||||
| 36 (8.82) | 10 (8.13) | 26 (9.12) | ||||
| TBA, n (%) | 0.77 | 0.38 | ||||
| 374 (91.67) | 115 (93.50) | 259 (90.88) | ||||
| 34 (8.33) | 8 (6.50) | 26 (9.12) | ||||
| D-dimer, n (%) | 0.01 | 0.94 | ||||
| 326 (79.90) | 98 (79.67) | 228 (80.00) | ||||
| 82 (20.10) | 25 (20.33) | 57 (20.00) | ||||
| FT3, n (%) | - | 0.656 | ||||
| [3.1, 6.8] | 382 (93.63) | 114 (92.68) | 268 (94.04) | |||
| 25 (6.13) | 9 (7.32) | 16 (5.61) | ||||
| 1 (0.25) | 0 (0.00) | 1 (0.35) | ||||
| NT-proBNP, n (%) | 0.03 | 0.865 | ||||
| 75 (18.38) | 22 (17.89) | 53 (18.60) | ||||
| 333 (81.62) | 101 (82.11) | 232 (81.40) | ||||
| COPD, n (%) | 0.28 | 0.598 | ||||
| No | 379 (92.89) | 113 (91.87) | 266 (93.33) | |||
| Yes | 29 (7.11) | 10 (8.13) | 19 (6.67) | |||
Notes:
In the training set, there were 19 patients in the dead group and 266 patients
in the surviving group. Comparison of the original variables between the two
groups showed that the dead group had higher levels of D-dimer, NT-proBNP, the
proportion of moderate to severe hypoxemia, absence of CA, and COPD than did the
surviving group. The dead group had lower levels of RBC count, Lymphocyte, count
Baso count, and FT3 than did the surviving group. After variable assignment, the
proportion of moderate-to-severe hypoxemia in the dead group and surviving group
was 94.74% and 58.27%, respectively, the proportion receiving CA was 21.05%
and 68.05%, respectively, the proportion of RBC
| Variables | Total (n = 285) | Survival (n = 266) | Death (n = 19) | t/Z/χ2 | p | |
| RBC, mean (SD) | 4.74 (0.61) | 4.78 (0.60) | 4.26 (0.53) | 3.63 | ||
| Lymphocyte, Med (Q1, Q3) | 1.91 (1.48, 2.28) | 1.93 (1.50, 2.31) | 1.41 (1.10, 1.79) | –3.38 | ||
| Baso, Med (Q1, Q3) | 0.03 (0.02, 0.05) | 0.03 (0.02, 0.05) | 0.02 (0.01, 0.04) | –2.89 | 0.004 | |
| TBA, Med (Q1, Q3) | 3.89 (2.29, 6.42) | 3.88 (2.32, 6.29) | 5.00 (2.12, 7.80) | –0.81 | 0.418 | |
| D-dimer, Med (Q1, Q3) | 84.00 (46.00, 181.00) | 78.00 (44.00, 152.50) | 371.00 (185.00, 711.50) | –4.75 | ||
| FT3, Med (Q1, Q3) | 4.57 (4.10, 5.11) | 4.57 (4.13, 5.12) | 3.53 (2.65, 4.31) | –4.16 | ||
| NT-proBNP, Med (Q1, Q3) | 737.00 (182.00, 1960.00) | 646.80 | 1570.00 | –2.85 | 0.004 | |
| (169.35, 1883.50) | (748.50, 2735.00) | |||||
| Death, n (%) | 269.16 | |||||
| No | 266 (93.33) | 266 (100.00) | 0 (0.00) | |||
| Yes | 19 (6.67) | 0 (0.00) | 19 (100.00) | |||
| Hypoxemia, n (%) | 9.89 | 0.002 | ||||
| Mild | 112 (39.30) | 111 (41.73) | 1 (5.26) | |||
| Moderate & Severe | 173 (60.70) | 155 (58.27) | 18 (94.74) | |||
| CA, n (%) | 17.19 | |||||
| No | 100 (35.09) | 85 (31.95) | 15 (78.95) | |||
| Yes | 185 (64.91) | 181 (68.05) | 4 (21.05) | |||
| COPD, n (%) | 16.24 | |||||
| No | 266 (93.33) | 253 (95.11) | 13 (68.42) | |||
| Yes | 19 (6.67) | 13 (4.89) | 6 (31.58) | |||
Notes: t, t-test; Z, Mann-Whitney test;
| Variables | Total (n = 285) | Survival (n = 266) | Death (n = 19) | χ2 | p | |
| CA, n (%) | 17.19 | |||||
| No | 100 (35.09) | 85 (31.95) | 15 (78.95) | |||
| Yes | 185 (64.91) | 181 (68.05) | 4 (21.05) | |||
| Hypoxemia, n (%) | 9.89 | 0.002 | ||||
| Mild | 112 (39.30) | 111 (41.73) | 1 (5.26) | |||
| Moderate & Severe | 173 (60.70) | 155 (58.27) | 18 (94.74) | |||
| RBC, n (%) | 14.44 | |||||
| [3.8, 5.1] | 191 (67.02) | 178 (66.92) | 13 (68.42) | |||
| 13 (4.56) | 9 (3.38) | 4 (21.05) | ||||
| 81 (28.42) | 79 (29.70) | 2 (10.53) | ||||
| Lymphocyte, n (%) | - | 0.023 | ||||
| [1.1, 3.2] | 251 (88.07) | 237 (89.10) | 14 (73.68) | |||
| 23 (8.07) | 18 (6.77) | 5 (26.32) | ||||
| 11 (3.86) | 11 (4.14) | 0 (0.00) | ||||
| Baso, n (%) | 1.03 | 0.309 | ||||
| 259 (90.88) | 240 (90.23) | 19 (100.00) | ||||
| 26 (9.12) | 26 (9.77) | 0 (0.00) | ||||
| TBA, n (%) | 0.4 | 0.527 | ||||
| 259 (90.88) | 243 (91.35) | 16 (84.21) | ||||
| 26 (9.12) | 23 (8.65) | 3 (15.79) | ||||
| D-dimer, n (%) | 26.68 | |||||
| 228 (80.00) | 222 (83.46) | 6 (31.58) | ||||
| 57 (20.00) | 44 (16.54) | 13 (68.42) | ||||
| FT3, n (%) | - | |||||
| [3.1, 6.8] | 268 (94.04) | 255 (95.86) | 13 (68.42) | |||
| 16 (5.61) | 10 (3.76) | 6 (31.58) | ||||
| 1 (0.35) | 1 (0.38) | 0 (0.00) | ||||
| NT-proBNP, n (%) | 1.54 | 0.215 | ||||
| 53 (18.60) | 52 (19.55) | 1 (5.26) | ||||
| 232 (81.40) | 214 (80.45) | 18 (94.74) | ||||
| COPD, n (%) | 16.24 | |||||
| No | 266 (93.33) | 253 (95.11) | 13 (68.42) | |||
| Yes | 19 (6.67) | 13 (4.89) | 6 (31.58) | |||
Notes:
Univariate logistic regression analysis revealed that CA (odds ratio (OR) =
0.13) was a potential protective factor, whereas moderate-to-severe hypoxemia (OR
= 12.89), RBC count
| Variables | Single-factor | Multiple-factor | |||||||||
| S.E | Z | p | OR (95% CI) | S.E | Z | p | OR (95% CI) | ||||
| CA | |||||||||||
| No | 1.00 (Reference) | 1.00 (Reference) | |||||||||
| Yes | –2.08 | 0.58 | –3.6 | 0.13 (0.04~0.39) | –1.57 | 0.69 | –2.26 | 0.024 | 0.21 (0.05~0.81) | ||
| Hypoxemia | |||||||||||
| Mild | 1.00 (Reference) | 1.00 (Reference) | |||||||||
| Moderate & Severe | 2.56 | 1.03 | 2.47 | 0.013 | 12.89 (1.70~97.98) | 2.41 | 1.09 | 2.21 | 0.027 | 11.11 (1.32~93.62) | |
| RBC | |||||||||||
| [3.8, 5.1] | 1.00 (Reference) | 1.00 (Reference) | |||||||||
| 1.81 | 0.67 | 2.71 | 0.007 | 6.09 (1.65~22.45) | 3.03 | 0.93 | 3.25 | 0.001 | 20.70 (3.33~128.53) | ||
| –1.06 | 0.77 | –1.37 | 0.17 | 0.35 (0.08~1.57) | –0.9 | 0.83 | –1.09 | 0.274 | 0.41 (0.08~2.04) | ||
| Lymphocyte | |||||||||||
| [1.1, 3.2] | 1.00 (Reference) | ||||||||||
| 1.55 | 0.58 | 2.69 | 0.007 | 4.70 (1.52~14.53) | |||||||
| –14.74 | 1192.83 | –0.01 | 0.99 | 0.00 (0.00~Inf) | |||||||
| Baso | |||||||||||
| 1.00 (Reference) | |||||||||||
| –16.03 | 1279.19 | –0.01 | 0.99 | 0.00 (0.00~Inf) | |||||||
| D-dimer | |||||||||||
| 1.00 (Reference) | 1.00 (Reference) | ||||||||||
| 2.39 | 0.52 | 4.6 | 10.93 (3.94~30.32) | 1.96 | 0.64 | 3.06 | 0.002 | 7.07 (2.02~24.74) | |||
| TBA | |||||||||||
| 1.00 (Reference) | |||||||||||
| 0.68 | 0.67 | 1.03 | 0.305 | 1.98 (0.54~7.31) | |||||||
| FT3 | |||||||||||
| [3.1, 6.8] | 1.00 (Reference) | ||||||||||
| 2.47 | 0.59 | 4.18 | 11.77 (3.71~37.37) | ||||||||
| –12.59 | 1455.4 | –0.01 | 0.993 | 0.00 (0.00~Inf) | |||||||
| NT-proBNP | |||||||||||
| 1.00 (Reference) | |||||||||||
| 1.48 | 1.04 | 1.42 | 0.155 | 4.37 (0.57~33.51) | |||||||
| COPD | |||||||||||
| No | 1.00 (Reference) | 1.00 (Reference) | |||||||||
| Yes | 2.2 | 0.57 | 3.85 | 8.98 (2.94~27.43) | 1.19 | 0.68 | 1.76 | 0.078 | 3.29 (0.87~12.42) | ||
Notes: OR, odds ratio; CI, confidence interval; CA, catheter ablation; RBC, red blood cell; Baso, basophil granulocyte; TBA, total bile acids; FT3, free triiodothyronine; COPD, chronic obstructive pulmonary disease; NT-proBNP, N-terminal pro-brain natriuretic peptide.
The AUC values for the training and testing sets were 0.91 (95% CI: 0.84–0.98) and 0.96 (95% CI: 0.91–1.00), indicating excellent predictive ability of the model (Fig. 3A). In Fig. 3B, the nomogram was developed based on the multivariable logistic regression, with each line corresponding to CA, hypoxemia, RBC count, D-dimer, and COPD, among which RBC count showed the most significant impact on the predicted outcomes. Fig. 3C,D show the DCA curves for the training and testing sets, and show that that the predictive model performs well within probability thresholds of 0.1 to 0.7 and 0.1 to 0.9, respectively. Fig. 3E,F show the diagnostic calibration curves for the training and validation sets, which further confirm the stability and accurate predictive performance of the model.
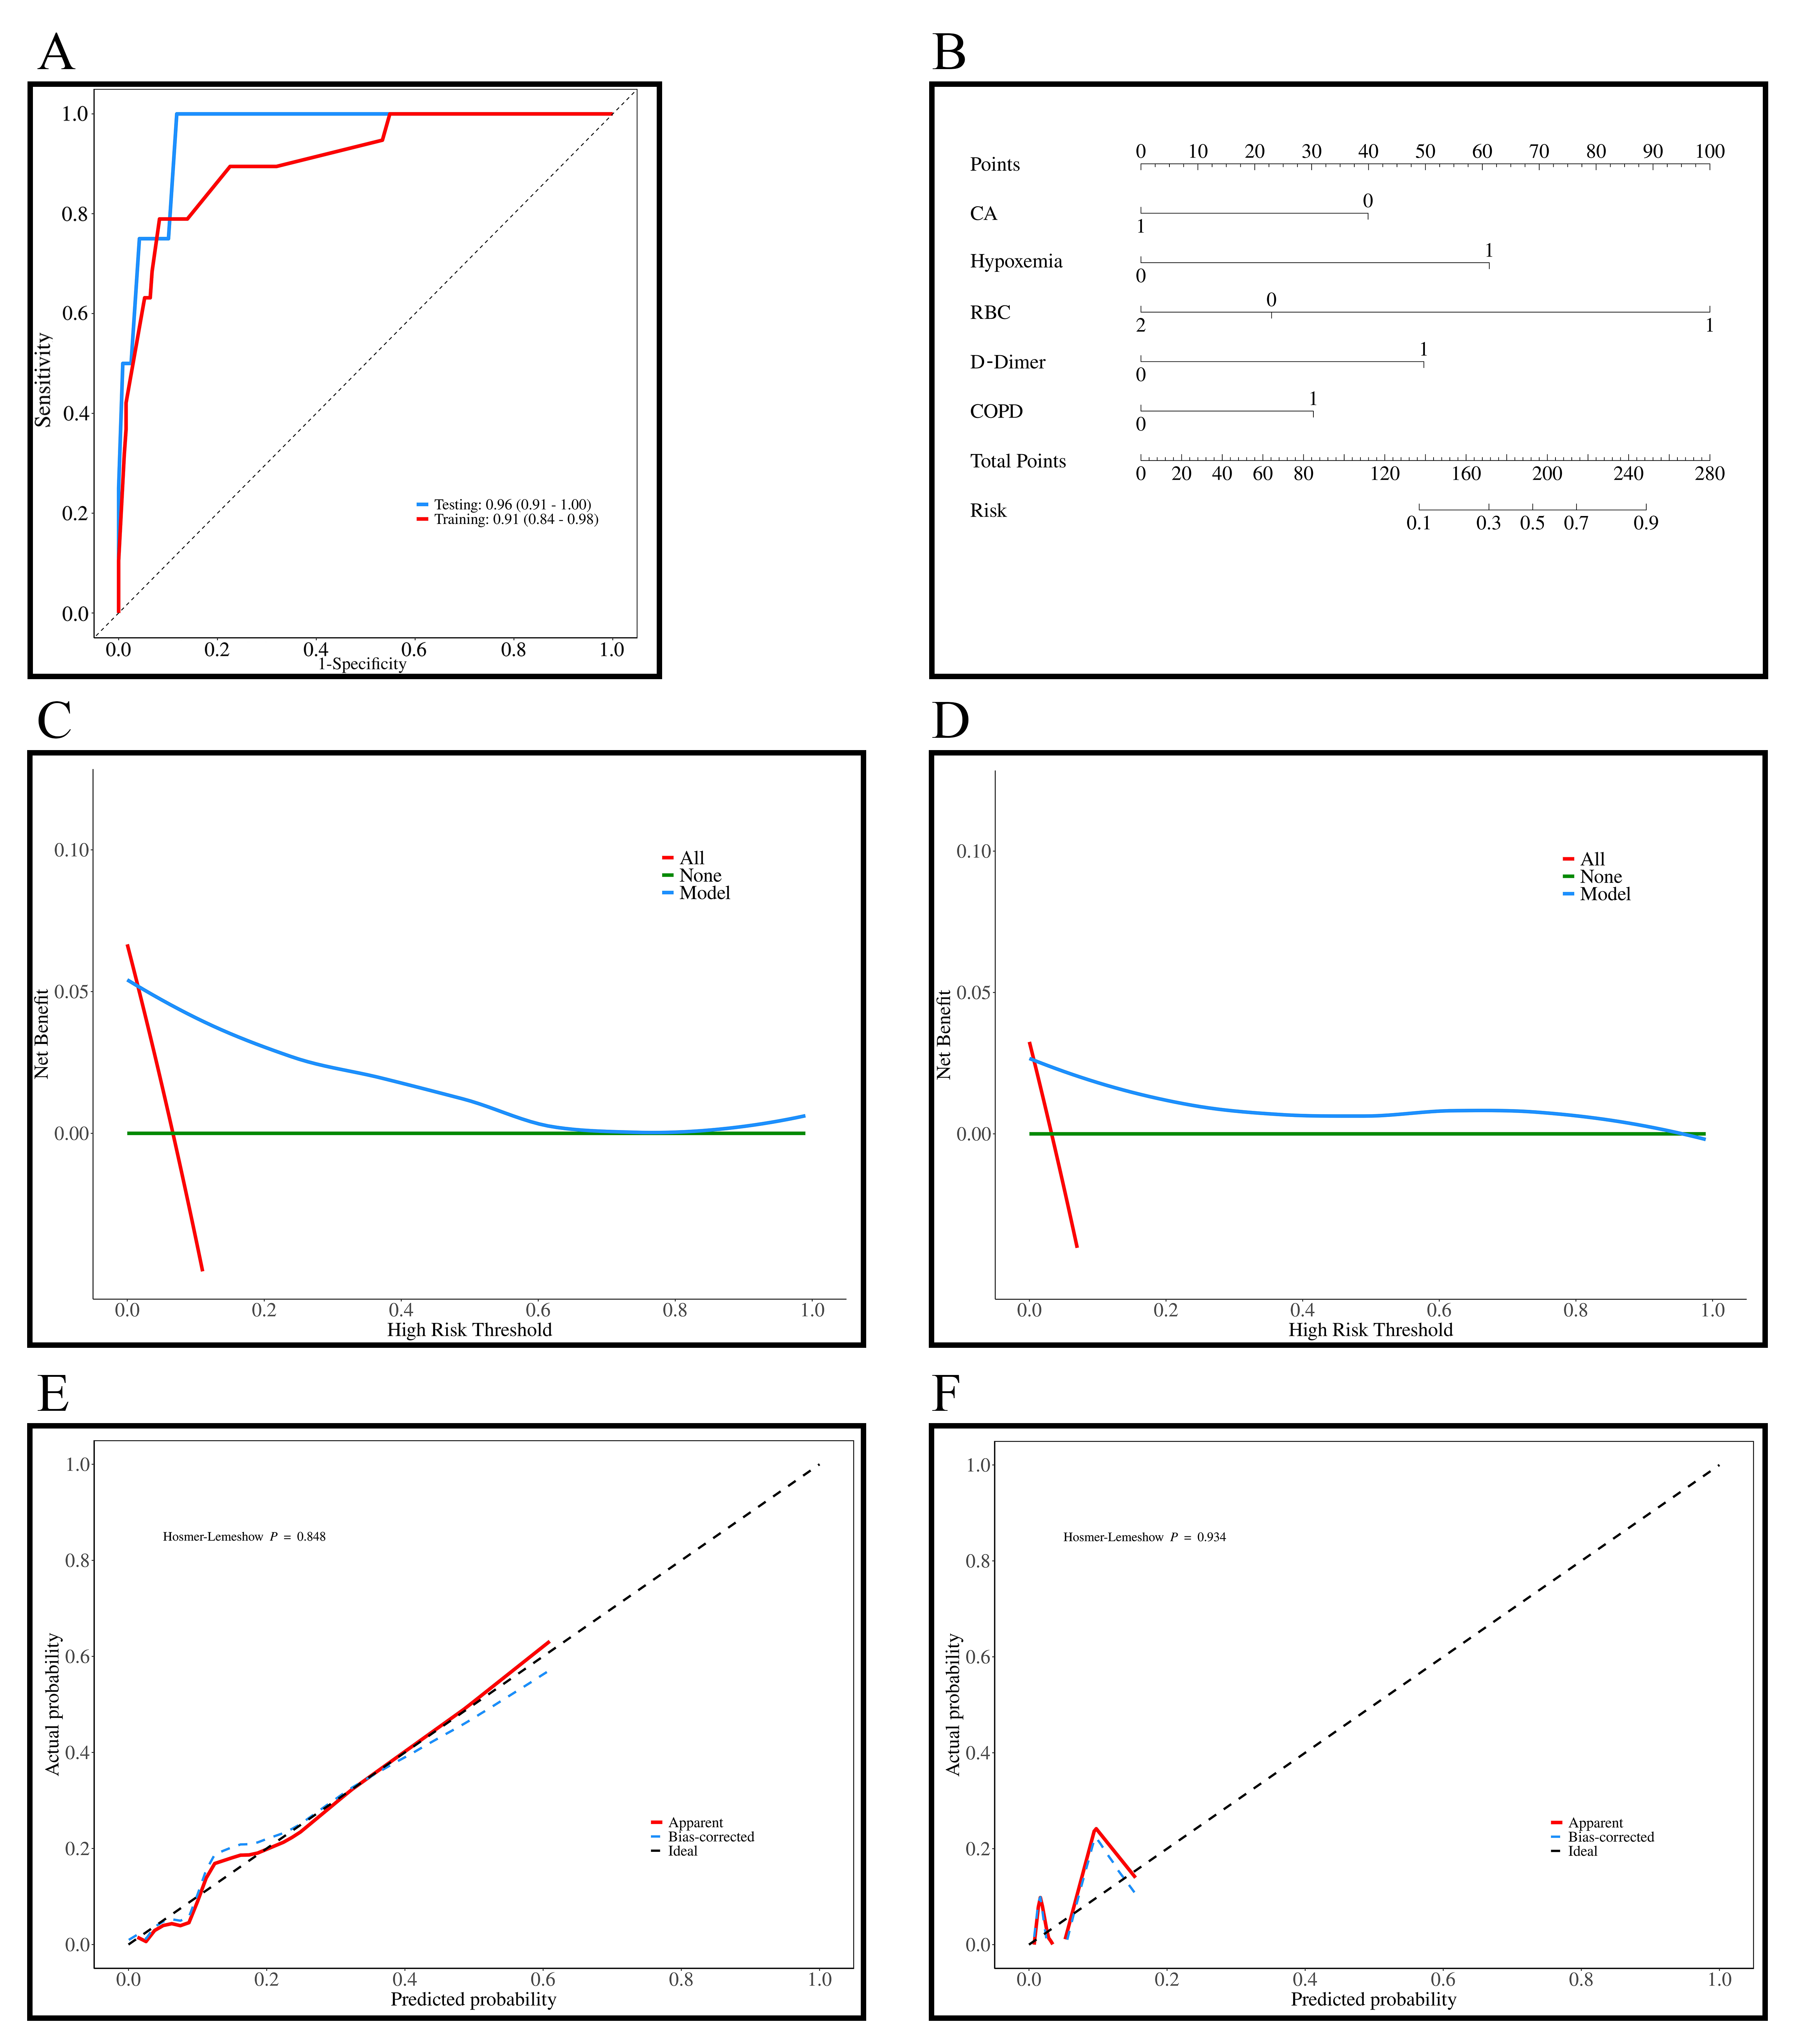 Fig. 3.
Results of the prediction model for all-cause mortality in patients with AF + OSAS. (A) ROC curves of the training (n = 285) and testing sets (n = 123); (B) Diagnostic nomogram of the all-cause mortality model; (C) DCA curves of the training set; (D) DCA curves of the testing set; (E) Diagnostic calibration curves of the training set; (F) Diagnostic calibration curves of the testing set. AF, atrial fibrillation; DCA, decision curve analysis; ROC, receiver operating characteristic; OSAS, obstructive sleep apnea syndrome; CA, catheter ablation; RBC, red blood cell; COPD, chronic obstructive pulmonary disease.
The assessment results of the model for all-cause mortality in patients with AF
+ OSAS in the training and testing sets are as follows: The model was tested
using a likelihood ratio test, with both the training and testing sets showing
significance, with p-values of 2.2
| Evaluation direction | Evaluation content | Train | Test | ||
| Statistics | p | Statistics | p | ||
| Model verification | Likelihood ratio test | 2.2 |
χ2: 5.1662 | 0.0230 | |
| Discrimination assessment | C-index | C-index: 0.912 (0.844–0.980) | 1.82 |
C-index: 0.716 (0.465–0.967) | 0.0847 |
| Calibration assessment | Goodness-of-fit test | χ2: 4.54 | 0.8054 | χ2: 1.6921 |
1.000 |
Notes:
| Train | Test | |
| Brier score | 0.044 | 0.056 |
| Calibration slope | 1.068 | 1.341 |
The AUC for the training and testing sets were 0.91 and 0.96, with accuracies of 0.91 and 0.91. The sensitivity and specificity of the training set were 0.92 and 0.79, and for the testing set were 0.92 and 0.75. The positive predictive value (PPV) for the training and testing sets were 0.98 and 0.99, and the negative predictive value (NPV) were 0.41 and 0.23, respectively. These results indicated that the model exhibited good predictive performance for all-cause mortality in patients with AF + OSAS. The confusion-matrix results for the training and testing sets can be found in Table 9.
| Data | AUC (95% CI) | Accuracy (95% CI) | Sensitivity (95% CI) | Specificity (95% CI) | PPV (95% CI) | NPV (95% CI) | Cut off |
| Train | 0.91 (0.84–0.98) | 0.91 (0.87–0.94) | 0.92 (0.88–0.95) | 0.79 (0.61–0.97) | 0.98 (0.97–1.00) | 0.41 (0.25–0.56) | 0.142 |
| Test | 0.96 (0.91–1.00) | 0.91 (0.85–0.95) | 0.92 (0.87–0.97) | 0.75 (0.33–1.00) | 0.99 (0.97–1.00) | 0.23 (0.00–0.46) | 0.142 |
Notes: AUC, area under the curve; PPV, positive predictive value; NPV, negative predictive value; CI, confidence interval.
An all-cause mortality-risk scoring system for patients with AF + OSAS was
developed based on the Framingham method, where CA was assigned –1 point,
moderate-to-severe hypoxemia was assigned 2 points, RBC
| Characteristics | Categories | Points |
| CA | Yes | –1 |
| Hypoxemia | Moderate & Severe | 2 |
| RBC | 2 | |
| D-dimer | 1 |
Notes: CA, catheter ablation; RBC, red blood cell; AF, atrial fibrillation; OSAS, obstructive sleep apnea syndrome.
| Points | Train | Test | ||||||
| Survival | Survival rate | Death | Death rate | Survival | Survival rate | Death | Death rate | |
| –1 | 71 | 100.00% | 0 | 0.00% | 31 | 100.00% | 0 | 0.00% |
| 0 | 25 | 96.15% | 1 | 3.85% | 12 | 100.00% | 0 | 0.00% |
| 1 | 99 | 99.00% | 1 | 1.00% | 45 | 100.00% | 0 | 0.00% |
| 2 | 51 | 94.44% | 3 | 5.56% | 22 | 95.65% | 1 | 4.35% |
| 3 | 19 | 63.33% | 11 | 36.67% | 8 | 80.00% | 2 | 20.00% |
| 4 | 1 | 33.33% | 2 | 66.67% | 1 | 50.00% | 1 | 50.00% |
| 5 | 0 | 0.00% | 1 | 100.00% | - | - | - | - |
| –1~0 points (low risk) | 96 | 100.00% | 0 | 0.00% | 43 | 100.00% | 0 | 0.00% |
| 1~2 points (medium risk) | 150 | 96.77% | 5 | 3.23% | 67 | 98.53% | 1 | 1.47% |
| 3~5 points (high risk) | 20 | 58.82% | 14 | 41.18% | 9 | 75.00% | 3 | 25.00% |
Notes: AF, atrial fibrillation; OSAS, Obstructive sleep apnea syndrome.
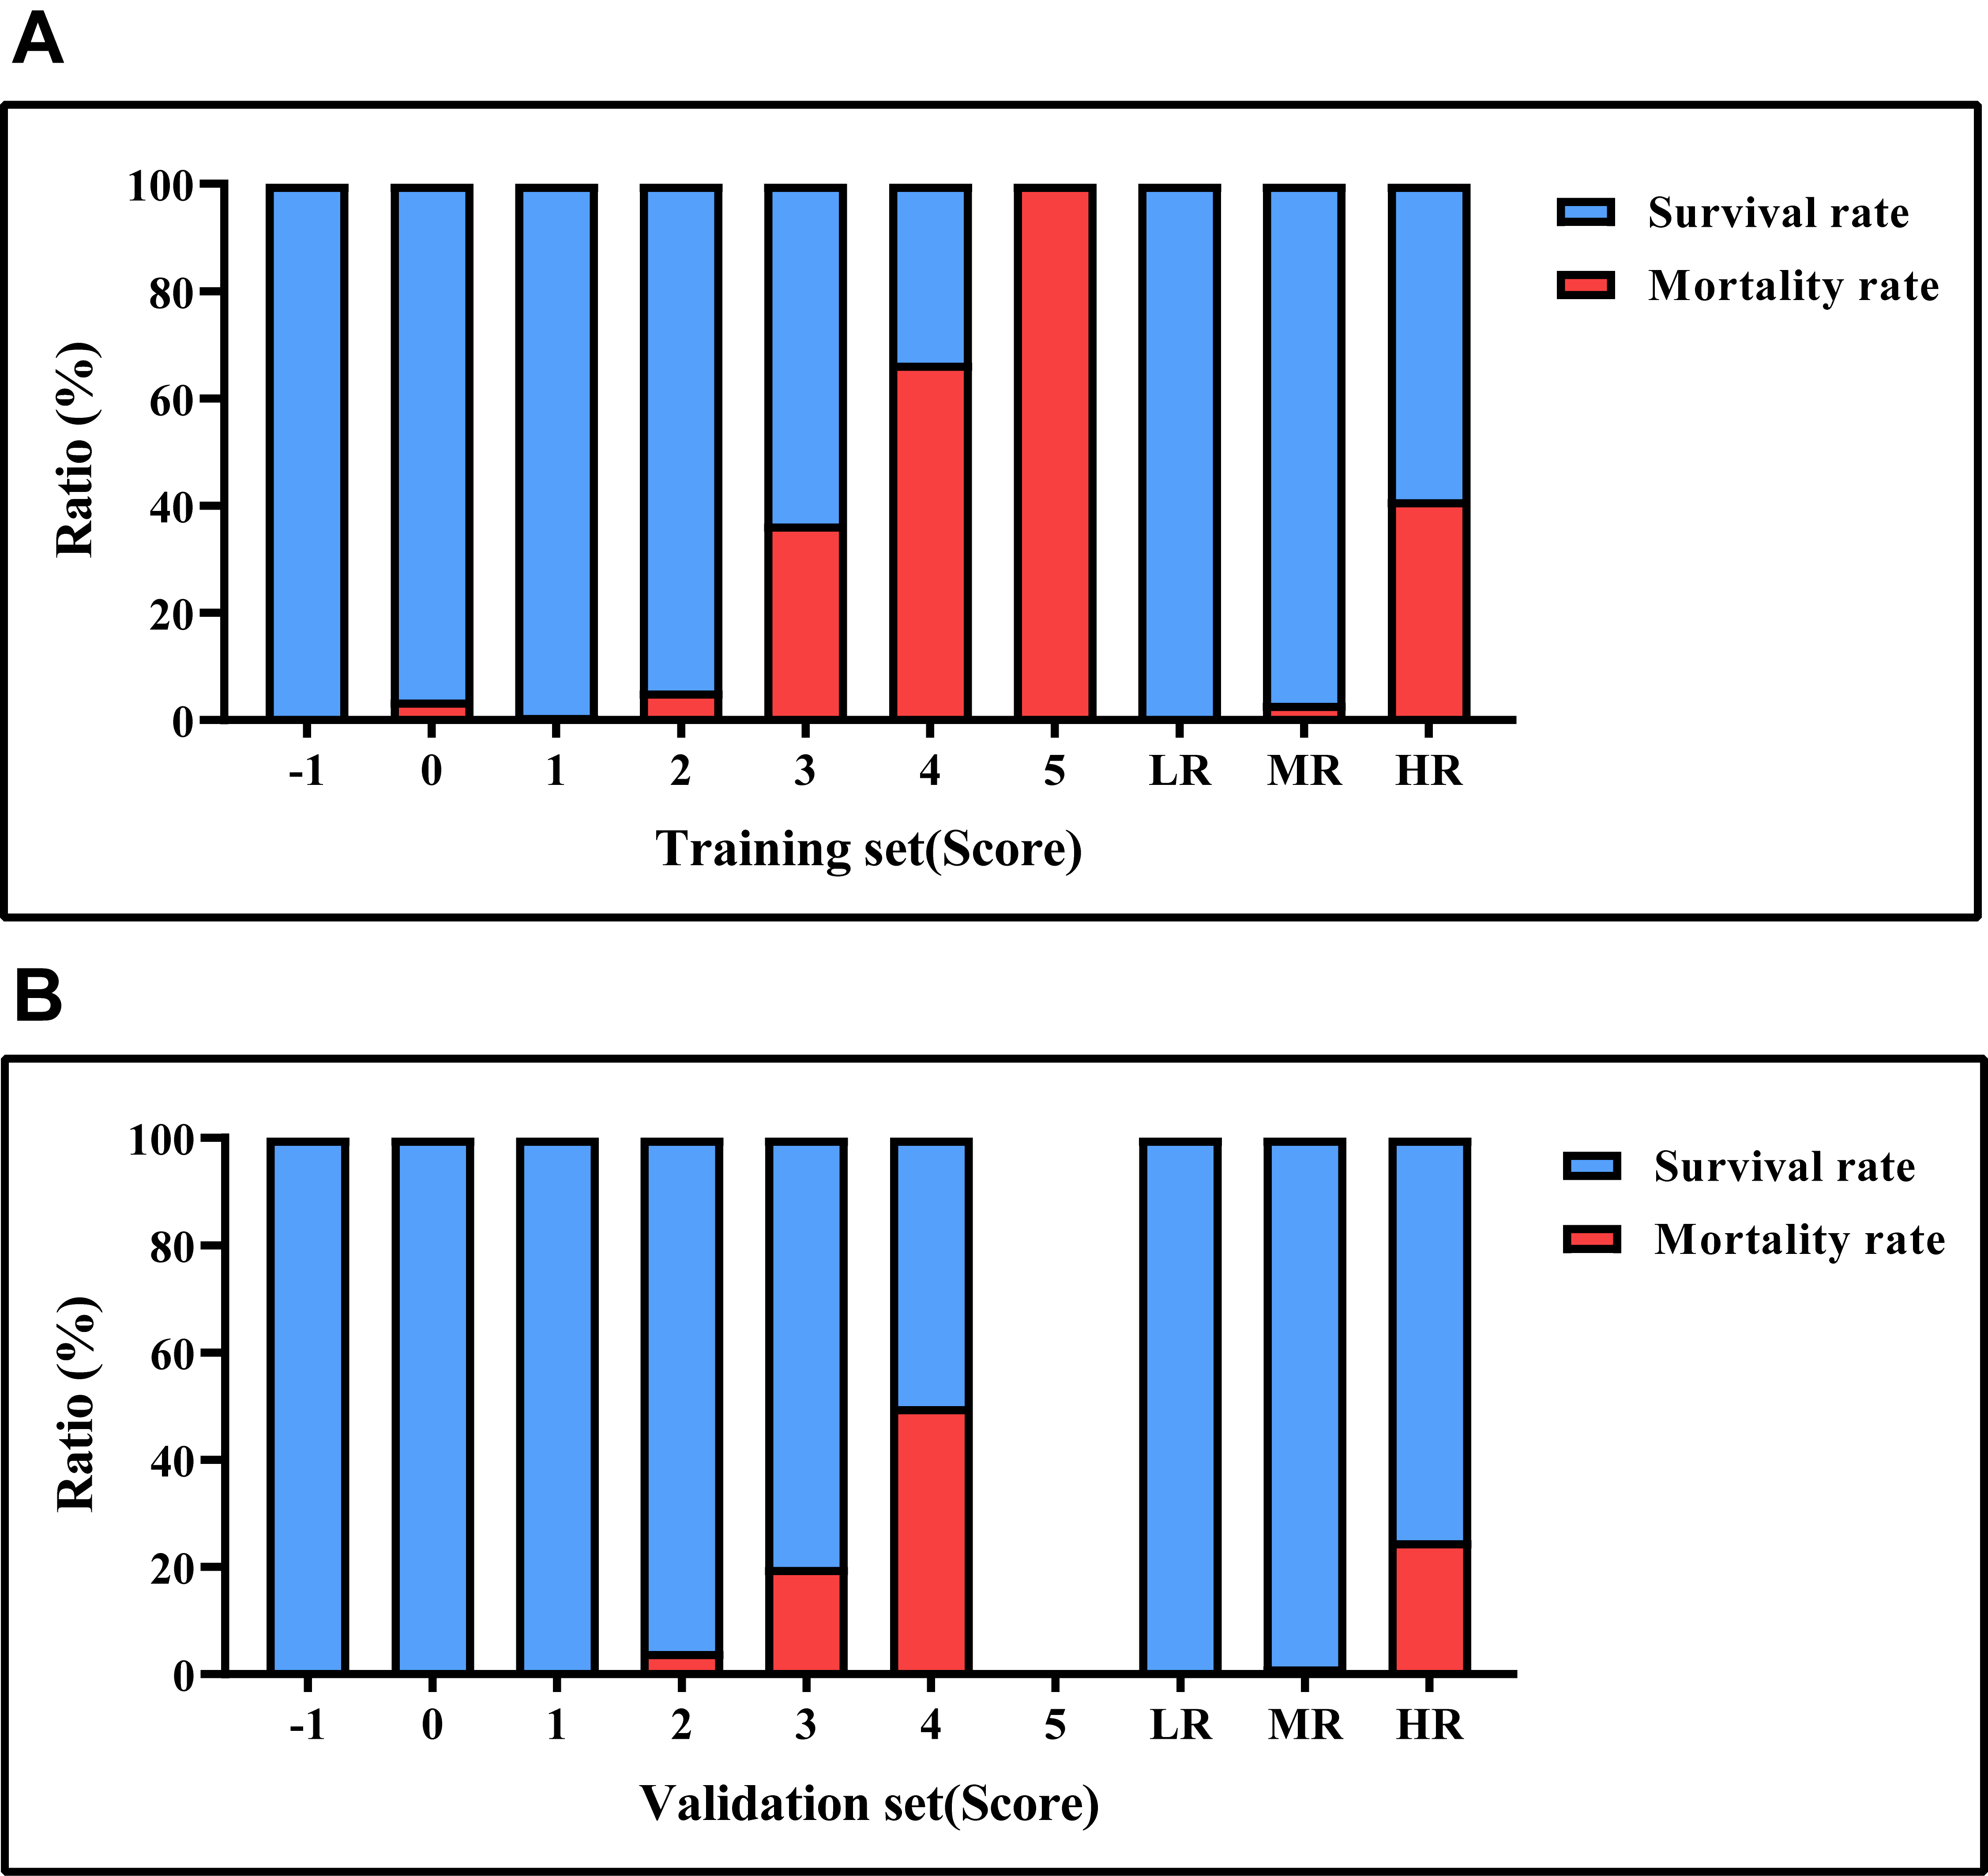 Fig. 4.
Mortality rates based on risk score values. (A) the survival and mortality rates for each risk level in the training set. (B) the survival and mortality rates for each risk level in the testing set. LR, low risk; MR, medium risk; HR, high risk.
The condition of AF + OSAS, due to its complexity and multitude of factors, has
resulted in high mortality rates. Given the disease burden, families also have
faced significant pressures, making it a substantial public health challenge. In
the present study, through Lasso regression, we selected 10 variables from the
abundant patient information that included hypoxemia, CA, RBC count, Lymphocyte
count, Baso count, TBA, D-dimer, FT3, NT-proBNP, and COPD. Significant variables
identified in the univariate logistic regression analysis were included in the
multivariable logistic regression analysis, which revealed that CA (OR = 0.21)
was an independent protective factor, whereas moderate-to-severe hypoxemia (OR =
11.11), RBC
Long-term irregular and rapid contractions of the left atrium easily lead to stroke and HF, which increases mortality. CA is the main effective treatment for AF. The present study found that CA is an independent protective factor for all-cause mortality in patients with AF + OSAS. CA can increase the duration of sinus rhythm maintenance by interrupting abnormal electrical impulses conduction and sustaining pulmonary vein isolation, thereby reducing the burden of AF and slowing the progression from paroxysmal AF to persistent AF, and decreasing cardiac workload. This significantly reduces the risk of mortality, HF, stroke, and rehospitalization in patients with AF [18, 19, 20]. Then, CA can actively improve patient anxiety levels and symptom burden, thereby enhancing the quality of life [21, 22]. Moreover, we speculate that in patients with AF + OSAS, the atrial arrhythmia may lead to impaired atrial contraction function and compromised blood circulation, further exacerbating the patient’s hypoxemia. Restoration of normal cardiac rhythm after CA ensures adequate oxygen supply by normalizing cardiac function and blood circulation, thereby improving oxygenation status and reducing all-cause mortality. Therefore, we recommend that patients with AF + OSAS undergo CA treatment promptly to restore and maintain sinus rhythm, thereby reducing the risk of related complications, and improving quality of life and prognosis.
Of note is the fact that multivariable logistic regression analysis identified
moderate to severe hypoxemia and RBC
In clinical practice, elevated levels of the fibrin-degradation product D-dimer are commonly used to assess the risk of thromboembolism and serve as an independent risk factor for all-cause mortality in patients with AF + OSAS. Primarily, the disordered intra-atrial electrical activity in patients with AF results in ineffective atrial contractions, leading to blood stasis in the atria and facilitating the formation of atrial appendage thrombi. If there are disturbances in the contractile and relaxation functions of the left ventricle, this further exacerbates left atrial enlargement and congestion, thereby promoting thrombus formation. Once these thrombi dislodge, they may trigger thromboembolic events, potentially causing severe conditions such as stroke [36]. Secondarily, the coexistence of AF and OSAS can trigger nocturnal hypoxemia, which not only increases blood viscosity, leading to circulatory disturbances, but also promotes thrombus formation, thereby adversely affecting patient prognosis. Moreover, AF + OSAS can cause dysfunction of endothelial cells, disrupting the stability of the vessel wall, increasing the risk of intravascular thrombosis, and consequently raising the likelihood of developing cardiovascular and cerebrovascular diseases [37]. Previous studies have shown that plasma D-dimer levels are significantly higher in patients with AF [38], and are significantly associated with stroke and cardiovascular death in AF patients [38, 39]. OSAS is significantly associated with thrombus formation [40, 41]. Rivaroxaban can effectively reduce plasma D-dimer levels in patients [42]. Therefore, we recommend that when AF + OSAS patients exhibit elevated D-dimer levels, consideration should be given to identifying the location of the thrombus and initiating or intensifying anticoagulant therapy. Additionally, timely correction of reversible risk factors can help reduce the risk of thromboembolism in these patients. Elevation of D-dimer, a marker of coagulation-fibrinolysis system activation, may reflect the hypercoagulable state and hidden thrombotic burden in patients with AF + OSAS. It is noteworthy that anticoagulant therapy may partially mask the predictive value of D-dimer, and systemic inflammation may interact bidirectionally with D-dimer formation through procoagulant effects. Despite the adjustments made to reduce confounding bias through multivariable analysis in the present study, future prospective research combining dynamic D-dimer monitoring and analysis of inflammatory markers is essential to clarify its independent predictive role.
The scoring system developed in the present study suggested that in clinical practice, for patients with AF, enhanced screening for OSAS using polysomnography (PSG) should be conducted. If both conditions exist, routine blood counts and D-dimer tests should be performed. Additionally, the development of embedded plugins in electronic medical records can automatically score relevant results and stratify patients based on their scores, while providing alerts to supervising physicians. Furthermore, tailored management strategies should be implemented based on patients’ different risk stratifications: for low-risk patients, outpatient management with remote treatment compliance monitoring every six months; for moderate-risk patients, multidisciplinary team assessments should be initiated—for example, those patients may require multidisciplinary team (MDT) evaluations to identify and address potential underlying causes of OSAS, along with cardiology consultations for CA surgery. High-risk patients should have shorter follow-up intervals and increased outpatient-visit frequency through communication channels like phone calls, texts, and video conferencing. Equipping patients’ homes with devices such as pulse oximeters and smartwatches to monitor basic vital signs, and enhancing education for patients’ families on disease awareness and fundamental management strategies, is advised.
The conclusions drawn from this retrospective study are multidimensional. First, the study identified key factors influencing all-cause mortality in patients with AF + OSAS, encompassing both protective and risk factors. Second, the study developed a model for predicting the risk of all-cause mortality in patients with AF + OSAS, demonstrating good predictive performance. Finally, the scoring system developed based on this predictive model provided an effective tool for assessing and predicting AF recurrence, offering valuable guidance and reference for future clinical management.
Patients with AF + OSAS face a higher risk of mortality. The complex pathophysiological mechanisms of this condition have garnered significant attention. With the aging population, the incidence rates of OSAS + AF continue to rise, undoubtedly placing a heavy burden on the public health system. To our knowledge, there is currently a lack of specific tools for assessing the overall risk of mortality in patients with AF + OSAS. Therefore, this study developed a clinical predictive model suitable for this patient population. However, the study still has its limitations. First, although data from AF + OSAS patients who received treatment between 2012 and 2024 were collected retrospectively in this study, the sample size was relatively small, with a low number of deceased patients, leading to the Effective Predictor Variable being lower than the traditionally recommended value. This may affect the stability of the results. Despite rigorous variable selection, cross-validation, and independent validation, the model demonstrated good discriminative and calibration performance; however, this remains a limitation of the study. Second, although the hospital was the one with the highest number of patients in the region and thus considered representative, the predictive model was only internally validated in a single center. These limitations highlight the need for future research efforts to conduct multicenter prospective real-world clinical studies to validate these findings and provide assistance to a broader range of patients and healthcare professionals.
In patients with AF + OSAS, CA (OR = 0.21) is an independent protective factor
for all-cause mortality, whereas moderate to severe hypoxemia (OR = 11.11), RBC
The datasets used and analyzed during the current study are available from the corresponding author on reasonable request.
XTZ and BPT conceptualized the study. XTZ, MW, and YML contributed to the study methodology. MW and PJX were responsible for the software aspects. PJX performed data validation, while formal analysis was conducted by XTZ and YML. BPT provided the necessary resources for the study. XTZ and MW curated the data. XTZ drafted the initial manuscript and subsequently reviewed and edited it with the assistance of MW and YML. XTZ and YML were involved in data visualization. XTZ and BPT supervised the study. XTZ managed the project administration, and funding was acquired by BPT. All authors contributed to the conception and editorial changes in the manuscript. All authors have read and approved the final manuscript. All authors fully participated in this work and agreed to take responsibility for all aspects of the work.
The study was carried out in accordance with the guidelines of the Declaration of Helsinki and approved by the Ethics Committee of the First Affiliated Hospital of Xinjiang Medical University with the ethics review number K202409-07. Due to the retrospective nature of this study and data collection solely through the HIS, the application for exempting informed consent signing has been granted by the Ethics Committee of the First Affiliated Hospital of Xinjiang Medical University.
Not applicable.
This work was supported by the Key R&D Program of Xinjiang Uygur Autonomous Region (2022B03023) and Youth Scientific Research Voyage (2023YFY-QKMS-09).
The authors declare no conflict of interest.
References
Publisher’s Note: IMR Press stays neutral with regard to jurisdictional claims in published maps and institutional affiliations.