


 , Ding Xu 1,†, Wen Zheng 1, Wen Hao 1, Lei Zhen 1, Yan Yan 1, Xiao Wang 1,2,*
 , Shaoping Nie 1,*
1 Center for Coronary Artery Disease, Division of Cardiology, Beijing Anzhen Hospital, Capital Medical University, 100029 Beijing, China
2 Cardiometabolic Medicine Center, Fuwai Hospital, National Center for Cardiovascular Diseases, Chinese Academy of Medical Sciences and Peking Union Medical College, 100037 Beijing, China
†These authors contributed equally.
Abstract
Obstructive sleep apnea (OSA) is highly prevalent in patients with acute coronary syndrome (ACS). The triglyceride glucose (TyG) index is considered closely linked to cardiovascular risk. However, the relationship between OSA, TyG index, and cardiovascular outcomes in ACS patients remains unclear. Hence, this study aimed to examine the effects of OSA and the TyG index on cardiovascular outcomes in ACS patients.
This post-hoc analysis included 1853 patients from the OSA–ACS project, a single-center prospective cohort study that enrolled ACS patients admitted between January 2015 and December 2019. OSA was defined as an apnea–hypopnea index of ≥15 events/hour. The primary endpoint was major adverse cardiovascular and cerebrovascular events (MACCE). Multivariable Cox regression models were used to evaluate the impact of OSA on cardiovascular events across the TyG index categories.
OSA was present in 52.5% of the participants, with a mean TyG index of 9.02 ± 0.68. Over a median follow-up of 35.1 (19.0–43.5) months, OSA was significantly associated with a heightened risk of MACCE (adjusted hazard ratio (aHR): 1.556; 95% confidence interval (CI): 1.040–2.326; p = 0.031) in the high TyG group within the fully adjusted model, along with elevated risk of hospitalization for unstable angina (aHR: 1.785; 95% CI: 1.072–2.971; p = 0.026). No significant associations were observed between OSA and MACCE in the low and moderate TyG groups.
This analysis demonstrates that OSA significantly increases the risk of adverse cardiovascular events in ACS patients with a high TyG index, underscoring the importance of routine OSA screening in these high-risk ACS patients to optimize cardiovascular risk stratification and personalize treatment strategies.
NCT03362385, https://clinicaltrials.gov/expert-search?term=NCT03362385.
Keywords
- acute coronary syndrome
- insulin resistance
- obstructive sleep apnea
- triglyceride glucose index
Obstructive sleep apnea (OSA) is a prevalent sleep disorder, characterized by intermittent complete or partial upper airway obstruction, affecting 40% to 80% of individuals with cardiovascular diseases. This condition leads to intermittent hypoxemia, sleep fragmentation, significant negative intrathoracic pressure swings, and alterations in the gut microbiota, ultimately increasing the risk of cardiovascular events, such as unstable angina (UA), sudden cardiac death, and acute myocardial infarction [1, 2, 3, 4]. Previous studies have demonstrated that OSA exacerbates insulin resistance, thereby contributing to the progression of cardiovascular diseases [5, 6, 7].
The triglyceride glucose (TyG) index, a biomarker calculated from fasting triglyceride and glucose levels, has been acknowledged as a reliable and non-invasive indicator of insulin resistance [8]. This index effectively integrates lipid and glucose metabolism, enhancing cardiovascular risk prediction [9, 10, 11]. Previous meta-analyses have demonstrated associations between elevated TyG index and increased risks of heart failure (HF) [12], peripheral arterial disease [13], and hypertension [14]. Furthermore, studies have demonstrated that the TyG index is significantly higher in patients with OSA compared to non-OSA individuals, with elevated TyG index independently linked to both increased risk and severity of OSA, even after adjusting for potential confounding factors [15, 16, 17]. For example, in non-obese and non-diabetic patients, Bikov et al. [18] revealed that the TyG index was associated with OSA and its severity.
Given the heterogeneity of OSA, which contributes to the variable efficacy of continuous positive airway pressure (CPAP) interventions and its impact on prognosis, identifying high-risk populations likely to benefit from targeted intervention for OSA is essential [19, 20]. To date, research has yet to investigate the influence of OSA on the prognosis of patients with acute coronary syndrome (ACS) stratified by the TyG index. Therefore, we conducted a post-hoc analysis to evaluate the effects of OSA and TyG index on cardiovascular risk among patients with ACS.
The OSA-ACS project (NCT03362385) is a single-center prospective cohort study
designed to evaluate the impact of obstructive sleep apnea on cardiovascular
events in patients with ACS. This study enrolled ACS patients aged 18 to 85 who
were hospitalized at the Beijing Anzhen Hospital between January 2015 and
December 2019. Participants were excluded if they experienced cardiogenic shock,
cardiac arrest, malignancies, failed sleep studies or recordings of less than 180
minutes, central sleep apnea, loss to follow-up, or regular CPAP therapy [21, 22]. The TyG index was derived using the following formula: TyG index =
ln[fasting triglycerides (mg/dL)
Following clinical stabilization, nocturnal sleep assessments were conducted
using a portable cardiopulmonary polygraphy device (ApneaLink, ResMed, Sydney,
New South Wales, Australia), with a minimum recording requirement of 3 hours.
Monitoring parameters included thoracoabdominal movement, nasal airflow, arterial
oxygen saturation, and snoring. Sleep study was performed following the standards
of the American Academy of Sleep Medicine [25]. Apnea was defined as an airflow
cessation for
All patients received guideline-recommended treatment. Unless contraindicated,
dual antiplatelet therapy was prescribed for at least one year post-discharge.
Patients diagnosed with moderate-to-severe OSA (AHI
Patients were followed up at 1 month, 3 months, 6 months, 1 year, and thereafter at every 6-month intervals through outpatient visits or telephone interviews. The primary endpoint was major adverse cardiovascular and cerebrovascular events (MACCE), comprising hospitalization for UA or HF, stroke, myocardial infarction, cardiovascular death, and ischemia-driven revascularization. Secondary endpoints included each individual component of MACCE, all repeat revascularizations, a composite of cardiovascular death, myocardial infarction, and ischemic stroke, as well as a composite of cardiac events excluding stroke.
Variables following a normal distribution are presented as mean
This analysis included 1853 ACS patients, of whom 52.5% (973/1853) had OSA,
with a mean TyG index of 9.02
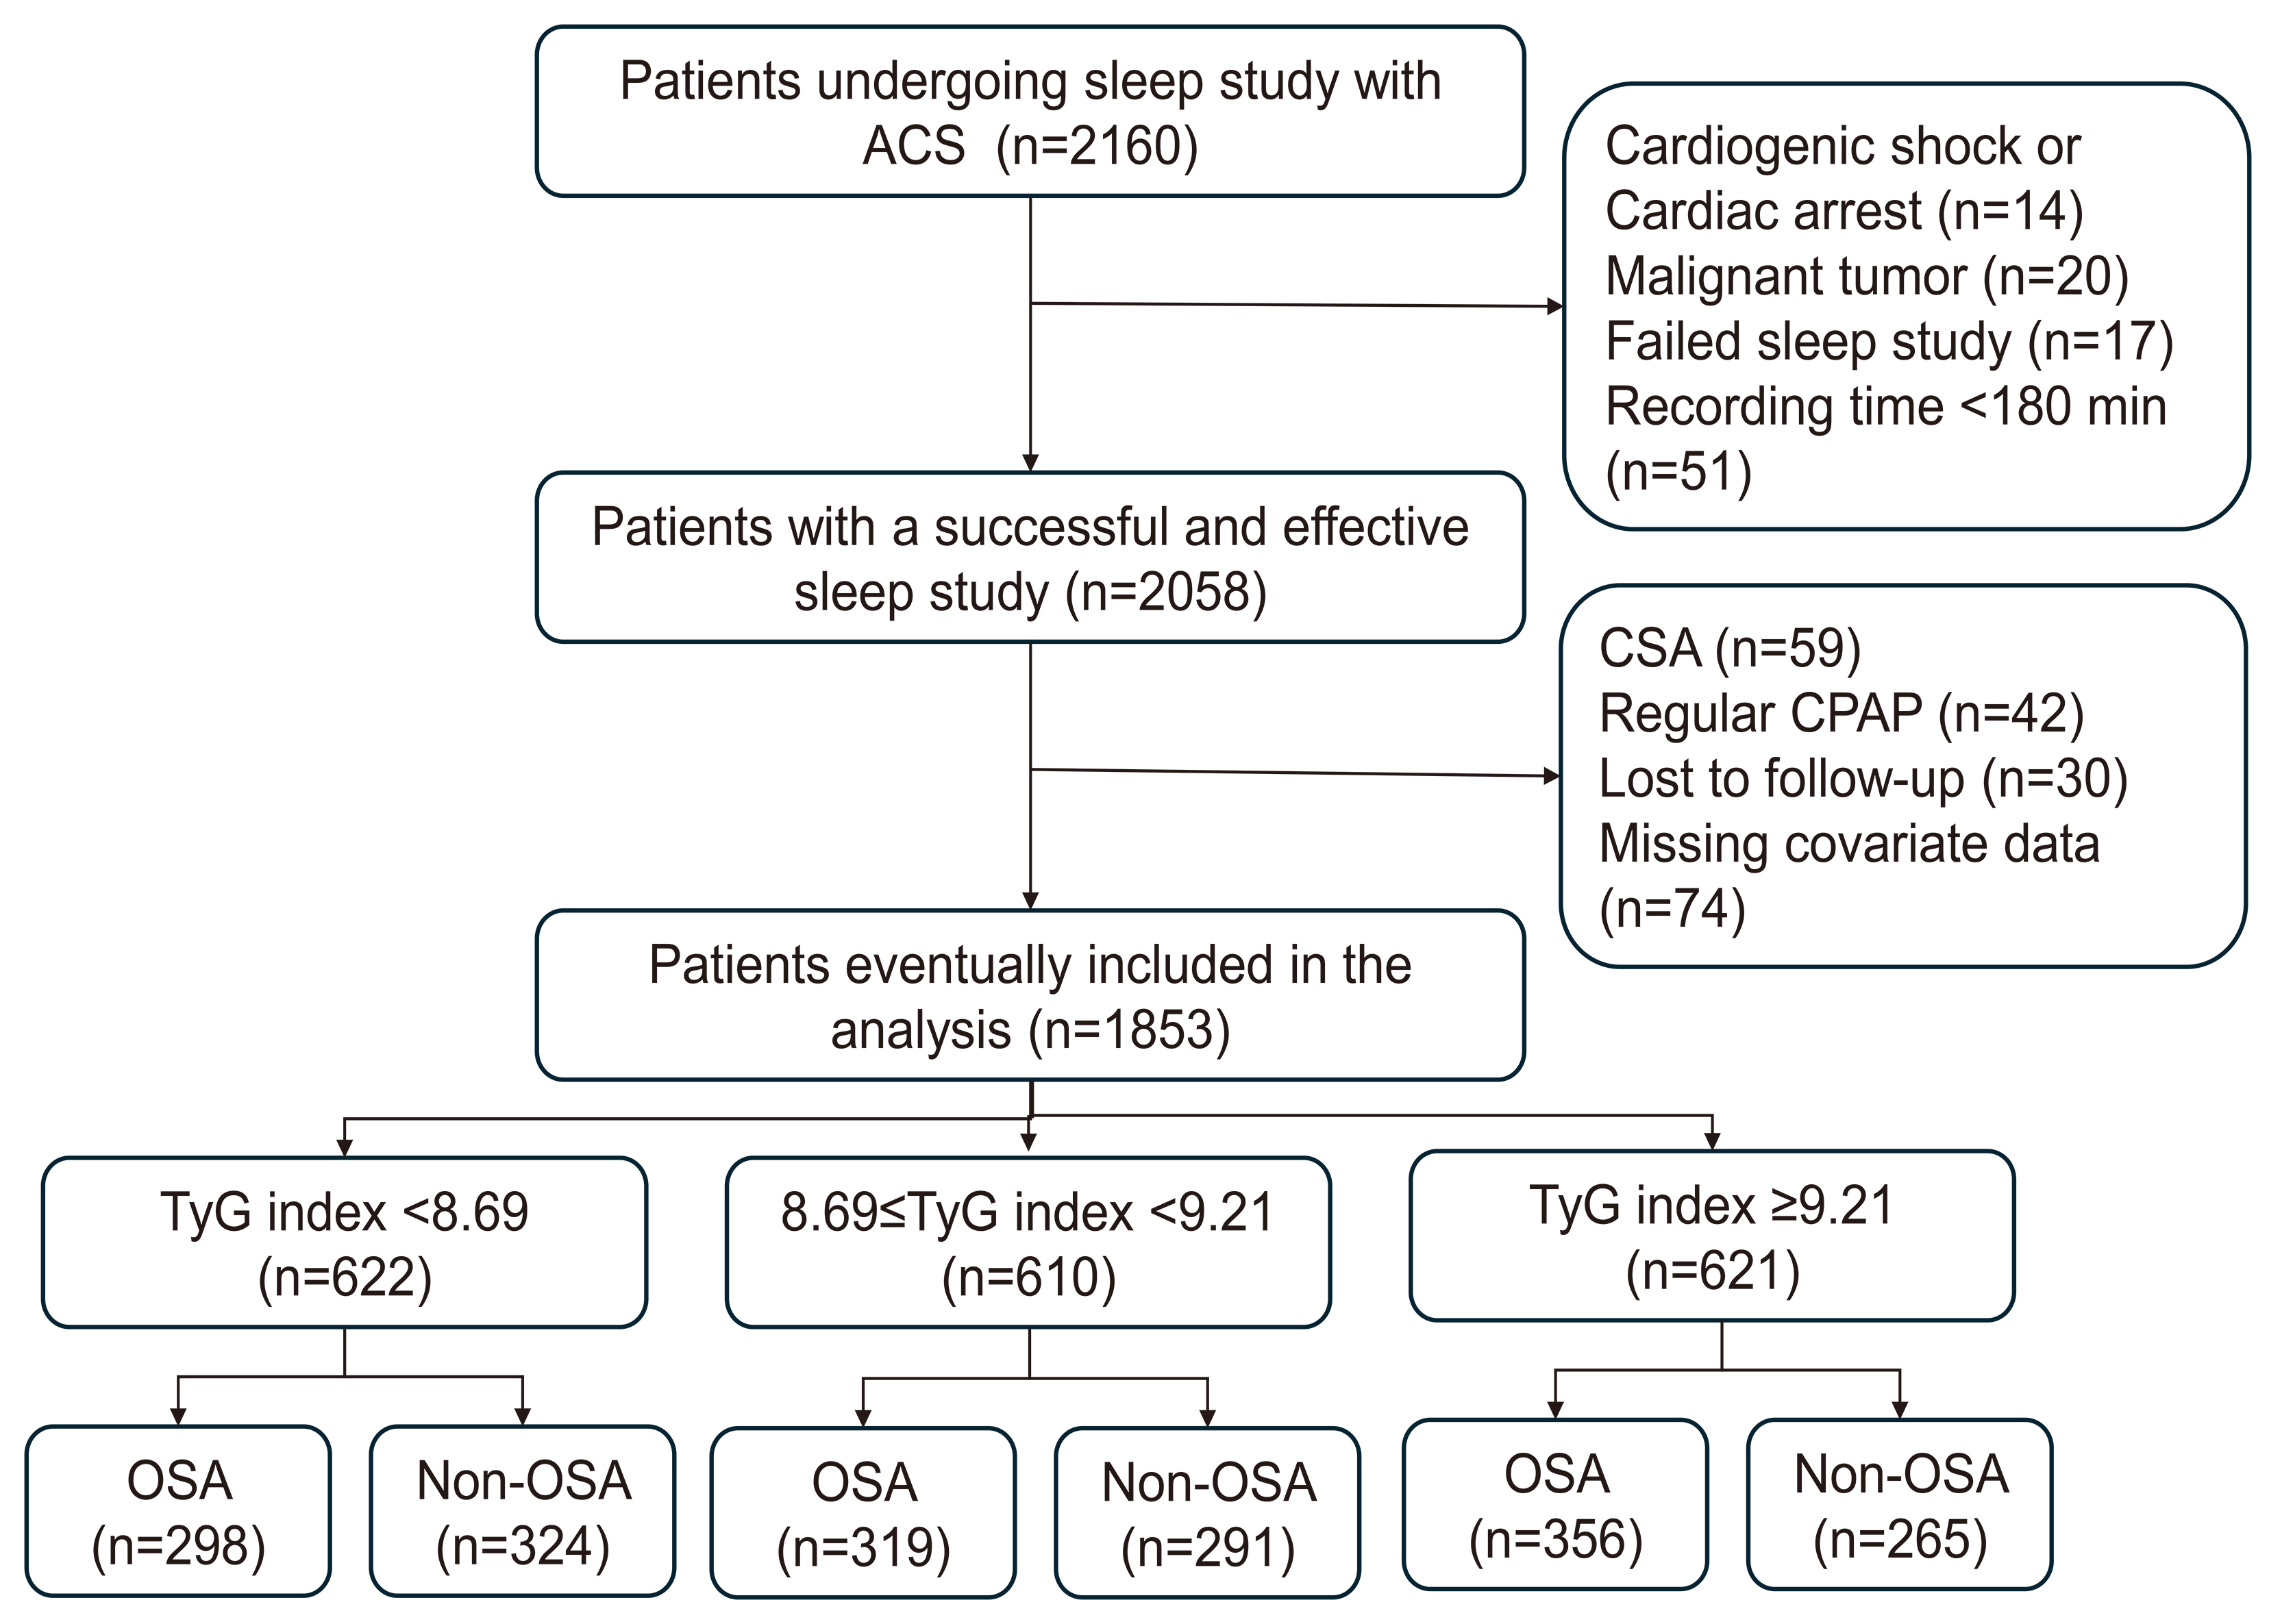 Fig. 1.
Study flowchart. ACS, acute coronary syndrome; CPAP, continuous positive airway pressure; CSA, central sleep apnea; OSA, obstructive sleep apnea; TyG, triglyceride glucose.
Participants in this study had a mean age of 56.4
| All | TyG index |
8.69 |
TyG index |
p value | ||
| (N = 1853) | (N = 622) | (N = 610) | (N = 621) | |||
| Demographics | ||||||
| Age, years | 56.4 |
58.2 |
57.1 |
53.8 |
||
| Male | 1571 (84.8) | 533 (85.7) | 503 (82.5) | 535 (86.2) | 0.146 | |
| BMI, kg/m2 | 26.8 |
26.2 |
27.0 |
27.9 |
||
| Waist-to-hip ratio | 0.98 (0.95–1.02) | 0.97 (0.94–1.00) | 0.98 (0.95–1.01) | 0.99 (0.96–1.03) | ||
| Neck circumference, cm | 41 (38–43) | 40 (37–42) | 41 (38–43) | 42 (39–44) | ||
| Systolic BP, mmHg | 126 (117–138) | 127 (118–139) | 126 (117–137) | 127 (118–139) | 0.513 | |
| Diastolic BP, mmHg | 76 (70–85) | 76 (70–83) | 75 (70–82) | 78 (70–87) | ||
| Medical History | ||||||
| Diabetes | 590 (31.8) | 120 (19.3) | 170 (27.9) | 300 (48.3) | ||
| Hypertension | 1198 (64.7) | 380 (61.1) | 387 (63.4) | 431 (69.4) | 0.007 | |
| Hyperlipidemia | 607 (32.8) | 190 (30.5) | 181 (29.7) | 236 (38.0) | 0.003 | |
| Family history of premature CAD | 101 (5.5) | 35 (5.6) | 30 (4.9) | 36 (5.8) | 0.772 | |
| Prior stroke | 198 (10.7) | 60 (9.6) | 81 (13.3) | 57 (9.2) | 0.039 | |
| Prior myocardial infarction | 302 (16.3) | 100 (16.1) | 105 (17.2) | 97 (15.6) | 0.739 | |
| Prior PCI | 383 (20.7) | 131 (21.1) | 118 (19.3) | 134 (21.6) | 0.599 | |
| Smoking | 0.057 | |||||
| No | 632 (34.1) | 212 (34.1) | 224 (36.7) | 196 (31.6) | ||
| Current | 878 (47.4) | 285 (45.8) | 270 (44.3) | 323 (52.0) | ||
| Previous | 343 (18.5) | 125 (20.1) | 116 (19.0) | 102 (16.4) | ||
| Drinking | 0.004 | |||||
| No | 1137 (61.4) | 385 (61.9) | 386 (63.3) | 366 (58.9) | ||
| Current | 615 (33.2) | 209 (33.6) | 177 (29.0) | 229 (36.9) | ||
| Previous | 101 (5.5) | 28 (4.5) | 47 (7.7) | 26 (4.2) | ||
| Presence of HF | 11 (0.6) | 2 (0.3) | 3 (0.5) | 6 (1.0) | 0.309 | |
| Baseline Tests | ||||||
| eGFR, mL/min/1.73 m2 | 105.2 (89.5–121.4) | 106.5 (90.6–124.0) | 104.9 (89.7–119.9) | 104.1 (88.5–119.9) | 0.151 | |
| hs-CRP, mg/L | 2.0 (0.8–6.1) | 1.4 (0.5–5.3) | 1.9 (0.8–5.8) | 2.9 (1.1–6.9) | ||
| LVEF, % | 61 (56–65) | 62 (56–65) | 62 (56–65) | 61 (56–65) | 0.502 | |
| TyG index | 9.02 |
8.35 |
8.94 |
9.76 |
||
BMI, body mass index; BP, blood pressure; CAD, coronary artery disease; eGFR, estimated glomerular filtration rate; HF, heart failure; hs-CRP, high-sensitivity C-reactive protein; LVEF, left ventricular ejection fraction; PCI, percutaneous coronary intervention; TyG, triglyceride glucose.
In patients with a high TyG index, the prevalence of OSA was substantially
elevated compared with the moderate and low TyG groups (57.3% vs. 52.3% vs.
47.9%, p = 0.004). These patients exhibited notably elevated median
AHI, oxygen desaturation index (ODI), and prolonged duration of
| All | TyG index |
8.69 |
TyG index |
p value | ||
| (N = 1853) | (N = 622) | (N = 610) | (N = 621) | |||
| Diagnosis | 0.283 | |||||
| STEMI | 418 (22.6) | 132 (21.2) | 150 (24.6) | 136 (21.9) | ||
| NSTEMI | 351 (18.9) | 108 (17.4) | 114 (18.7) | 129 (20.8) | ||
| UA | 1084 (58.5) | 382 (61.4) | 346 (56.7) | 356 (57.3) | ||
| Procedures | ||||||
| Coronary angiography | 1806 (97.5) | 606 (97.4) | 591 (96.9) | 609 (98.1) | 0.418 | |
| PCI | 1164 (62.8) | 363 (58.4) | 387 (63.4) | 414 (66.7) | 0.009 | |
| DES use | 1007 (86.5) | 308 (84.8) | 343 (88.6) | 356 (86.0) | 0.294 | |
| Baseline TIMI 0 or 1 | 404 (34.7) | 115 (31.7) | 133 (34.4) | 156 (37.7) | 0.212 | |
| CABG | 127 (6.9) | 41 (6.6) | 40 (6.6) | 46 (7.4) | 0.799 | |
| Sleep Study | ||||||
| OSA | 973 (52.5) | 298 (47.9) | 319 (52.3) | 356 (57.3) | 0.004 | |
| AHI, events·h−1 | 15.8 (8.0–29.9) | 14.1 (7.5–27.5) | 15.7 (7.9–28.4) | 18.5 (8.9–36.2) | ||
| ODI, events·h−1 | 16.2 (8.8–28.5) | 14.3 (8.2–25.5) | 16.2 (8.6–27.7) | 18.2 (9.6–32.5) | ||
| Nadir SaO2, % | 85 (81–88) | 86 (82–89) | 85 (81–88) | 85 (80–88) | 0.002 | |
| Mean SaO2, % | 94 (93–95) | 94 (93–95) | 94 (93–95) | 94 (93–95) | 0.037 | |
| Time with SaO2 |
2.1 (0.4–10.0) | 1.8 (0.3–8.0) | 3.0 (0.3–10.0) | 3.0 (0.5–12.0) | 0.001 | |
| Epworth sleepiness scale | 7.0 (4.0–11.0) | 6.0 (3.0–10.0) | 7.0 (4.0–11.0) | 8.0 (5.0–12.0) | ||
| Medications on Discharge | ||||||
| Aspirin | 1805 (97.4) | 600 (96.5) | 597 (97.9) | 608 (97.9) | 0.190 | |
| P2Y12 inhibitors | 1702 (91.9) | 557 (89.5) | 568 (93.1) | 577 (92.9) | 0.036 | |
| 1429 (77.1) | 452 (72.7) | 478 (78.4) | 499 (80.4) | 0.004 | ||
| ACEIs/ARBs | 1151 (62.1) | 365 (58.7) | 395 (64.8) | 391 (63.0) | 0.078 | |
| Statins | 1825 (98.5) | 615 (98.9) | 602 (98.7) | 608 (97.9) | 0.333 | |
ACEI, angiotensin-converting enzymes inhibitor; AHI, apnea-hypopnea index; ARB, angiotensin receptor blocker; CABG, coronary artery bypass grafting; DES, drug eluting stent; NSTEMI, non-ST-segment elevation myocardial infarction; ODI, oxygen desaturation index; OSA, obstructive sleep apnea; PCI, percutaneous coronary intervention; SaO2, arterial oxygen saturation; STEMI, ST-segment-elevation myocardial infarction; TIMI, thrombolysis in myocardial infarction; TyG, triglyceride glucose; UA, unstable angina.
After a median follow-up of 35.1 (19.0–43.5) months, the association between
OSA and cardiovascular event risk was further assessed utilizing Cox regression
analysis. In the unadjusted model, OSA in the high TyG group (
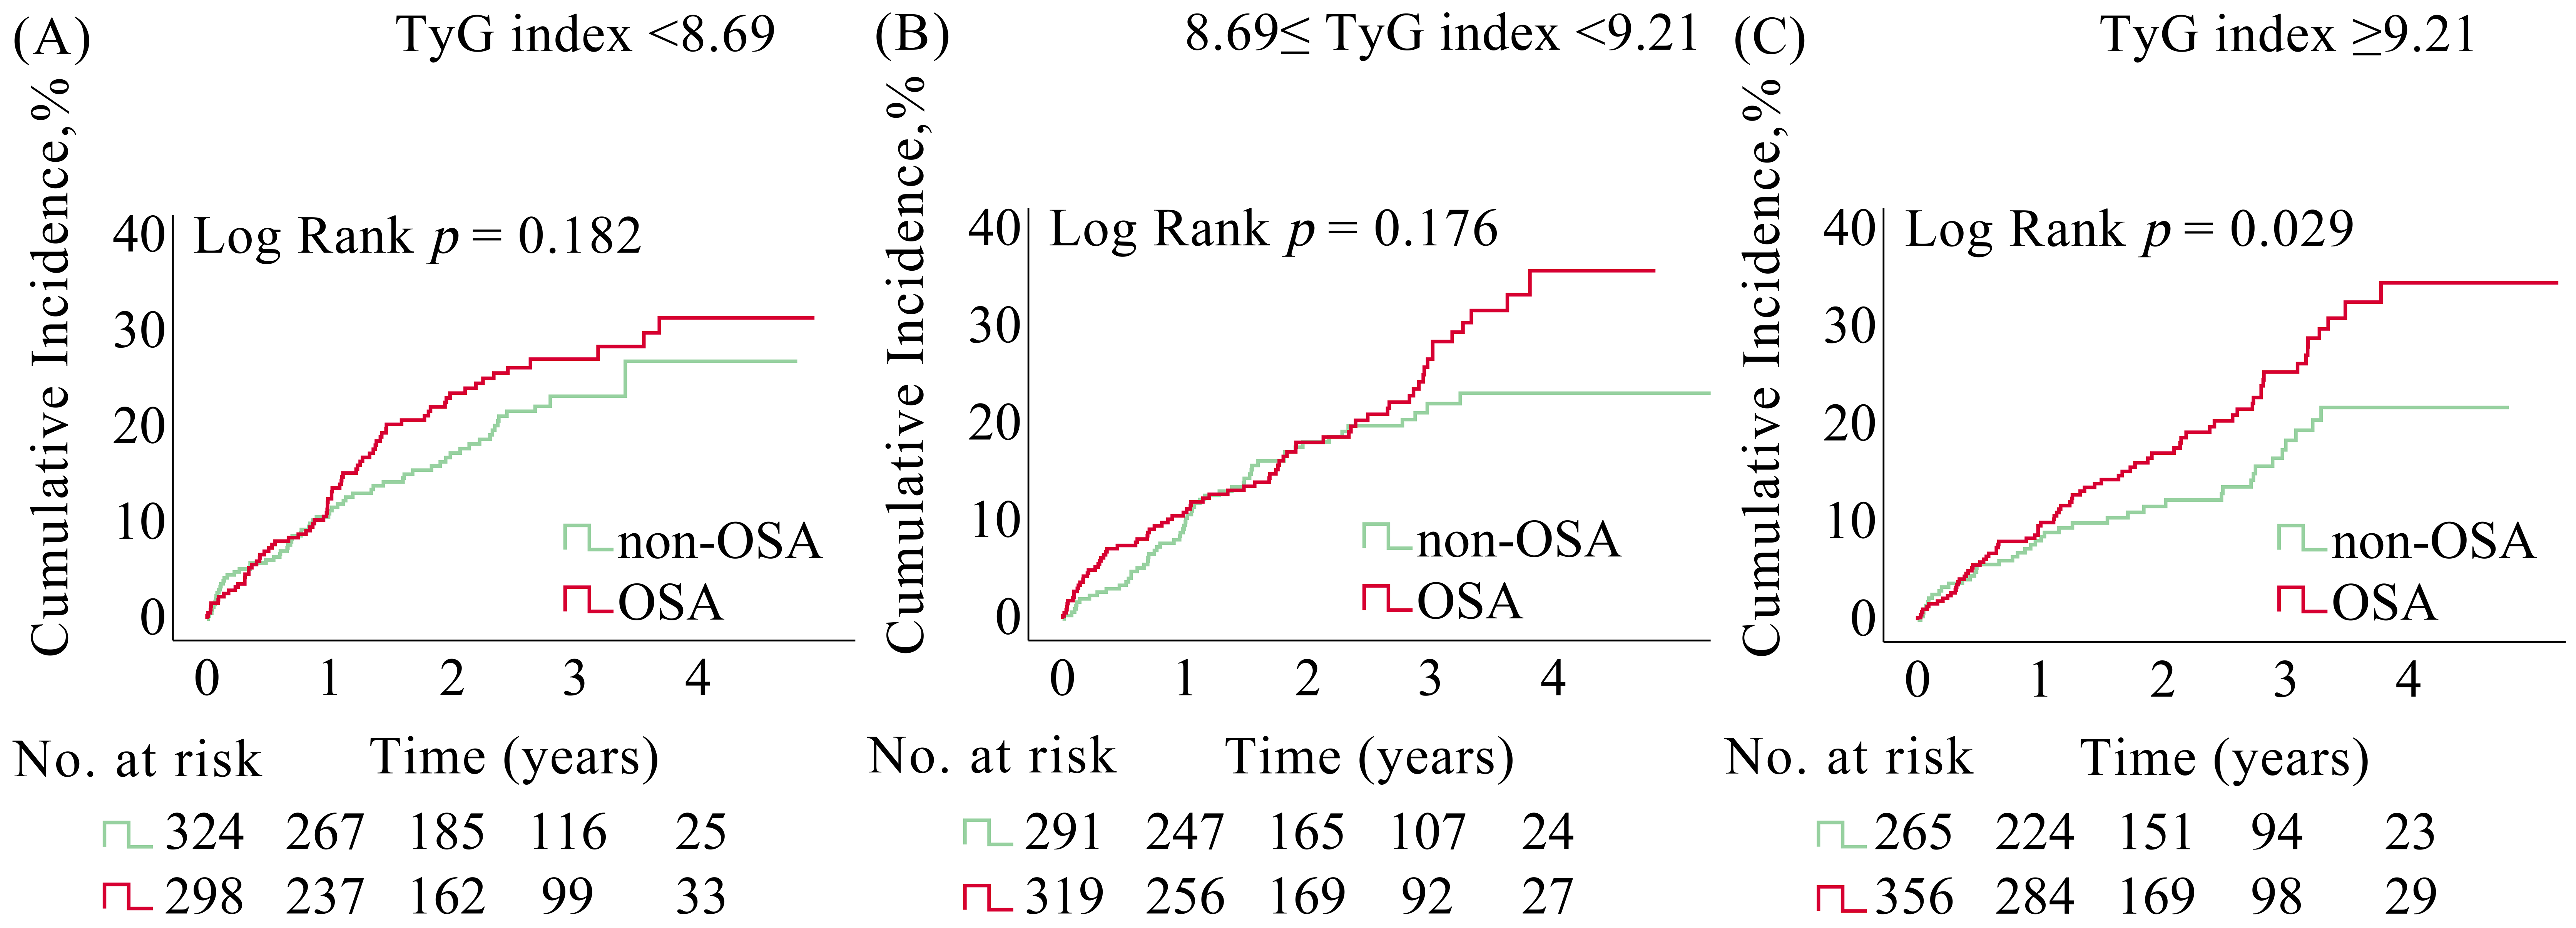 Fig. 2.
Kaplan-Meier curves for MACCE in ACS patients with and without OSA stratified by TyG index. Kaplan-Meier estimates for MACCE in ACS patients from the (A) low TyG group, (B) moderate TyG group, and (C) high TyG group. ACS, acute coronary syndrome; MACCE, major adverse cardiovascular and cerebrovascular events; OSA, obstructive sleep apnea; TyG, triglyceride glucose.
| Unadjusted | Partially adjusted* | Fully adjusted† | |||||
| HR (95% CI) | p value | HR (95% CI) | p value | HR (95% CI) | p value | ||
| MACCE | |||||||
| TyG index |
1.259 (0.897–1.768) | 0.183 | 1.233 (0.877–1.735) | 0.228 | 1.068 (0.737–1.546) | 0.729 | |
| 8.69 |
1.276 (0.896–1.818) | 0.177 | 1.271 (0.889–1.819) | 0.189 | 1.186 (0.810–1.735) | 0.381 | |
| TyG index |
1.530 (1.041–2.249) | 0.030 | 1.549 (1.053–2.280) | 0.026 | 1.556 (1.040–2.326) | 0.031 | |
| Cardiovascular death | |||||||
| TyG index |
3.341 (0.904–12.342) | 0.070 | 3.238 (0.872–12.021) | 0.079 | 3.851 (0.950–15.608) | 0.059 | |
| 8.69 |
0.619 (0.175–2.193) | 0.457 | 0.532 (0.150–1.887) | 0.328 | 0.152 (0.027–1.105) | 0.062 | |
| TyG index |
0.768 (0.222–2.654) | 0.677 | 0.681 (0.195–2.375) | 0.547 | 0.828 (0.205–3.339) | 0.791 | |
| Myocardial infarction | |||||||
| TyG index |
0.821 (0.285–2.365) | 0.714 | 0.802 (0.277–2.319) | 0.684 | 0.681 (0.206–2.257) | 0.530 | |
| 8.69 |
2.130 (0.740–6.130) | 0.161 | 2.121 (0.734–6.129) | 0.165 | 1.660 (0.538–5.121) | 0.378 | |
| TyG index |
1.093 (0.415–2.880) | 0.858 | 1.069 (0.404–2.831) | 0.893 | 0.913 (0.318–2.620) | 0.865 | |
| Stroke | |||||||
| TyG index |
0.662 (0.241–1.821) | 0.424 | 0.679 (0.245–1.878) | 0.456 | 0.530 (0.166–1.688) | 0.282 | |
| 8.69 |
1.900 (0.572–6.311) | 0.295 | 1.842 (0.552–6.145) | 0.320 | 1.687 (0.466–6.109) | 0.426 | |
| TyG index |
1.560 (0.533–4.568) | 0.417 | 1.551 (0.527–4.562) | 0.426 | 2.040 (0.630–6.610) | 0.234 | |
| Hospitalization for UA | |||||||
| TyG index |
1.274 (0.853–1.902) | 0.237 | 1.242 (0.830–1.859) | 0.292 | 1.023 (0.660–1.584) | 0.920 | |
| 8.69 |
1.177 (0.775–1.787) | 0.446 | 1.225 (0.802–1.870) | 0.348 | 1.186 (0.761–1.847) | 0.451 | |
| TyG index |
1.770 (1.091–2.872) | 0.021 | 1.822 (1.120–2.963) | 0.016 | 1.785 (1.072–2.971) | 0.026 | |
| Hospitalization for HF | |||||||
| TyG index |
0.966 (0.193–4.825) | 0.966 | 0.836 (0.166–4.221) | 0.828 | 1.164 (0.122–11.080) | 0.895 | |
| 8.69 |
1.274 (0.285–5.697) | 0.751 | 1.281 (0.286–5.740) | 0.746 | 0.805 (0.071–9.084) | 0.861 | |
| TyG index |
1.058 (0.237–4.728) | 0.942 | 0.721 (0.158–3.296) | 0.673 | 1.127 (0.197–6.455) | 0.894 | |
| Ischemia-driven revascularization | |||||||
| TyG index |
1.277 (0.748–2.181) | 0.37 | 1.231 (0.720–2.106) | 0.448 | 0.940 (0.523–1.693) | 0.838 | |
| 8.69 |
1.277 (0.752–2.168) | 0.365 | 1.349 (0.789–2.307) | 0.273 | 1.286 (0.727–2.276) | 0.387 | |
| TyG index |
1.976 (1.009–3.856) | 0.047 | 2.014 (1.028–3.947) | 0.041 | 2.013 (0.973–4.164) | 0.059 | |
| Composite for cardiovascular death, myocardial infarction, or ischemic stroke | |||||||
| TyG index |
1.099 (0.591–2.042) | 0.766 | 1.100 (0.590–2.051) | 0.764 | 0.970 (0.484–1.944) | 0.932 | |
| 8.69 |
1.569 (0.807–3.050) | 0.184 | 1.495 (0.767–2.913) | 0.237 | 1.073 (0.521–2.212) | 0.849 | |
| TyG index |
1.301 (0.685–2.470) | 0.421 | 1.259 (0.661–2.397) | 0.484 | 1.318 (0.668–2.602) | 0.426 | |
| Composite for cardiac events§ | |||||||
| TyG index |
1.348 (0.942–1.927) | 0.102 | 1.309 (0.913–1.876) | 0.142 | 1.113 (0.753–1.645) | 0.590 | |
| 8.69 |
1.203 (0.835–1.732) | 0.322 | 1.212 (0.837–1.753) | 0.309 | 1.133 (0.766–1.676) | 0.532 | |
| TyG index |
1.513 (1.002–2.285) | 0.049 | 1.534 (1.014–2.321) | 0.043 | 1.490 (0.968–2.295) | 0.070 | |
| All repeat revascularization | |||||||
| TyG index |
1.130 (0.705–1.811) | 0.613 | 1.089 (0.679–1.749) | 0.723 | 0.883 (0.525–1.483) | 0.637 | |
| 8.69 |
1.332 (0.852–2.083) | 0.209 | 1.359 (0.865–2.134) | 0.184 | 1.270 (0.786–2.051) | 0.328 | |
| TyG index |
1.279 (0.786–2.083) | 0.322 | 1.298 (0.795–2.119) | 0.297 | 1.166 (0.696–1.953) | 0.560 | |
*Adjusted for age and sex. †Adjusted for age, sex, body mass index (BMI), estimated glomerular filtration rate (eGFR), left ventricular ejection fraction, diabetes, hypertension, prior stroke, prior myocardial infarction, smoking, diagnosis, presence of heart failure (HF), coronary artery bypass grafting (CABG), P2Y12 inhibitors, and β-blockers. §Include cardiovascular death, myocardial infarction, ischemia-driven revascularization, or hospitalization for UA or HF. CI, confidence interval; HF, heart failure; HR, hazard ratio; MACCE, major adverse cardiovascular and cerebrovascular events; OSA, obstructive sleep apnea; TyG, triglyceride glucose; UA, unstable angina.
This study reveals that in ACS patients, the co-presence of OSA and a high TyG index significantly elevates the risks of MACCE and hospitalization for UA. Moreover, it is the first systematic assessment of the OSA’s impact on cardiovascular outcomes in ACS patients categorized by TyG index levels.
TyG, as a non-invasive surrogate marker for insulin resistance, reflects the
degree of insulin resistance [26]. Insulin resistance is defined as a reduced
responsiveness of target tissues to elevated insulin levels, characterized by
impaired glucose uptake, decreased glycogen synthesis, and diminished lipid
oxidation capacity [27]. This condition consequently heightens the risk of
oxidative stress and inflammation.
OSA induces oxidative stress through intermittent hypoxia, which subsequently
triggers inflammation and endothelial injury—key factors in the progression of
atherosclerosis and subsequent cardiovascular disease [31, 32]. Intermittent
hypoxia also activates the pro-inflammatory transcription factor nuclear
factor-
Nevertheless, existing literature lacks investigations into the association
between OSA and cardiovascular outcomes in ACS patients categorized by TyG index.
In a study of 154 patients with type 2 diabetes, Ding and Jiang [37] reported that in
those aged
Our findings hold significant clinical relevance and have the potential to
advance risk stratification and management strategies for ACS patients. Screening
for OSA has not been a routine component of the risk assessment protocol for ACS
patients. However, our analysis suggests that the integration of OSA screening,
particularly in ACS patients with an elevated TyG index, can effectively identify
individuals at higher cardiovascular risk and enable personalized therapeutic
interventions targeting both metabolic dysfunction and OSA, thereby mitigating
composite cardiovascular risk. Furthermore,
The strengths of this study include a large, well-characterized cohort from the OSA-ACS study, enabling stratified analysis based on TyG index. Moreover, the utilization of comprehensive clinical data and standardized diagnosis criteria for OSA enhances the reliability of our findings. These strengths enable us to investigate the interplay between metabolic and sleep-related factors, providing nuanced insights into their synergistic effects on cardiovascular outcomes and supporting the clinical validity and applicability of our conclusions.
This study has several limitations. First, as a single-center cohort study, our conclusions lack validation from external datasets, potentially affecting the robustness and generalizability of our findings to broader populations. Second, although the TyG index has been validated in multiple studies as a reliable surrogate marker for insulin resistance, this study did not employ the gold-standard method for measuring insulin resistance, which may somewhat weaken the support for our conclusions. Third, OSA was assessed using portable polysomnography, which may have reduced accuracy compared to standard laboratory-based polysomnography, potentially affecting the precision of certain sleep-related parameters. Fourth, insufficient documentation of adherence to lifestyle modifications during the follow-up period prevented adequate adjustment for these potential confounders. Furthermore, low adherence to CPAP therapy following discharge significantly constrained our ability to evaluate treatment-specific effects.
This post-hoc analysis reveals that in ACS patients with high TyG index, OSA significantly increases cardiovascular event risk, suggesting a potential synergistic effect between metabolic dysregulation and OSA that intensifies cardiovascular burden in ACS patients. These findings underscore the value of OSA screening in this high-risk population to optimize risk stratification and guide therapeutic decision-making, ultimately improving long-term cardiovascular outcomes and advancing individualized management strategies for ACS patients.
The data regarding this article will be shared by the corresponding author upon reasonable request.
YKZ: Conceptualization, Methodology, Formal analysis, Writing-original draft. DX: Conceptualization, Methodology, Data curation, Formal analysis, Writing-review & editing. WZ: Conceptualization, Data curation, Writing-review & editing. WH: Conceptualization, Writing-review & editing. LZ: Conceptualization, Writing-review & editing. YY: Conceptualization, Writing-review & editing. XW: Conceptualization, Methodology, Funding acquisition, Writing-review & editing. SPN: Conceptualization, Methodology, Funding acquisition, Writing-review & editing, Project administration. All authors read and approved the final manuscript. All authors have participated sufficiently in the work and agreed to be accountable for all aspects of the work.
The study adhered to the Declaration of Helsinki and was approved by Ethics Committee of Beijing Anzhen Hospital, Capital Medical University (Approval No.: 2013025). All patients or their families/legal guardians provided signed informed consent.
Not applicable.
Dr. Shaoping Nie was funded by Beijing Municipal Science & Technology Commission, China (Z221100003522027), Beijing Hospitals Authority Clinical Medicine Development of special funding support (ZLRK202318), and National Natural Science Foundation of China (82270258). Dr. Xiao Wang was funded by grants from National Key R&D Program of China (2022YFC2505600) and Beijing Municipal Natural Science Foundation Grant (JQ24039).
The authors have no conflicts of interest to declare.
Supplementary material associated with this article can be found, in the online version, at https://doi.org/10.31083/RCM36205.
References
Publisher’s Note: IMR Press stays neutral with regard to jurisdictional claims in published maps and institutional affiliations.