


 , Raquel López-Vilella 1,2,3,†, Víctor Donoso 1,2, Julia Martínez-Solé 1,2, Valero Soriano 2, Sara Huélamo 2, Susana Beltrán 2, Ana Elisa Astudillo 2, Mireia Company 2, Borja Guerrero 2, Luis Martínez 2,3, Luis Almenar-Bonet 1,2,3
1 Heart Failure and Transplant Unit, Hospital Universitari i Politècnic La Fe, 46007 Valencia, Spain
2 Cardiology Department, Hospital Universitari i Politècnic La Fe, 46007 Valencia, Spain
3 Centro de Investigación Biomédica en Red de Enfermedades Cardiovasculares (CIBERCV), Instituto de Salud Carlos III, 28029 Madrid, Spain
†These authors contributed equally.
Abstract
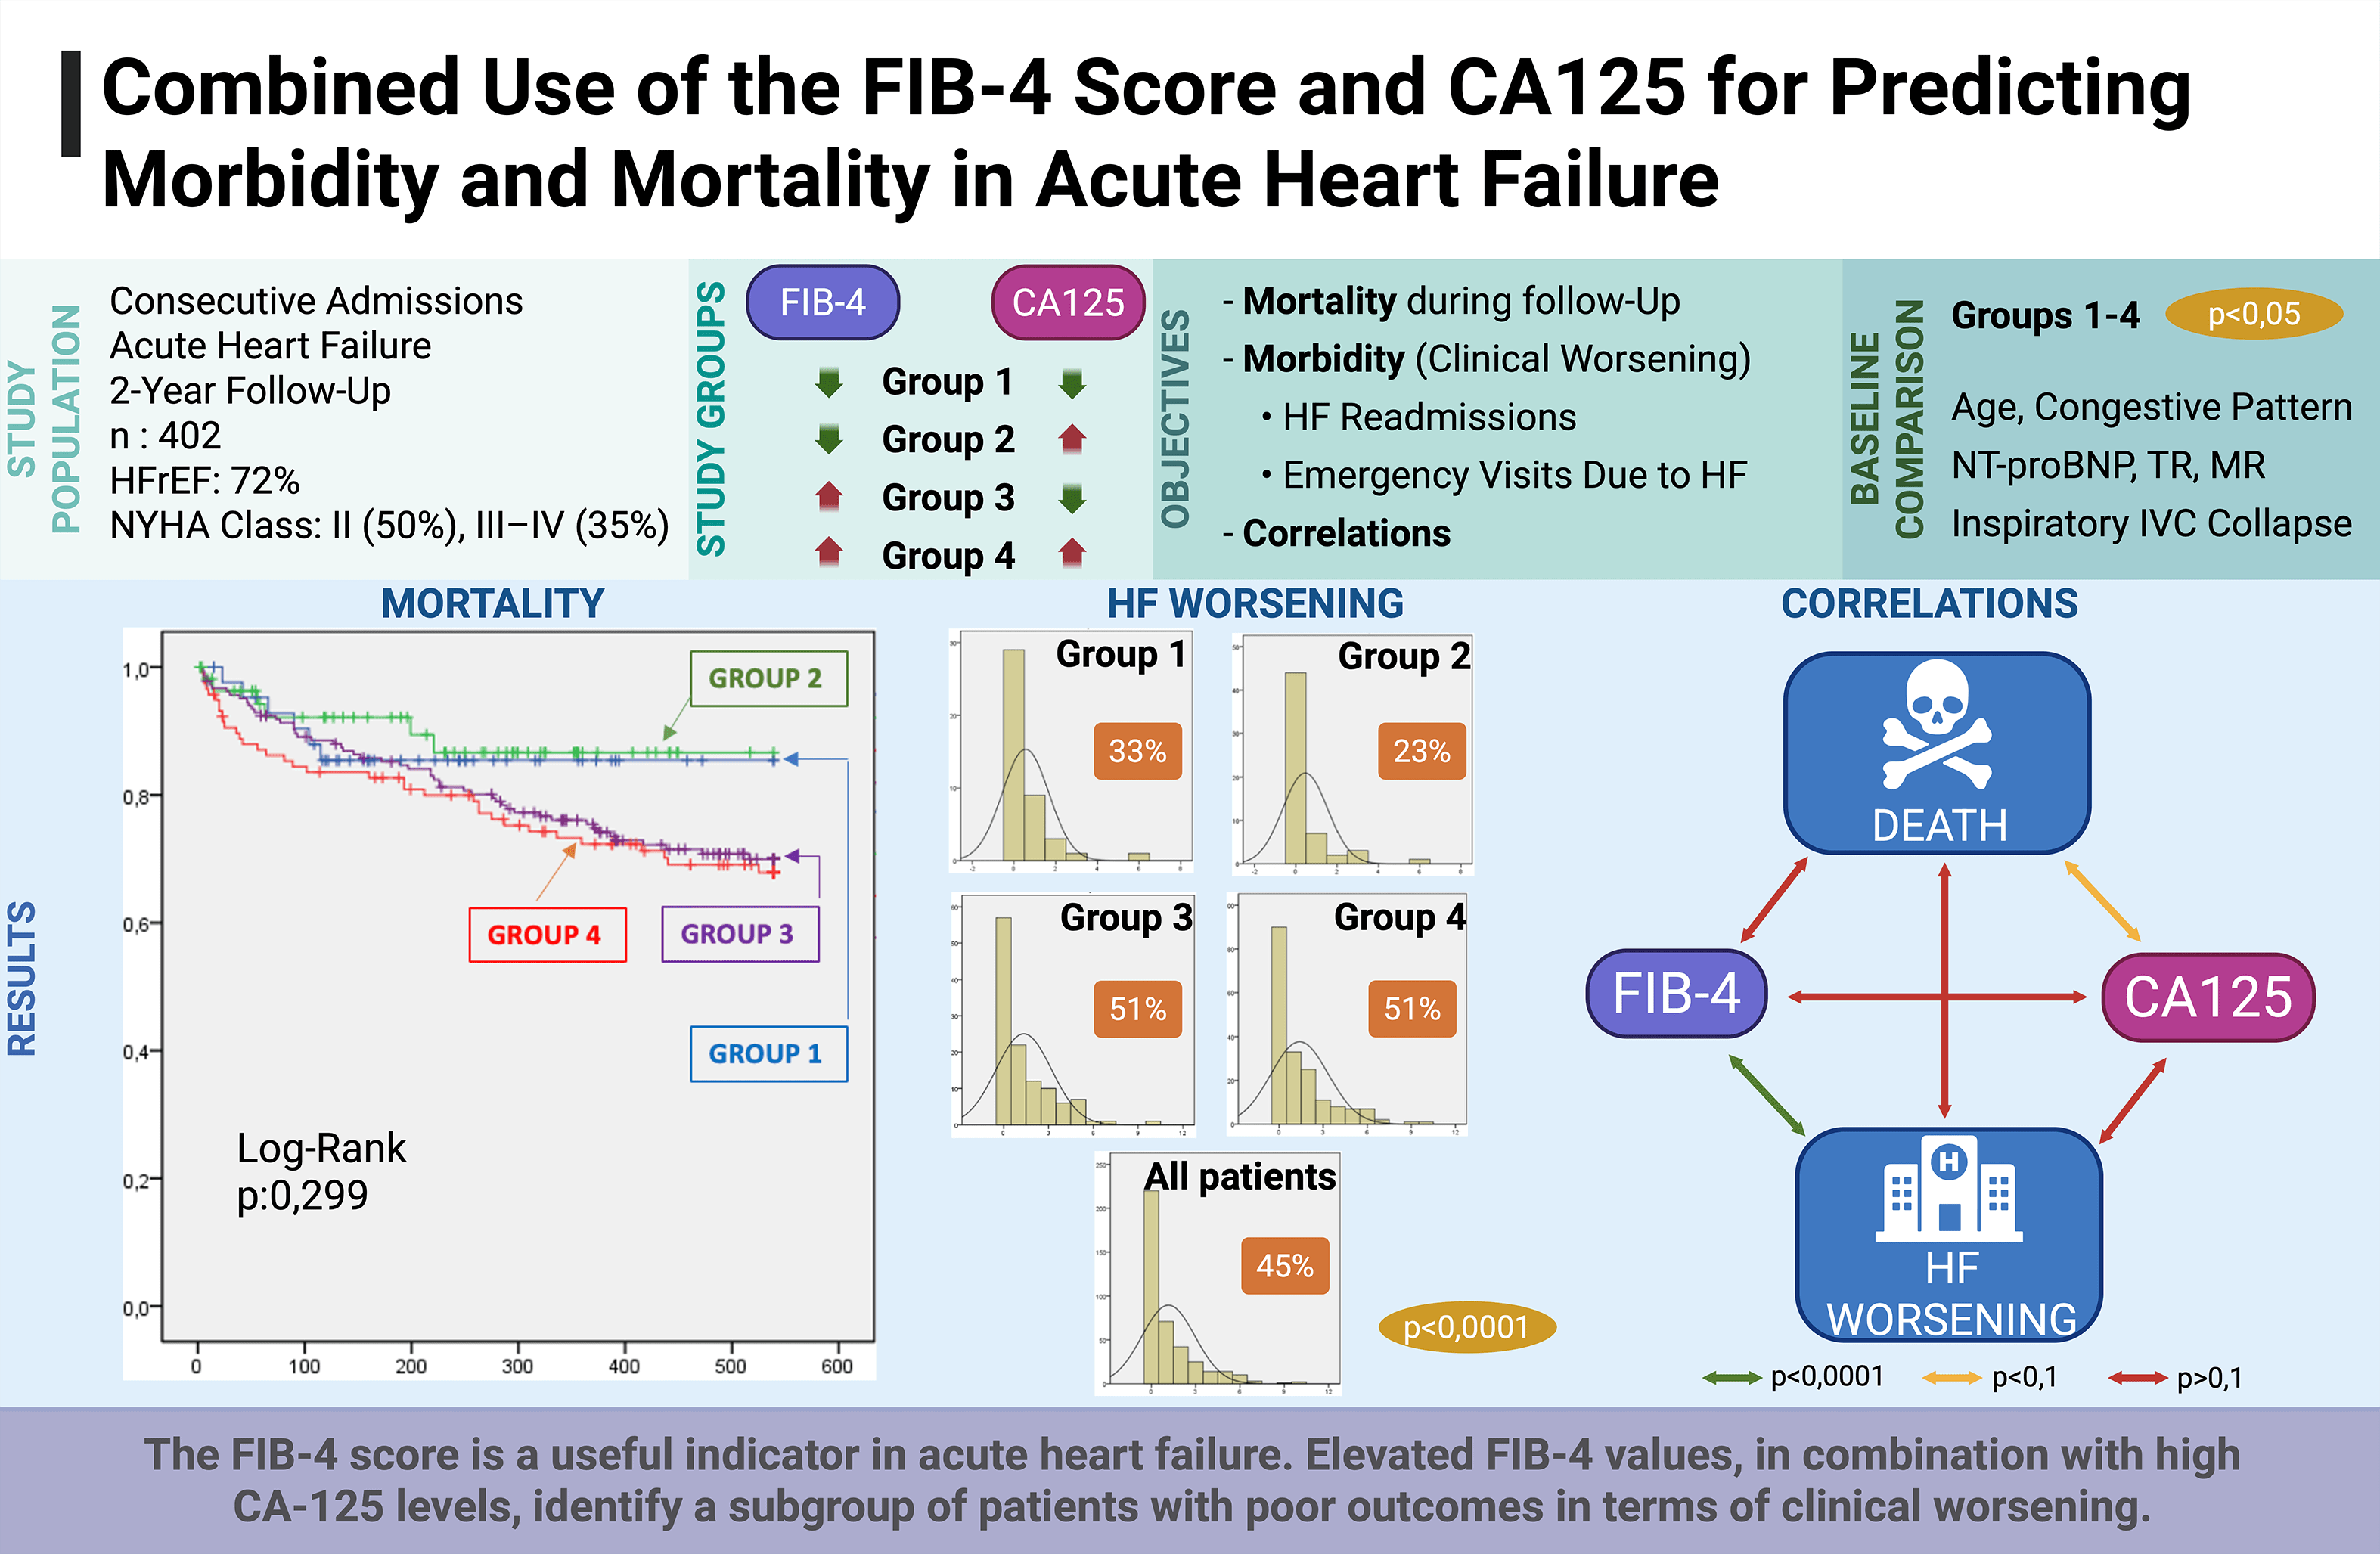
The implementation of the fibrosis 4 (FIB-4) index was initially associated with hepatic dysfunction; however, this index may also provide prognostic information in heart failure (HF). Thus, this study aimed to assess whether combining the FIB-4 and carbohydrate antigen 125 (CA125) indices in patients hospitalized for acute heart failure (AHF) can identify subgroups with differing risks of morbidity and mortality.
This retrospective study included 402 patients consecutively admitted for AHF between January 2023 and December 2024, after excluding elective admissions (n = 403), inter-hospital transfers (n = 232), and low-output cases (n = 51). Patients were stratified into four groups according to the FIB-4 score (<1.3 or high) and CA125 value (≤50 U/mL or high): Group 1 (low FIB-4 + low CA125; n = 43), Group 2 (low FIB-4 + high CA125; n = 57), Group 3 (high FIB-4 + low CA125; n = 117), and Group 4 (high FIB-4 + high CA125; n = 185). Clinical, echocardiographic, therapeutic, and laboratory variables were analyzed, as well as morbidity (HF-related emergency visits and readmissions) and all-cause mortality.
Patients with both elevated FIB-4 and CA125 values had a higher prevalence of systemic/mixed congestion (p < 0.01), higher N-terminal pro-B-type natriuretic peptide (NT-proBNP) levels (p < 0.01), and less frequent inspiratory inferior vena cava (IVC) collapse (p < 0.01). Although no survival differences were observed (p = 0.29), morbidity was significantly higher in group 4: more worsening episodes per patient (p = 0.0001), increased HF readmissions (p = 0.004), and more emergency visits (p = 0.001). The FIB-4 index correlated positively with worsening episodes (p < 0.0001), and the CA125 value showed a trend with mortality. No significant correlation was found between FIB-4 and CA125 or between FIB-4 and mortality (p > 0.1).
The FIB-4 index may be a useful indicator in AHF. Elevated values at admission for decompensation, in combination with high CA125 levels, can be used to identify a subgroup of patients with poor short- to medium-term outcomes, particularly in terms of worsening. Further studies are needed to determine the actual utility of the FIB-4 index in the context of AHF.
Graphical Abstract
Keywords
- FIB-4
- CA125
- acute heart failure
- biomarkers
- prognosis
- worsening
- mortality
Acute heart failure (AHF) is a condition associated with high morbidity and mortality and represents one of the leading causes of hospital admission in cardiology departments [1]. Systemic congestion, particularly hepatic congestion, plays a key role not only in the clinical presentation but also in preventing hospitalizations and disease progression [2]. Proper assessment of the congestion status is essential for therapeutic management and risk stratification in these patients [3].
The FIB-4 index, originally developed to estimate the degree of liver fibrosis in patients with viral hepatitis, has emerged as a prognostic tool in heart failure (HF) [4, 5]. This index, calculated from age, aspartate aminotransferase (AST), alanine aminotransferase (ALT), and platelet count, may reflect the impact of hepatic congestion in both chronic and acute HF scenarios. Recent studies have shown that elevated FIB-4 values are associated with higher mortality and rehospitalization in AHF patients, suggesting that congestion-induced liver dysfunction is an indirect marker of the severity of the congestive syndrome [6, 7].
On the other hand, carbohydrate antigen 125 (CA125), widely used in oncology as a marker for ovarian neoplasms, has shown utility as a biomarker of systemic volume overload in HF [8]. CA125 levels are known to rise in response to systemic inflammation and endothelial activation under hypervolemic conditions. Several studies have documented that elevated CA125 concentrations in HF patients correlate with greater clinical severity, poorer response to diuretic therapy, and increased risk of adverse events, including hospitalization and death [8, 9, 10, 11].
These distinct biological pathways suggest that each biomarker could provide complementary information and might enhance risk stratification in AHF. The primary objective of the study was to analyze the clinical characteristics associated with the combined blood levels of these biomarkers, compare short- and mid-term survival, determine their relationship with morbidity and mortality, and assess the correlation between both serum markers.
This was a retrospective study based on a database of patients consecutively admitted for AHF at the Department of Cardiology of a tertiary care hospital. Data collection was performed during hospitalization and was extracted and stored by a team of clinical cardiologists specialized in HF. Recruitment was conducted consecutively over 2 years (January 2023–December 2024), and 1088 patients were initially considered. Exclusion criteria included elective admissions (n = 403), inter-hospital transfers (n = 232), and low-output clinical syndromes (n = 51). The final sample comprised 402 patients.
FIB-4 was calculated using the formula: FIB-4 Index = [Age (years)
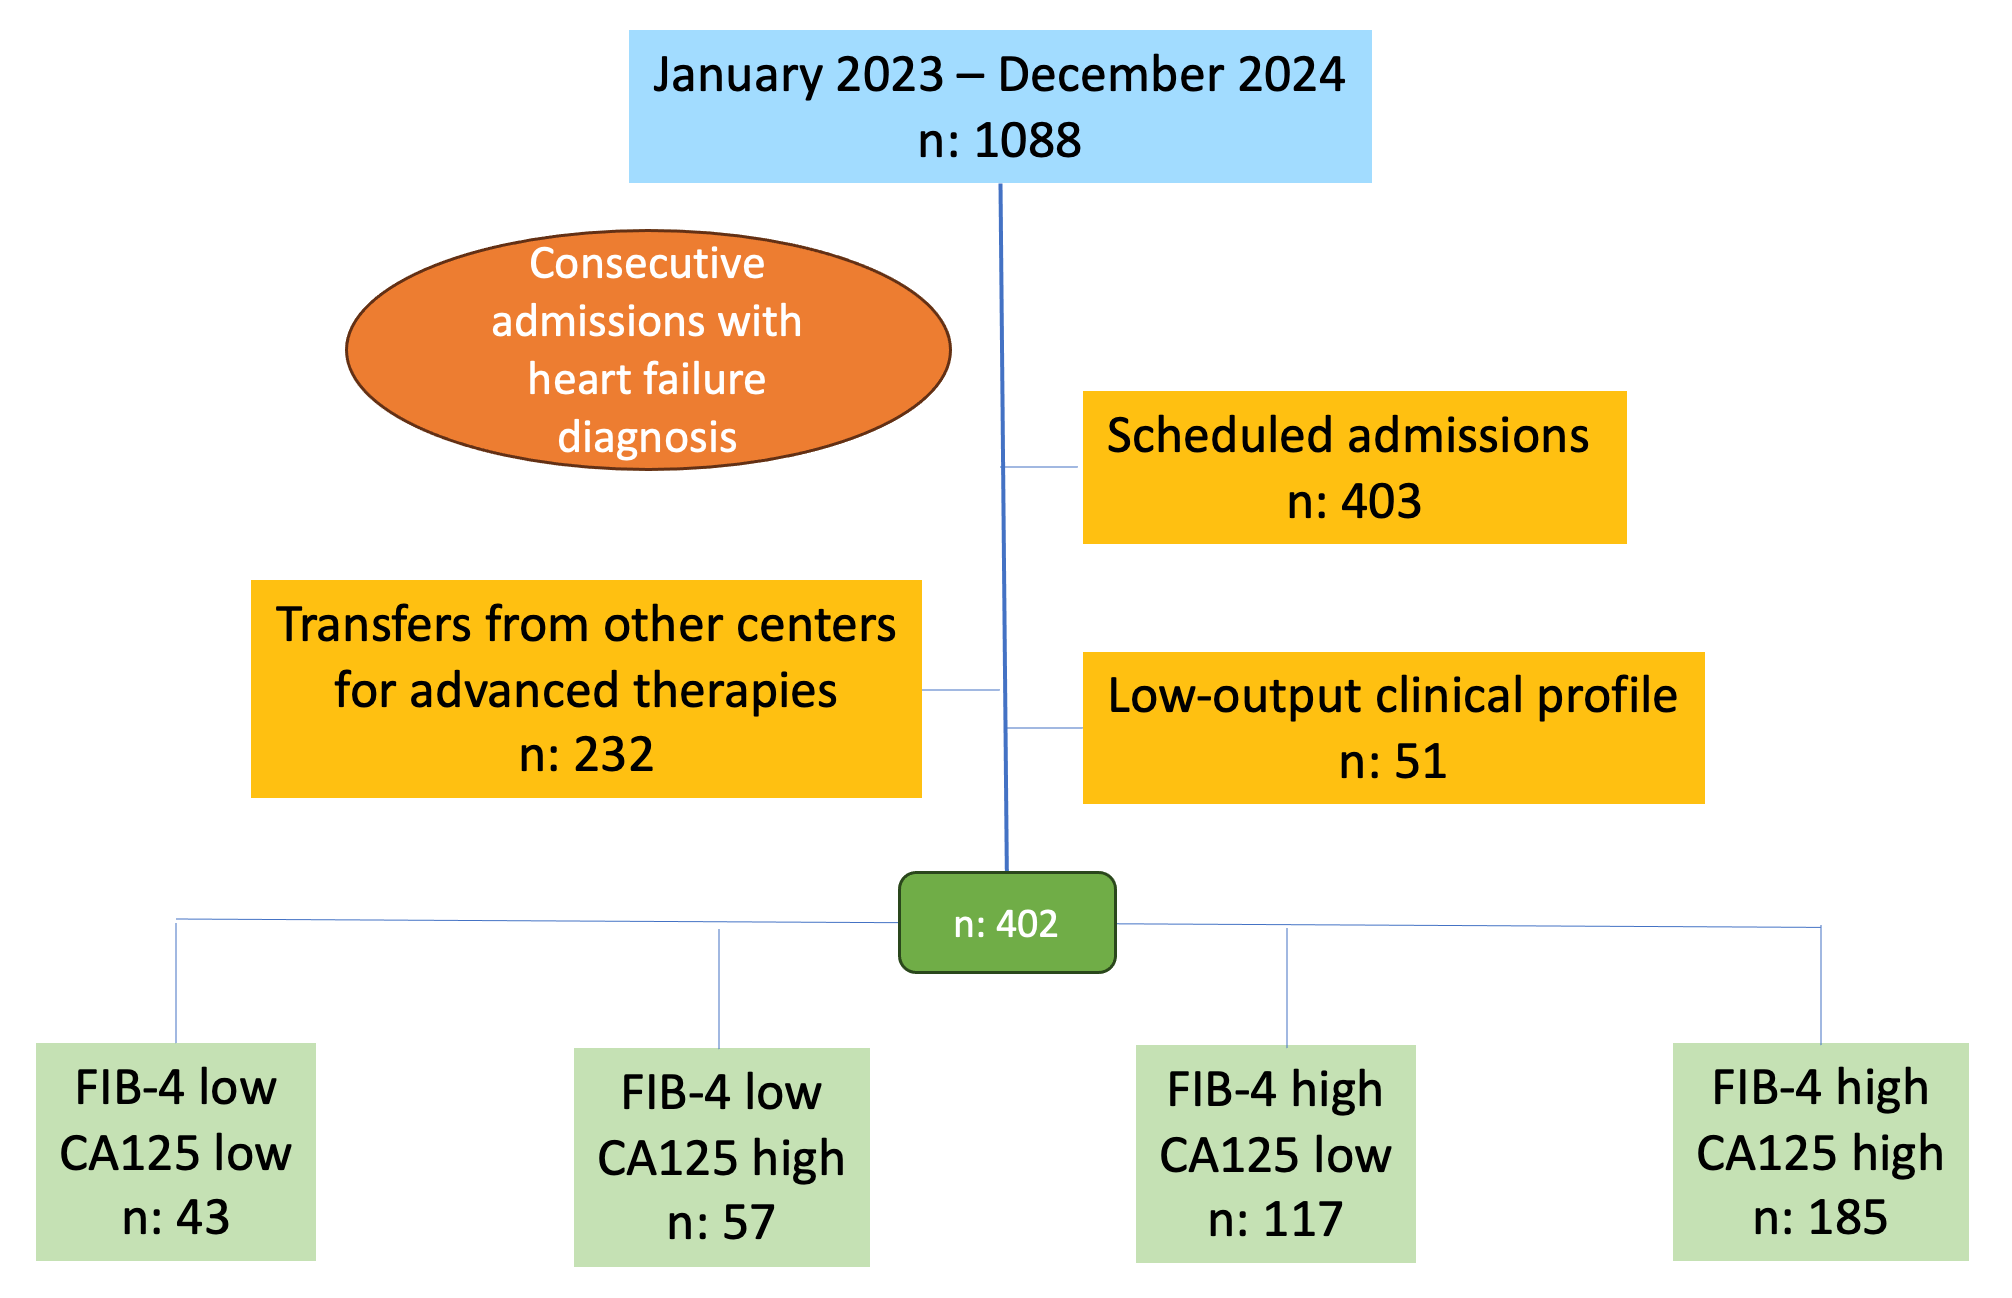 Fig. 1.
Study flow chart. Groups were defined according to biomarker
thresholds: FlB-4 low: FlB-4
Groups were compared, and follow-up analysis was performed for overall survival (all-cause mortality), morbidity (worsening—HF-related emergency visits and/or HF rehospitalizations), and correlation between both biomarkers. The study was conducted in accordance with the Declaration of Helsinki. The research protocol was approved by the Biomedical Research Ethics Committee of Hospital Universitari i Politècnic La Fe (reference code COMBICAR).
Survival analyses were performed using a time-to-first-event approach. For other outcomes such as hospitalizations, emergency visits, and worsening HF episodes, the total number of events per patient was calculated and summarized descriptively, without modeling recurrent events.
Categorical variables were expressed as percentages and continuous variables as mean (standard deviation) or median (interquartile range), depending on whether they followed a normal distribution, which was assessed using the Kolmogorov-Smirnov test. Comparisons between groups were performed using the Chi-square test with Yates’ correction when applicable for qualitative variables, and Student’s t-test or Mann-Whitney U test for continuous variables depending on distribution.
There were no missing data for the primary outcomes (mortality and worsening HF)
or for the main biomarkers (FIB-4 and CA125). For the remaining variables,
missing data were
Survival was analyzed using Kaplan-Meier curves, with comparisons made using the
Log-Rank test. The Pearson correlation test was used to analyze relationships
between the variables of interest. A p-value
Most patients were male (62%) with a mean age of 72
| FIB-4 |
FIB-4 |
FIB-4 |
FIB-4 |
p | All patients | ||
| CA125 |
CA125 |
CA125 |
CA125 |
n: 402 | |||
| n: 43 | n: 57 | n: 117 | n: 185 | ||||
| Age (years)# | 67 |
64 |
75 |
76 |
72.4 | ||
| Sex (male)% | 23 (53.5%) | 41 (71.9%) | 70 (59.8%) | 115 (62.2%) | 0.267 | 249 (61.9%) | |
| Baseline heart disease | 0.143 | ||||||
| HT | 8 (18.6%) | 4 (7.0%) | 13 (11.1%) | 16 (8.6%) | 41 (10.2%) | ||
| Ischaemic | 10 (23.3%) | 15 (26.3%) | 31 (26.5%) | 45 (24.3%) | 101 (25.1%) | ||
| IDCM | 2 (4.6%) | 6 (10.5%) | 16 (13.7%) | 27 (14.6%) | 51 (12.7%) | ||
| Valvular | 17 (39.5%) | 14 (24.6%) | 41 (35.0%) | 55 (29.7%) | 127 (31.6%) | ||
| Other | 6 (14.0%) | 18 (31.6%) | 16 (13.7%) | 42 (22.7%) | 82 (20.4%) | ||
| Previous CVS | 11 (25.6%) | 13 (22.8%) | 28 (23.9%) | 49 (26.5%) | 0.640 | 101 (25.1%) | |
| HT | 35 (81.4%) | 43 (75.4%) | 95 (81.2%) | 141 (76.2%) | 0.112 | 314 (78.1%) | |
| Dyslipidaemia | 24 (55.8%) | 39 (68.4%) | 74 (63.2%) | 110 (59.5%) | 0.111 | 247 (61.4%) | |
| Diabetes mellitus | 20 (46.5%) | 32 (56.1%) | 48 (41.0%) | 95 (51.4%) | 0.170 | 195 (48.5%) | |
| Active smoking* | 10 (23.3%) | 23 (40.4%) | 40 (34.2%) | 80 (43.2%) | 0.128 | 153 (38.1%) | |
| Active drinking | 1 (2.3%) | 6 (10.5%) | 9 (7.7%) | 16 (8.6%) | 0.177 | 32 (8.0%) | |
| COPD | 6 (14.0%) | 7 (12.3%) | 13 (11.1%) | 34 (18.4%) | 0.067 | 60 (14.9%) | |
| SAHS | 3 (7.0%) | 8 (14.0%) | 20 (17.1%) | 19 (10.3%) | 0.533 | 50 (12.4%) | |
| Obesity | 8 (18.6%) | 10 (17.5%) | 19 (16.2%) | 23 (12.4%) | 0.113 | 60 (14.9%) | |
| Renal failure | 16 (37.2%) | 24 (42.1%) | 49 (41.9%) | 72 (38.9%) | 0.185 | 161 (40.0%) | |
| Hypothyroidism | 7 (16.3%) | 6 (10.5%) | 10 (8.5%) | 20 (10.8%) | 0.418 | 43 (10.7%) | |
| Atrial fibrillation | 24 (55.8%) | 38 (66.7%) | 63 (53.8%) | 110 (59.5%) | 0.364 | 235 (58.5%) | |
| Stroke | 5 (11.6%) | 9 (15.8%) | 10 (8.5%) | 14 (7.6%) | 0.414 | 38 (9.5%) | |
| PVD | 4 (9.3%) | 2 (3.5%) | 15 (12.8%) | 15 (8.1%) | 0.191 | 36 (9.0%) | |
| Peritoneal dialysis | 1 (2.3%) | 0 (0.0%) | 0 (0.0%) | 2 (1.1%) | 0.507 | 3 (0.7%) | |
# Kolmogorov-Smirnov
Values are expressed as absolute numbers and percentage (in parentheses).
* Active smoker or ex-smoker
Abbreviations: CA125, Carbohydrate Antigen 125; COPD, chronic obstructive pulmonary disease; CVS, cardiovascular surgery; HT, hypertension; IDCM, idiopathic dilated cardiomyopathy; PVD, peripheral vascular disease; SAHS, sleep apnea-hypopnea syndrome.
| FIB-4 |
FIB-4 |
FIB-4 |
FIB-4 |
p | All patients | ||
| CA125 |
CA125 |
CA125 |
CA125 |
n: 402 | |||
| n: 43 | n: 57 | n: 117 | n: 185 | ||||
| De novo HF | 12 (27.9%) | 19 (33.3%) | 35 (29.9%) | 45 (24.3%) | 0.474 | 111 (27.6%) | |
| Functional class (NYHA) | 0.239 | ||||||
| I | 7 (16.3%) | 11 (19.3%) | 20 (17.1%) | 22 (11.9%) | 60 (14.9%) | ||
| II | 19 (44.2%) | 30 (52.6%) | 64 (54.7%) | 87 (47.0%) | 200 (49.8%) | ||
| III, IV | 17 (39.5%) | 16 (28.1%) | 33 (28.2%) | 76 (41.1%) | 142 (35.3%) | ||
| Congestive pattern | |||||||
| Pulmonary | 31 (72.1%) | 35 (61.4%) | 85 (72.6%) | 75 (40.5%) | 226 (56.2%) | ||
| Systemic | 2 (4.7%) | 4 (7.0%) | 8 (6.8%) | 30 (16.2%) | 44 (10.9%) | ||
| Mixed | 10 (23.2%) | 18 (31.6%) | 24 (20.5%) | 80 (43.2%) | 132 (32.8%) | ||
| Cause of decompensation | 0.028 | ||||||
| Progression | 7 (16.2%) | 21 (36.8%) | 28 (23.9%) | 59 (31.9%) | 115 (28.6%) | ||
| Infections | 5 (11.6%) | 6 (10.5%) | 22 (18.8%) | 22 (11.9%) | 55 (13.7%) | ||
| Arrhythmias | 12 (27.9%) | 13 (22.8%) | 22 (18.8%) | 39 (21.1%) | 86 (21.4%) | ||
| Unknown | 3 (7.0%) | 12 (21.1%) | 16 (13.7%) | 27 (14.6%) | 58 (14.4%) | ||
| Other | 16 (37.2%) | 5 (8.8%) | 29 (24.8%) | 38 (20.5%) | 88 (21.9%) | ||
| 15 (34.9%) | 22 (38.6%) | 35 (29.9%) | 65 (35.1%) | 0.319 | 137 (34.1%) | ||
| Inhospital days# | 8 [5–10] | 6 [5–9] | 7 [4–10] | 8 [5–13] | 0.0782 | 8 [5–11] | |
| SBP (mmHg)# | 132.1 |
141.2 |
136.3 |
134.7 |
0.332 | 134 | |
| DBP (mmHg)# | 74.9 |
77.1 |
75.2 |
77.8 |
0.435 | 77.6 | |
| HR (bpm)# | 89.3 |
90.6 |
84.6 |
86.9 |
0.463 | 87 | |
# Kolmogorov-Smirnov
Values are expressed as absolute numbers and percentage (in parentheses).
Abbreviations: CA125, Carbohydrate Antigen 125; SBP, Systolic Blood Pressure; DBP, Diastolic Blood Pressure; HR, Heart Rate; NYHA, New York Heart Association.
A high proportion of patients were receiving renin-angiotensin system inhibitors
(angiotensin-converting enzyme (ACE) inhibitors, angiotensin receptor blockers
(ARBs), or angiotensin receptor and neprilysin inhibitor (ARNI)) (52%),
beta-blockers (62%), and loop diuretics (65%) at admission. Mineralocorticoid
receptor antagonists (MRAs) were used in 31% of patients and sodium-glucose
cotransporter-2 inhibitors (SGLT2i) in 42%. Comparative analysis between groups
did not show statistically significant differences (p
| FIB-4 |
FIB-4 |
FIB-4 |
FIB-4 |
p | All patients | |
| CA125 |
CA125 |
CA125 |
CA125 |
n: 402 | ||
| n: 43 | n: 57 | n: 117 | n: 185 | |||
| ACEI/ARB/ARNI | 24 (55.8%) | 33 (57.9%) | 61 (52.1%) | 89 (48.1%) | 0.546 | 207 (51.5%) |
| Beta-blockers | 25 (58.1%) | 35 (61.4%) | 74 (63.2%) | 115 (62.2%) | 0.948 | 249 (61.9%) |
| MRA | 11 (25.6%) | 16 (28.1%) | 35 (29.9%) | 62 (33.5%) | 0.698 | 124 (30.8%) |
| SGLT2i | 15 (34.9%) | 27 (47.4%) | 44 (37.6%) | 84 (45.4%) | 0.339 | 170 (42.3%) |
| Loop diuretic | 28 (65.1%) | 35 (61.4%) | 70 (59.8%) | 127 (68.6%) | 0.431 | 260 (64.7%) |
| Thiazides | 11 (25.6%) | 13 (22.8%) | 21 (17.9%) | 36 (19.5%) | 0.694 | 81 (20.1%) |
| Tolvaptan | 0 (0.0%) | 2 (3.5%) | 2 (1.7%) | 3 (1.6%) | 0.610 | 7 (1.7%) |
| Acetazolamide | 1 (2.3%) | 2 (3.5%) | 3 (2.6%) | 5 (2.7%) | 0.982 | 11 (2.7%) |
| Nº diuretics#@ | 0.93 |
0.91 |
0.82 |
0.92 |
0.817 | 0.89 |
# Kolmogorov-Smirnov
Values are expressed as absolute numbers and percentage (in parentheses).
@ Excluding MRAs and SGLT2i.
Abbreviations: ACEI/ARB, angiotensin-converting enzyme inhibitors/angiotensin receptor blockers; ARNI, angiotensin receptor and neprilysin inhibitor; CA125, Carbohydrate antigen 125; MRA, mineralocorticoid receptor antagonist; SGLT2i, Sodium-glucose cotransporter 2 inhibitors.
| FIB-4 |
FIB-4 |
FIB-4 |
FIB-4 |
p | All patients | |
| CA125 |
CA125 |
CA125 |
CA125 |
n: 402 | ||
| n: 43 | n: 57 | n: 117 | n: 185 | |||
| Urea (mg/dL) | 54.5 [38.0–87.5] | 51.5 [37.5–72.8] | 54.0 [39.0–92.0] | 58.0 [40.0–84.0] | 0.787 | 55 [39–83] |
| Creatinine (mg/dL) | 1.1 [0.8–1.5] | 1.2 [0.9–1.6] | 1.3 [1.0–1.7] | 1.3 [0.9–1.8] | 0.227 | 1.2 [0.9–1.7] |
| Glomerular filtration rate (mL/min/1.73 m2) | 61.0 [35.5–77.5] | 48.0 [38.0–79.0] | 47.0 [31.0–67.0] | 51.0 [32.0–75.5] | 0.182 | 49 [34–74] |
| Bilirubin (mg/dL) | 0.5 [0.4–0.8] | 0.9 [0.6–1.2] | 0.7 [0.5–1.0] | 0.9 [0.6–1.5] | 0.8 [0.5–1.2] | |
| GOT/AST (U/L) | 18.0 [12.0–22.0] | 22.0 [18.0–25.0] | 25.0 [20.0–35.0] | 29.0 [22.0–40.0] | 25 [19–36] | |
| GPT/ALT (U/L) | 17.0 [13.0–31.0] | 22.0 [16.0–38.5] | 17.0 [12.0–24.0] | 19.0 [13.0–32.0] | 19 [13–30] | |
| usTnT (ng/L) | 47.4 [32.9–103.4] | 43.5 [26.4–64.2] | 47.0 [23.0–98.4] | 43.8 [29.4–97.0] | 0.819 | 46 [27–93] |
| NT-proBNP (pg/mL) | 3501 [2534–8058] | 6673 [3755–14,153] | 5739 [2416–10,394] | 7299 [3474–14,363] | 6336 [2966–12,328] | |
| Sodium (mEq/L) | 140 [136–142] | 138 [135–141] | 140 [137–142] | 138 [136–141] | 0.01 | 139 [136–141] |
| Potassium (mEq/L) | 4.3 [3.8–4.9] | 4.2 [3.7–4.6] | 4.3 [4.1–4.6] | 4.2 [3.8–4.6] | 0.114 | 4.2 [3.9–4.6] |
| Hemoglobin (g/dL) | 12.7 [11.5–13.5] | 12.2 [9.9–13.2] | 12.5 [10.9–14.2] | 12.3 [10.6–13.7] | 0.423 | 12.3 [10.7–13.8] |
| Hematocrit (%) | 40.1 [36.3–43.1] | 39.0 [34.1–42.8] | 39.3 [35.0–44.9] | 39.1 [34.2–43.6] | 0.742 | 39 [35–44] |
| Platelets ( |
293 [225–332] | 287 [231–336] | 186 [149–231] | 192 [161–241] | 209 [166–262] | |
| Uric acid (mg/dL) | 7.6 [6.2–8.6] | 7.7 [6.0–9.7] | 7.7 [6.3–9.0] | 7.8 [6.3–9.5] | 0.900 | 7.7 [6.3–9.3] |
| TSAT (%) | 18.0 [12.0–25.2] | 16.5 [11.0–21.8] | 20.0 [14.0–27.8] | 18.0 [13.0–25.0] | 0.148 | 19 [13–26] |
| Ferritin (ng/mL) | 88 [41–212] | 172 [81–388] | 177 [85–339] | 179 [85–387] | 0.05 | 165 [77–345] |
| FIB-4 | 0.9 [0.8–1.1] | 1.0 [0.8–1.1] | 2.4 [1.9–3.5] | 2.4 [1.9–3.7] | 2.1 [1.3–2.9] | |
| CA125 (U/mL) | 31 [20–43] | 137 [73–224] | 24 [15–33] | 140 [78–261] | 63 [30–158] |
Values are expressed as absolute numbers and percentage (in parentheses).
Abbreviations: ALT (GPT), alanine aminotransferase; AST (GOT), aspartate aminotransferase; CA125, Carbohydrate antigen 125; TSAT, transferrin saturation; NT-proBNP, N-terminal pro-B-type natriuretic peptide; usTnT, ultrasensitive troponin.
Reduced left ventricular ejection fraction (LVEF) was observed in 62% of
patients. Approximately 28% of patients had left ventricular hypertrophy and
30.3% had severe left atrial enlargement. Right ventricular (RV) function was
preserved in most cases (65%), although RV dilation was present in 53%. A
normal-sized IVC with inspiratory collapse
Echocardiographic comparisons showed that the group with both biomarkers
elevated had a higher prevalence of significant mitral regurgitation and
tricuspid regurgitation (p
| FIB-4 |
FIB-4 |
FIB-4 |
FIB-4 |
p | All patients | ||
| CA125 |
CA125 |
CA125 |
CA125 |
n: 402 | |||
| n: 43 | n: 57 | n: 117 | n: 185 | ||||
| Preserved LVEF ( |
16 (37.2%) | 17 (29.8%) | 34 (29.1%) | 45 (24.3%) | 0.359 | 112 (27.9%) | |
| Dilated LV (LV-EDD |
8 (18.6%) | 14 (24.6%) | 29 (24.8%) | 43 (23.2%) | 0.867 | 94 (23.4%) | |
| LVH ( |
13 (30.2%) | 19 (33.3%) | 33 (28.2%) | 47 (25.4%) | 0.675 | 112 (27.8%) | |
| Severe left atrial dilatation ( |
11 (25.6%) | 18 (31.6%) | 32 (27.4%) | 61 (33.0%) | 0.658 | 122 (30.3%) | |
| Significant valvulopathies* | |||||||
| AoR | 2 (4.7%) | 0 (0.0%) | 4 (3.4%) | 4 (2.2%) | 0.165 | 10 (2.5%) | |
| AoS | 5 (11.6%) | 2 (3.5%) | 16 (13.7%) | 18 (9.7%) | 0.215 | 41 (10.2%) | |
| MR | 4 (9.3%) | 5 (8.8%) | 7 (6.0%) | 32 (17.3%) | 0.020 | 48 (11.9%) | |
| MS | 2 (4.7%) | 3 (5.3%) | 0 (0.0%) | 4 (2.2%) | 0.178 | 9 (2.2%) | |
| TR | 4 (9.3%) | 9 (15.8%) | 9 (7.7%) | 37 (20.0%) | 0.048 | 59 (15%) | |
| RV function (TAPSE)& | |||||||
| Normal | 29 (67.4%) | 37 (64.9%) | 88 (75.2%) | 106 (57.3%) | 0.141 | 260 (64.6%) | |
| Mild dysfunction | 4 (9.3%) | 4 (7.0%) | 15 (12.8%) | 26 (14.1%) | 49 (12.2%) | ||
| Moderate dysfunction | 8 (18.6%) | 9 (15.8%) | 7 (6.0%) | 31 (16.8%) | 55 (13.7%) | ||
| Severe dysfunction | 2 (4.7%) | 7 (12.3%) | 7 (6.0%) | 22 (11.8%) | 38 (9.5%) | ||
| Dilated RV (Basal diameter |
6 (14.0%) | 12 (21.1%) | 26 (22.2%) | 52 (28.1%) | 0.205 | 96 (23.9%) | |
| Inferior vena cava (mm)# | 19.0 [17.5–21.5] | 19.0 [18.0–23.0] | 19.0 [18.0–23.0] | 19.0 [18.0–23.0] | 0.5485 | 19 [18.0–23.0] | |
| Vena cava collapse |
24 (55.8%) | 23 (40.4%) | 53 (45.3%) | 56 (30.3%) | 156 (38.8%) | ||
| PH (PAsP |
8 (18.6%) | 17 (29.8%) | 30 (25.6%) | 61 (33.0%) | 0.226 | 116 (28.9%) | |
*Moderate-severe + severe. Significant valvular disease accounted for 41.5% of all patients.
# Kolmogorov-Smirnov
Values are expressed as absolute numbers and percentage (in parentheses).
& TAPSE Ranges: Normal: TAPSE
Abbreviations: AoS, Aortic stenosis; AoR, Aortic regurgitation; CA125, Carbohydrate antigen 125; LV-EDD, Left ventricular end-diastolic diameter; LVEF, Left ventricular ejection fraction; MS, Mitral stenosis; MR, Mitral regurgitation; PH, Pulmonary hypertension; LVH, left ventricular hypertrophy; PAsP, pulmonary artery systolic pressure; RV, right ventricle; TAPSE, tricuspid annular plane systolic excursion; TR, Tricuspid regurgitation.
Survival was 94.5% at 30 days and 76.1% at one year, with an overall mortality
of 24.6%. No significant differences were found between groups (p =
0.29) (Table 6). Figs. 2,3 displays survival curves for the overall cohort and
the four study groups. Although there were no significant differences in survival
probability, curves begin to diverge after day 200–250, clustering according to
FIB-4 values regardless of CA125 levels. Kaplan–Meier survival analyses
stratified by FIB-4 and by CA125 separately are presented in
Supplementary Figs. 1,2. The number of worsening events was high, with
more than one episode per patient (mean 1.16), affecting nearly half the cohort,
more often due to readmissions (40%) than emergency visits (24%). Worsening was
more frequent in groups with elevated FIB-4, affecting more than 50% of these
patients (p = 0.0001) (Table 6). Fig. 4 shows the number of events per
patient and the percentage of affected patients in each group. No significant
correlations were found between FIB-4 and CA125, or between either marker and
mortality. A significant correlation was found only between FIB-4 and worsening
(p
| FIB-4 |
FIB-4 |
FIB-4 |
FIB-4 |
p | All patients | ||
| CA125 |
CA125 |
CA125 |
CA125 |
n: 402 | |||
| n: 43 | n: 57 | n: 117 | n: 185 | ||||
| Survival probability | 0.299 | ||||||
| 1 month | 0.976 (0.024) | 0.963 (0.026) | 0.905 (0.027) | 0.957 (0.015) | 0.945 (0.011) | ||
| 1 year | 0.854 (0.055) | 0.866 (0.052) | 0.723 (0.043) | 0.754 (0.032) | 0.761 (0.023) | ||
| End of follow-up | 0.854 (0.055) | 0.866 (0.052) | 0.679 (0.045) | 0.708 (0.035) | 0.750 (0.023) | ||
| No. of all-cause deaths | 6 (14.0%) | 6 (10.5%) | 35 (29.9%) | 52 (28.1%) | 99 (24.6) | ||
| Emergency department visits | 0.001 | ||||||
| No. of visits | 5 | 8 | 63 | 105 | 181 | ||
| No. of visits per patient | 0.12 | 0.14 | 0.54 | 0.57 | 0.45 | ||
| No. of patients (%) | 3 (7%) | 5 (9%) | 35 (30%) | 52 (28%) | 95 (24%) | ||
| Minimum-maximum | 0–2 | 0–3 | 0–9 | 0.6 | 0–9 | ||
| Readmissions | 0.004 | ||||||
| No. of readmissions | 19 | 18 | 95 | 153 | 285 | ||
| No. readmissions per patient | 0.44 | 0.32 | 0.81 | 0.83 | 0.71 | ||
| No. of patients (%) | 14 (33%) | 10 (18%) | 54 (46%) | 83 (45%) | 161 (40%) | ||
| Minimum-maximum | 0–3 | 0–4 | 0–7 | 0–6 | 0–7 | ||
| Worsening HF episodes | 0.0001 | ||||||
| No. of episodes | 24 | 26 | 158 | 258 | 466 | ||
| No. of episodes per patient | 0.56 | 0.46 | 1.35 | 1.39 | 1.16 | ||
| No. of patients (%) | 14 (33%) | 13 (23%) | 60 (51%) | 95 (51%) | 182 (45%) | ||
| Minimum-maximum | 0–6 | 0–6 | 0–10 | 0–10 | 0–10 | ||
Abbreviations: HF, Heart Failure; CA125, Carbohydrate antigen 125. Survival probabilities were estimated using the Kaplan–Meier method (standard error) and compared across groups with the log-rank test. The number of all-cause deaths is expressed as absolute values and percentages. For morbidity outcomes (emergency department visits, readmissions, and worsening HF episodes), the table shows absolute numbers, mean events per patient, and the proportion of affected patients; global comparisons were performed using the Chi-square test for categorical variables and Student’s t test or Mann–Whitney U test for continuous variables, as appropriate. p values correspond to overall between-group comparisons.
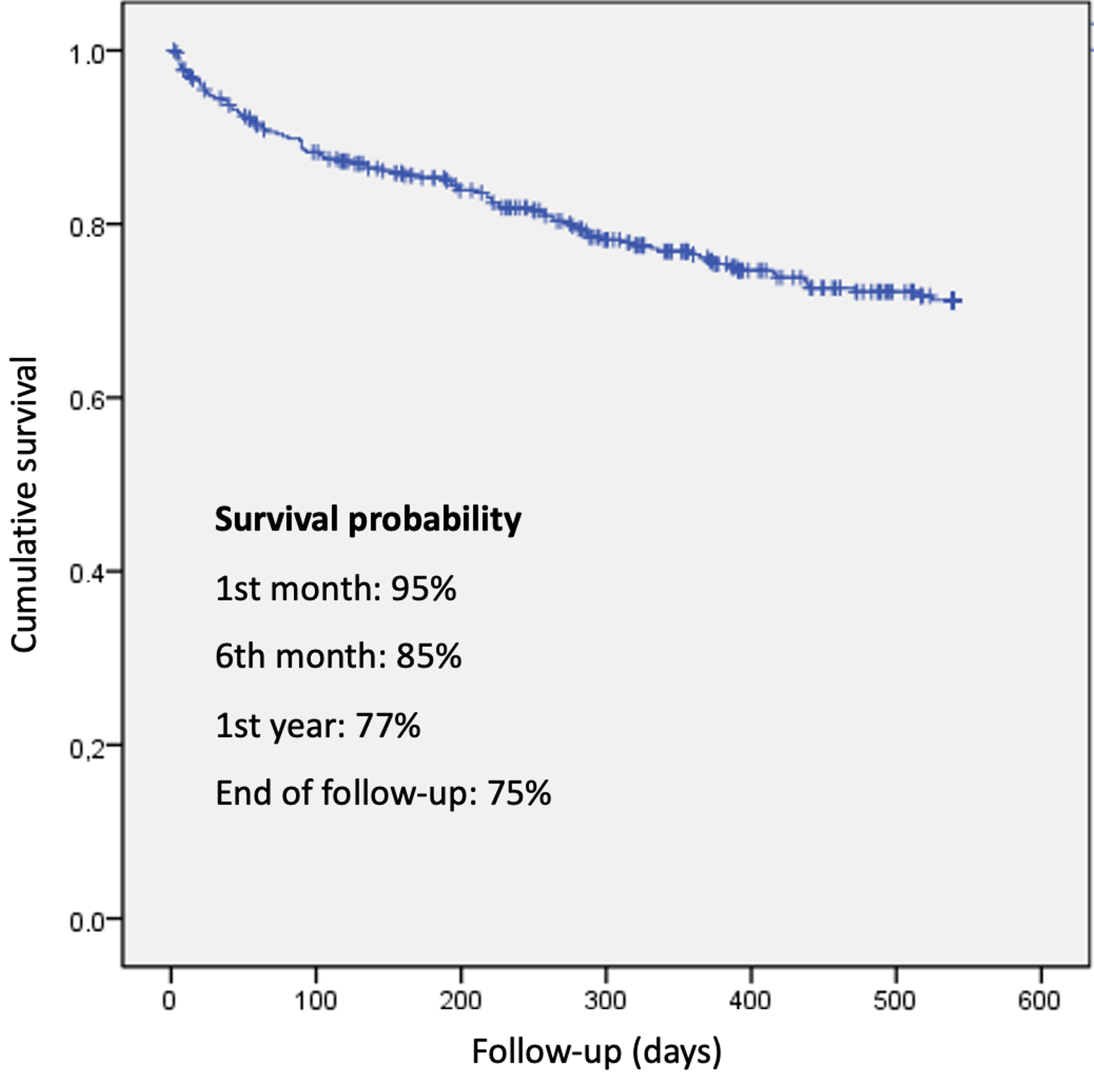 Fig. 2.
Overall survival and survival by FIB-4 and CA125 groups.
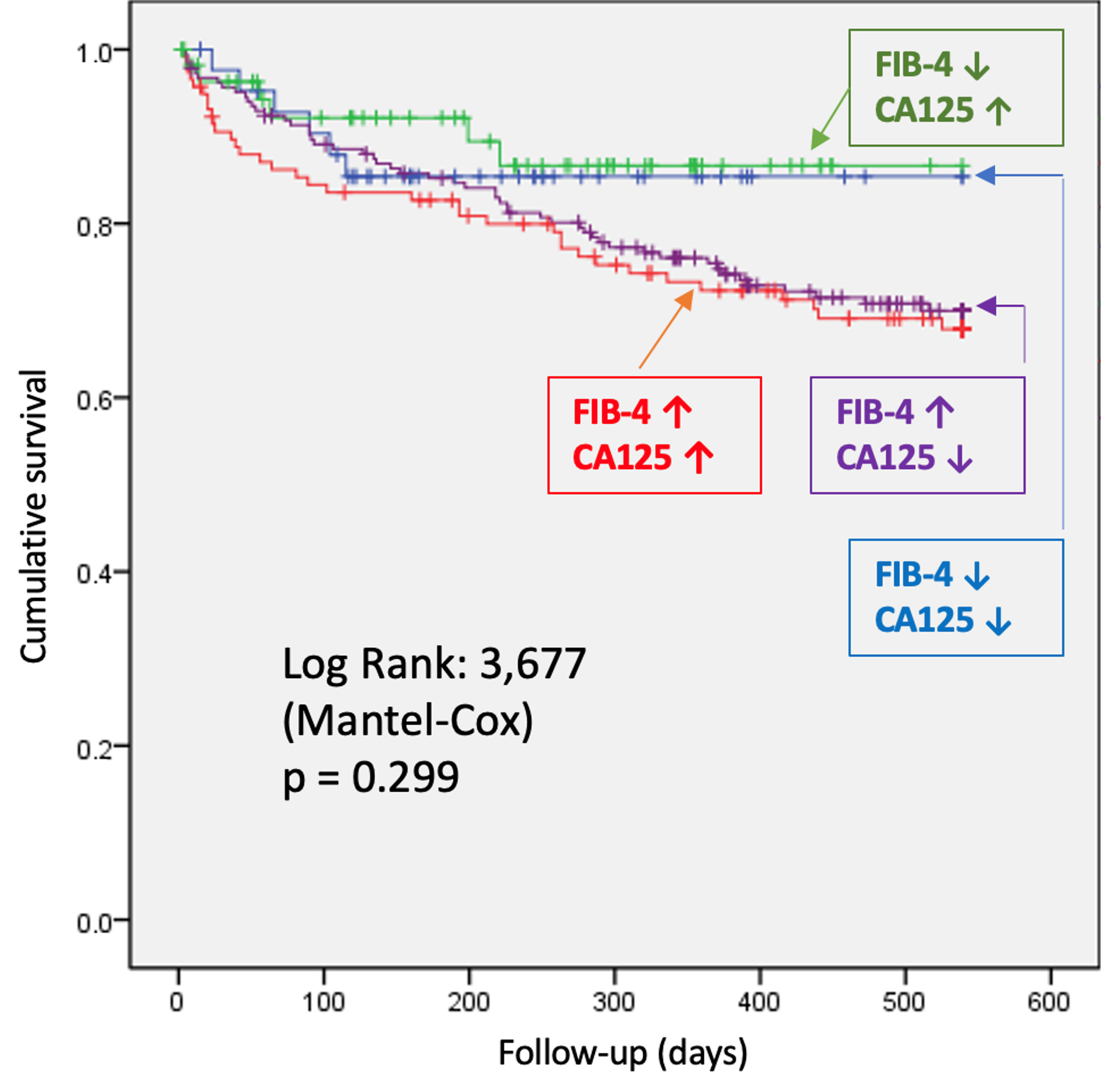 Fig. 3.
Comparison of survival probability by study group. Patients
were categorized into four groups: blue (low FIB-4 [
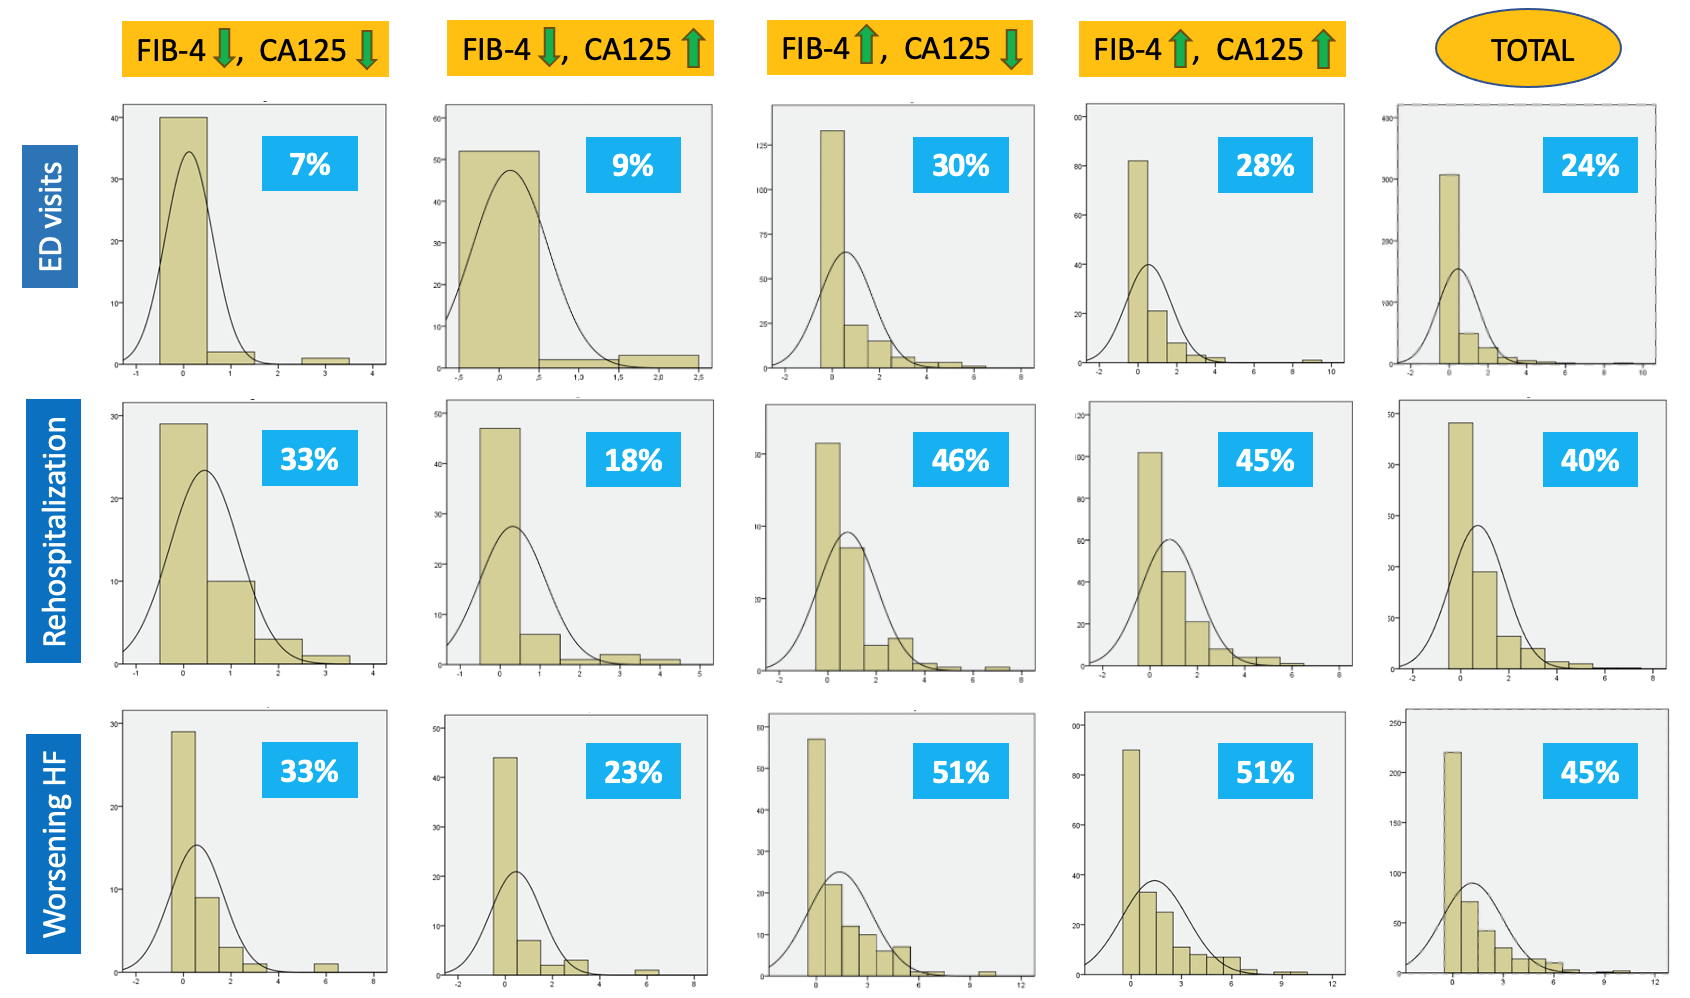 Fig. 4.
Percentage of patients with the event by group. Worsening HF is defined as the sum of emergency department visits requiring intravenous furosemide plus rehospitalization due to decompensated heart failure. Abbreviations: HF, Heart Failure; ED, Emergency Department; CA125, Carbohydrate Antigen 125.
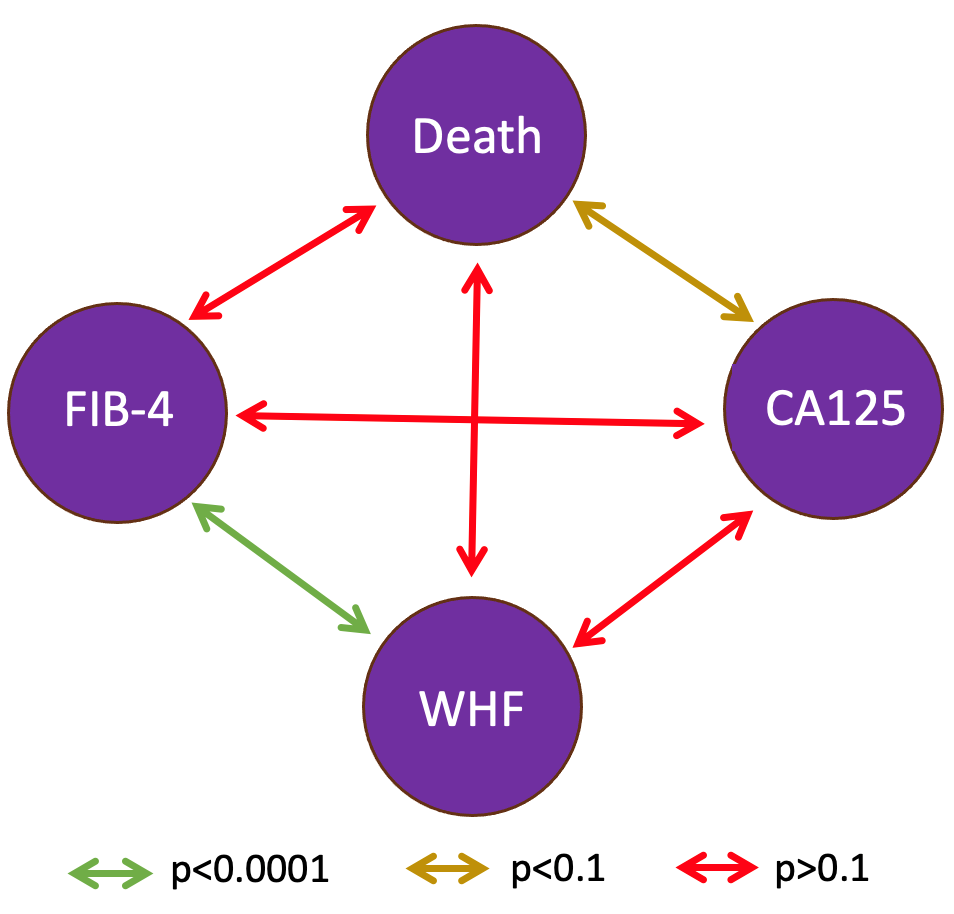 Fig. 5.
Correlation between biomarkers and morbidity-mortality variables. Abbreviations: CA125, Carbohydrate Antigen 125; WHF, Worsening Heart Failure.
HF is a highly prevalent condition that shortens life expectancy and significantly impairs quality of life [1]. Throughout its natural course, patients frequently experience clinical worsening, including hospital emergency visits due to congestion and readmissions for decompensation [14]. Some biomarkers, such as CA125 and FIB-4, have been associated with worse clinical trajectories, although their role in the context of HF is still being clarified [9].
The combined use of FIB-4 and CA125 may provide complementary prognostic
information in AHF. CA125 is a recognized marker of congestion in AHF; however,
in some cases, it may remain at low levels even during decompensation [15].
FIB-4, serves as an indirect marker of hepatic congestion, chronic liver
fibrosis, and systemic inflammation [4]. Even mild FIB-4 elevations (
This shared pathophysiological link to congestion forms the basis for interpreting our findings. Prior studies have individually associated elevated CA125 or FIB-4 with adverse outcomes in HF, yet no previous work has explored their combined prognostic value in AHF. We recognize that these interpretations remain mechanistic hypotheses, as direct measurements of congestion were not performed, and further research is warranted to confirm these associations.
In this study, we observed that patients with both elevated FIB-4 and CA125 had poorer short- to medium-term outcomes, particularly in terms of clinical worsening (both HF readmissions and emergency visits for decompensation). However, no significant differences were found in survival within the two-year follow-up period.
The optimal thresholds for CA125 and FIB-4 in AHF are not well established. Most
studies have adopted values from other clinical settings, such as CA125
In our cohort, patients with both biomarkers elevated more frequently presented
systemic or mixed congestion. Prior studies report that CA125 has high
sensitivity for systemic venous congestion, sometimes superior to NT-proBNP,
whereas evidence for FIB-4 is more limited [23]. Our findings suggest an additive
effect: in patients with CA125
Consistent with prior AHF studies, our cohort had a high mean age (
Admission NT-proBNP levels, although less specific for systemic congestion than CA125, are well established as prognostic markers [25]. In our study, NT-proBNP was highest in the high FIB-4 + high CA125 group, supporting the hypothesis that these patients had greater congestion and worse outcomes. Conversely, those with both indices normal had the lowest NT-proBNP levels, consistent with a lower-risk profile.
Among echocardiographic findings, 28% of patients had preserved LVEF
(
Regarding the right ventricle (RV), both CA125 and FIB-4 have been associated
with RV dysfunction and systemic congestion [29]. In our cohort, severe RV
dysfunction was more frequent in the high-risk group (11.8% vs 4.7%) but not
statistically significant. However, other indirect indicators of central venous
hypertension, such as reduced IVC collapsibility and higher prevalence of
significant tricuspid regurgitation (TR), were significantly more common in this
group. Some authors suggest that TR and reduced IVC collapsibility may be more
sensitive indicators of central venous hypertension than RV dysfunction as
estimated by tricuspid annular plane systolic excursion (TAPSE) [23, 30, 31]. Thus,
the selected FIB-4 cutoff (
One-year survival was 77%, with no significant differences at two years.
However, curves began diverging at around six months, and there was a trend
toward a positive correlation between CA125 and mortality (p
Therefore, the absence of survival differences in our cohort may be influenced by the relatively short follow-up period, lack of post-discharge FIB-4 reassessment, and the low cutoff point (1.3 instead of 2.67).
In this study, the combination of CA125 and FIB-4 showed statistically
significant differences regarding worsening events, identifying a very high-risk
subgroup and a low-risk subgroup (51% vs 33% at two years; p
From our perspective, both CA125, and especially FIB-4, are still under investigation, and further research is needed to define their real clinical utility, both individually and in combination.
This study has several limitations, mainly related to its retrospective design. Selection bias was minimized by the small baseline differences between groups, recall bias by prospective data entry at discharge by experienced cardiologists, and missing data bias by consecutive patient inclusion with predefined exclusion criteria. All relevant variables were included to reduce confounding. Another limitation is the imbalance in subgroup sizes, which may have reduced statistical power, particularly in survival analyses; however, this reflects the real-world distribution of biomarker profiles in AHF, and non-significant results in small subgroups were interpreted with caution. In addition, recurrent-event models were not applied; survival was analyzed as time to first event and other outcomes were reported descriptively, which may not fully address intra-patient clustering but was considered appropriate for this exploratory design. Furthermore, we did not perform multivariable Cox regression as neither FIB-4 nor CA-125 showed a significant association with the primary endpoint in univariate analysis. Including non-significant variables could lead to an overfitted and non-informative model. Finally, although few studies have evaluated the prognostic role of FIB-4 and none its relationship with CA125, we believe our findings are of scientific interest and provide a basis for future prospective research in larger cohorts with longer follow-up.
FIB-4 is a simple and useful indicator that may have prognostic implications in patients with decompensated AHF, helping to predict post-discharge outcomes. Values above 1.3, when combined with serum CA125 levels greater than 50 U/mL, identify a subgroup of patients who, although they do not show increased short- to mid-term (2-year) mortality, do present a significantly higher probability of clinical worsening, including HF readmissions and emergency department visits due to decompensation. Longer prospective studies with larger patient cohorts are needed to confirm the results of this analysis.
The datasets generated for this study contain sensitive clinical information and cannot be made publicly available due to patient confidentiality and institutional restrictions. Data may be made available from the corresponding author upon reasonable request, subject to ethics committee approval.
Conceptualization: FA, RLV, LAB, LM; Methodology: FA, RLV, LAB; Data curation: VD, JMS, VS, SH, SB, AEA, MC, BG; Formal analysis & statistics: FA, LAB, VS; Investigation: All authors; Visualization: FA, LAB, VD; Writing – original draft: FA; Writing – review & editing: All authors, with lead contributions from RLV and LAB; Supervision: RLV, LM, LAB; Project administration: RLV; Guarantor of the work: RLV. All authors have read and approved the final manuscript. All authors have participated sufficiently in the work and agreed to be accountable for all aspects of the work.
The study was conducted in accordance with the Declaration of Helsinki. The research protocol was approved by the Biomedical Research Ethics Committee of Hospital Universitari i Politècnic La Fe (reference code COMBICAR). Because the study is retrospective, the committee did not require informed-consent signatures.
We thank the clinical and administrative teams who assisted with data retrieval and patient follow-up, and we are grateful to the patients whose participation made this study possible.
This research received no external funding.
The authors declare no conflict of interest.
Supplementary material associated with this article can be found, in the online version, at https://doi.org/10.31083/RCM42797.
References
Publisher’s Note: IMR Press stays neutral with regard to jurisdictional claims in published maps and institutional affiliations.