


 , Chunmei Li 1,2, Qionghui Peng 1,2, Lixue Yin 1,2,*
1 Department of Cardiovascular Ultrasound & Noninvasive Cardiology, Sichuan Provincial People's Hospital, University of Electronic Science and Technology of China, 610031 Chengdu, Sichuan, China
2 Ultrasound Medicine and Computational Cardiology Key Laboratory of Sichuan Province, Sichuan Provincial People's Hospital, University of Electronic Science and Technology of China, 610031 Chengdu, Sichuan, China
Abstract
Hypertrophic cardiomyopathy (HCM) is an autosomal dominant genetic disorder and a primary cause of sudden cardiac death (SCD) in young individuals. Studies have demonstrated that “left atrial strain” serves as a predictive marker for adverse cardiovascular events in diseases such as heart failure with preserved ejection fraction, moderate aortic stenosis, and diastolic dysfunction. Therefore, this study used exercise stress echocardiography (ESE) to identify high-risk factors in the early stages of HCM.
A total of 142 HCM patients, diagnosed at the Sichuan Provincial People's Hospital in Chengdu, China, between 2017 and 2018, were included, along with 80 age- and gender-matched normal controls. ESE was employed to examine all subjects, and a 5-year follow-up of the HCM patients was conducted. HCM patients were classified into positive event and non-event groups based on follow-up results. Comparisons were made between the groups, focusing on left atrial reservoir strain, conduit strain, contractile strain, left ventricular global longitudinal strain at rest and peak exercise, and strain reserve.
(1) Significant impairments in global longitudinal strain (GLS), left atrial reservoir strain (LASr), and reserve function were observed in the positive events group: the resting (R) 4D and 2D GLS (R_4D_GLS: –13.20 ± 3.35; R_2D_GLS: –17.13 ± 3.71), and peak (P) 2D GLS (P_2D_GLS: –14.45 ± 3.51) were reduced (p < 0.05), accompanied by deteriorated GLS reserves (Δ2D_GLS: –2.68 ± 2.78; Δ2D_GLS %: –13.57% ± 18.89%; p < 0.05). The resting 2D and 4D left atrial (LA) reservoir strain at end-diastole (R_LASr_ED: 14.36 ± 5.52; R_4D_LASr: 10.30 ± 3.24) and peak 2D LASr (P_LASr_ED: 12.18 ± 5.71) were significantly impaired (p < 0.05), with a notable loss in reserve capacity (ΔLASr_ED: –2.18 ± 4.03; ΔLASr_ED %: –14.19% ± 27.85%; p < 0.05). (2) Correlations: positive events demonstrated strong correlations with R_4D_LASr (r = –0.67), R_LASr_ED (r = –0.58), P_LASr_ED (r = –0.61), and P_2D_GLS (r = 0.58). The positive events showed a weak linear association with the rest left ventricular outflow tract pressure gradient (R_LVOT-PG)(r = 0.35) and an “inverted U-shaped” relationship with the peak left ventricular outflow tract pressure gradient (P_LVOT-PG). (3) Logistic regression and collinearity analysis showed that the R_4D_LASr (odds ratio (OR) = 0.655, 95% confidence interval (CI) 0.547–0.783) and P_2D_GLS (OR = 1.383, 95% CI 1.142–1.675) were independent predictors for positive events.
ESE provides critical information to predict risk factors in HCM patients: R_4D_LASr and P_2D_GLS have independent predictive values for positive cardiovascular events, which can assist in clinical assessment and the identification of high-risk HCM patients, promote individualized and precise risk stratification of HCM in clinical practice, and improve long-term prognosis.
Keywords
- exercise stress echocardiography
- hypertrophic cardiomyopathy
- risk stratification
The latest Guidelines for the Diagnosis and Treatment of Hypertrophic Cardiomyopathy in Chinese Adults 2023 [1] indicate that hypertrophic cardiomyopathy (HCM) is a disease primarily characterized by myocardial hypertrophy caused by pathogenic mutations in genes encoding sarcomeric and/or related proteins. It remains one of the leading causes of sudden cardiac death (SCD) in young individuals. The incidence of HCM in the general population has gradually increased from 1 in 500 to 1 in 200 in recent years, showing a persistent upward trend [2, 3]. The 2014 European Society of Cardiology (ESC) Guidelines [4] and the 2020 American Heart Association/American College of Cardiology (AHA/ACC) Guidelines [5] explicitly state that stress echocardiography can evaluate and provide abundant prognostic information (COR IIa), which can serve as a reference for the clinical treatment and follow-up in HCM patients. The SCD risk assessment model for HCM, recommended by the 2020 AHA/ACC [5], includes seven factors: “maximum wall thickness, ventricular tachycardia, syncope, family history of SCD, ventricular aneurysm, left ventricular ejection fraction (LVEF), and late gadolinium enhancement on cardiac magnetic resonance imaging”, all of which involve at least three different types of examinations. However, some HCM patients are unable to complete these examinations due to economic conditions or contraindications. Currently, “left atrial strain” has been verified in several studies [6, 7, 8, 9, 10] to have predictive value for adverse cardiovascular events in diseases such as heart failure with preserved ejection fraction, chronic kidney disease, moderate aortic valve stenosis, and diastolic dysfunction. Therefore, in this study, we hypothesized that “left atrial reservoir strain” has clinical significance in predicting adverse cardiovascular events in HCM patients. The aim of this study was to identify and assess methods and parameters in high-risk HCM patients using exercise stress echocardiography (ESE) that could be easily and reliably used in everyday clinical practice.
HCM patients, clinically diagnosed at the Sichuan Provincial People’s Hospital
in Chengdu, China, between 2017 and 2018, were included. The diagnostic criteria
for HCM were based on the Guidelines for the Diagnosis and Management of HCM
released by the 2014 ESC [4], which define HCM as the presence of wall thickness
of one or more left ventricular myocardial segments
The final sample size included 142 patients in the HCM group and 80 normal controls in the control group, as shown in Fig. 1. This study was approved by the Ethics Committee of the Sichuan Provincial People’s Hospital, and informed consent was obtained from all subjects.
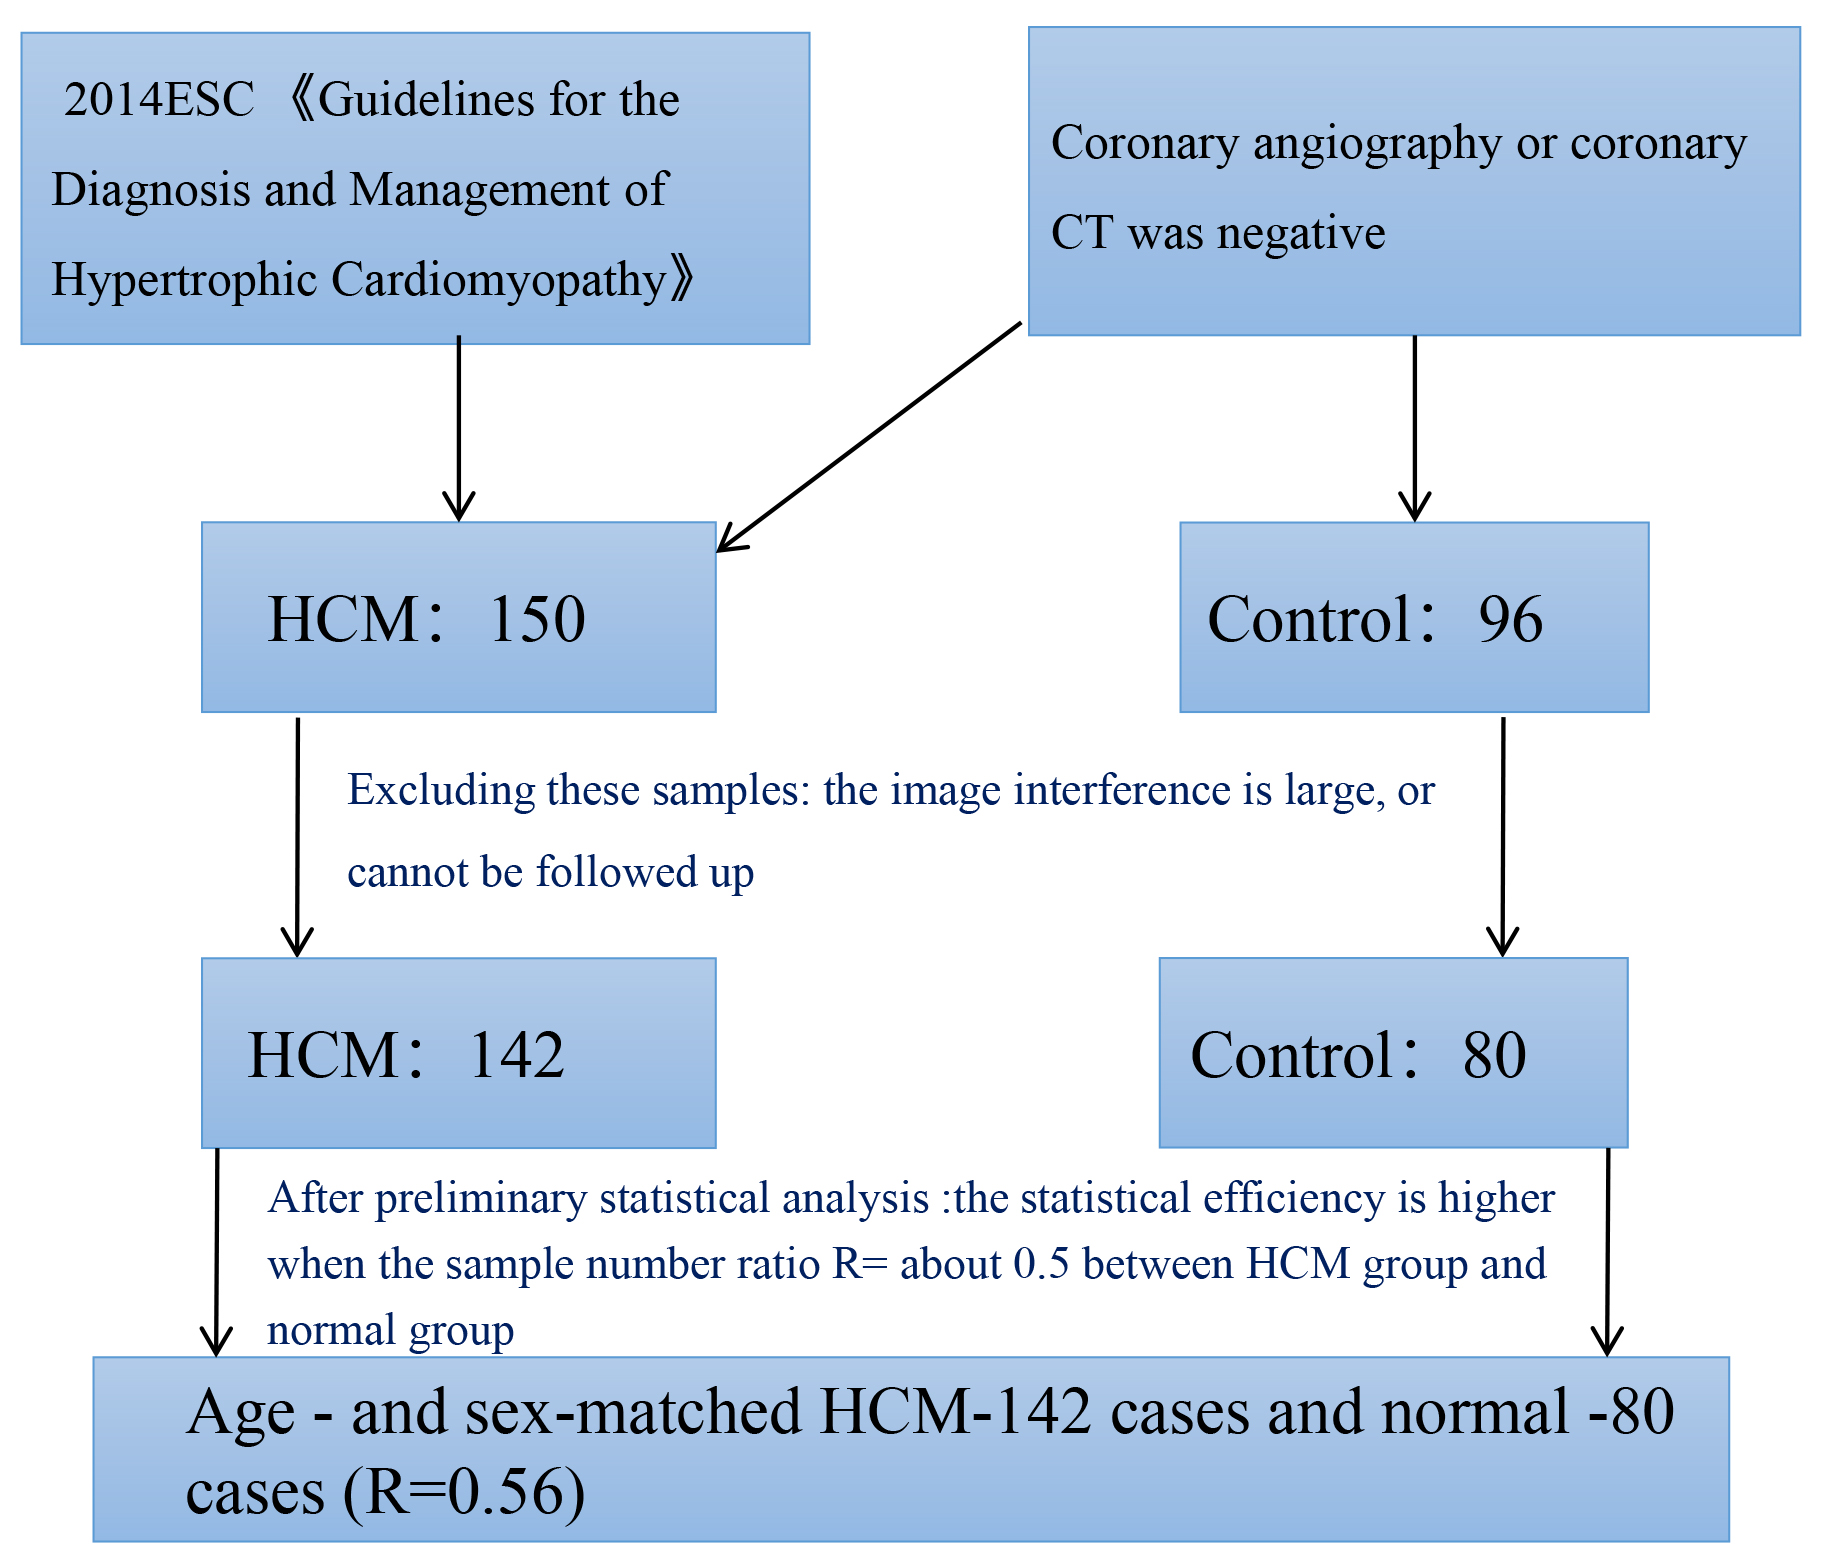 Fig. 1.
Sample size of HCM and normal control group. ESC, European Society of Cardiology; HCM, hypertrophic cardiomyopathy; CT, computed tomography.
The HCM patients included in the study were those who were first diagnosed in
our hospital and had not taken any drugs related to cardiovascular diseases
before the test. Both the HCM group and the control group underwent ESE in
sequential steps: resting echocardiography
Symptom-restricted electrocardiography of treadmill exercise was performed by
SunTechTango synchronized ambulatory hemometry (SunTech Medical Instruments, NC,
USA) and a MortaraXScribe treadmill exercise analysis system (Mortara Instrument,
Milwaukee, WI, USA) using the BRUCE protocol [11]. Electrocardiograms (ECGs) and
blood pressure were monitored during exercise. All subjects were asked to stop
For rest and peak stress Echocardiography, we used GE-Vivid E95 color Doppler ultrasonic diagnostic instrument (E95, GE Medical Systems, Milwaukee, WI, USA), and 4V-D full volume probe (frequency 1.5–4.0 MHz, GE Medical Systems, Milwaukee, WI, USA), Philips-EPIQ7C ultrasonic diagnostic instrument (EPIQ7C, Philips Healthcare, Netherlands), X5-1 fully functional pure wave single crystal matrix probe (frequency 1.0–5.0 MHz, Philips Healthcare, Netherlands), QLAB quantitative analysis software (13.0, Philips Healthcare, Netherlands) and ECHO-PAC analysis software (203, GE Medical Systems, Milwaukee, WI, USA). Apical four-chamber, three-chamber, and two-chamber dynamic images from at least five cycles at rest and peak stage were collected.
Subjects were monitored monthly via telephone for a continuous period of 5 years. The clinical endpoint was defined as the first occurrence of any adverse event, including heart failure, ventricular tachycardia, atrial fibrillation, defibrillator implantation, or unexplained syncope. Based on the outcomes, HCM patients were classified into the positive events group and the non-events group.
All images were measured and analyzed following the guidelines of the American Society of Echocardiography (ASE) [12]. Left atrial (LA) analysis was standardized according to the consensus on strain imaging established by the EACVI/ASE/Industry Task Force [13]. LA strain included LA reservoir strain, LA conduit strain, and LA contraction strain. When using the R-R gating analysis, the reservoir strain value (LASr) is positive, while the conduit strain (LAScd) and contraction strain (LASct) values are negative. The following parameters were included:
① In 2D mode, the mechanical parameters of the left ventricle (LV) at rest and peak were analyzed using two-dimensional speckle-tracking imaging (2D-STI) from the resting and peak A4C, A2C, and A3C views of the LV. Comprehensive calculations were performed to obtain the resting and peak global longitudinal strain (GLS) values (R_2D_GLS and P_2D_GLS) as shown in Fig. 2. The LVEF was measured using the 2D Simpson method at rest and peak.
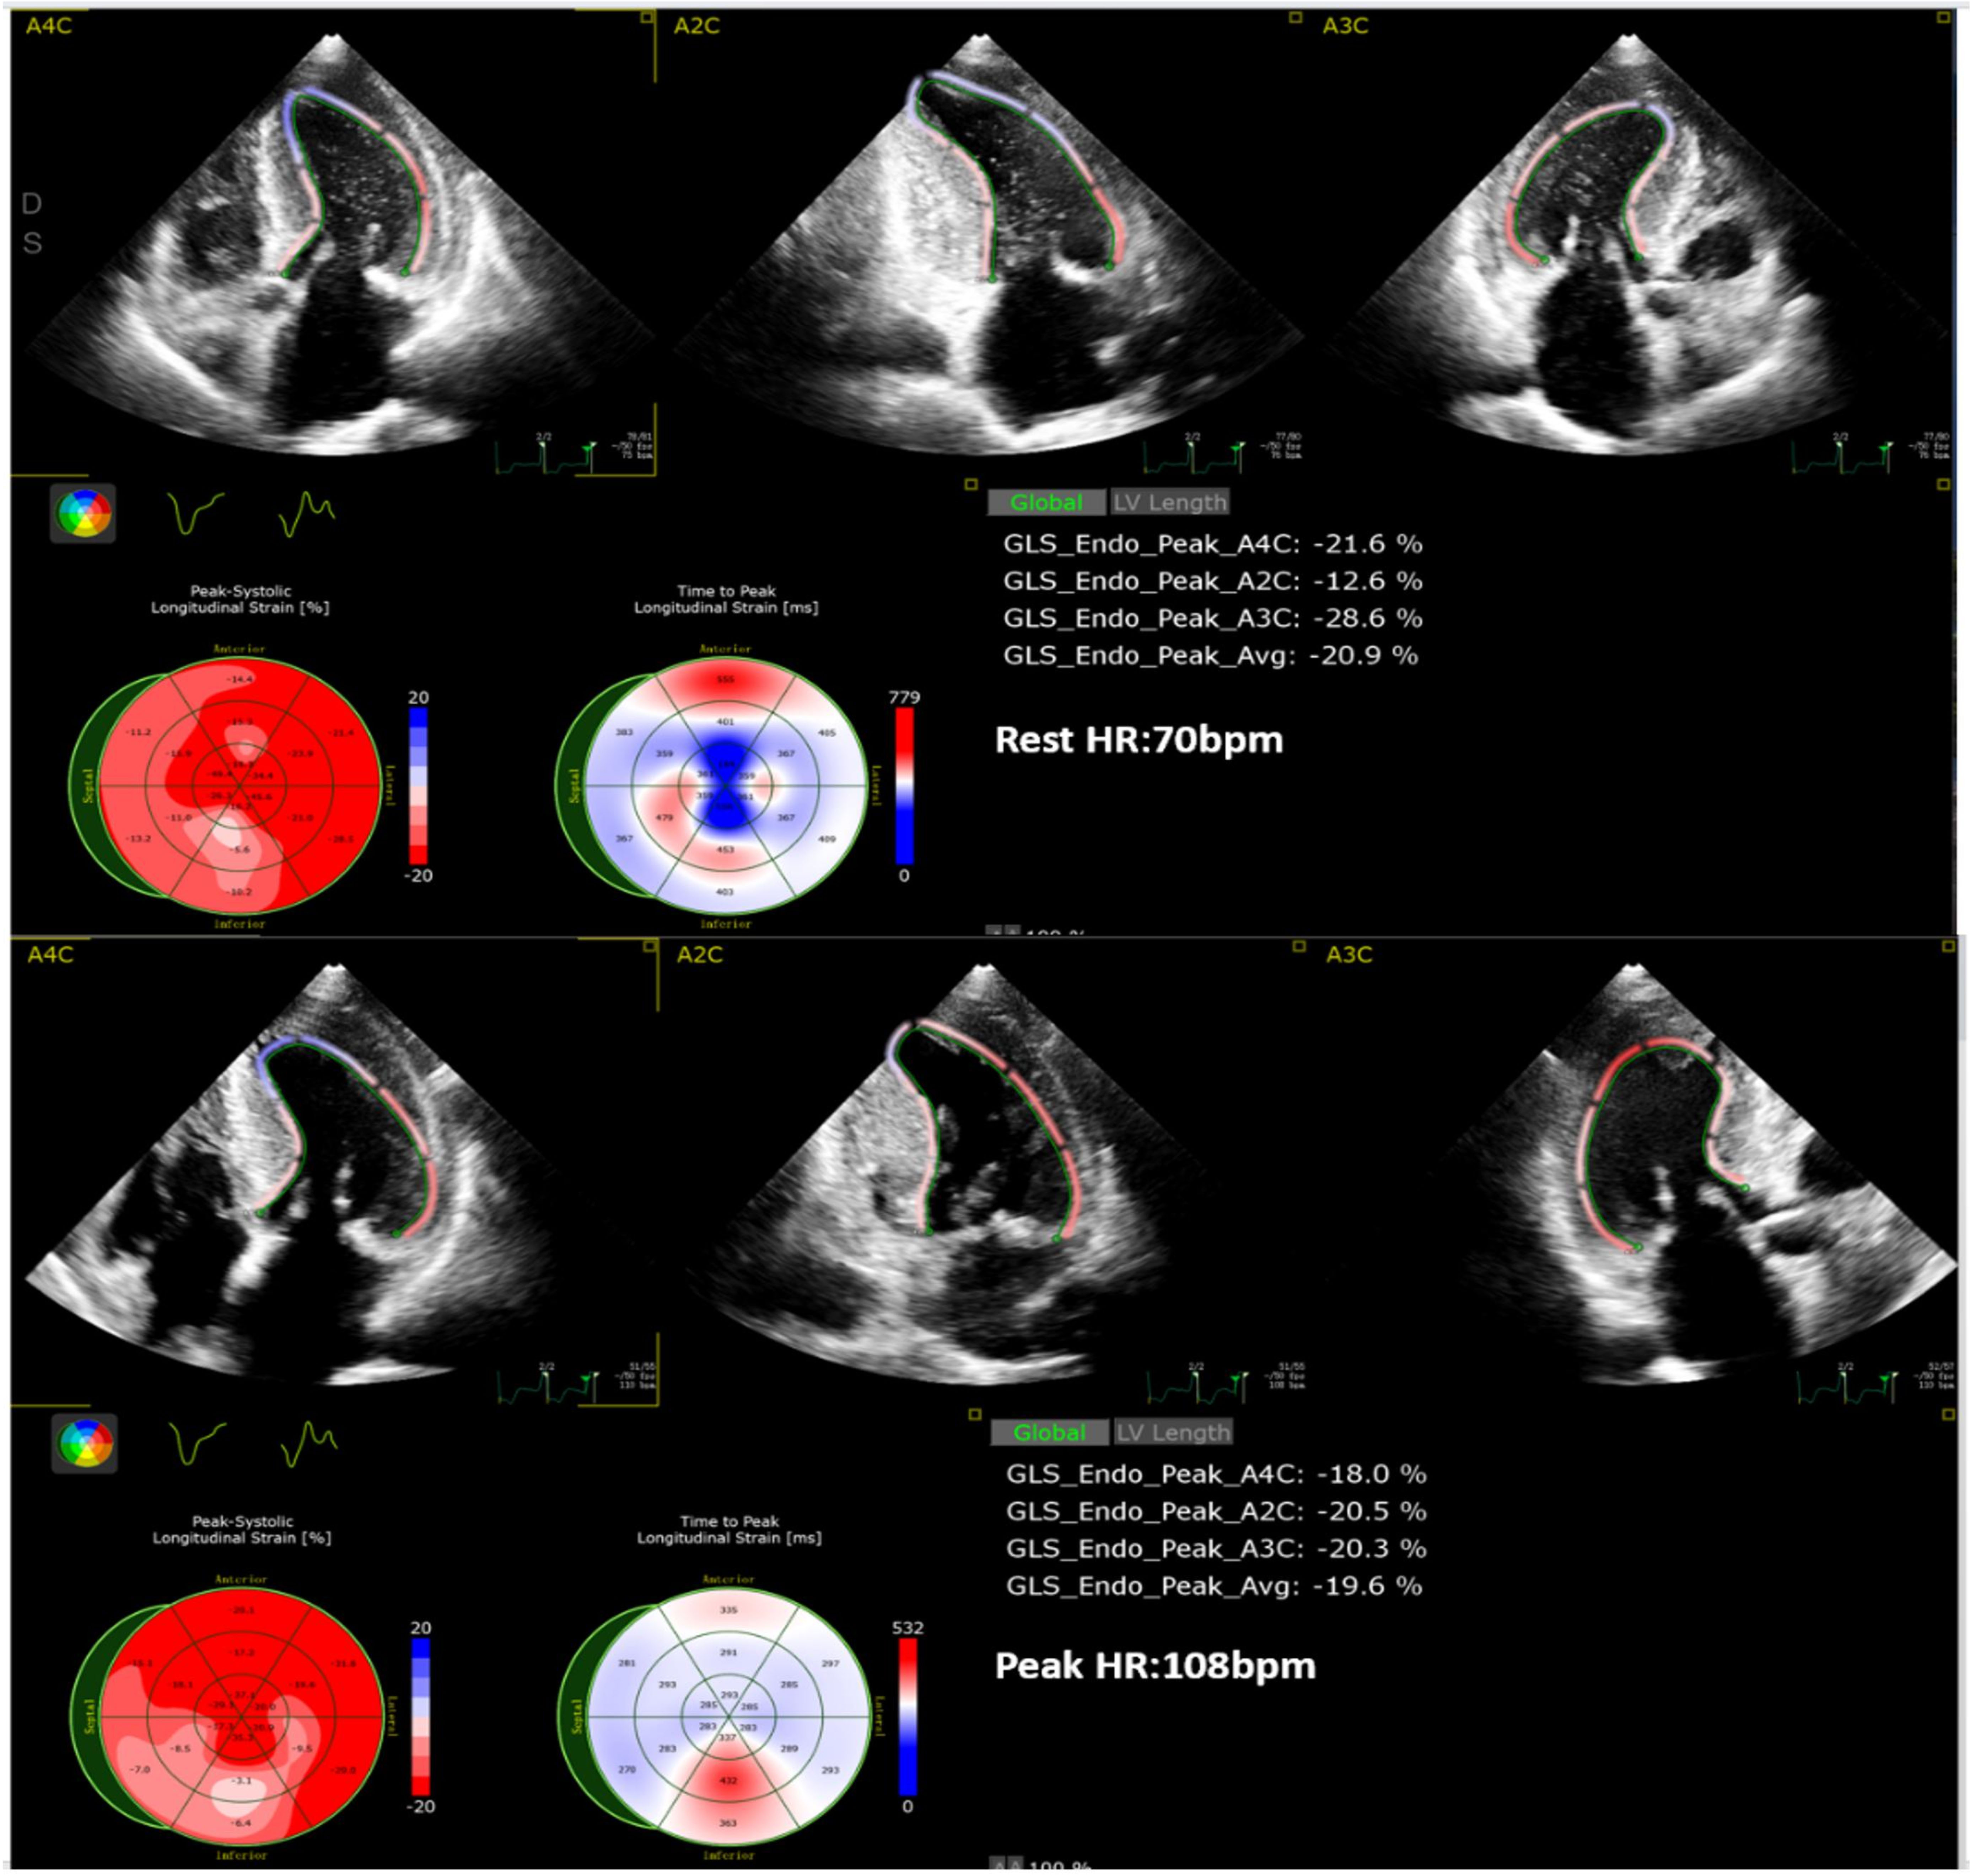 Fig. 2.
Analysis of R_2D_GLS and P_2D_GLS (2D-STI). GLS, global longitudinal strain; HR, heart rate; 2D-STI, two-dimensional speckle-tracking imaging.
② In 2D mode, the mechanical parameters of the LA at rest and peak were analyzed using 2D-STI from the resting and peak A4C views of the LA. Comprehensive calculations were performed to obtain the resting and peak 2D left atrial reservoir strain (R_LASr_ED and P_LASr_ED), conduit strain (R_LAScd_ED and P_LAScd_ED), and contraction strain (R_LASct_ED and P_LASct_ED), as shown in Fig. 3.
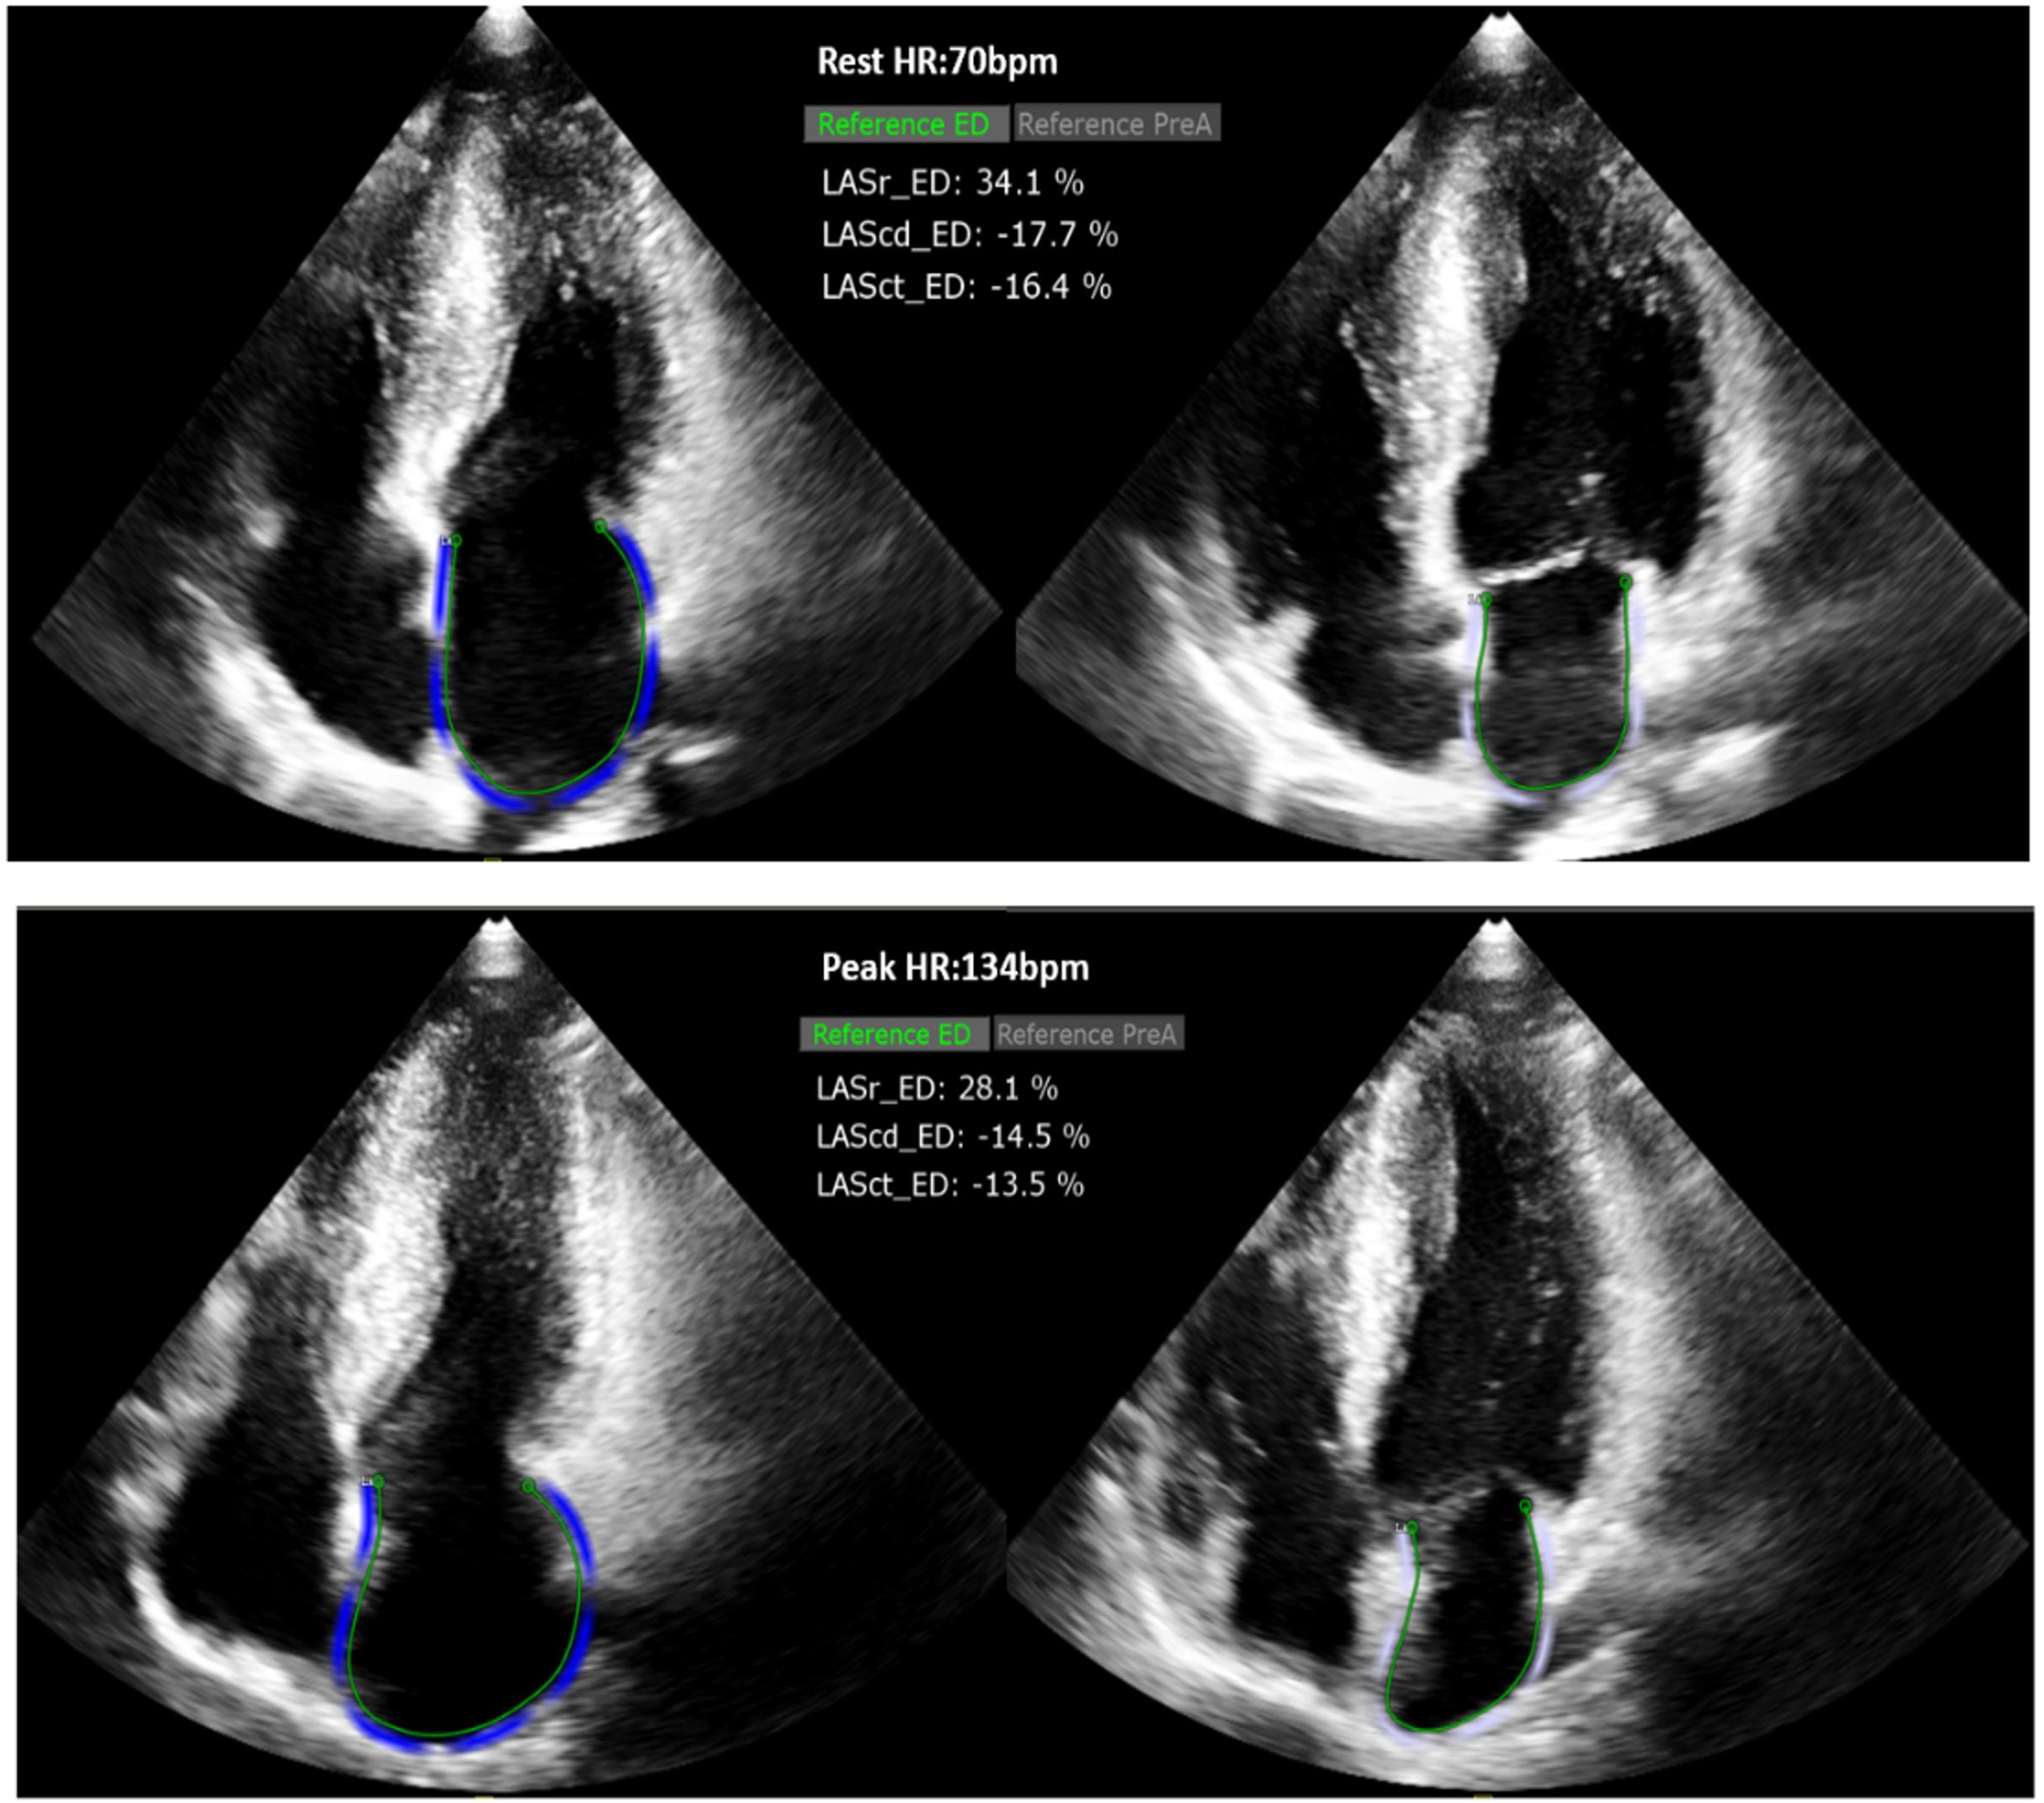 Fig. 3.
Analysis of R_LASr_ED and P_LASr_ED (2D-STI). HR, heart rate; LASr, left atrial reservoir strain; LAScd, left atrial conduit strain; LASct, left atrial contraction strain; ED, end-diastole.
③ In 2D mode, the structural, hemodynamic, and Doppler parameters of the LV at rest and peak were assessed, including maximum wall thickness at rest (R_MWT), measured at the LV short-axis at the mitral valve, papillary muscle, and apical levels in 2D. The early diastolic mitral inflow velocity at rest and peak (R_E and P_E), the average velocity of the septal and lateral mitral annulus during early diastole at rest and peak (R_e’ and P_e’), and the E/e’ ratio were measured in the apical A4C view. The resting left ventricular outflow tract pressure gradient (LVOT-PG) and peak LVOT-PG (R_LVOT-PG and P_LVOT-PG) and LA diameter (R_LAd) were also measured.
④ In 2D mode, the mechanical reserve parameters of LV: Absolute reserve
of GLS:
⑤ In 2D mode, the mechanical reserve parameters of LA: Absolute reserve
of reservoir strain:
⑥ In the 3D mode, the mechanical parameters of the resting LA: 3D-STI was used to analyze the resting full-volume dynamic images of the left atrium. Through comprehensive calculation, the resting 4D left atrial reservoir strain (R_4D_LASr), resting 4D left atrial conduit strain (R_4D_LAScd), resting 4D left atrial contraction strain (R_4D_LASct), and the maximum volume index of the left atrium at rest (R_LA Vlmax) were obtained, as shown in Fig. 4.
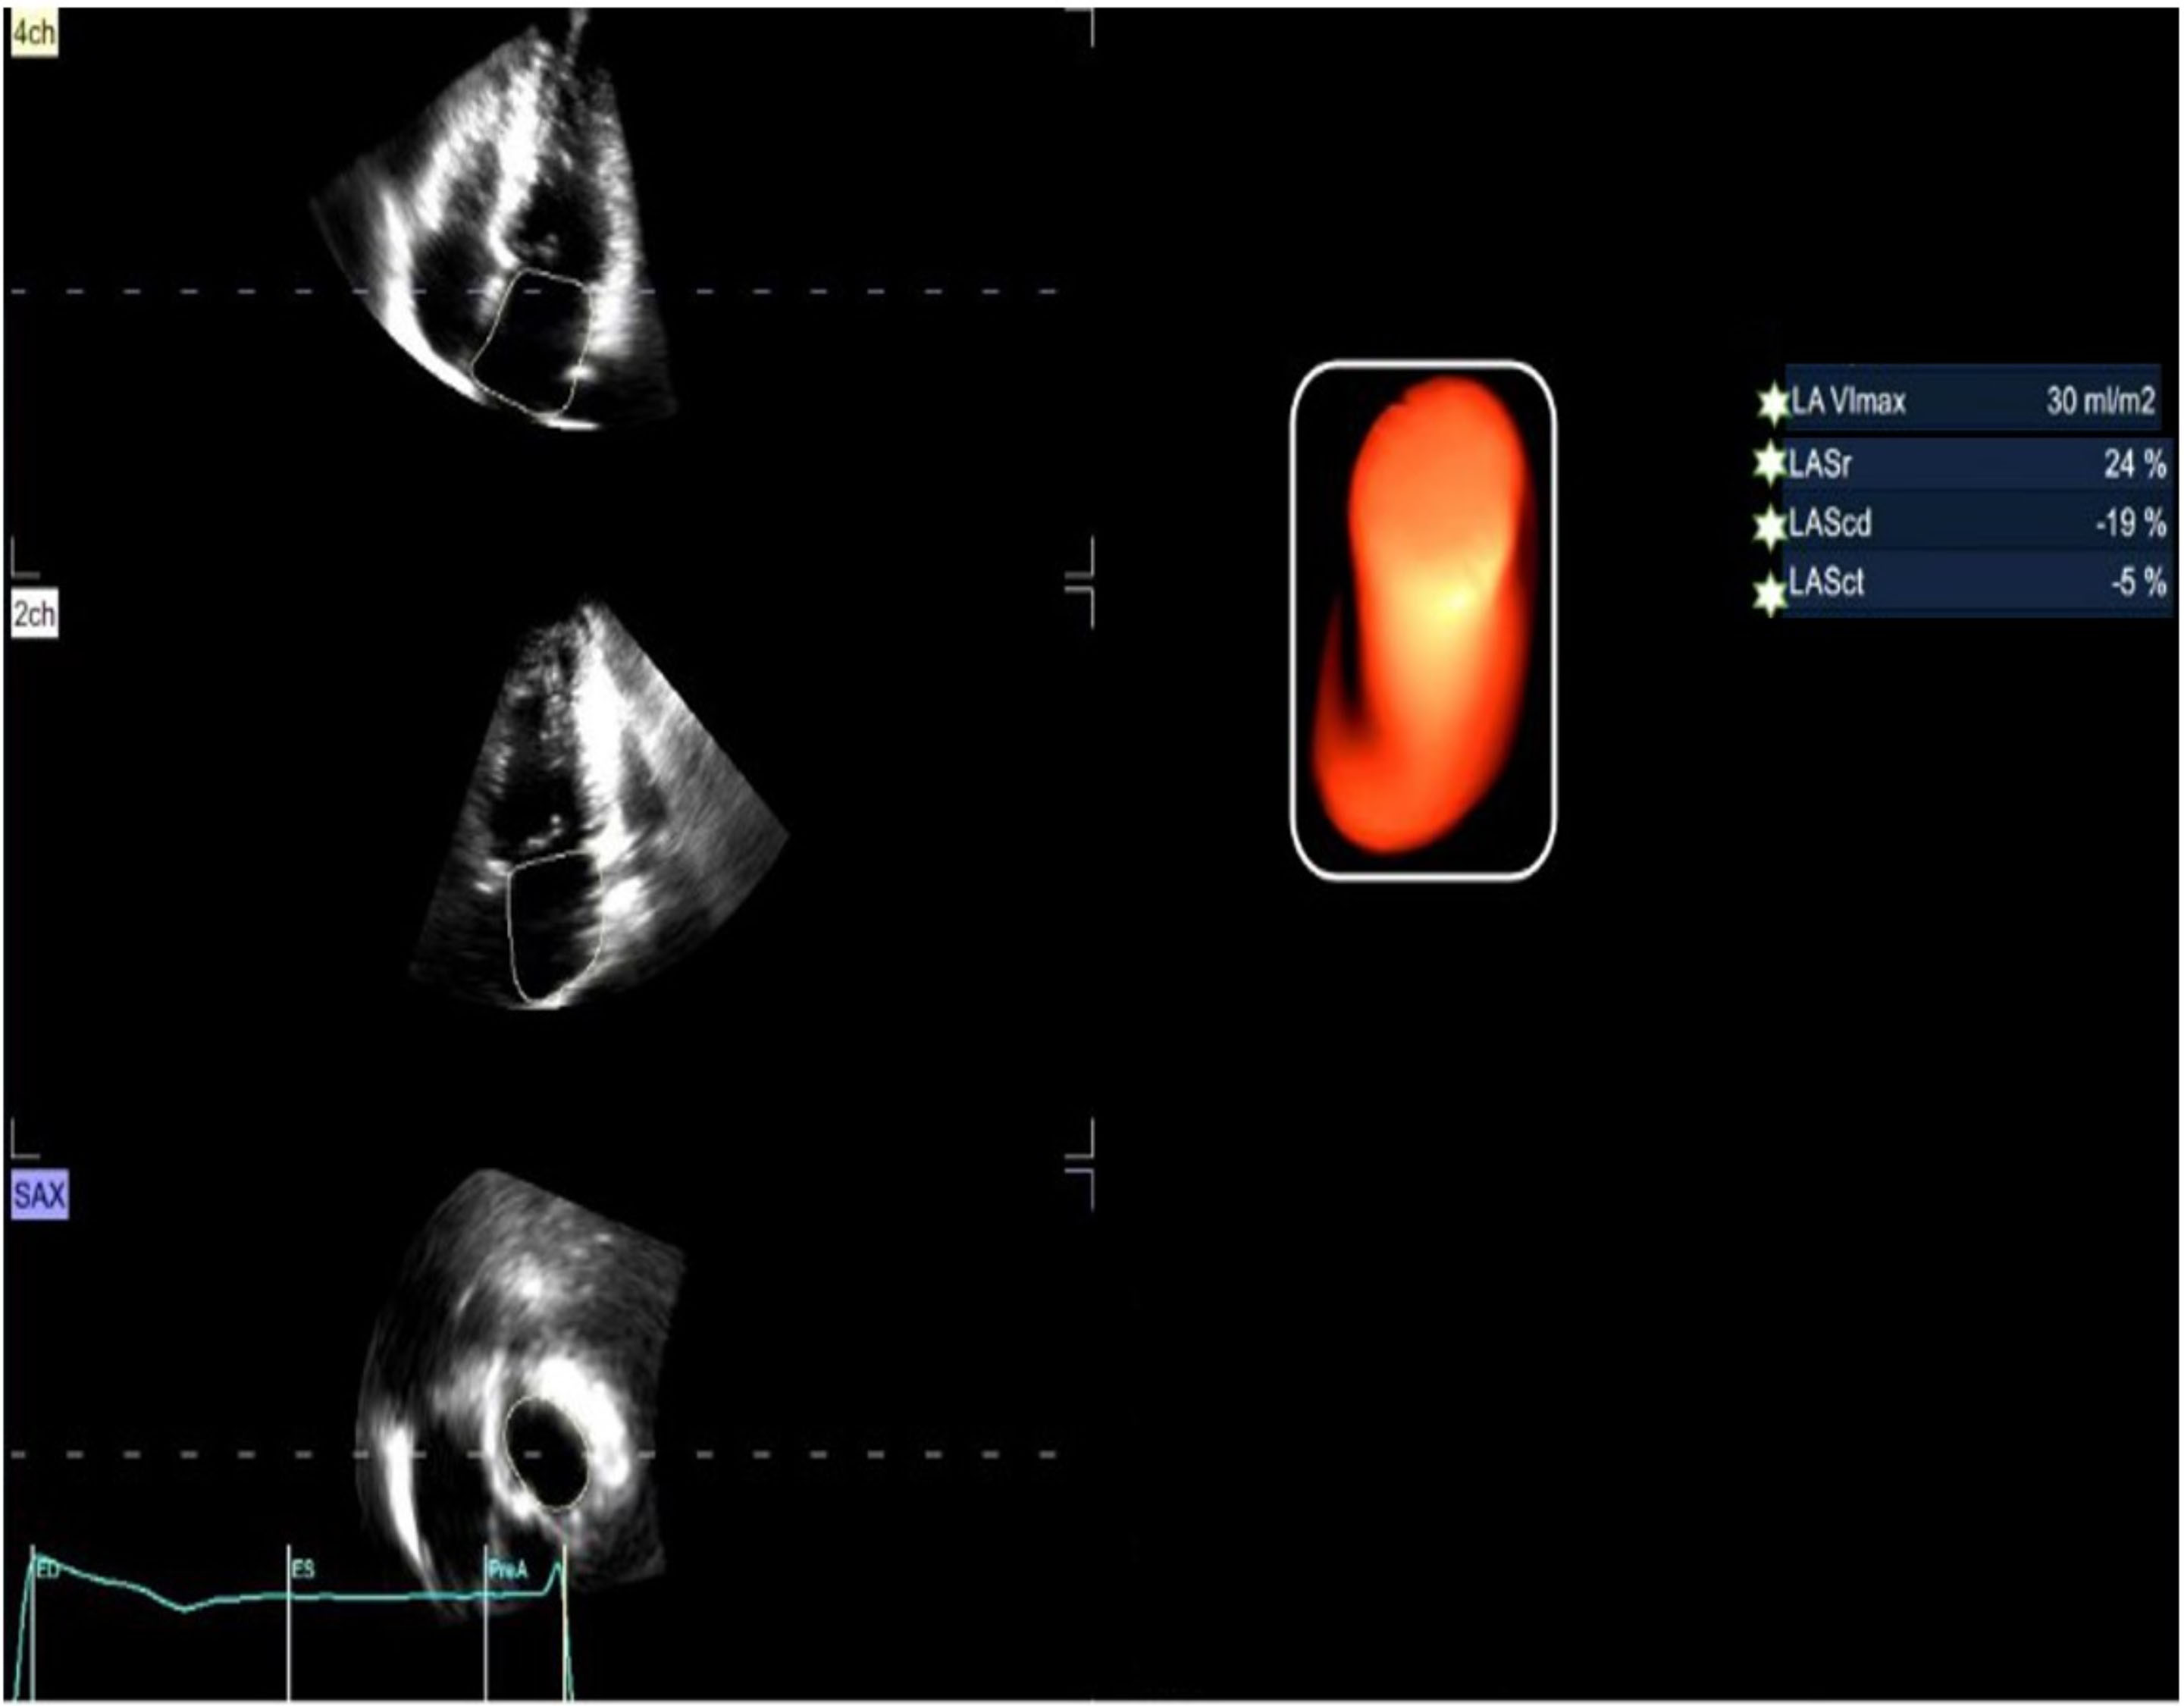 Fig. 4.
Analysis of LA_Vlmax, R_4D_LASr, R_4D_LAScd, R_4D_LASct (3D-STI). LA_Vlmax, left atrium maximum volume index; LASr, left atrial reservoir strain; LAScd, left atrial conduit strain; LASct, left atrial contraction strain; 3D-STI, three-dimensional speckle-tracking imaging.
⑦ In the 3D mode, the structural parameters of the resting LV: By analyzing the rest full-volume dynamic images of the apical four-chamber (A4C) view, the 4D rest global longitudinal strain (R_4D_GLS) can be obtained, and the left ventricular mass index (LVMI) was obtained.
⑧ Exercise parameters: heart rate (HR), metabolic equivalent (METS).
Prior to the detection, patients with poor acoustic conditions or those unable to produce satisfactory images were excluded. Individualized breathing and short breath-holding training were provided to subjects based on the characteristics of their images, ensuring that dynamic images collected at rest and peak exercise were not obstructed by lung gas. This approach aimed to minimize or eliminate image interference and enhance image quality. A senior chief physician conducted a second review of all dynamic images, and Intra-class correlation (ICC) analysis was performed on the detection data to assess inter-observer consistency and ensure the reliability and repeatability of the results.
Measurement data are presented as the mean
The clinical endpoint events were adjudicated as follows. Any of the following events which occurred for the first time in HCM patients during the 5-year follow-up period were regarded as clinical endpoints: heart failure, ventricular tachycardia, atrial fibrillation, defibrillator implantation, or unexplained syncope. There were no records of patients experiencing two or more events simultaneously, there were no deaths, no transplants, and no septal resections during the monthly telephone follow-up of all HCM patients in this study. As shown in Table 1, 40 positive cardiovascular events occurred in 40 HCM patients. The HCM patients were classified into the positive events group (40 cases) and the non-events group (102 cases).
| HCM group | Syncope | Heart failure | ICD or pacemaker implantation | Ventricular tachycardia | Atrial fibrillation |
| Positive events (N = 40) | 6 cases | 15 cases | 6 cases | 4 cases | 9 cases |
| Non-events (N = 102) | 0 case | 0 case | 0 case | 0 case | 0 case |
HCM, hypertrophic cardiomyopathy; ICD, implantable cardioverter-defibrillator.
The HCM patients included in the study were those who were first diagnosed in
our hospital and had not taken any drugs related to cardiovascular diseases
before the test. In the HCM group, both R_2D_GLS and P_2D_GLS, as well as
| HCM group | Control group | p | |
| Sample | 142 | 80 | |
| Gender = 1 (%) | 98 (69.00) | 56 (70.00) | 0.999 |
| Age (mean (SD)) (year) | 49.09 (14.17) | 47.98 (10.61) | 0.507 |
| Smoke = 1 (%) | 17 (11.97) | 10 (12.50) | 0.290 |
| BSA (mean (SD)) (m2) | 1.73 (0.20) | 1.73 (0.20) | 0.977 |
| BMI (mean (SD)) (kg/m2) | 24.10 (3.54) | 24.03 (3.29) | 0.888 |
| METS (mean (SD)) | 9.03 (2.75) | 10.57 (0.85) | |
| LVMI (mean (SD)) (g/m2) | 145.89 (60.56) | 109.22 (26.13) | |
| R_MWT (mean (SD)) (mm) | 20.48 (4.75) | 9.10 (1.12) | |
| R_LAd (mean (SD)) (mm) | 37.90 (5.30) | 32.69 (2.79) | |
| R_E/e’ (mean (SD)) | 13.58 (7.22) | 8.11 (1.84) | |
| R_LVOT-PG (mean (SD)) (mmHg) | 17.79 (36.07) | 4.84 (1.79) | |
| R_LA_Vlmax (mean (SD)) (mm/m2) | 34.94 (13.07) | 20.84 (6.45) | |
| R_HR (mean (SD)) (bpm) | 77.56 (12.27) | 88.17 (11.22) | |
| R_LVEF (mean (SD)) (%) | 71.92 (6.86) | 66.43 (5.19) | |
| P_HR (mean (SD)) (bpm) | 155.40 (25.31) | 159.18 (13.30) | 0.147 |
| P_LVOT-PG (mean (SD)) (mmHg) | 35.68 (53.40) | 9.42 (2.25) | |
| P_E/e’ (mean (SD)) | 14.98 (6.67) | 7.16 (1.17) | |
| P_LVEF (mean (SD)) (%) | 83.59 (6.99) | 74.39 (5.62) | |
| ΔEF (mean (SD)) (%) | 11.62 (6.16) | 7.96 (2.43) | |
| ΔEF % (mean (SD)) | 16.78 (9.61) | 12.07 (3.90) | |
| R_2D_GLS (mean (SD)) (%) | –19.50 (3.29) | –21.01 (2.52) | |
| P_2D_GLS (mean (SD)) (%) | –18.64 (4.68) | –24.57 (3.93) | |
| Δ2D_GLS (mean (SD)) (%) | –0.86 (3.41) | 3.56 (2.32) | |
| Δ2D_GLS % (mean (SD)) | –4.13 (18.23) | 16.77 (10.83) | |
| R_LASr_ED (mean (SD)) (%) | 20.60 (6.95) | 34.72 (11.17) | |
| R_LAScd_ED (mean (SD)) (%) | –12.48 (6.73) | –23.07 (7.43) | |
| R_LASct_ED (mean (SD)) (%) | –8.10 (4.37) | –11.56 (5.38) | |
| P_LASr_ED (mean (SD)) (%) | 19.95 (8.13) | 54.10 (13.98) | |
| P_LAScd_ED (mean (SD)) (%) | –12.24 (7.52) | –31.83 (8.75) | |
| P_LASct_ED (mean (SD)) (%) | –7.39 (5.39) | –22.27 (10.12) | |
| ΔLASr_ED (mean (SD)) (%) | –0.65 (5.47) | 19.38 (7.24) | |
| ΔLASr_ED % (mean (SD)) | –3.03% (2.68%) | 61.33% (30.14%) | |
| ΔLAScd_ED (mean (SD)) (%) | –0.23 (6.83) | 8.76 (6.52) | |
| ΔLAScd_ED % (mean (SD)) | 12.29% (6.82%) | 44.06% (37.08%) | |
| ΔLASct_ED (mean (SD)) (%) | –0.71 (4.76) | 10.71 (8.22) | |
| ΔLASct_ED % (mean (SD)) | 6.33% (10.43%) | 110.86% (98.05%) |
*p
As shown in Table 3, in the positive events group, the R_4D_GLS, R_2D_GLS,
and P_2D_GLS values were significantly worse, and
| Non-events group | Positive events group | p | |
| Sample | 102 | 40 | |
| Gender = 1 (%) | 73 (71.6) | 25 (62.5) | 0.396 |
| Age (mean (SD)) (year) | 46.32 (13.02) | 56.15 (14.68) | |
| Smoke = 1 (%) | 21 (20.58) | 7 (17.50) | 0.977 |
| BSA (mean (SD)) (m2) | 1.76 (0.20) | 1.66 (0.20) | 0.008* |
| BMI (mean (SD)) (kg/m2) | 23.94 (3.52) | 24.49 (3.49) | 0.403 |
| Obstruction occurs = 1 (%) | 21 (20.6) | 18 (45.0) | 0.006* |
| R_MWT (mean (SD)) (mm) | 19.74 (4.50) | 22.38 (4.88) | 0.003* |
| R_LAd (mean (SD)) (mm) | 36.64 (4.92) | 41.13 (4.89) | |
| R_E/e’ (mean (SD)) | 12.50 (5.24) | 16.35 (10.32) | 0.029* |
| R_LVOT-PG (mean (SD)) (mmHg) | 9.97 (20.11) | 37.74 (55.59) | 0.004* |
| R_LA_Vlmax (mean (SD)) (mm/m2) | 31.47 (8.50) | 43.80 (17.86) | |
| R_HR (mean (SD)) (bpm) | 77.04 (11.21) | 78.90 (14.70) | 0.418 |
| R_LVEF (mean (SD)) (%) | 72.44 (6.43) | 70.78 (7.80) | 0.194 |
| P_HR (mean (SD)) (bpm) | 161.44 (22.45) | 140.00 (25.94) | |
| P_E/e’ (mean (SD)) | 13.65 (5.62) | 18.39 (7.90) | 0.001* |
| P_LVOT-PG (mean (SD)) (mmHg) | 28.59 (44.11) | 53.78 (69.33) | 0.038* |
| P_LVEF (mean (SD)) (%) | 84.86 (5.23) | 80.35 (9.56) | 0.007* |
| ΔEF (mean (SD)) (%) | 12.42 (5.66) | 9.58 (6.94) | 0.013* |
| ΔEF % (mean (SD)) | 30.62% (2.86%) | 31.52% (4.12%) | 0.140 |
| R_2D_GLS (mean (SD)) (%) | –20.43 (2.59) | –17.13 (3.71) | |
| R_4D_GLS (mean (SD)) (%) | –16.60 (3.22) | –13.20 (3.35) | |
| R_LASr_ED (mean (SD)) (%) | 23.05 (5.85) | 14.36 (5.52) | |
| R_LAScd_ED (mean (SD)) (%) | –14.29 (6.72) | –7.86 (4.05) | |
| R_LASct_ED (mean (SD)) (%) | –8.53 (4.51) | –7.00 (3.81) | 0.059 |
| R_4D_LASr (mean (SD)) (%) | 18.79 (5.01) | 10.30 (3.24) | |
| R_4D_LAScd (mean (SD)) (%) | –11.41 (5.09) | –5.13 (2.69) | |
| R_4D_LASct (mean (SD)) (%) | –6.95 (4.51) | –5.18 (2.78) | 0.022* |
| P_2D_GLS (mean (SD)) (%) | –20.28 (4.01) | –14.45 (3.51) | |
| Δ2D_GLS (mean (SD)) (%) | –0.14 (3.38) | –2.68 (2.78) | |
| Δ2D_GLS % (mean (SD)) | –0.43% (16.64%) | –13.57% (18.89%) | |
| P_LASr_ED (mean (SD)) (%) | 22.99 (6.81) | 12.18 (5.71) | |
| P_LAScd_ED (mean (SD)) (%) | –14.09 (7.59) | –7.54 (4.85) | |
| P_LASct_ED (mean (SD)) (%) | –8.46 (5.50) | –4.67 (3.99) | |
| ΔLASr_ED (mean (SD)) (%) | –0.06 (5.85) | –2.18 (4.03) | 0.015* |
| ΔLASr_ED % (mean (SD)) | 1.29% (2.52%) | –14.19% (2.79%) | 0.002* |
| ΔLAScd_ED (mean (SD)) (%) | –0.20 (7.45) | –0.32 (4.95) | 0.921 |
| ΔLAScd_ED % (mean (SD)) | 8.18% (5.66%) | 22.78% (9.14%) | 0.351 |
| ΔLASct_ED (mean (SD)) (%) | –0.07 (4.81) | –2.33 (4.28) | 0.011* |
| ΔLASct_ED % (mean (SD)) | 13.28% (10.12%) | –11.38% (11.10%) | 0.206 |
*p
As shown in Table 4, in the obstruction group, the R_2D_GLS, P_2D_GLS,
R_4D_LASr, P_LASr_ED and P_LASct_ED values were significantly worse, both
the
| Non-obstruction group | Obstruction group | p | |
| Sample | 103 | 39 | |
| Gender = 1 (%) | 76 (73.8) | 22 (56.4) | 0.073 |
| Age (mean (SD)) (year) | 48.80 (14.12) | 49.87 (14.44) | 0.688 |
| Positive = 1 (%) | 22 (21.4) | 18 (46.2) | 0.006* |
| Mitral valve regurgitation = 1 (%) | 21 (20.39) | 8 (20.51) | 0.862 |
| Tricuspid regurgitation = 1 (%) | 77 (74.75) | 30 (76.92) | 0.857 |
| BSA (mean (SD)) (m2) | 1.74 (0.19) | 1.72 (0.25) | 0.631 |
| BMI (mean (SD)) (kg/m2) | 24.11 (3.29) | 24.07 (4.08) | 0.949 |
| LVMI (mean (SD)) (g/m2) | 150.60 (64.24) | 133.46 (48.10) | 0.133 |
| R_MWT (mean (SD)) (mm) | 19.55 (4.20) | 22.92 (5.27) | |
| R_LAd (mean (SD)) (mm) | 37.51 (5.22) | 39.05 (5.32) | 0.112 |
| R_E/e’ (mean (SD)) | 13.15 (7.11) | 14.72 (7.49) | 0.250 |
| R_LVOT-PG (mean (SD)) (mmHg) | 6.28 (2.82) | 48.20 (59.16) | |
| R_LA_Vlmax (mean (SD)) (mm/m2) | 34.82 (12.11) | 35.26 (15.50) | 0.859 |
| R_HR (mean (SD)) (bpm) | 76.08 (11.48) | 81.49 (13.53) | 0.018* |
| P_HR (mean (SD)) (bpm) | 156.65 (26.34) | 152.10 (22.36) | 0.341 |
| P_LVOT-PG (mean (SD)) (mmHg) | 13.79 (8.38) | 93.50 (75.26) | |
| P_E/e’ (mean (SD)) | 13.76 (6.09) | 18.21 (7.13) | |
| R_4D_GLS (mean (SD)) (%) | –15.96 (3.53) | –14.97 (3.65) | 0.084 |
| R_2D_GLS (mean (SD)) (%) | –19.92 (3.26) | –18.38 (3.14) | 0.012* |
| R_LASr_ED (mean (SD)) (%) | 21.21 (7.10) | 18.98 (6.36) | 0.087 |
| R_LAScd_ED (mean (SD)) (%) | –12.87 (7.07) | –11.44 (5.68) | 0.260 |
| R_LASct_ED (mean (SD)) (%) | –8.23 (4.65) | –7.77 (3.55) | 0.576 |
| R_4D_LASr (mean (SD)) (%) | 17.23 (6.03) | 14.21 (5.23) | 0.006* |
| R_4D_LAScd (mean (SD)) (%) | –9.99 (5.50) | –8.72 (4.88) | 0.207 |
| R_4D_LASct (mean (SD)) (%) | –6.80 (4.53) | –5.54 (2.85) | 0.108 |
| P_2D_GLS (mean (SD)) (%) | –19.57 (4.61) | –16.20 (3.94) | |
| P_LASr_ED (mean (SD)) (%) | 21.15 (8.12) | 16.76 (7.33) | 0.004* |
| P_LAScd_ED (mean (SD)) (%) | –12.66 (8.10) | –11.15 (5.65) | 0.287 |
| P_LASct_ED (mean (SD)) (%) | –8.07 (5.46) | –5.60 (4.83) | 0.015* |
| Δ2D_GLS (mean (SD)) (%) | –0.35 (3.30) | –2.18 (3.37) | 0.004* |
| Δ2D_GLS % (mean (SD)) | –1.52% (17.46%) | –11.01% (18.63%) | 0.005* |
| ΔLASr_ED (mean (SD)) (%) | –0.06 (5.50) | –2.22 (5.12) | 0.036* |
| ΔLASr_ED % (mean (SD)) | 0.20% (25.56%) | –11.79% (28.49%) | 0.017* |
| ΔLAScd_ED (mean (SD)) (%) | –0.21 (7.42) | –0.29 (4.99) | 0.951 |
| ΔLAScd_ED % (mean (SD)) | 12.19% (66.62%) | 12.52% (73.12%) | 0.979 |
| ΔLASct_ED (mean (SD)) (%) | –0.16 (4.67) | –2.16 (4.74) | 0.025* |
| ΔLASct_ED % (mean (SD)) | 17.41% (114.65%) | –22.95% (1.93%) | 0.039* |
*p
Positive events were negatively correlated with R_4D_LASr (r = –0.67), P_LASr_ED (r = –0.61), R_LASr_ED (r = –0.58), and positively correlated with P_2D_GLS (r = 0.58), R_4D_LAScd (r = 0.57), R_4D_GLS (r = –0.43), R_2D_GLS (r = 0.44), R_4D_LAScd (r = 0.57), P_LAScd_ED (r = 0.49), R_LA_Vlmax (r = 0.43) and R_LAScd_ED (r = 0.47). Positive events were weakly correlated with R_LVOT-PG (r = 0.35), and P_LVOT-PG had an “inverted U” shape relationship with positive events.
As shown in Table 5, the collinearity analysis revealed that the variance inflation factor (VIF) values of R_4D_LASr, P_LASr_ED, R_LA_Vlmax, P_2D_GLS and R_4D_GLS were less than 3, and the tolerance (TOL) were greater than 0.2, which indicates mild collinearity and is acceptable.
| TOL | VIF | p | |
| R_4D_LASr | 0.53 | 1.91 | |
| P_LASr_ED | 0.54 | 1.85 | 0.005 |
| R_LA_Vlmax | 0.69 | 1.44 | 0.166 |
| R_4D_GLS | 0.68 | 1.46 | 0.243 |
| P_2D_GLS | 0.54 | 1.84 | 0.029 |
| R_LVOT-PG | 0.40 | 2.53 | 0.139 |
| P_LVOT-PG | 0.43 | 2.33 | 0.505 |
TOL, tolerance; VIF, variance inflation factor; LA, left atrial; LASr, left atrial reservoir strain; LA_Vlmax, left atrium maximum volume index; GLS, global longitudinal strain; LVOT-PG, left ventricular outflow tract pressure gradient.
As shown in Table 6, the logistic regression and stratified analysis revealed that the P of R_4D_LASr and P_2D_GLS were less than 0.05, which showed that R_4D_LASr and P_2D_GLS had independent predictive value for positive cardiovascular events, and the value of “Nagelkerke R2” = 0.720, the p value of “Hosmer and Lemeshow test” = 0.407, which indicated that the model has good explanatory power.
| B | Standard error | p | Exp(B) | 95% CI (Lower–Upper) | |
| R_4D_LASr | –0.424 | 0.09 | 0.655 | 0.547–0.783 | |
| P_2D_GLS | 0.324 | 0.09 | 0.001 | 1.383 | 1.142–1.675 |
*p
Combining the number of patients with positive events and the principle of statistical efficiency, as well as the clinical significance of the above parameters, suggested that the following parameters can be included in the ROC analysis, as shown in Table 7 and Fig. 5, the prediction efficiency of R_4D_LASr, P_LASr_ED and P_2D_GLS is better than R_LA_Vlmax.
| Cutoff value | Specificity | Sensitivity | AUC | |
| R_4D_LASr | 14.50 | 85.29 | 90.00 | 0.93 |
| P_LASr_ED | 16.84 | 84.31 | 87.50 | 0.89 |
| P_2D_GLS | –15.70 | 89.22 | 75.00 | 0.88 |
| R_LA_Vlmax | 44.62 | 59.00 | 45.00 | 0.70 |
AUC, area under the curve; LA, left atrial; LASr, left atrial reservoir strain; GLS, global longitudinal strain; LA_Vlmax, left atrium maximum volume index.
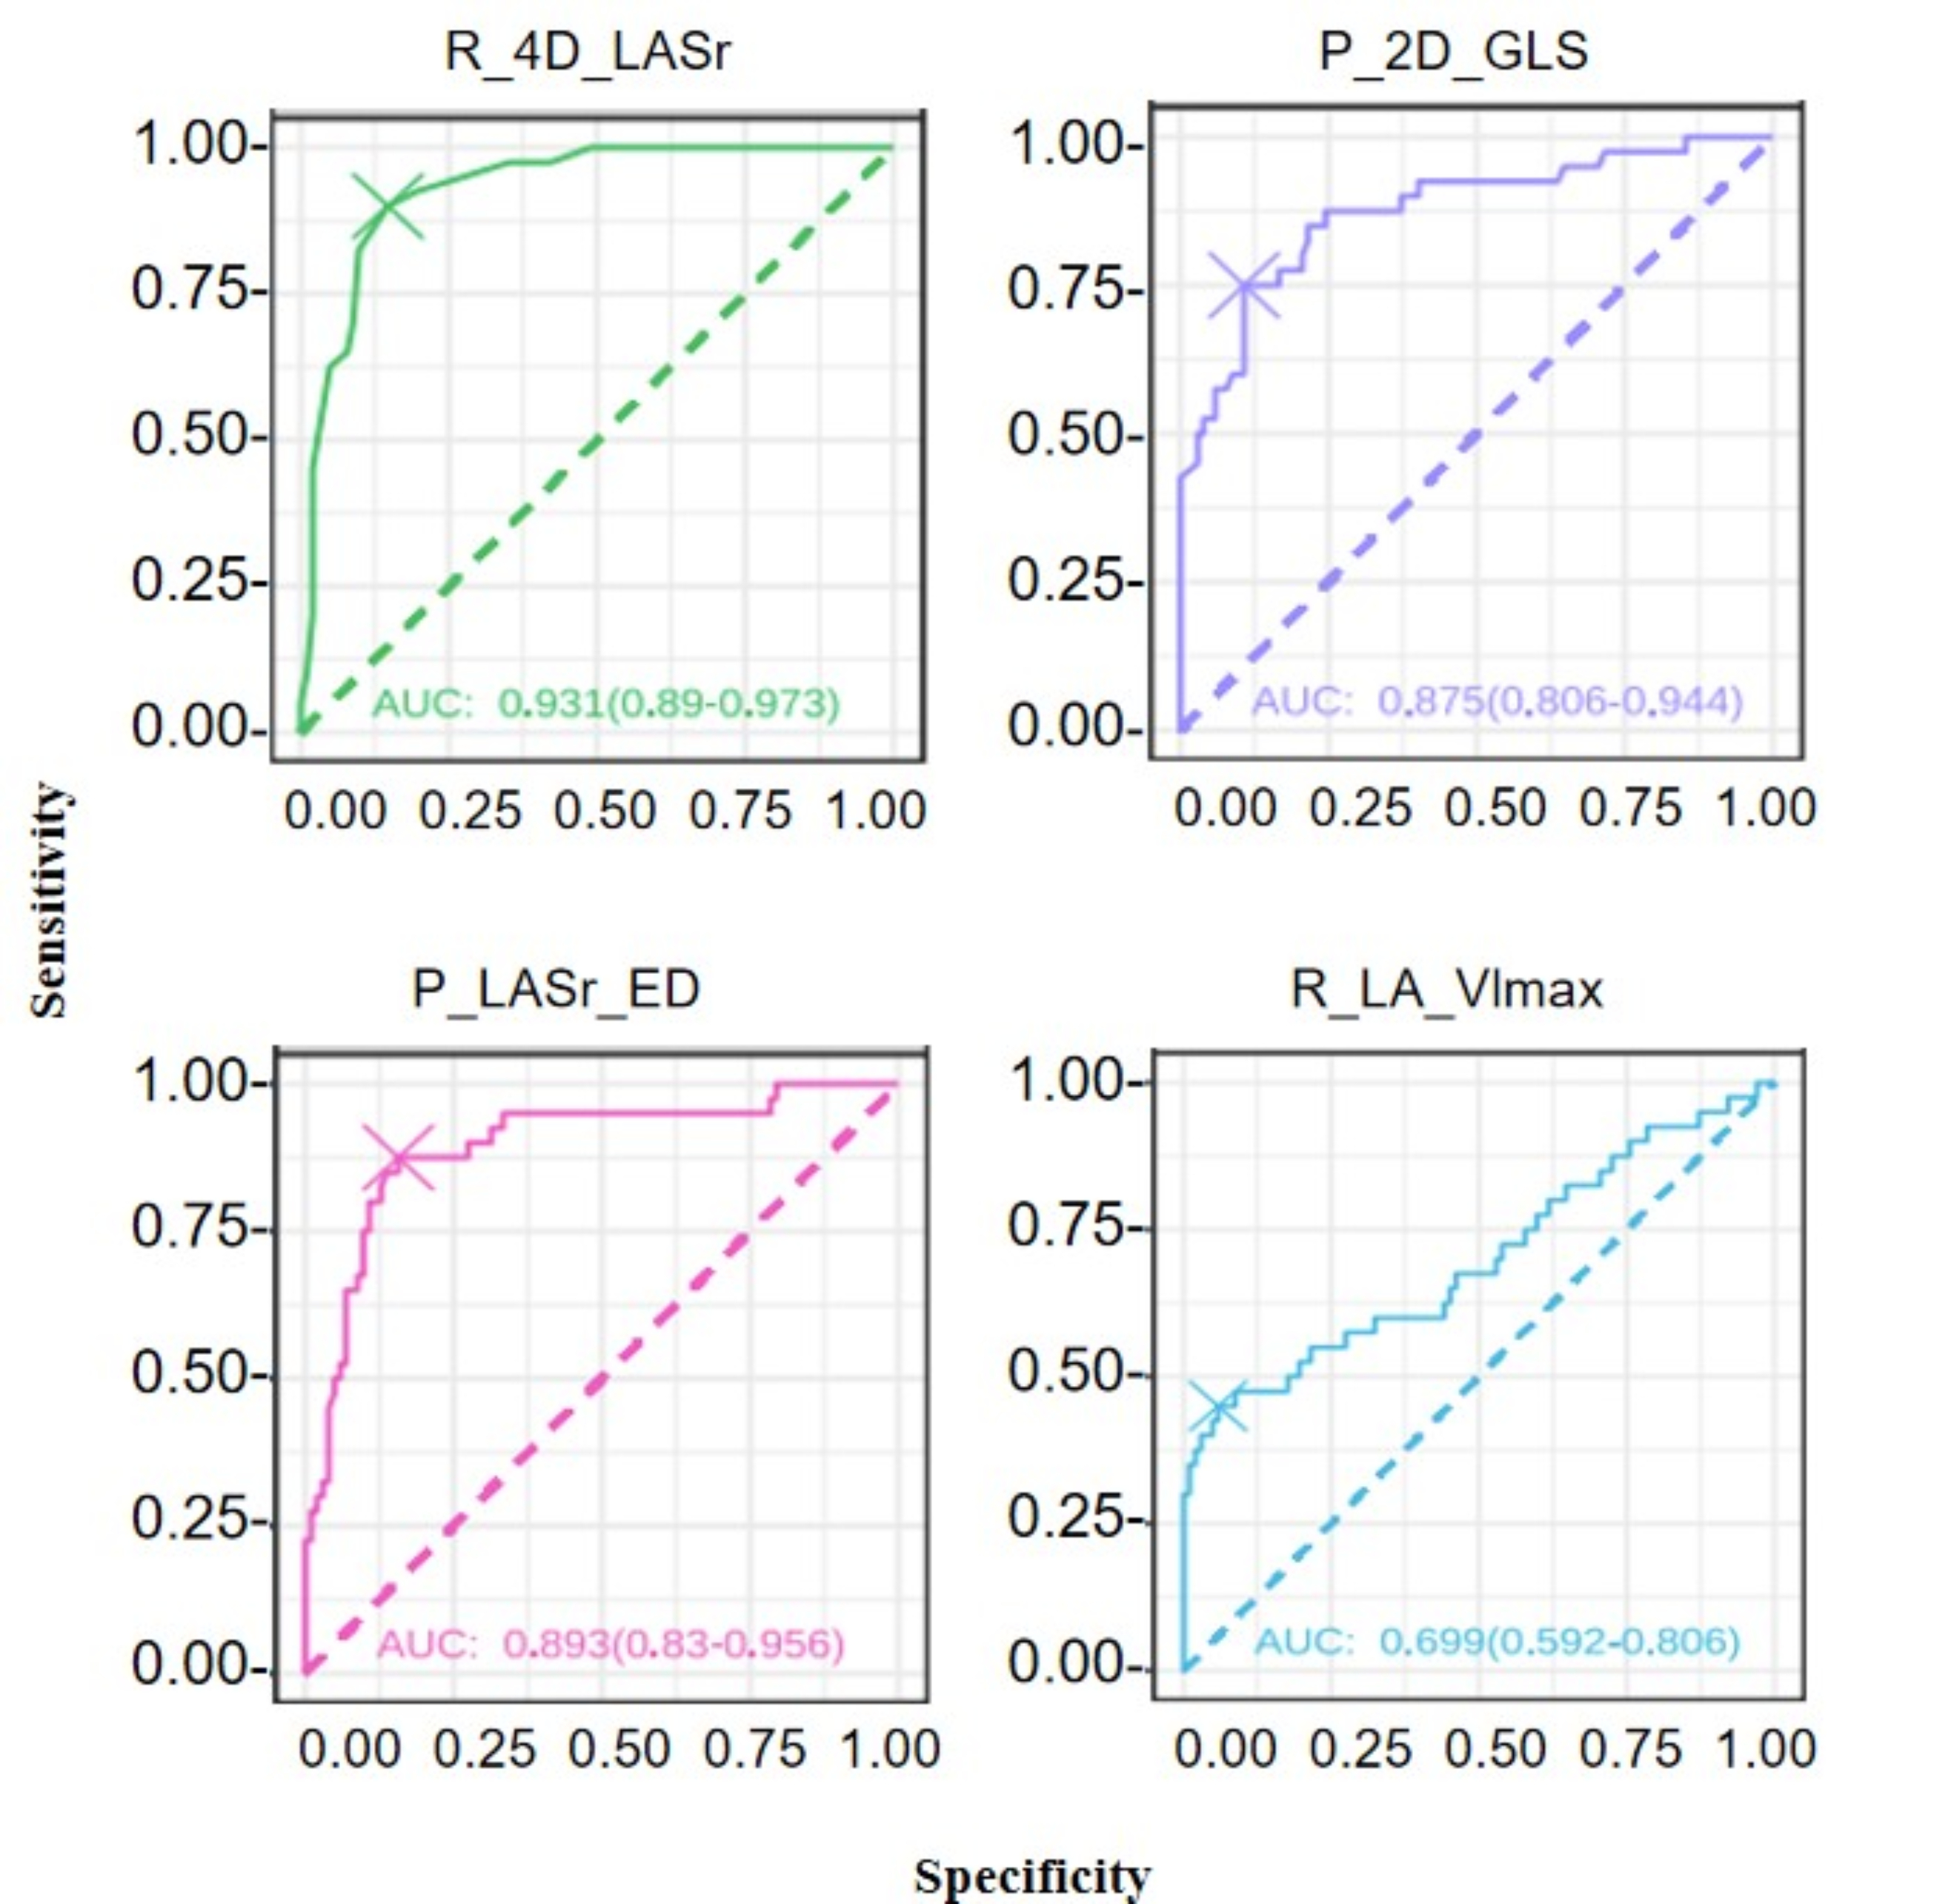 Fig. 5.
Predictive power for positive cardiovascular events. LA, left atrial; LASr, left atrial reservoir strain; GLS, global longitudinal strain; LA_Vlmax, left atrium maximum volume index.
As shown in Table 8, the ICC analysis demonstrated good inter-observer consistency.
| Inter-observe | |||
| ICC | 95% Lower | 95% Upper | |
| R_4D_LASr | 0.89 | 0.85 | 0.92 |
| R_LASr_ED | 0.91 | 0.88 | 0.94 |
| P_2D_GLS | 0.89 | 0.86 | 0.92 |
| R_2D_GLS | 0.89 | 0.86 | 0.92 |
ICC, intra-class correlation; GLS, global longitudinal strain; LASr, left atrial reservoir strain.
In this study, ESE was used to conduct a comprehensive analysis of exercise-induced cardiac function and reserve in HCM patients, with a 5-year follow-up for positive cardiovascular events. We observed that in the HCM positive event group, both resting and peak left atrial reservoir strain and GLS were significantly impaired, accompanied by marked deterioration or even loss of reserve. R_4D_LASr and P_2D_GLS had independent predictive value for positive cardiovascular events.
Huang et al. [14] found that in HCM, whether the ventricular wall is
thickened or not, there are abnormalities in GLS, and mechanical abnormalities
may precede the occurrence of hypertrophy [15]. At the same time, through
multivariate analysis, it was found that GLS reflects impaired myocardial
contraction and is related to the severity of HCM [16]. Wu et al. [17] conducted further research on HCM and found that the GLS of HCM decreased both
before and after exercise, the systolic reserve during exercise was also
significantly reduced, and the decreased GLS at peak was significantly related to
exercise intolerance. Further research by Badran et al. [18] found that
the systolic function reserve of HCM patients decreased by 23% after exercise.
Based on previous studies, this study combined the influencing factors of GLS.
Not only did it select the most physiologically appropriate treadmill exercise
stress mode for HCM patients, but according to the 5-year follow-up of HCM, it
was found that even if the GLS of HCM patients at rest is at the edge of the
critical value or slightly decreased, the GLS after exercise stress will
immediately show a significant decrease, and the degree of reduction in systolic
strain reserve is about 22%. In the positive events group, the GLS at rest and
peak exercise is significantly decreased, and the reduction in systolic reserve
(
In the 2014 and 2022 ESC guidelines [4, 22] for the clinical risk factors for SCD
in HCM, the atrial index is “left atrial internal diameter/size”, and the
LA_Vlmax
Left atrial reservoir strain has been shown by previous studies to not only
sensitively and objectively reflect diastolic dysfunction in HCM at an earlier
stage, but also that the sensitivity and accuracy in predicting adverse
cardiovascular events are significantly improved compared to resting GLS and E/e’
[24, 25, 26, 27, 28, 29, 30]. Left atrial storage strain has been proven to be closely related to
pulmonary capillary wedge pressure and the early response to earlier treatment,
and is a strong predictor of long-term prognosis in HCM patients [14, 31]. In this
study, for the analysis of left atrial strain, regardless of 2D or 3D-STI,
ventricular end-diastole was selected as the zero baseline of the left atrial
strain curve, and longitudinal strain was generated from each atrial segment. It
was found that the left atrial storage strain, conduit strain, and contraction
strain in the positive events group were significantly worse than those in the
non-events group. After exercise, the left atrial peak storage strain, conduit
strain, and contraction strain in the positive events group were further reduced,
and the reserve (
In all HCM patients, both resting obstruction and obstruction which occurred
during exercise were labeled as obstruction patients. As shown in Table 4, in the
non-event group (102 HCM patients), there were 21 cases of obstruction,
accounting for 20.6%, and in the positive event group (40 HCM patients), there
were 18 cases of obstruction, accounting for 45.0%, which was statistically
significant (p = 0.006). In the obstruction group, the R_4D_GLS,
R_2D_GLS, P_2D_GLS, R_LASr_ED, R_4D_LASr, P_LASr_ED and P_LASct_ED
values were significantly worse, both the
A retrospective study involving more than 3000 HCM patients showed that abnormal resting LV-GLS was related to adverse cardiovascular events [36]. In addition, a large study by Yang et al. [37] also confirmed that the impairment of resting GLS was significantly related to adverse cardiovascular events in HCM, and the GLS can assist in identifying and determining the risk degree of HCM, which also partially explains the high rate of SCD in young HCM patients. At the same time, left atrial strain has been proven to have predictive value for adverse cardiovascular events in clinical practice [16, 38]. The quantitative analysis of left atrial strain can also provide a basis for the diagnosis, classification, prediction of new atrial fibrillation, and identification of adverse cardiovascular events in subclinical left atrial dysfunction [39]. In this 5-year follow-up study, it was found that the GLS and its reserve, as well as the LASr and its reserve in the positive event group were worse than those in the non-event group. Logistic regression and collinearity analysis showed that R_4D_LASr and P_2D_GLS had independent predictive value for positive cardiovascular events. In Fig. 5 and Table 7, the R_4D_LASr and P_2D_GLS showed strong predictive ability for cardiovascular events in HCM. According to classical pathophysiology, abnormal diastolic function is not only an early pathophysiological feature of HCM but also one of the important reasons for the deterioration and progression of HCM. It strongly implies that positive events may be simultaneously influenced by both the systolic and diastolic functions of the ventricles and atria, with more emphasis on the diastolic function, and that these positive clinical events may be the result of a combination of multiple factors.
Speckle tracking echocardiography suffers from a number of relevant technical
limitations, such as the intervendor variability, dependency on optimal image
quality, sufficient frame rates (typically
In the study, the endpoint events such as heart failure, ventricular tachycardia, atrial fibrillation, and syncope were direct manifestations of the natural progression or deterioration of the disease. Implantable cardioverter-defibrillator (ICD) implantation was a decision made by clinicians through comprehensive judgment, which indirectly reflects the deterioration of the disease to a certain extent. The main purpose of this study at this stage is to screen risk factors and prediction models. Therefore, “ICD implantation” is set as the “Primary Prevention”, which still inevitably leads to “bias” and “endpoint heterogeneity” at the current stage. In the subsequent stage, on the one hand, classical survival analysis or competitive risk analysis will be conducted, and on the other hand, more sensitive multimodal potential new markers will be added to continuously improve and enrich the results and conclusion.
At this stage of the study, no additional biological markers were included, such as B-type natriuretic peptide (BNP). This study considers that the pathophysiological mechanism of HCM shows that abnormal diastolic function is an early pathophysiological feature and also one of the important reasons for the deterioration and development of HCM. When designing the research protocol, the non-invasive method of stress ultrasound was given more priority. At the current stage, we hope to explore new non-invasive imaging parameters to predict and assess the risk of HCM. BNP is a “molecular marker” reflecting cardiac load and cardiac function. Its pathophysiological core is the response to increased ventricular pressure/volume load. Although it is widely used in the diagnosis, assessment and management of heart failure in clinical practice, it has certain limitations in the specific risk assessment of HCM: Elevated BNP is not only seen in HCM, but is also related to multiple factors such as age, renal insufficiency, atrial fibrillation, and hypertension. BNP has certain correlations with some parameters. After inclusion, it may reduce the model efficiency due to collinearity. At this stage of the study, all the enrolled patients were able to perform the treadmill exercise test, and the cardiac function was NYHA Class I. The clinical endpoint events were Syncope, Heart failure, ICD or pacemaker implantation, ventricular tachycardia, and atrial fibrillation. BNP is more likely to reflect events related to cardiac insufficiency (such as heart failure), has a relatively low predictive sensitivity for arrhythmia events such as SCD and atrial fibrillation, and has a weak correlation with the “composite cardiovascular events” of concern in this study. Although BNP was not included in this present study, its clinical value is not denied. Instead, it is a phased choice in the research design. Our aim is to integrate multi-omics and multimodal imaging technologies, further optimize the research protocol, and explore deeper mechanisms to improve the assessment of cardiac function and stratify the prognosis of HCM patients, ultimately enhancing their diagnosis, treatment and long-term management.
ESE provides critical information to predict risk factors in HCM patients: R_4D_LASr and P_2D_GLS had independent predictive value for positive cardiovascular events, which can assist in the clinical assessment, and identification of high-risk HCM patients, promote the individualized and precise risk stratification of HCM in clinical practice, and improve the long-term prognosis.
Since this study is still ongoing, the data are not currently fully publicly available. Upon completion of the subsequent research, the data can be made accessible upon reasonable request.
YS, LY, and CL: conception and design. LY: administrative support. CL and YS: provision of study materials or patients. YS, QP and BC: collection and assembly of data, and data analysis and interpretation. All authors contributed to manuscript writing and final approval of the manuscript. All authors have participated sufficiently in the work and agreed to be accountable for all aspects of the work.
The studies involving human participants were reviewed and approved by the Human Body Research Institution Committee of Sichuan Provincial People’s Hospital (approval No.185) and were performed in accordance with the Declaration of Helsinki (as revised in 2013). All patients signed the informed consent. The study procedures strictly followed the rules for the protection of patient privacy, and all data were anonymized.
Special thanks to “Bo Chen” for his assistance during the analysis and revision process.
This study was supported by Sichuan Science and Technology Program (Grant No. 2025ZNSFSC1699).
The authors declare no conflict of interest.
References
Publisher’s Note: IMR Press stays neutral with regard to jurisdictional claims in published maps and institutional affiliations.