


 , Shuangxiang Lin 1, Xinfa Ding 1, Xinhong Wang 1, Jianzhong Sun 1,*
1 Department of Radiology, The Second Affiliated Hospital Zhejiang University School of Medicine, 310000 Hangzhou, Zhejiang, China
Abstract
This study aimed to examine the prognostic value of pericoronary adipose tissue (PCAT) attenuation at three months after transcatheter aortic valve replacement (TAVR) in patients with aortic stenosis (AS) and obstructive coronary artery disease (CAD).
This retrospective study included 226 patients with both obstructive CAD and AS who underwent TAVR. PCAT attenuation was measured three months post-TAVR using coronary computed tomography angiogram (CCTA) images. Univariable and multivariable Cox regression analyses were conducted to evaluate the association between PCAT attenuation and major adverse cardiac events (MACEs).
Of the 226 patients, 37 experienced MACEs during a median follow-up period of 1.5 years. High PCAT attenuation was significantly associated with MACEs (–65.3 Hounsfield units (HU) vs. –71.6 HU; p < 0.01). The optimal PCAT attenuation threshold of –67.5 HU, determined by receiver operating characteristic (ROC) curve analysis, showed 84% sensitivity and 75% specificity (area under the curve (AUC) = 0.88) for predicting MACEs. Multivariable Cox regression confirmed that higher PCAT attenuation was independently associated with an increased risk of MACEs (hazard ratio (HR) = 1.83, 95% confidence interval (CI): 1.44–2.32; p < 0.01). Inclusion of PCAT attenuation increased the C-index from 0.41 to 0.82 (p = 0.01) and the net reclassification improvement (NRI) by 0.55 (95% CI: 0.34–0.78; p = 0.01).
PCAT attenuation was independently associated with the risk of MACEs in post-TAVR patients with obstructive CAD and AS, suggesting the potential utility of PCAT attenuation for risk stratification.
Keywords
- aortic valve stenosis
- coronary artery disease
- adipose tissue
- transcatheter aortic valve replacement
- computed tomography angiography
Transcatheter aortic valve replacement (TAVR) has emerged as a transformative intervention in the management of aortic stenosis (AS), significantly improving the symptoms and survival outcomes of elderly patients afflicted by this progressive disease [1]. A notable proportion of individuals with severe AS who undergo TAVR, estimated to range from 60% to 80%, also present with concurrent coronary artery disease (CAD) [2]. This dual pathology is largely driven by shared risk factors such as diabetes, systemic inflammation, gender, and advancing age. The interplay between AS and CAD is characterized by a heightened cardiac workload resulting from AS, which can then exacerbate myocardial ischemia associated with CAD [3, 4]. Conversely, the presence of CAD hampers the heart’s ability to compensate for the increased hemodynamic demands imposed by AS, leading to an accelerated onset of symptoms and the emergence of more severe complications [5].
The use of computed tomography (CT) has become increasingly widespread during the assessment of patients with severe AS for TAVR. CT enhances the diagnostic accuracy and facilitates more effective management strategies [6, 7]. Among the innovations in this area, the analysis of pericoronary adipose tissue (PCAT) has gained attention as a promising non-invasive biomarker for vascular inflammation [8]. PCAT serves as a novel tool for stratifying patients with cardiovascular disease [9]. Extensive research has shown that elevated PCAT attenuation, a marker of increased inflammatory activity, is strongly correlated with a higher risk of major adverse cardiac events (MACE) and worse clinical outcomes [10, 11]. This association highlights the critical involvement of inflammatory mediators, such as interleukins and tumor necrosis factor-alpha, in the processes of tissue remodeling, calcification, and plaque instability, all of which contribute to cardiovascular risk [12]. The role of PCAT in mediating these inflammatory pathways underscores its potential utility as a prognostic marker.
Based on prior literature, we hypothesized that PCAT analysis of the culprit vessel or of the post-stent implantation vessel subsequent to TAVR could be instrumental in identifying patients at high risk for MACE. Therefore, the aim of this study was to evaluate the prognostic significance of coronary PCAT measured three months post-TAVR in predicting cardiovascular events among CAD patients.
This retrospective study included consecutive patients with severe
AS and obstructive CAD, defined as at least one stenosis
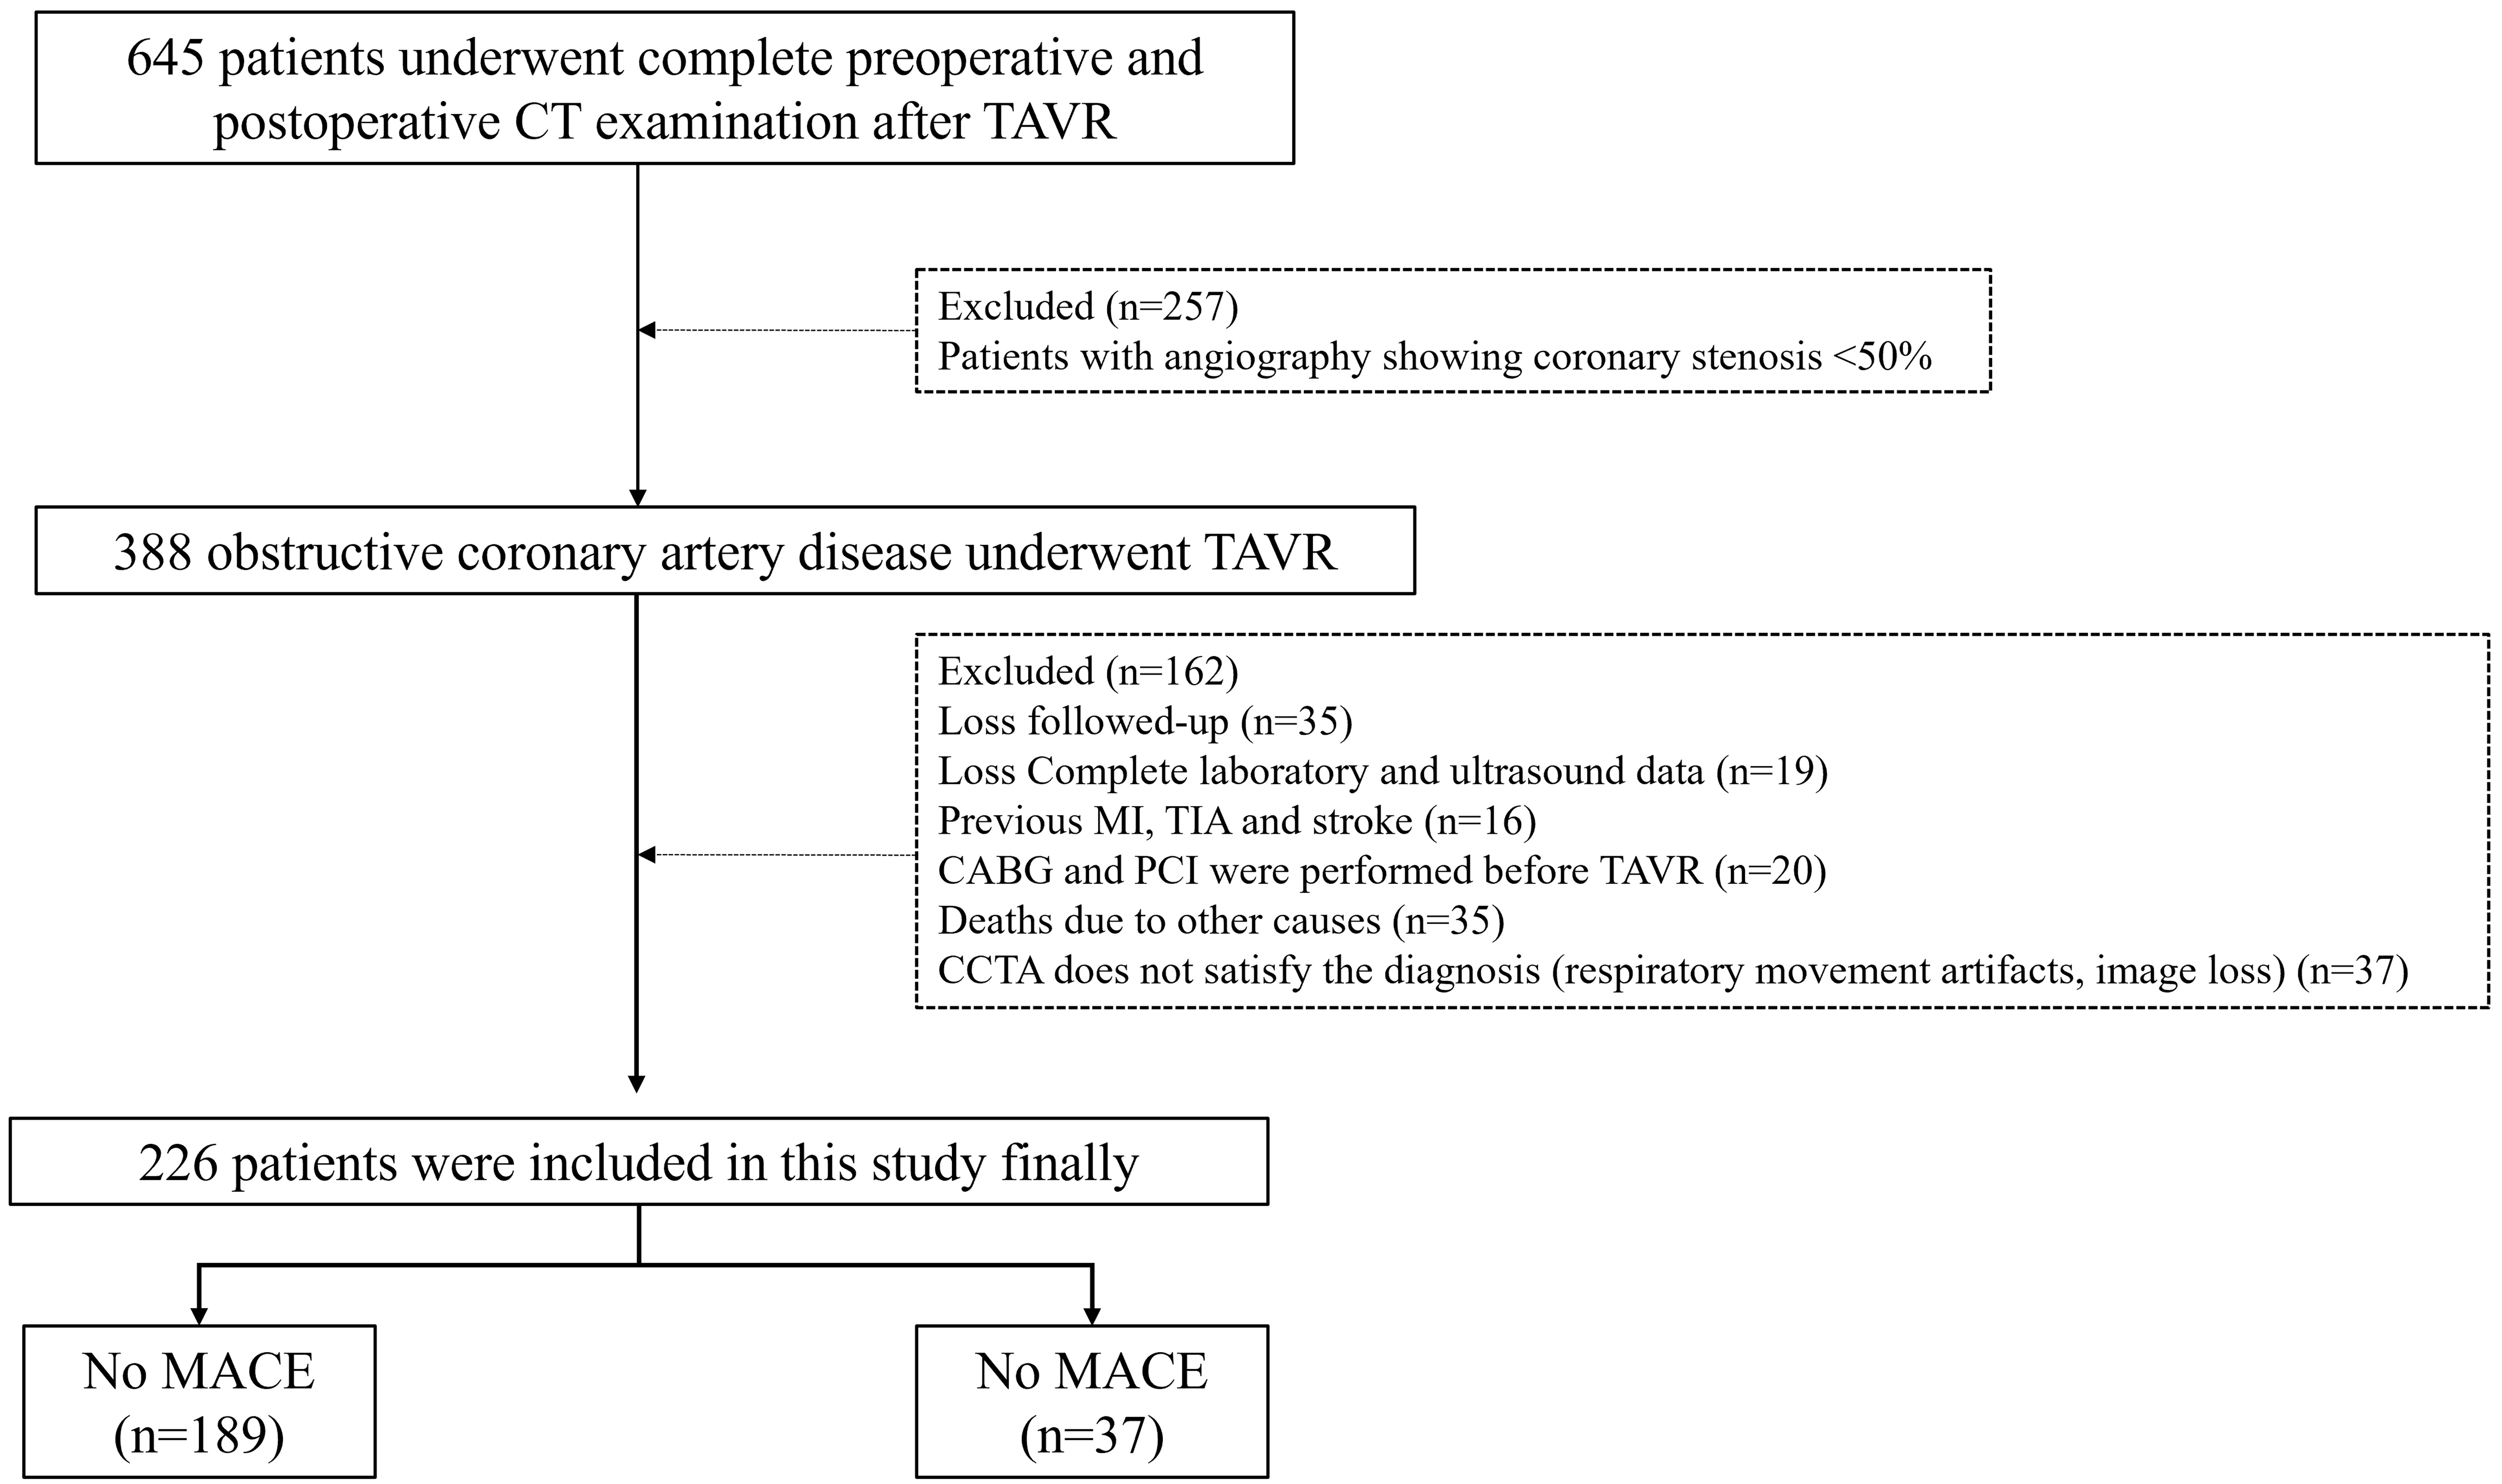 Fig. 1.
Flowchart of study population. CT, computed tomography; TAVR, transcatheter aortic valve replacement; MI, Myocardial infarction; TIA, Transient ischemic attack; CABG, Coronary artery bypass; CCTA, coronary computed tomography angiogram; MACE, major adverse cardiac events.
Patients underwent CCTA using a third-generation dual-source CT scanner (Somatom
Force; Siemens Healthineers, Forchheim, Germany) in dual-energy mode. The X-ray
tubes were set at 80 kV (387 mAs) and Sn150 kV (215 mAs with a 0.64-mm tin
filter). The scan parameters included a detector collimation of 192
As previously described in the literature, PCAT analysis was performed on a specialized workstation (Cardiac Risk Assessment Prototype, Syngo.via Frontier, Siemens Healthineers) and was based on 80 kV-generated images [14, 15]. Narrowed coronary vessels were analyzed, and in the case of multi-vessel disease, vessels with the most severe stenosis were selected. A 40 mm segment of the proximal coronary vessel for the stenotic vessel (10 mm to 50 mm from its origin) was selected to avoid influence from the aortic wall. Vessel lumen and wall boundaries were initially identified automatically, then adjusted manually if necessary. Perivascular adipose tissue was quantified as voxels, with attenuation values between –190 and –30 HU. PCAT attenuation was calculated as the mean CT attenuation, adjusted for technical factors [16]. Two blinded observers interpreted the images after a half-day interval to ensure objectivity.
Follow-up assessments were conducted quarterly until March 2024 through telephone interview and review of medical records. MACE were defined as the composite of cardiovascular death, non-fatal myocardial infarction, cardiac arrest, ischemic stroke of cardiac origin, or acute coronary syndrome requiring unplanned revascularization
Baseline characteristics for categorical variables are presented as rates and
percentages, and for continuous variables as medians with interquartile ranges
(IQR). Chi-square tests and Student’s t-tests were used to analyze
categorical and continuous data, respectively. ROC curve analysis was performed
to determine optimal cutoff values using the Youden index. Survival was estimated
with the Kaplan-Meier proportional hazard’s method, and differences assessed
using the stratified log-rank test. Univariable Cox regression analysis was used
to identify clinical factors associated with MACE. A multivariable Cox model was
constructed to assess the independent association of PCAT with MACE. Clinical
covariates associated with MACE were included using a stepwise forward selection
algorithm that retained variables with a p-value
The study cohort comprised 226 obstructive CAD patients who underwent TAVR.
These were predominantly male (59.5%) and had a mean age of 72.6 years (IQR,
68–78.8). During a median follow-up period of 1.5 years (IQR, 0.7–2.4 years),
37 of the 226 participants (16.4%) experienced MACE. Table 1 shows the patient
characteristics for the overall cohort, as well as for the subgroups with and
without MACE. Of the 678 analyzed vessels, the right coronary artery was the most
frequently implicated vessel (70.4%). However, it was not significantly
associated with MACE. Patients who experienced MACE were older (median age 78.0
vs. 72.0, p
| Characteristic | Overall | No MACE | MACE | p-value | |
| (n = 226) | (n = 189) | (n = 37) | |||
| Age (years) | 72.6 (68.0, 78.8) | 72.0 (68.0, 76.0) | 78.0 (72.0, 82.0) | ||
| Gender (male) | 134 (59.3) | 110 (58.2) | 24 (64.9) | 0.45 | |
| BMI (kg/m2) | 22.9 (3.2) | 23.1 (3.2) | 21.6 (3.0) | 0.01 | |
| BSA (m2) | 1.6 (1.5, 1.7) | 1.6 (1.5, 1.8) | 1.6 (1.5, 1.6) | 0.02 | |
| Smoking (Yes) | 61 (27.0) | 49 (25.9) | 12 (32.4) | 0.42 | |
| Dyslipidemia (Yes) | 27 (12.0) | 24 (12.8) | 3 (8.1) | 0.61 | |
| Hypertension (Yes) | 118 (52.2) | 99 (52.4) | 19 (51.4) | 0.91 | |
| Diabetes (Yes) | 41 (18.1) | 34 (18.0) | 7 (18.9) | 0.89 | |
| Angina (Yes) | 95 (42.0) | 84 (44.4) | 11 (29.7) | 0.11 | |
| Syncope (Yes) | 15 (6.7) | 14 (7.4) | 1 (2.7) | 0.49 | |
| NYHA III | 3.0 (2.0, 3.0) | 3.0 (2.0, 3.0) | 3.0 (3.0, 4.0) | ||
| STS score | 3.2 (1.9, 5.5) | 2.9 (1.8, 4.8) | 5.4 (3.2, 8.4) | 0.01 | |
| Laboratory | |||||
| Leukocytes (109/L) | 6.1 (4.8, 7.3) | 6.0 (4.8, 7.3) | 6.6 (5.1, 7.4) | 0.32 | |
| Hemoglobin (g/L) | 130.0 (117.0, 140.1) | 131.0 (119.0, 141.0) | 119.0 (102.0, 137.0) | 0.01 | |
| Platelet count (109/L) | 173.5 (144.0, 204.8) | 171.0 (144.0, 204.0) | 179.0 (156.0, 205.0) | 0.46 | |
| ProBNP (pg/mL) | 1377 (430.0, 4594.1) | 1262 (295.6, 4022.3) | 2970.0 (760.0, 7108.0) | 0.01 | |
| TnT (ng/mL) | 0.05 (0.12) | 0.05 (0.13) | 0.05 (0.05) | 0.89 | |
| Echocardiography | |||||
| Left atrial diameter (cm) | 4.2 (3.9, 4.6) | 4.2 (3.9, 4.6) | 4.2 (3.8, 4.4) | 0.12 | |
| Left ventricular ejection fraction (%) | 59.1 (48.0, 64.9) | 59.1 (49.2, 64.7) | 56.8 (46.6, 64.9) | 0.94 | |
| Max velocity (m/s) | 4.5 (4.0, 5.2) | 4.4 (3.8, 5.2) | 4.6 (4.1, 5.2) | 0.22 | |
| Mean gradient (mmHg) | 46.0 (37.0, 62.0) | 46.0 (36.7, 61.0) | 51.0 (39.0, 67.0) | 0.16 | |
| Aortic valve area (cm2) | 0.7 (0.5, 0.9) | 0.7 (0.6, 0.9) | 0.6 (0.5, 0.8) | 0.02 | |
| Valve Type | 0.51 | ||||
| II | 109 (48.2) | 93 (49.2) | 16 (43.2) | ||
| III | 117 (51.8) | 96 (50.8) | 21 (56.8) | ||
| STJ av. diameter (mm) | 30.8 (27.9, 33.6) | 31.0 (28.1, 34.0) | 30.3 (27.3, 32.8) | 0.09 | |
| STJ height (mm) | 21.4 (19.1, 24.1) | 21.6 (19.1, 24.2) | 20.8 (19.1, 22.6) | 0.05 | |
| Max ascend. aorta diameter (mm) | 39.7 | 40.1 | 38.1 | 0.38 | |
| (36.2, 43.7) | (36.6, 43.6) | (35.3, 45.3) | |||
| Calcified | 113 (50.0) | 88 (46.6) | 25 (67.6) | 0.03 | |
| PCAT (HU) | –69.9 | –71.6 | –65.3 | ||
| (–74.6, –66.6) | (–75.5, –67.6) | (–67.0, –63.1) | |||
| Coronary artery disease location | |||||
| RCA | 159 (70.4) | 133 (70.4) | 26 (70.3) | 1.00 | |
| LCX | 39 (17.3) | 33 (17.5) | 6 (16.2) | 0.86 | |
| LAD | 28 (12.4) | 23 (12.2) | 5 (13.5) | 0.99 | |
| PCI | 116 (51.3) | 100 (52.9) | 16 (43.2) | 0.28 | |
| Post TAVR | |||||
| Paravalvular leak | 28 (12.39) | 23 (12.17) | 5 (13.51) | 0.18 | |
| Pacemaker implantation | 26 (11.51) | 20 (10.69) | 6 (16.22) | 0.06 | |
Values are either n (%) or median (IQR). Statistically significant p-values are in bold.
BMI, body mass index; BSA, body surface area; NYHA, New York Heart Association; STS score, Society of Thoracic Surgeons Score; Pro-BNP, Pro-B-type Natriuretic Peptide; STJ, sinotubular junction; PCAT, Pericoronary adipose tissue; RCA, right coronary artery; LCX, left circumflex; LAD, left anterior descending; PCI, percutaneous coronary intervention; HU, Hounsfield units.
As shown in Fig. 2a, patients who experienced MACE following TAVR showed higher
PCAT attenuation compared to those without MACE (–65.3 HU vs. –71.6 HU,
p
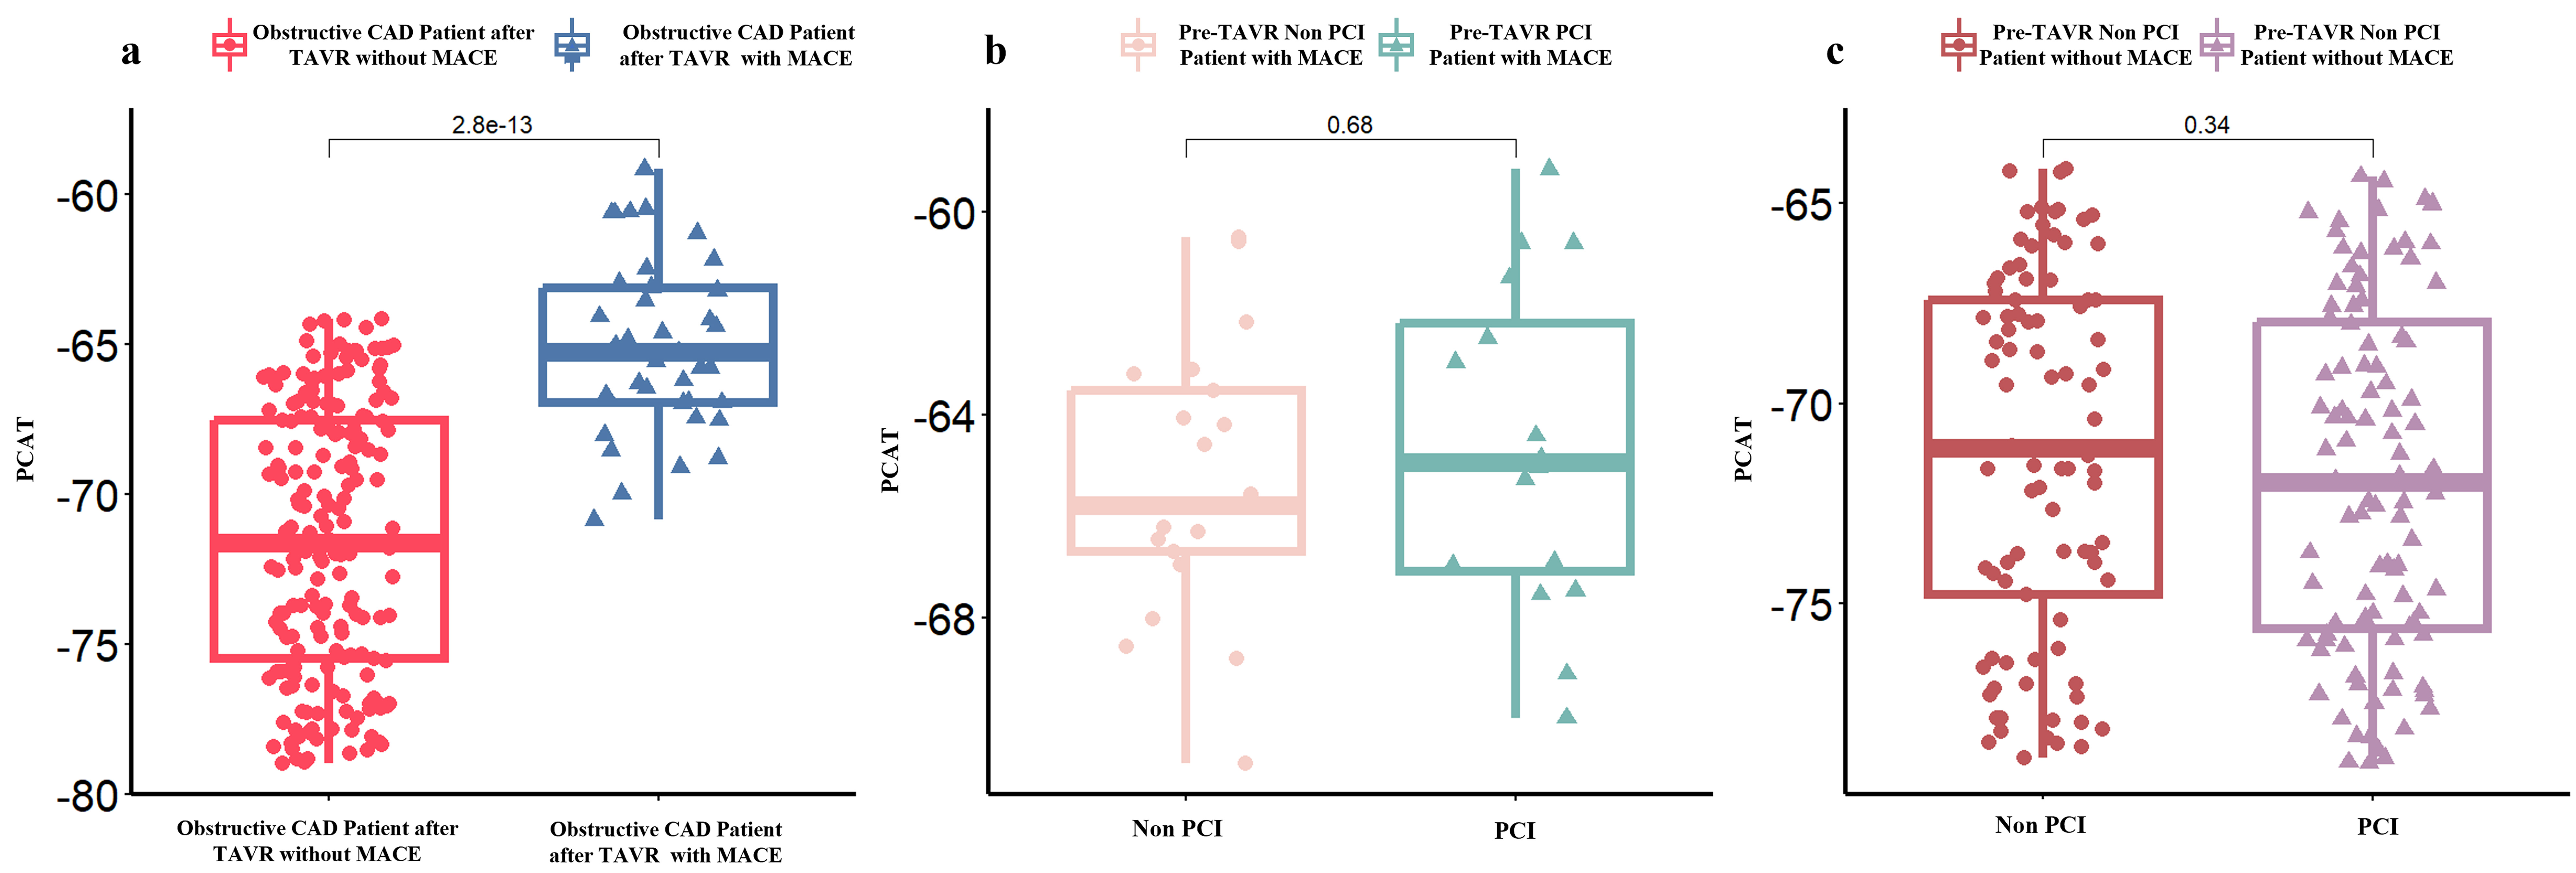 Fig. 2.
Pericoronary Adipose Tissue (PCAT) attenuation in obstructive CAD patients post-TAVR. (a) Obstructive CAD patients after TAVR with or without major adverse cardiac events (MACE). (b) Whether to perform PCI in Obstructive CAD Patient after TAVR with MACE, and (c) Whether to perform PCI in Obstructive CAD Patient after TAVR without MACE.
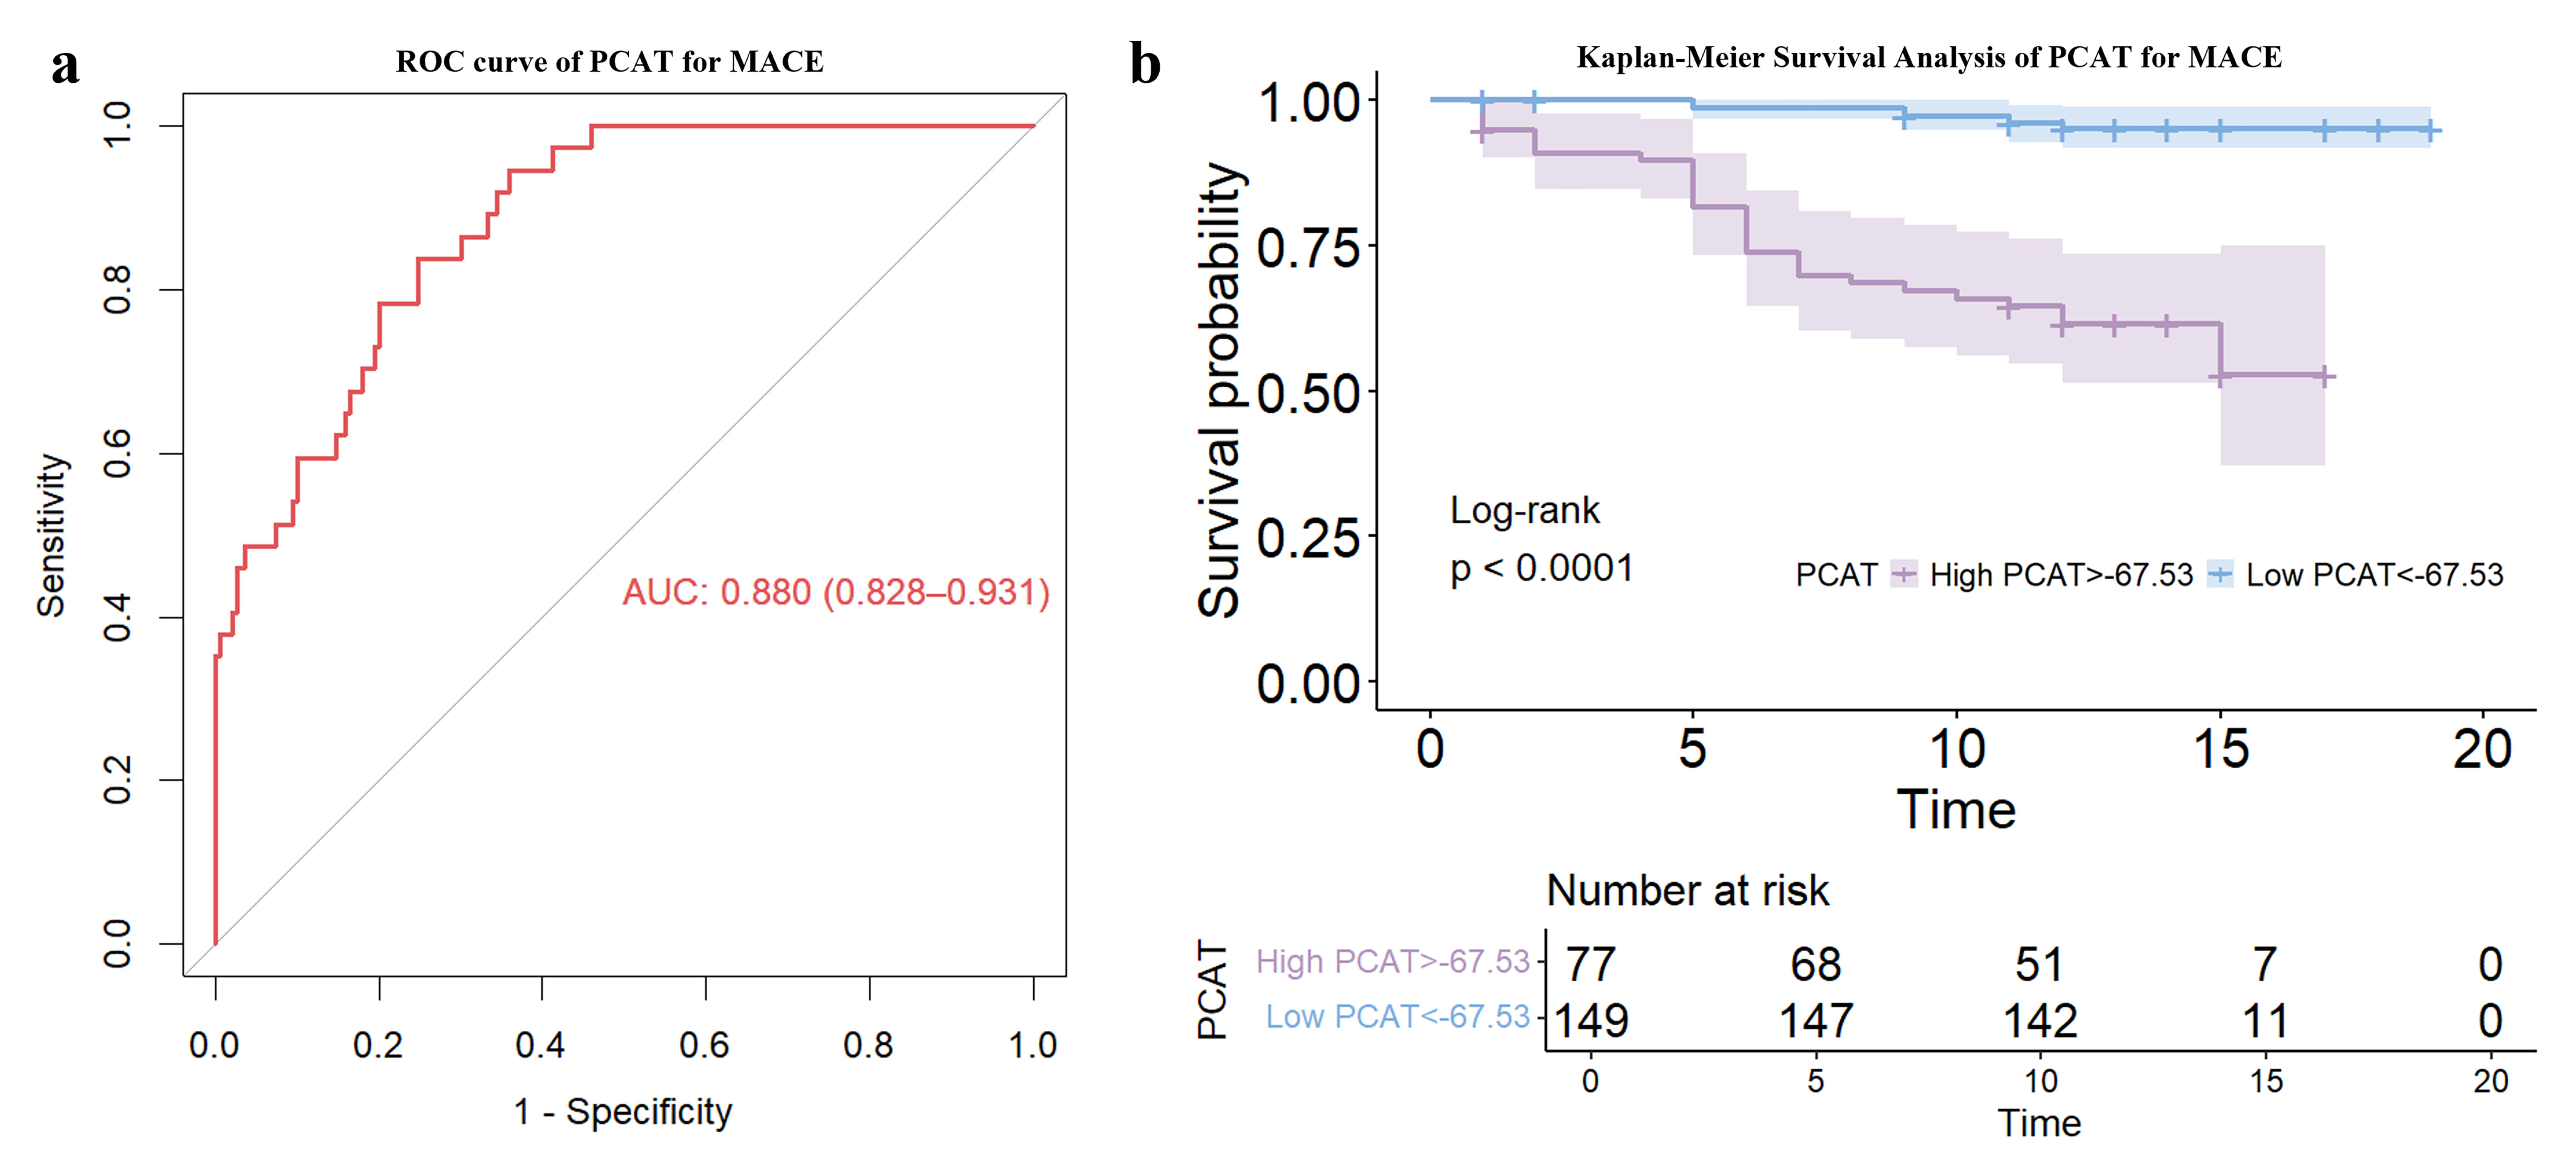 Fig. 3.
Evaluation of PCAT attenuation as a prognostic indicator in obstructive CAD patients post-TAVR. (a) Receiver Operating Characteristic (ROC) curve. (b) Kaplan-Meier survival analysis.
| Characteristic | Overall | High PCAT | Low PCAT | p-value | |
| (n = 226) | (n = 149) | (n = 77) | |||
| Age (years) | 73.00 |
72.54 |
73.88 |
0.22 | |
| Gender (male) | 134 (59.29) | 88 (59.06) | 46 (59.74) | 0.92 | |
| BMI (kg/m2) | 22.89 |
23.07 |
22.55 |
0.25 | |
| BSA (m2) | 1.63 |
1.64 |
1.62 |
0.37 | |
| Smoking (Yes) | 61 (26.99) | 42 (28.19) | 19 (24.68) | 0.57 | |
| Dyslipidemia (Yes) | 27 (11.95) | 18 (12.08) | 9 (11.69) | 0.93 | |
| Hypertension (Yes) | 118 (52.21) | 77 (51.68) | 41 (53.25) | 0.82 | |
| Diabetes (Yes) | 41 (18.14) | 29 (19.46) | 12 (15.58) | 0.47 | |
| Angina (Yes) | 95 (42.04) | 65 (43.62) | 30 (38.96) | 0.50 | |
| Syncope (Yes) | 15 (6.64) | 13 (8.72) | 2 (2.60) | 0.08 | |
| NYHA III | 195 (86.28) | 131 (87.92) | 64 (83.12) | 0.42 | |
| STS score | 4.31 |
3.93 |
5.04 |
0.06 | |
| Laboratory | |||||
| Leukocyte (109/L) | 6.22 |
6.22 |
6.21 |
0.95 | |
| Hemoglobin (g/L) | 127.47 |
129.11 |
124.32 |
0.10 | |
| Platelet count (109/L) | 178.35 |
179.44 |
176.24 |
0.70 | |
| ProBNP (pg/mL) | 3982.12 |
3293.08 |
5315.46 |
0.04 | |
| TnT (ng/mL) | 0.05 |
0.05 |
0.06 |
0.37 | |
| Echocardiography | |||||
| Left atrial diameter (cm) | 4.24 |
4.26 |
4.20 |
0.49 | |
| Left ventricular ejection fraction (%) | 56.45 |
56.39 |
56.57 |
0.91 | |
| Max velocity (m/s) | 4.43 |
4.25 |
0.29 | ||
| Mean gradient (mmHg) | 48.34 |
49.36 |
46.37 |
0.38 | |
| Aortic valve area (cm2) | 0.82 |
0.82 |
0.81 |
0.87 | |
| Valve Type | 0.38 | ||||
| II | 109 (48.23) | 75 (50.34) | 34 (44.16) | ||
| III | 117 (51.77) | 74 (49.66) | 43 (55.84) | ||
| STJ average diameter (mm) | 31.36 |
31.50 |
31.08 |
0.53 | |
| STJ height (mm) | 22.24 |
22.12 |
22.47 |
0.63 | |
| Max ascend. aorta diameter (mm) | 40.23 |
40.31 |
40.08 |
0.80 | |
| Calcified valve | 169 (74.78) | 106 (71.14) | 63 (81.82) | 0.08 | |
| Coronary artery disease location | |||||
| RCA | 28 (12.39) | 20 (13.42) | 8 (10.39) | 0.51 | |
| LCX | 39 (17.26) | 25 (16.78) | 14 (18.18) | 0.79 | |
| LAD | 159 (70.35) | 104 (69.80) | 55 (71.43) | 0.80 | |
| PCI | 116 (51.33) | 81 (54.36) | 35 (45.45) | 0.20 | |
| Post-TAVR | |||||
| Paravalvular leak | 28 (12.39) | 20 (13.42) | 8 (10.39) | 0.55 | |
| Pacemaker implantation | 26 (11.51) | 19 (12.75) | 7 (9.10) | 0.03 | |
| Patient experienced MACE | 37 (16.37) | 7 (4.70) | 30 (38.96) | ||
| Follow-up time (months) | 11.49 |
12.33 |
9.86 |
||
Values are either n (%) or median (IQR). Statistically significant p-values are printed in bold.
BMI, body mass index; BSA, body surface area; NYHA, New York Heart Association; STS score, Society of Thoracic Surgeons Score; Pro-BNP, Pro-B-type Natriuretic Peptide; STJ, sinotubular junction; PCAT, Pericoronary adipose tissue; RCA, right coronary artery; LCX, left circumflex; LAD, left anterior descending; PCI, percutaneous coronary intervention.
Table 3 shows the association of various clinical factors with MACE. In univariate analysis, the characteristics of patient age, NYHA functional class, angina, hemoglobin level, aortic valve area, sinotubular junction (STJ) height, STJ diameter, valve calcification and PCAT attenuation were all significantly associated with MACE. Following adjustment for confounding factors, multivariate Cox regression analysis revealed that Angina, Aortic valve area, NYHA functional class, STJ diameter, STJ height, valve calcification and PCAT attenuation remained significant predictors of MACE. Fig. 4 presents the measurement results of PCAT for a patient.
| Clinical characteristics | Univariable | Multivariable | |||
| Hazard ratio (95% CI) | p-value | Hazard ratio (95% CI) | p-value | ||
| Age (years) | 1.07 (1.02, 1.12) | 0.01 | 1.06 (0.98, 1.15) | 0.17 | |
| Gender (male) | 1.14 (0.55, 2.36) | 0.72 | - | - | |
| BMI (kg/m2) | 0.90 (0.81, 1.01) | 0.07 | - | - | |
| BSA (m2) | 0.15(0.02, 1.18) | 0.07 | - | - | |
| Smoking (Yes) | 1.30 (0.61, 2.75) | 0.49 | - | - | |
| Dyslipidemia (Yes) | 1.22 (0.37, 4.05) | 0.74 | - | - | |
| Hypertension (Yes) | 0.66 (0.32, 1.38) | 0.27 | - | - | |
| Diabetes (Yes) | 1.11 (0.47, 2.58) | 0.82 | - | - | |
| Angina (Yes) | 0.53 (0.25, 1.13) | 0.04 | 0.95 (0.92, 1.99) | ||
| Syncope (Yes) | 0.77 (0.10, 5.66) | 0.80 | - | - | |
| NYHA | 2.25 (1.30, 3.91) | 4.53 (1.34, 8.38) | 0.02 | ||
| STS score | 1.06 (1.00, 1.12) | 0.06 | - | - | |
| Laboratory | |||||
| Leukocyte (109/L) | 1.04 (0.90, 1.20) | 0.62 | |||
| Hemoglobin (g/L) | 0.97 (0.36, 1.36) | 0.98 (0.95, 1.01) | 0.07 | ||
| Platelet count (109/L) | 1.00 (1.00, 1.01) | 0.37 | - | - | |
| ProBNP (pg/mL) | 1.00 (1.00, 1.00) | 0.29 | - | - | |
| TnT (ng/mL) | 0.57 (0.10, 2.29) | 0.52 | - | - | |
| Echocardiography | |||||
| Left atrial diameter (cm) | 0.79 (0.43, 1.45) | 0.45 | - | - | |
| Left ventricular ejection fraction (%) | 1.01 (0.98, 1.04) | 0.72 | - | - | |
| Max velocity (m/s) | 1.35 (0.99, 1.85) | 0.06 | - | - | |
| Mean gradient (mmHg) | 1.01 (1.00, 1.03) | 0.11 | - | - | |
| Aortic valve area (cm2) | 0.11 (0.02, 0.58) | 0.01 | 0.18 (0.01, 0.95) | 0.04 | |
| Valve type | 1.20 (0.59, 2.44) | 0.61 | - | - | |
| STJ average diameter (mm) | 0.88 (0.81, 0.97) | 0.92 (0.84, 1.92) | 0.02 | ||
| STJ height (mm) | 0.88 (0.79, 0.98) | 0.02 | 1.01 (0.87, 2.17) | 0.01 | |
| Max ascend. aorta diameter (mm) | 1.05 (0.93, 1.19) | 0.41 | - | - | |
| Calcified valve | 2.74 (1.27, 5.90) | 0.01 | 1.78 (1.14, 3.25) | 0.04 | |
| PCAT | 1.46 (1.30, 1.64) | 1.83 (1.44, 2.32) | |||
| Coronary artery disease location | |||||
| LAD | 1.60 (0.71, 3.61) | 0.26 | - | - | |
| LCX | 0.31 (0.09, 1.05) | 0.06 | - | - | |
| RCA | 1.49 (0.57, 3.91) | 0.41 | - | - | |
| PCI | 0.92 (0.45, 1.86) | 0.81 | - | - | |
| Post TAVR | |||||
| Paravalvular leak | 1.62 (0.79, 3.31) | 0.18 | - | - | |
| Pacemaker implantation | 1.30 (0.63, 2.65) | 0.47 | - | - | |
BMI, body mass index; BSA, body surface area; NYHA, New York Heart Association class; STS score, Society of Thoracic Surgeons Score; Pro-BNP, Pro-B-type Natriuretic Peptide; STJ, sinotubular junction; PCAT, Pericoronary adipose tissue; RCA, right coronary artery; LCX, left circumflex; LAD, left anterior descending; PCI, percutaneous coronary intervention.
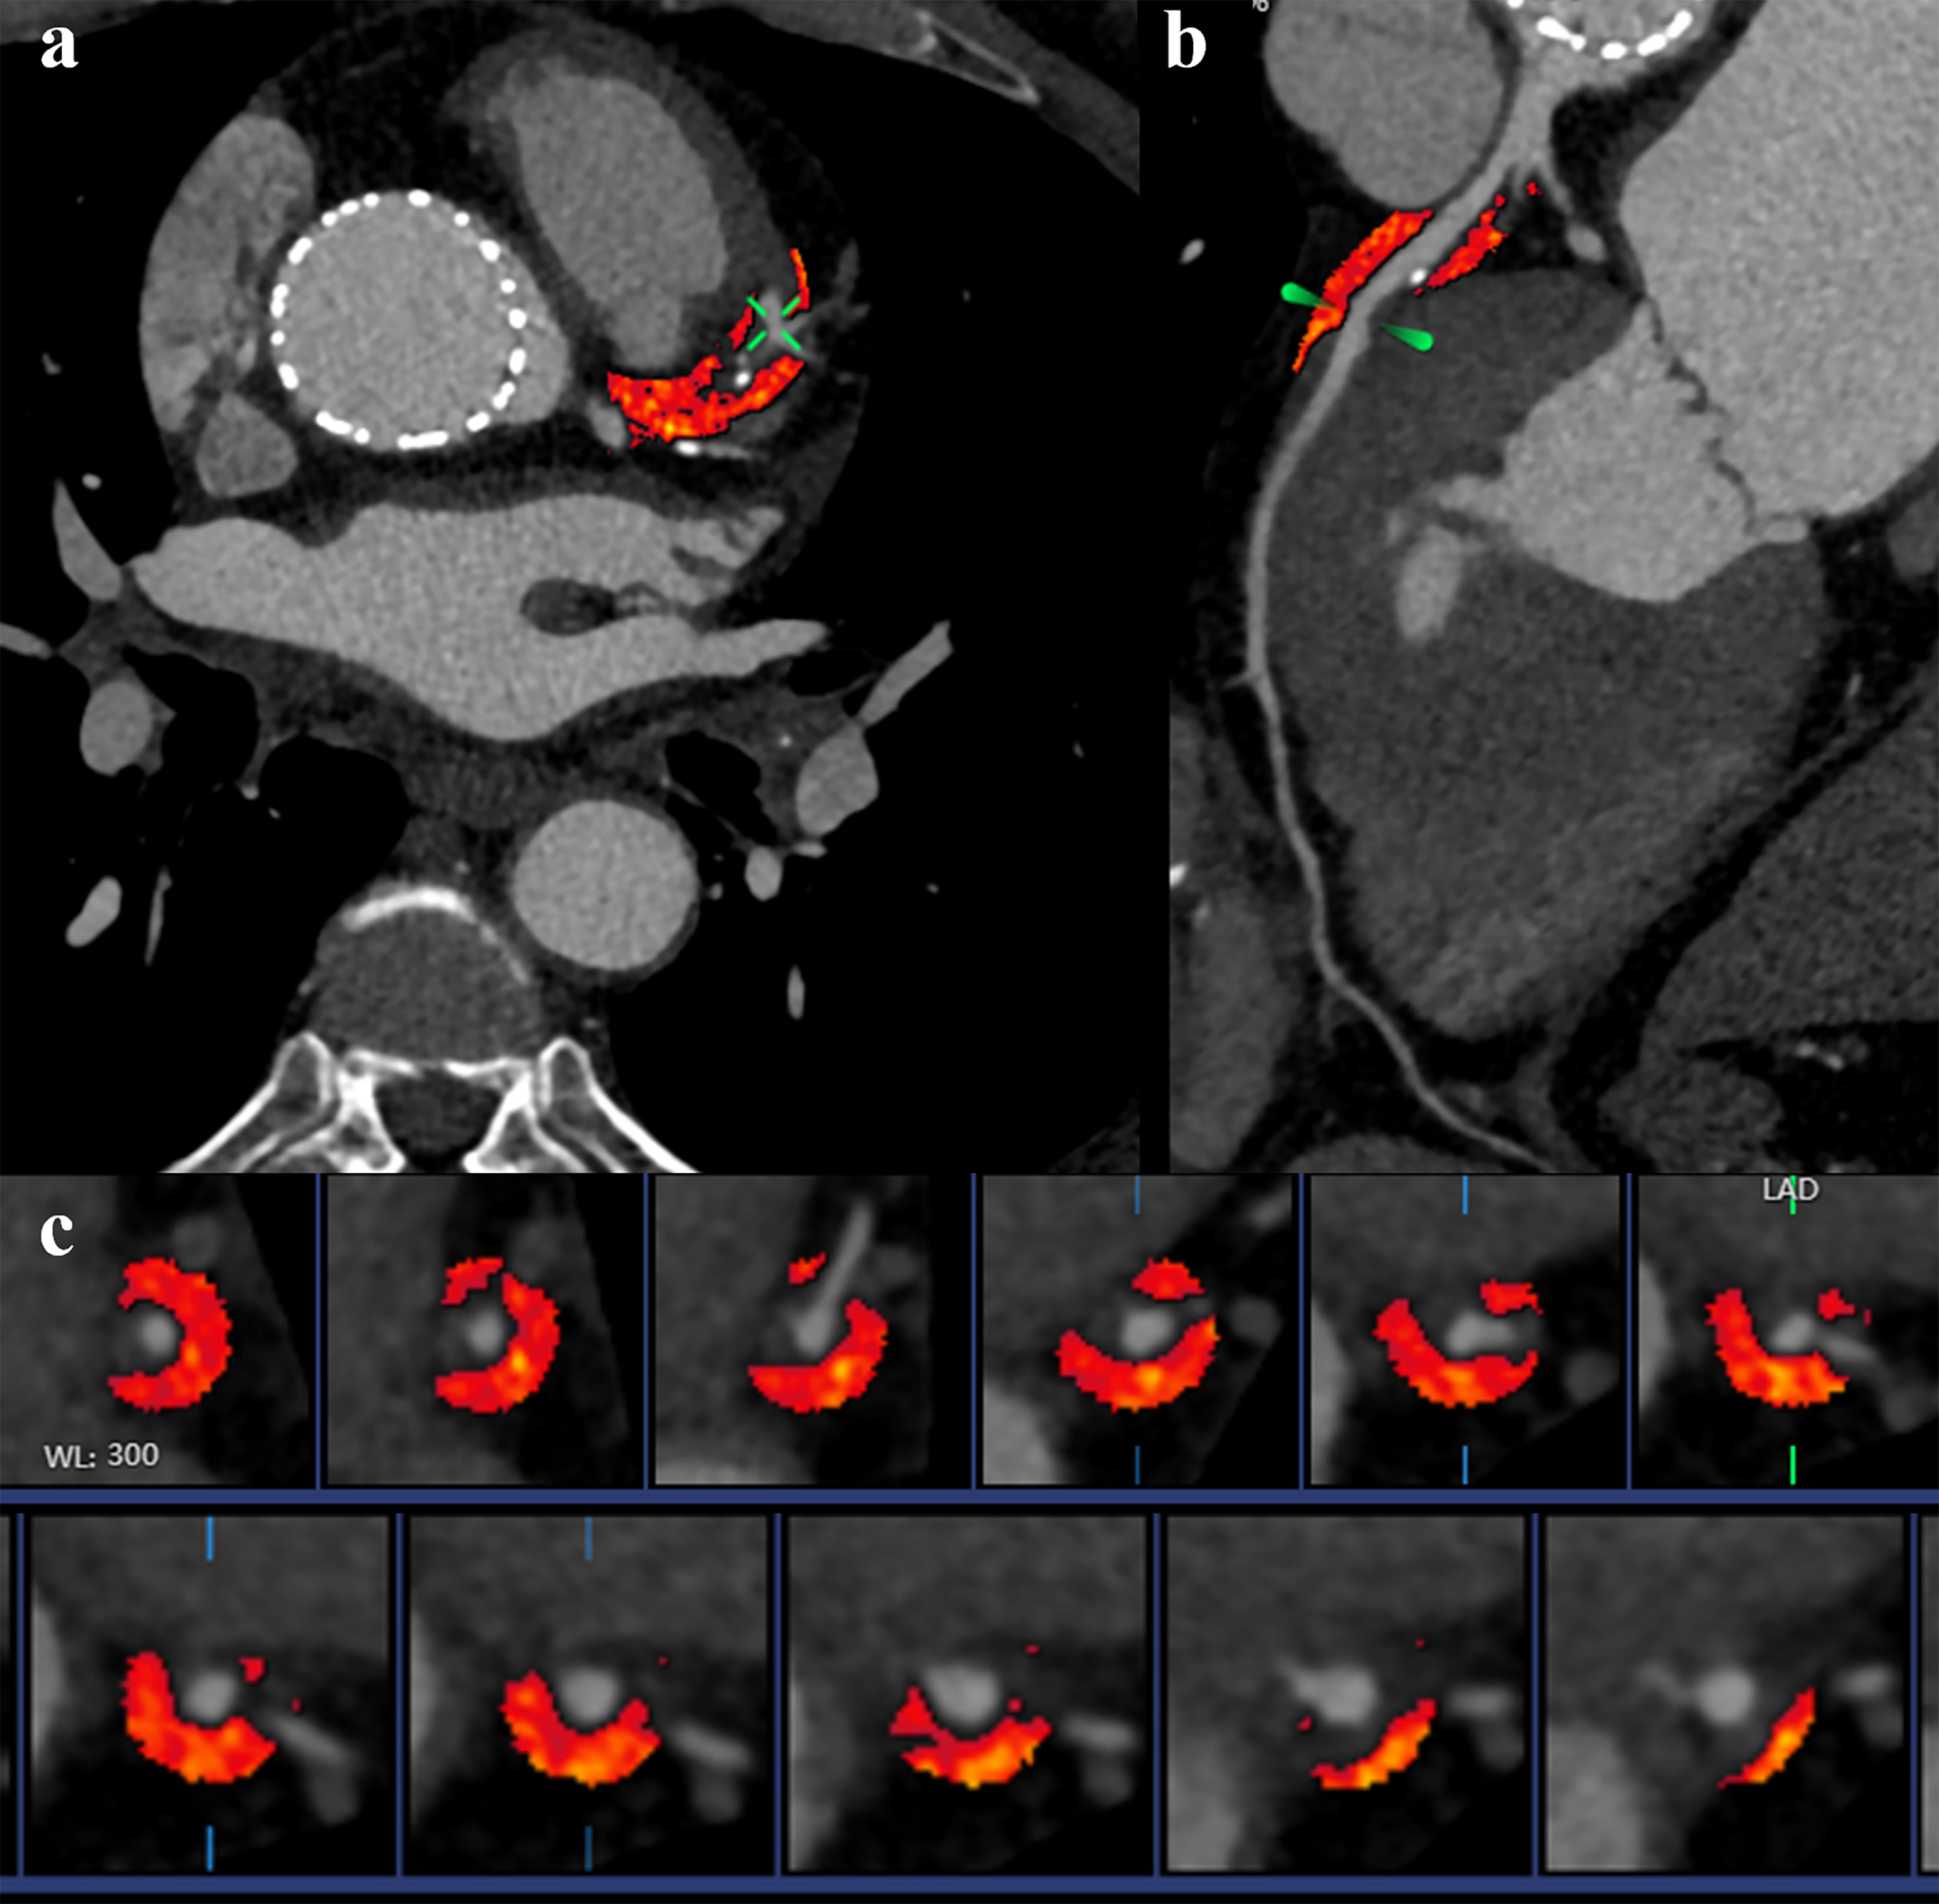 Fig. 4.
Representative examples of Pericoronary Adipose Tissue (PCAT) attenuation. The CCTA image from a 75-year-old male patient 3 months after TAVR. (a) PCAT surrounding left anterior descending in axial plane. (b) Curved reconstruction of the left anterior descending. (c) PCAT around left anterior descending (red area).
Statistical modeling results shown in Table 4 indicate that Model 2 represents a significant improvement over Model 1, with a C-index of 0.41 (p = 0.03) and an NRI of 0.24 (p = 0.02). Furthermore, Model 3 exhibited a marked enhancement in both the C-index (0.82, p = 0.01) and NRI (0.55, p = 0.01).
| Model | C-index (95% CI) | p-value | NRI (95% CI) | p-value |
| 1 | 0.23 (0.11, 0.37) | - | - | - |
| 2 | 0.41 (0.23, 0.57) | 0.03 | 0.24 (0.15, 0.29) | 0.02 |
| 3 | 0.82 (0.68, 0.95) | 0.01 | 0.55 (0.34, 0.78) | 0.01 |
Model 1: Traditional clinical risk model (Angina + NYHA + Aortic valve area + STJ average diameter).
Model 2: Traditional clinical risk model + Calcified valve.
Model 3: Traditional clinical risk model + Calcified + PCAT.
NRI, Net reclassification improvement; PCAT, Pericoronary adipose tissue; NYHA, New York Heart Association class.
This study found that measurement of PCAT attenuation by CCTA three months after TAVR could effectively predict MACE in patients with obstructive CAD. The key finding was that high PCAT attenuation was associated with a significantly increased risk of MACE, with a cutoff threshold of –67.5 HU demonstrating high sensitivity and specificity for predicting adverse outcomes. These results highlight the potential of PCAT attenuation appears to be a promising marker for risk stratification in this high-risk patient population.
The risk factors for AS overlap significantly with those for atherosclerosis,
explaining why
PCAT has emerged as a promising biomarker for assessing coronary inflammation and plaque stability [22]. With the increasing incidence of AS and subsequent rise in TAVR procedures, the need for reliable markers to predict postoperative outcomes in CAD patients is becoming more critical. The utility of PCAT in this context has been substantiated by numerous studies, including the Comprehensive Risk Prediction in Surgery (CRISP-CT) study, which underscores the ability of PCAT attenuation to predict mortality risk [23]. Furthermore, Elnabawi et al. [24] highlighted the versatility of PCAT by demonstrating its effectiveness in tracking therapeutic responses in CAD, thus expanding its application beyond mere prognostication [25].
The role of PCAT has assumed greater significance in the post-TAVR landscape, with the procedure itself capable of inducing biological and physical stresses on the coronary vessels. This is particularly evident in the hemodynamic changes brought about by the newly implanted aortic valve, which directly influence myocardial oxygen supply and demand [26]. In the case of a prosthesis-patient mismatch or suboptimal deployment of the valve, the anticipated alleviation of myocardial ischemia may not be fully realized. Such instances can lead to inadequate coronary perfusion, especially in patients with existing CAD [27]. Moreover, the postoperative phase can invoke systemic inflammatory responses, potentially accelerating the progression of atherosclerosis and contributing to plaque vulnerability [28, 29]. Collectively, these factors have significant implications for the long-term cardiac prognosis of CAD patients post-TAVR.
Currently, there is significant debate regarding prognostic markers for CAD combined with AS after TAVR. Examples of such markers include the Duke Myocardial Jeopardy Score (DMJS) and the QCA-derived SYNTAX Score (SS), both of which are based on invasive angiography [30, 31]. However, these scoring systems were developed based on CAD patients without consideration of the overall impact on the heart when AS is also present. Spatial changes in PCAT attenuation in CCTA images can reflect changes in the entire heart after TAVR. Our study found that PCAT attenuation levels were notably higher in patients who suffered a MACE. The elevated attenuation reflects a heightened inflammatory state within the coronary vasculature, which is detectable and quantifiable through CCTA. After adding PCAT as a predictor, the C-index and IDI of conventional clinical models increased by 0.82 and 55%, respectively. Interestingly, we also found that revascularization in CAD patients does not influence PCAT attenuation. This relationship persisted irrespective of whether patients had undergone revascularization procedures, underscoring the robustness of PCAT as an independent prognostic tool.
Our study has several limitations. Firstly, as this retrospective study derived the PCAT threshold from a single-center cohort and the same study population, the results lack external validation and may overestimate real-world performance. Thus, future multicenter studies with large sample sizes are needed to confirm the generalizability of these findings. Since this study focused on CAD patients post-TAVR, the applicability of our findings to other populations, such as patients with acute coronary syndrome or prior revascularization, remains to be determined. The median follow-up of 1.5 years may not be sufficient to fully capture long-term events, and insufficient time may have elapsed for patients with shorter follow-up to experience late complications. Furthermore, PCAT attenuation was measured three months post-TAVR, thus excluding patients with early events and introducing potential immortal time bias that could overestimate the prognostic value of PCAT. Studies with longer follow-up times are needed to confirm the sustained predictive ability of PCAT post-TAVR.
In conclusion, the ability of PCAT to serve as a non-invasive, quantifiable marker of coronary inflammation makes it a promising candidate for predicting the outcome of obstructive CAD following TAVR. The sensitivity of PCAT to changes in the inflammatory state and its correlation with clinical outcomes highlight its superiority and potential as a standard component of post-TAVR patient assessment.
The datasets used and analyzed during the current study are available from the corresponding author on reasonable request.
TTH and JZS contributed to the study design, statistical analysis and reviewing it critically for important intellectual content. SXL and XHW wrote the original draft and contributed to image analysis and reviewed the manuscript for important intellectual content. XFD provided scientific direction and made substantial contributions to the study conception and design, as well as to writing and revising the manuscript. JZS coordinated the collection of clinical data and CT scans and use and commissioning of frontier for Syngovia. All authors read and approved the final manuscript. All authors have participated sufficiently in the work and agreed to be accountable for all aspects of the work.
This study was conducted in accordance with the principles of the Declaration of Helsinki and was approved by the Human Research Ethics Committee of the Second Affiliated Hospital, Zhejiang University School of Medicine (Approval No: I2024025). Given the retrospective nature of the study, the Ethics Committee waived the requirement for written informed consent. All patient data were anonymized and handled confidentially in compliance with institutional and national ethical standards.
The authors thank each of the study subjects for their participation.
This study has received funding by The Medical Science and Technology Project of Zhejiang Province, China (Grant Numbers 2021KY393) and The National Key Research and Development Program of China (grant No. 2018YFE0198400).
The authors declare no conflict of interest.
References
Publisher’s Note: IMR Press stays neutral with regard to jurisdictional claims in published maps and institutional affiliations.