


 , Huiling Liu 3,†, Xiaoping Cai 3, Yue Zhang 1, Tong Liu 1, Guangping Li 1, Kangyin Chen 1,*
 , Meng Yuan 1,*
1 Tianjin Key Laboratory of Ionic-Molecular Function of Cardiovascular Disease, Department of Cardiology, Tianjin Institute of Cardiology, The Second Hospital of Tianjin Medical University, 300211 Tianjin, China
2 Department of Cardiology, Binzhou People’s Hospital, 256600 Binzhou, Shandong, China
3 Department of Radiation Oncology, Binzhou People’s Hospital, 256600 Binzhou, Shandong, China
†These authors contributed equally.
Abstract
Chronic inflammation critically influences atherosclerotic progression and plaque destabilization. This investigation assessed and compared six lymphocyte-derived inflammatory indices (neutrophil-to-lymphocyte ratio (NLR), monocyte–lymphocyte ratio (MLR), platelet–lymphocyte ratio (PLR), systemic immune–inflammation index (SII), systemic inflammatory response index (SIRI), systemic immune–inflammation response index (SIIRI)) for predicting major adverse cardiovascular events (MACEs) in treatment-naïve acute coronary syndrome (ACS) patients undergoing coronary angiography.
This study enrolled 1120 patients with newly diagnosed ACS, in which the occurrence of MACEs was monitored. The predictive capacities of the included lymphocyte-derived inflammatory indices were evaluated through receiver operator characteristic (ROC) curve analysis with optimal cutoffs, supplemented by Cox proportional hazards modeling.
A total of 265 MACEs (23.66%) were recorded during the 64.20 ± 23.05-month follow-up. Multivariate Cox analyses identified an elevated MLR (hazard ratio (HR) = 2.880, 95% confidence interval (CI) 1.280–6.470; p < 0.001) that was independently associated with the occurrence of MACEs in patients with newly diagnosed ACS. The ROC comparisons revealed a superior discriminative capacity of the MLR versus clinical factors, with an optimal MLR cutoff at 0.304 (sensitivity 61.1%; specificity 78.8%). Patients with a high MLR (≥0.304) exhibited a 3.5-fold increased risk of MACEs compared to those with a low MLR (46.96% vs. 13.29%; risk ratio = 1.635, 95% CI 1.475–1.812; p < 0.001); these data were corroborated by divergent Kaplan–Meier curves (log-rank p < 0.001). Meanwhile, subgroup analyses confirmed the prognostic consistency of the MLR across high-risk populations (age >60 years, diabetes, hypertension), with elevated MLR subgroups demonstrating uniformly higher rates of MACEs (all p < 0.001).
MLR outperformed conventional parameters and five novel lymphocyte-based inflammatory indices in predicting MACEs in ACS patients; thus, the MLR can be established as a robust predictive biomarker. The clinical utility of the MLR extends to risk stratification across key patient subgroups, suggesting potential integration into routine cardiovascular risk assessment protocols.
Keywords
- acute coronary syndrome
- major adverse cardiovascular events
- novel inflammatory markers
- prognosis
- monocyte-lymphocyte ratio
Coronary heart disease (CHD) is the leading cause of mortality and morbidity worldwide [1]. Acute coronary syndrome (ACS) is one of the most severe manifestations of CHD [2]. ACS is characterized by acute myocardial ischemia because of the formation of intracoronary thrombi due to the rupture or erosion of unstable atherosclerotic plaques, and encompasses unstable angina (UA), ST-segment elevation myocardial infarction (STEMI), and non-ST-segment elevation myocardial infarction (NSTEMI) [3, 4]. Despite advances in revascularization techniques such as percutaneous coronary intervention (PCI), the prognosis of patients with ACS remains poor and unsatisfactory [5, 6]. Furthermore, the incidence rates of ACS in China have consistently increased over the past few decades [7]. Therefore, identifying risk factors associated with an adverse prognosis in patients with ACS is of paramount importance to identify patients at higher risk and to delineate personalized therapeutic strategies.
Inflammation is an important feature in all stages of atherosclerosis, including
acute thrombotic complications and clinical events [8]. Inflammation is pivotal
in the development and instability of the coronary plaques and contributes
significantly to plaque rupture. Coronary plaques contain activated macrophages,
which promote plaque rupture, arterial wall thrombosis, and vessel constriction
[9]. Interleukin (IL)-17 is a pro-inflammatory cytokine that exerts a significant
influence on atherosclerosis and ACS [10]. More than half of the patients with
atherosclerotic cardiovascular disease are associated with systemic inflammation.
The incidences of major adverse cardiovascular events (MACEs), heart failure
(HF), and mortality increase significantly when the C-reactive protein (CRP)
levels are
In this study, we compared the prognostic values of six different inflammatory markers to identify indicators that can precisely predict MACEs in patients with newly diagnosed ACS. The aim was to identify the best inflammatory indicator that can be used for clinical monitoring and strategizing personalized treatment plans for patients with ACS to improve their prognosis and quality of life.
We retrospectively enrolled 1120 newly diagnosed ACS patients who underwent
primary coronary angiography and were diagnosed with ACS at our hospital from
August 2018 to December 2020. All ACS patients underwent diagnostic coronary
angiography, and PCI was determined based on the degree of coronary artery
stenosis. The inclusion criteria were as follows: (1) ACS diagnosis according to
the published 2023 ESC guidelines [23]; (2) 18 years old or older; and (3)
availability of complete clinical data from the electronic medical records. The
exclusion criteria were as follows: (1) active tumor or paraneoplastic syndrome;
(2) acute infection; (3) severe renal insufficiency (estimated glomerular
filtration rate
 Fig. 1.
Flowchart of the study cohort. Abbreviations: ACS, acute coronary syndrome; UA, unstable angina; STEMI, ST-segment elevation myocardial infarction; NSTEMI, non-ST-segment elevation myocardial infarction.
We collected baseline clinical data, laboratory test results, and coronary
angiography findings from the electronic medical records. The basic clinical
information of the patients included age, gender, smoking history, diabetes
mellitus, hypertension, dyslipidemia, atrial fibrillation (AF), and family
history of coronary heart disease. Laboratory examinations before diagnostic
coronary angiography included complete blood cell counts, blood glucose, total
cholesterol, low-density lipoprotein (LDL), high-density lipoprotein (HDL),
triglyceride, serum creatinine, glomerular filtration rate, and other biochemical
tests. The basic coronary angiography data included lesion status of the left
main coronary artery, right coronary artery, left anterior descending artery, and
left circumflex artery. To assess the systemic inflammatory biomarkers, six
hematological indices were calculated based on differential complete blood cell
counts. The NLR was calculated by dividing the absolute neutrophil counts by the
absolute lymphocyte counts. The PLR was calculated by dividing the platelet
counts by the absolute lymphocyte counts. The MLR was calculated by dividing the
absolute monocyte counts by the absolute lymphocyte counts. The three composite
indices were formulated as follows: SII = platelet counts
Patients were scheduled for follow-up assessments every six months after hospital discharge. The follow-up was mainly carried out through telephone, outpatient review, or inpatient observation, with a primary focus on documenting MACEs, including non-fatal myocardial infarction, non-fatal stroke, all-cause mortality, UA, and HF. The observation period continued until the occurrence of the first MACEs or the predetermined study termination date of January 31, 2025, whichever occurred first.
Continuous variables were presented as mean
This study included 1120 newly diagnosed ACS patients with a mean age of 61.67
| ALL (N = 1120) | No such event (N = 855) | MACEs (N = 265) | p-value | |||
| Diagnosis | 78.462 | |||||
| UA, n (%) | 548 (48.92) | 480 (56.14) | 68 (25.66) | |||
| STEMI, n (%) | 385 (34.38) | 261 (30.53) | 124 (46.79) | |||
| NSTEMI, n (%) | 187 (16.70) | 114 (13.33) | 73 (27.55) | |||
| Age (years) | 63 (54, 70) | 63 (54, 69) | 65 (56, 70) | –3.475 | 0.001 | |
| Male sex, n (%) | 716 (63.93) | 530 (61.90) | 186 (70.20) | 5.899 | 0.015 | |
| Diabetes mellitus, n (%) | 210 (18.75) | 140 (16.37) | 70 (26.42) | 13.388 | ||
| Hypertension, n (%) | 633 (56.52) | 463 (54.15) | 170 (64.15) | 8.230 | 0.004 | |
| New diagnosis dyslipidemia, n (%) | 42 (3.75) | 34 (3.98) | 8 (3.02) | 0.514 | 0.473 | |
| Current smoker, n (%) | 363 (32.41) | 281 (32.87) | 82 (30.94) | 0.341 | 0.559 | |
| Current drinkers, n (%) | 128 (11.43) | 105 (12.28) | 23 (8.68) | 2.592 | 0.107 | |
| Stroke, n (%) | 92 (8.21) | 66 (7.72) | 26 (9.81) | 1.174 | 0.279 | |
| AF, n (%) | 18 (1.61) | 10 (1.17) | 8 (3.02) | 4.375 | 0.036 | |
| Family history of CAD, n (%) | 24 (2.14) | 18 (2.11) | 6 (2.26) | 0.024 | 0.876 | |
| Syncope, n (%) | 11 (0.98) | 5 (0.58) | 6 (2.26) | 5.867 | 0.015 | |
| Tumor, n (%) | 20 (1.79) | 16 (1.87) | 4 (1.51) | 0.151 | 0.698 | |
| Heart rate | 74 (66, 82) | 72 (65, 81) | 76 (68, 88) | –3.202 | 0.001 | |
| Systolic pressure | 140 (123, 156) | 141 (125, 157) | 136 (121, 156) | –1.957 | 0.050 | |
| Diastolic pressure | 85 (75, 95) | 85 (75, 94) | 85 (74, 96) | –0.111 | 0.911 | |
| Coronary lesion type | 33.800 | |||||
| Left main coronary artery disease, n (%) | 57 (5.09) | 36 (4.21) | 21 (7.92) | |||
| Polyvascular disease, n (%) | 627 (55.98) | 447 (52.28) | 180 (67.92) | |||
| Branch lesions, n (%) | 436 (38.93) | 372 (43.51) | 64 (24.15) | |||
| NLR | 2.64 (1.75, 4.20) | 2.42 (1.60, 3.50) | 4.21 (2.50, 8.10) | –11.043 | ||
| PLR | 129.38 (97.85, 169.72) | 124.26 (95.50, 160.30) | 147.37 (114.50, 205.90) | –6.998 | ||
| MLR | 0.24 (0.18, 0.33) | 0.22 (0.20, 0.30) | 0.35 (0.23, 0.52) | –11.943 | ||
| SII | 574.24 (380.78, 976.65) | 515.67 (355.40, 784.50) | 1077.58 (548.50, 1857.60) | –12.128 | ||
| SIRI | 1.08 (0.64, 2.05) | 0.92 (0.60, 1.50) | 2.50 (1.16, 4.73) | –13.582 | ||
| SIIRI | 235.95 (135.71, 462.70) | 195.53 (122.10, 342.50) | 628.46 (259.34, 1110.98) | –14.128 | ||
| Fasting blood glucose (mmol/L) | 5.73 (5.04, 7.02) | 5.59 (5.02, 6.69) | 6.05 (5.15, 7.81) | –4.343 | ||
| Urea nitrogen (mmol/L) | 4.87 (4.00, 5.90) | 4.75 (3.90, 5.71) | 5.20 (4.34, 6.40) | –4.632 | ||
| Creatinine (umol/L) | 68 (58, 79) | 67 (58, 78) | 72 (59, 82) | –2.597 | 0.009 | |
| Uric acid (umol/L) | 303 (246, 366) | 303 (247, 366) | 303 (246, 368) | –0.066 | 0.948 | |
| Albumin (g/L) | 43.10 (40.30, 45.92) | 43.50 (40.70, 46.01) | 42.07 (39.17, 45.40) | –3.781 | ||
| Total cholesterol (mmol/L) | 4.49 (3.81, 5.24) | 4.47 (3.79, 5.19) | 4.64 (3.88, 5.41) | –1.794 | 0.073 | |
| Triglycerides (mmol/L) | 1.44 (1.02, 2.02) | 1.47 (1.03, 2.04) | 1.38 (1.01, 1.92) | –1.306 | 0.192 | |
| High-density lipoprotein (mmol/L) | 1.10 (0.93, 1.30) | 1.11 (0.94, 1.30) | 1.09 (0.92, 1.28) | –1.082 | 0.279 | |
| Low-density lipoprotein (mmol/L) | 2.66 (2.07, 3.35) | 2.62 (2.03, 3.33) | 2.79 (2.19, 3.51) | –2.583 | 0.010 | |
| Lipoprotein (mg/dL) | 16.80 (8.25, 33.70) | 16.30 (8.00, 32.60) | 18.40 (9.00, 38.80) | –1.412 | 0.158 | |
Abbreviations: UA, unstable angina; STEMI, ST-segment elevation myocardial infarction; NSTEMI, non-ST-segment elevation myocardial infarction; AF, Atrial fibrillation; NLR, neutrophil-to-lymphocyte ratio; PLR, platelet-to-lymphocyte ratio; MLR, monocyte-to-lymphocyte ratio; SII, systemic immune-inflammation index; SIRI, systemic inflammation response index; SIIRI, systemic immune-inflammatory response index; MACEs, major adverse cardiovascular events.
We performed LASSO regression with 10-fold cross-validation on 33 candidate
variables. The optimal regularization parameter (
| Univariable Cox regression | Multivariable Cox regression | |||
| HR (95% CI) | p-value | HR (95% CI) | p-value | |
| Diagnosis | 1.870 (1.609–2.173) | 1.710 (1.445–2.024) | ||
| Age | 1.021 (1.009–1.033) | 0.001 | 1.012 (1.000–1.025) | 0.049 |
| Diabetes mellitus | 1.737 (1.322–2.284) | 1.576 (1.185–2.097) | 0.002 | |
| Hypertension | 1.456 (1.133–1.872) | 0.003 | 1.552 (1.200–2.011) | 0.001 |
| Tumor | 0.861 (0.321–2.312) | 0.766 | ||
| Atrial fibrillation | 2.004 (0.991–4.051) | 0.053 | 0.717 (0.340–1.510) | 0.382 |
| Syncope | 2.432 (1.082–5.465) | 0.026 | 1.306 (0.574–2.970) | 0.525 |
| Heart rate | 1.018 (1.010–1.026) | 1.000 (1.000–1.010) | 0.252 | |
| Coronary lesion type | 0.544 (0.442–0.669) | 0.702 (0.555–0.887) | 0.003 | |
| MLR | 15.473 (10.859–22.048) | 2.880 (1.280–6.470) | ||
| Creatinine | 1.006 (1.003–1.008) | 1.000 (1.000–1.010) | 0.415 | |
| High-density lipoprotein | 1.064 (1.025–1.105) | 1.060 (1.020–1.090) | 0.001 | |
| Low-density lipoprotein | 1.140 (1.031–1.260) | 0.011 | 1.130 (1.020–1.240) | 0.019 |
Abbreviations: HR, hazard ratio; CI, confidence interval; NLR, neutrophil-to-lymphocyte ratio; MLR, monocyte-to-lymphocyte ratio.
During a mean follow-up period of 64.20
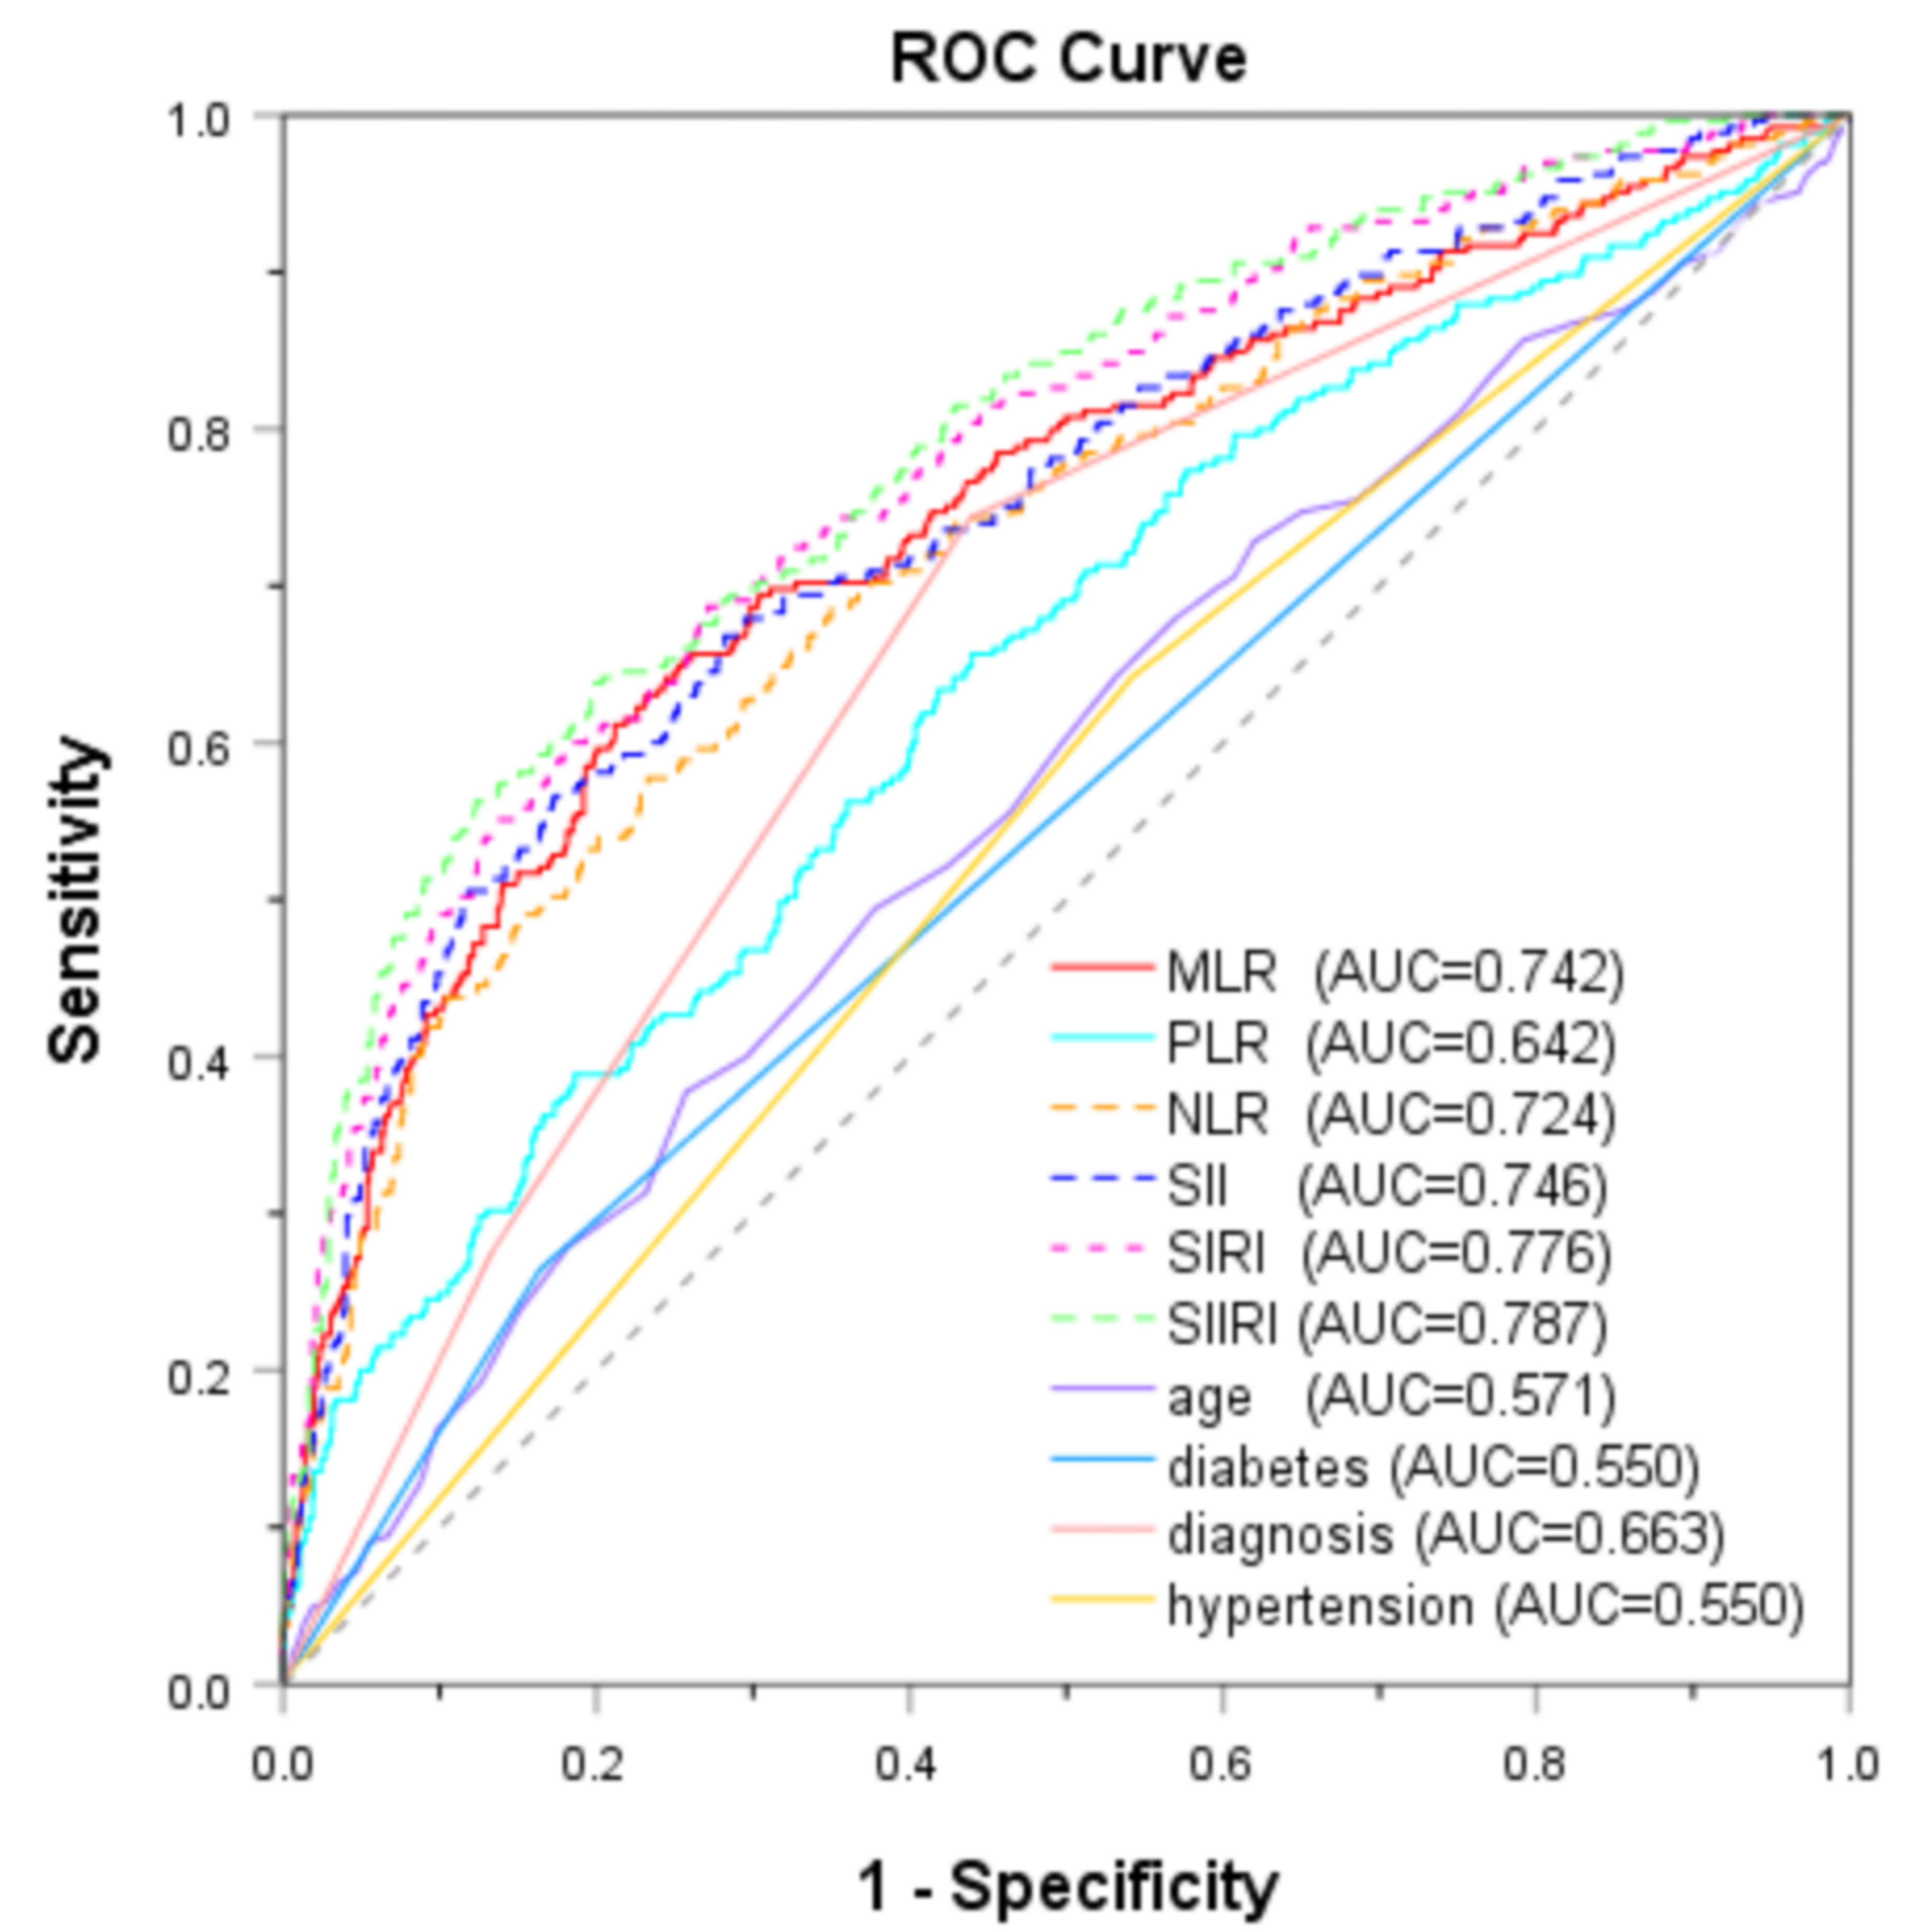 Fig. 2.
ROC curves of inflammatory biomarkers and clinical factors for predicting MACEs. ROC, receiver operator characteristic; MACEs, major adverse cardiovascular events; AUC, area under the curve; MLR, monocyte-to-lymphocyte ratio; PLR, platelet-to-lymphocyte ratio; NLR, neutrophil-to-lymphocyte ratio; SII, systemic immune-inflammation index; SIRI, systemic inflammation response index; SIIRI, systemic immune-inflammatory response index.
| ALL (N = 1120) | MLR |
MLR |
p-value | |||
| Diagnosis | 148.107 | |||||
| UA, n (%) | 548 (48.92) | 470 (60.65) | 78 (22.61) | |||
| STEMI, n (%) | 385 (34.38) | 189 (24.39) | 196 (56.81) | |||
| NSTEMI, n (%) | 187 (16.70) | 116 (14.97) | 71 (20.58) | |||
| Age (years) | 63 (54, 70) | 62 (54, 68) | 65 (55, 71) | –3.495 | ||
| Male sex, n (%) | 716 (63.93) | 455 (58.71) | 261 (75.65) | 29.717 | ||
| Diabetes mellitus, n (%) | 210 (18.75) | 152 (19.61) | 58 (16.81) | 0.317 | 0.574 | |
| Hypertension, n (%) | 633 (56.52) | 442 (57.03) | 191 (55.36) | 0.271 | 0.603 | |
| New diagnosis dyslipidemia, n (%) | 42 (3.75) | 35 (4.52) | 7 (2.03) | 4.091 | 0.043 | |
| Current smoker, n (%) | 363 (32.41) | 251 (32.39) | 112 (32.46) | 0.001 | 0.980 | |
| Current drinkers, n (%) | 128 (11.43) | 88 (11.35) | 40 (11.59) | 0.014 | 0.907 | |
| Stroke, n (%) | 92 (8.21) | 58 (7.48) | 34 (9.86) | 1.780 | 0.182 | |
| AF, n (%) | 18 (1.61) | 7 (0.90) | 11 (3.19) | 7.884 | 0.005 | |
| Family history of CAD, n (%) | 24 (2.14) | 17 (2.19) | 7 (2.03) | 0.031 | 0.861 | |
| Syncope | 11 (0.98) | 5 (0.65) | 6 (1.74) | 2.938 | 0.087 | |
| Tumor | 20 (1.79) | 18 (2.32) | 2 (0.58) | 4.135 | 0.042 | |
| Heart rate | 74 (66, 82) | 72 (65, 80) | 76 (67, 86) | –7.037 | ||
| Systolic pressure | 140 (123, 156) | 143 (128, 159) | 130 (117, 150) | –7.014 | ||
| Diastolic pressure | 85 (75, 95) | 86 (76, 95) | 83 (73, 93) | –2.646 | 0.008 | |
| Coronary artery disease | 13.856 | 0.001 | ||||
| Left main coronary artery disease, n (%) | 57 (5.09) | 40 (5.16) | 17 (4.93) | |||
| Polyvascular disease, n (%) | 627 (55.98) | 406 (52.39) | 221 (64.06) | |||
| Branch lesions, n (%) | 436 (38.93) | 329 (42.45) | 101 (31.01) | |||
| NLR | 2.64 (1.75, 4.20) | 2.14 (1.50, 2.80) | 5.14 (3.40, 8.30) | –20.999 | ||
| PLR | 129.38 (97.85, 169.72) | 115.06 (92.50, 146.80) | 163.25 (131.00, 228.30) | –13.546 | ||
| MLR | 0.24 (0.18, 0.33) | 0.20 (0.16, 0.24) | 0.41 (0.34, 0.55) | –26.750 | ||
| SII | 574.24 (380.78, 976.65) | 459.72 (334.20, 666.00) | 1089.26 (730.50, 1807.70) | –19.006 | ||
| SIRI | 1.08 (0.64, 2.05) | 0.77 (0.50, 1.20) | 2.83 (1.90, 4.70) | –24.155 | ||
| SIIRI | 235.95 (135.71, 462.70) | 168.77 (114.20, 272.20) | 663.56 (387.60, 1077.30) | –22.124 | ||
| Fasting blood glucose (mmol/L) | 5.73 (5.04, 7.02) | 5.61 (5.03, 6.82) | 5.91 (5.05, 7.35) | –2.210 | 0.027 | |
| Urea_nitrogen (mmol/L) | 4.87 (4.00, 5.90) | 4.71 (3.90, 5.70) | 5.10 (4.20, 6.37) | –3.660 | ||
| Creatinine (umol/L) | 68 (58, 79) | 67 (57, 77) | 72 (62, 82) | –4.893 | ||
| Uric_acid (umol/L) | 303 (246, 366) | 302 (246, 365) | 310 (248, 372) | –0.471 | 0.637 | |
| Albumin (g/L) | 43.10 (40.30, 45.92) | 43.61 (41.00, 46.30) | 41.70 (38.90, 44.30) | –6.915 | ||
| Total cholesterol (mmol/L) | 4.49 (3.81, 5.24) | 4.52 (3.89, 5.28) | 4.43 (3.73, 5.13) | –2.235 | 0.025 | |
| Triglycerides (mmol/L) | 1.44 (1.02, 2.02) | 1.51 (1.05, 2.10) | 1.32 (0.97, 1.80) | –3.829 | ||
| High-density lipoprotein (mmol/L) | 1.10 (0.93, 1.30) | 1.11 (0.94, 1.30) | 1.08 (0.90, 1.30) | –1.727 | 0.084 | |
| Low-density lipoprotein (mmol/L) | 2.66 (2.07, 3.35) | 2.69 (2.08, 3.38) | 2.63 (2.02, 3.26) | –1.181 | 0.238 | |
| Lipoprotein (mg/dL) | 16.80 (8.25, 33.70) | 16.60 (7.80, 34.20) | 17.60 (9.15, 32.95) | –1.022 | 0.307 | |
| MACEs | 265 (23.66) | 103 (13.29) | 162 (46.96) | 149.801 | ||
Abbreviations: UA, unstable angina; STEMI, ST-segment elevation myocardial infarction; NSTEMI, non-ST-segment elevation myocardial infarction; AF, Atrial fibrillation; NLR, neutrophil-to-lymphocyte ratio; PLR, platelet-to-lymphocyte ratio; MLR, monocyte-to-lymphocyte ratio; SII, systemic immune-inflammation index; SIRI, systemic inflammation response index; SIIRI, systemic immune-inflammatory response index; MACEs, major adverse cardiovascular events; CAD, coronary artery disease.
| Model | Cut-off value | p-value | AUC (95% CI) | SEN | SPE | PPV | NPV |
| Age | 68 years | 0.002 | 0.571 (0.530–0.611) | 0.377 | 0.743 | 0.313 | 0.794 |
| Age | 65 years | 0.009 | 0.558 (0.529–0.588) | 0.494 | 0.622 | 0.289 | 0.799 |
| Hypertension | Yes | 0.007 | 0.550 (0.511–0.589) | 0.642 | 0.458 | 0.269 | 0.805 |
| Diagnosis | MI | 0.663 (0.635–0.691) | 0.743 | 0.561 | 0.344 | 0.876 | |
| Diabetes mellitus | Yes | 0.026 | 0.550 (0.509–0.591) | 0.264 | 0.836 | 0.333 | 0.786 |
| MLR | 0.304 | 0.742 (0.705–0.779) | 0.611 | 0.788 | 0.470 | 0.867 | |
| HDL | 1.15 mmol/L | 0.283 | 0.522 (0.492–0.552) | 0.646 | 0.423 | 0.259 | 0.796 |
| LDL | 2.73 mmol/L | 0.009 | 0.552 (0.523–0.582) | 0.543 | 0.552 | 0.273 | 0.796 |
Abbreviations: AUC, area under the curve; CI, confidence interval; SEN, Sensitivity; SPE, Specificity; PPV, positive predictive value; NPV, negative predictive value; MI, myocardial infarction; MLR, monocyte-to-lymphocyte ratio; PLR, platelet-to-lymphocyte ratio; HDL, High-density lipoprotein; LDL, Low-density lipoprotein.
As shown in Table 3, patients in the high-MLR group demonstrated a significantly
higher incidence of MACEs compared to the low-MLR group (46.96% vs. 13.29%;
risk ratio 1.635, 95% CI 1.475–1.812, p
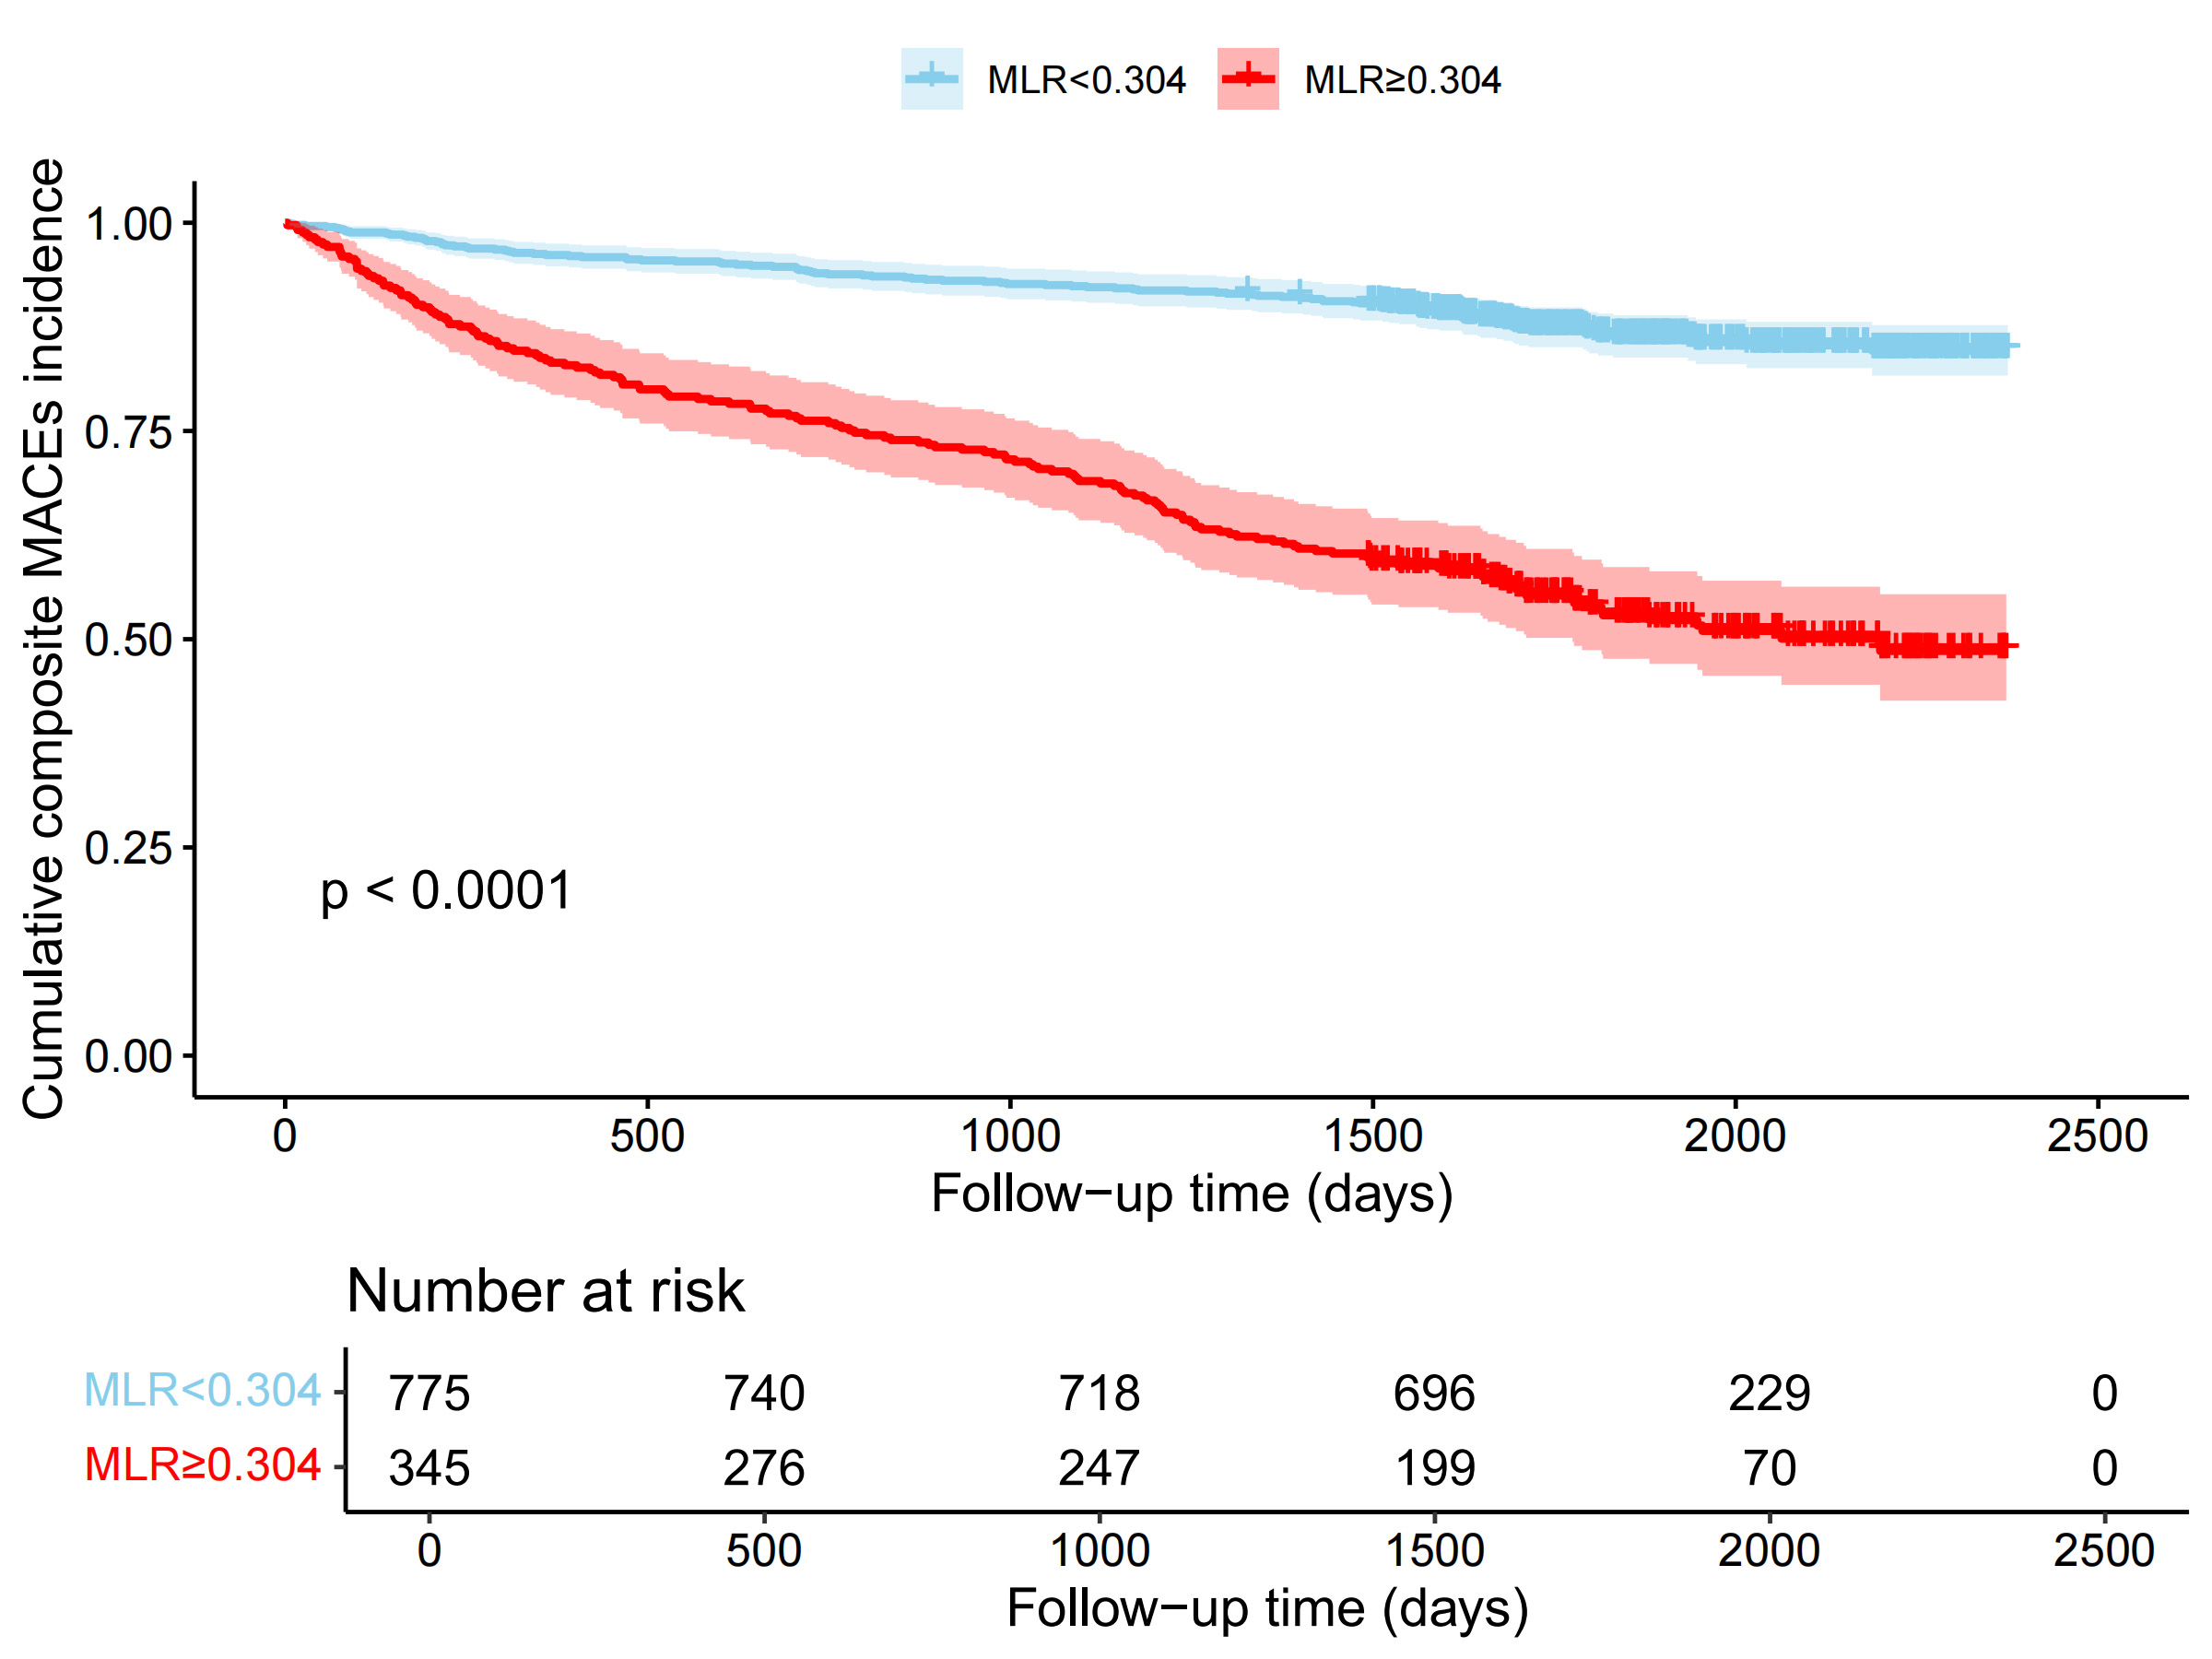 Fig. 3.
Kaplan-Meier survival curve analysis of patients with ACS stratified according to MLR. MLR, monocyte-lymphocyte ratio.
Compared with the low-MLR group, the high-MLR group showed a higher cumulative
incidence of UA (Fig. 4A), STEMI (Fig. 4B), NSTEMI (Fig. 4C), left main coronary
artery disease (Fig. 4D), poly-vascular disease (Fig. 4E), branch lesions (Fig. 4F), hypertension (Fig. 4G), diabetes mellitus (Fig. 4H), and elderly patients
(Fig. 4I) (all log-rank p
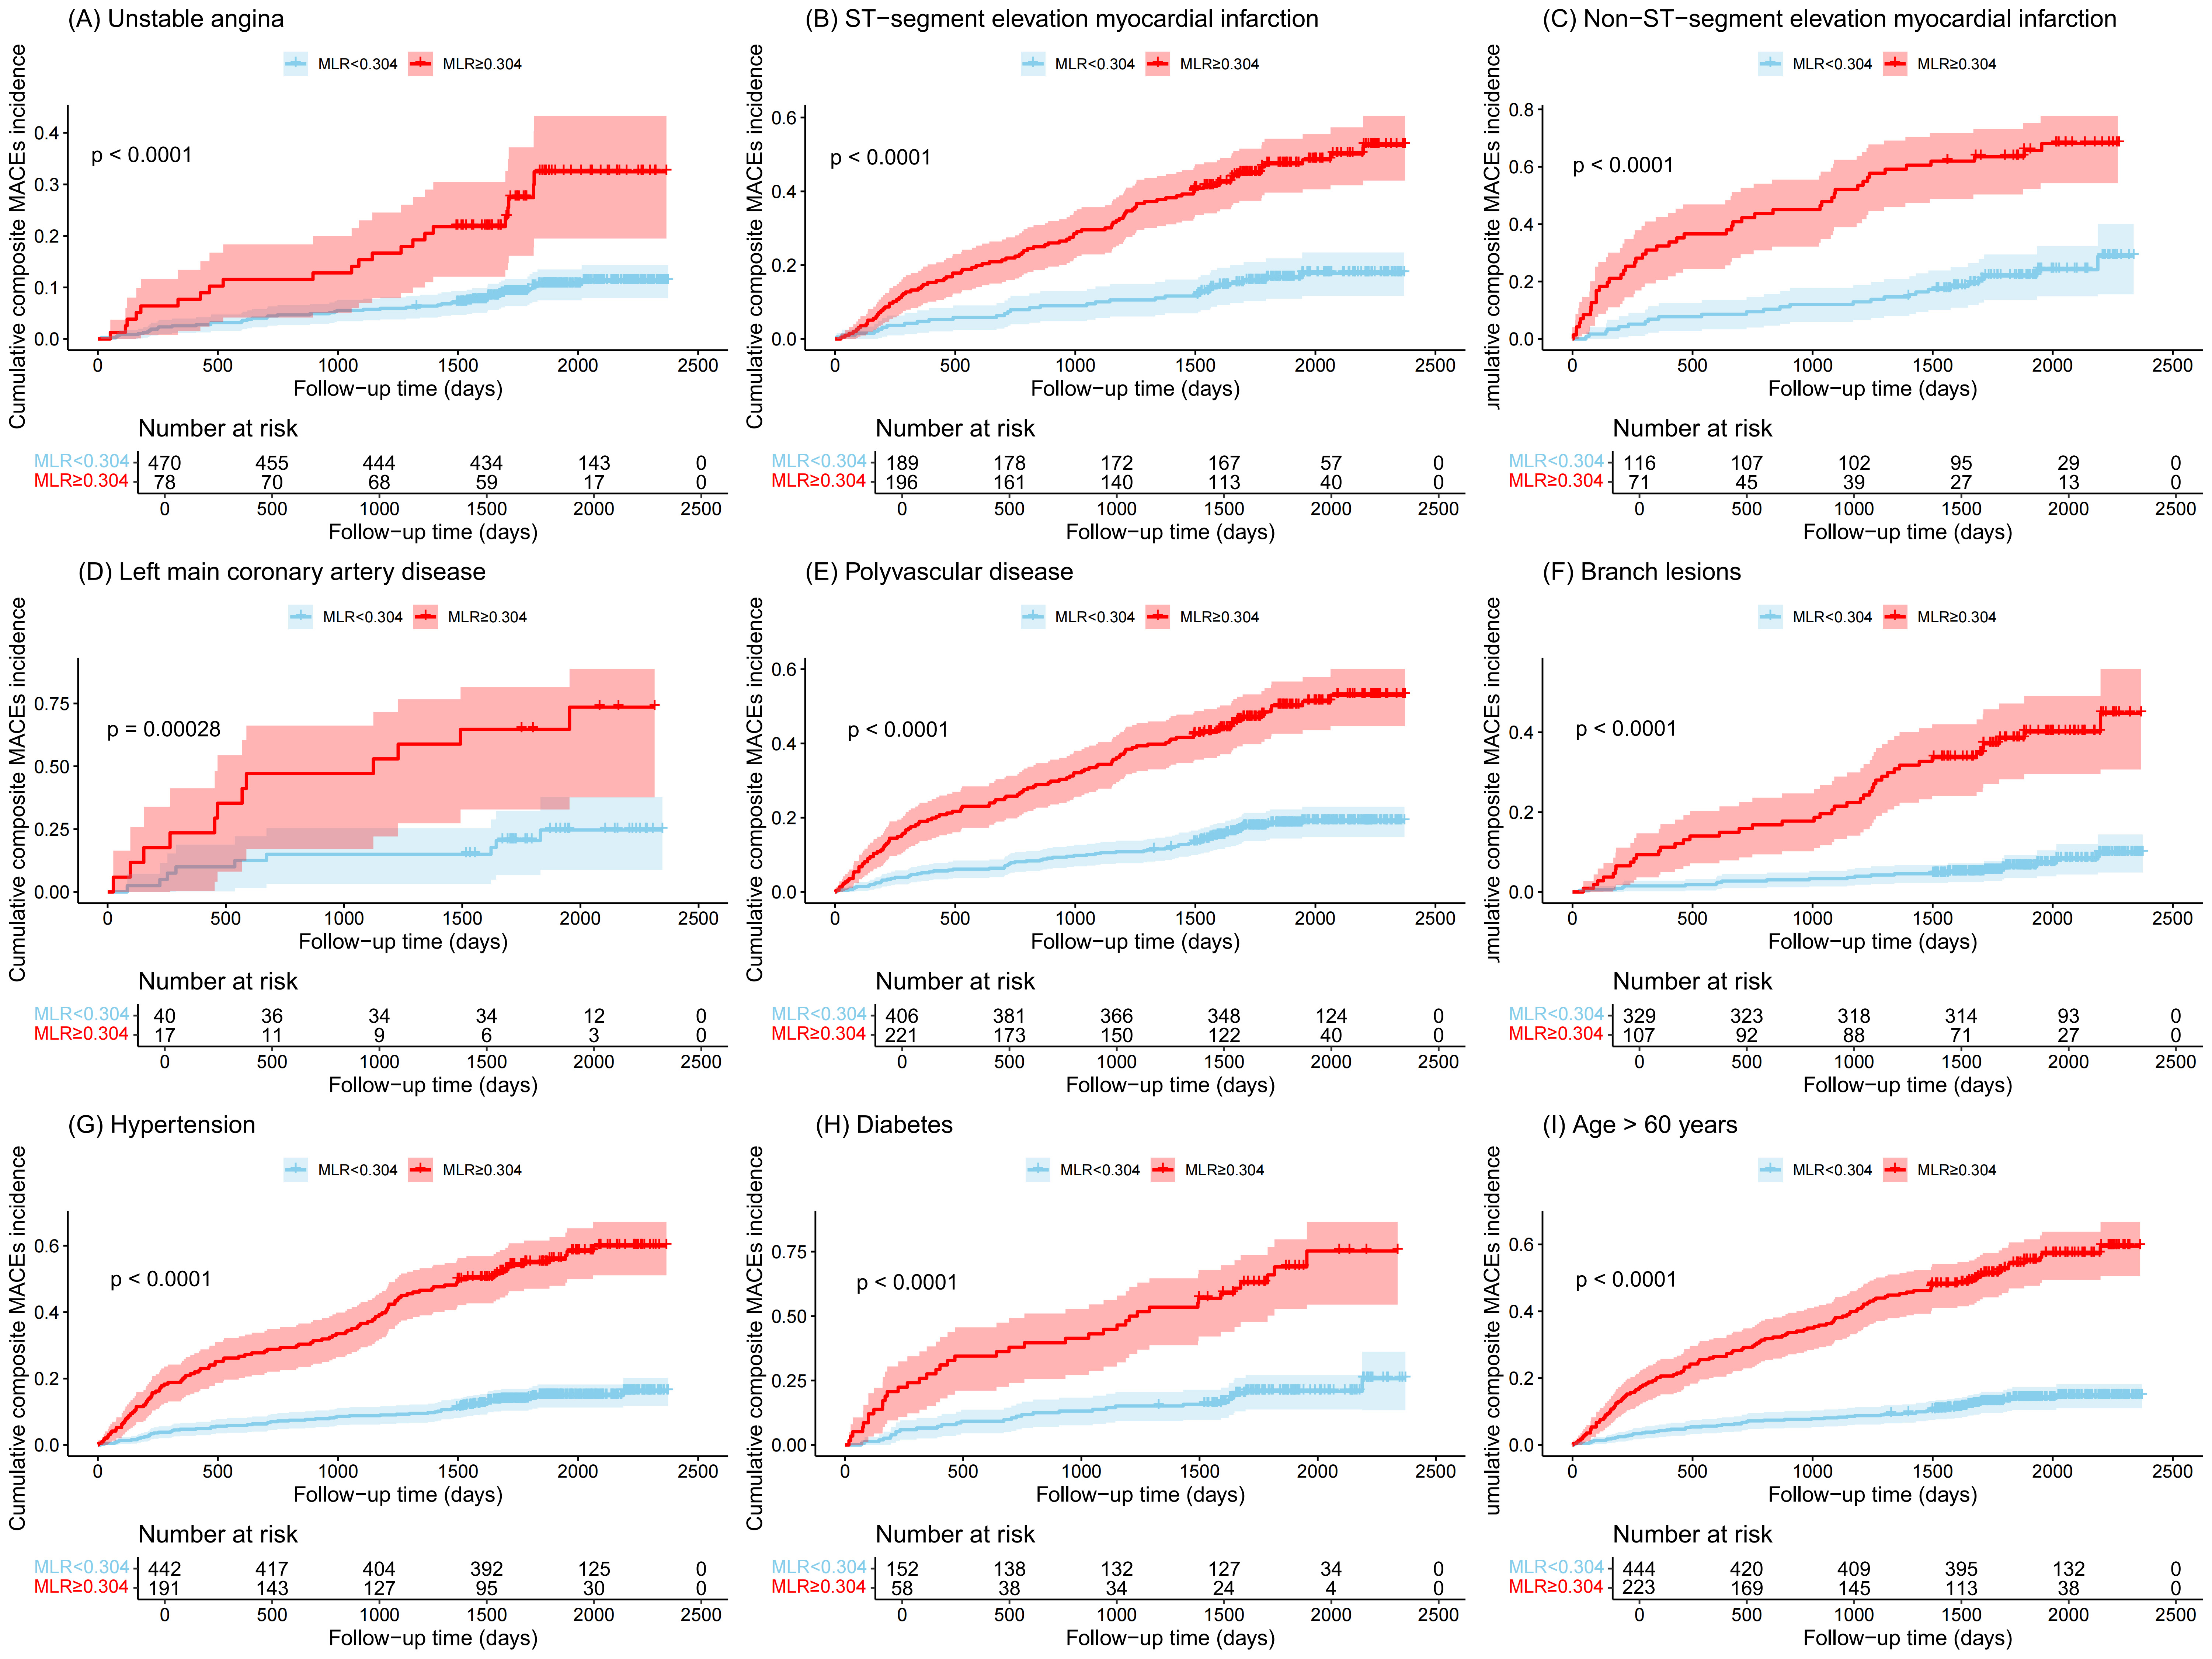 Fig. 4.
Cumulative incidences (%) of MACEs stratified by clinical
characteristics. (A) Unstable angina. (B) ST-segment elevation myocardial
infarction. (C) Non-ST-segment elevation myocardial infarction. (D) Left main
coronary artery disease. (E) Polyvascular disease. (F) Branch lesions. (G)
Hypertension. (H) Diabetes. (I) Age
In this study, we assessed the prognostic value of six novel identified
lymphocyte-derived inflammatory indices and multiple traditional clinical
characteristics in predicting MACEs in newly diagnosed ACS patients. Among these
inflammatory indices based on blood cell analysis, the MLR
Current pathophysiological theories of coronary artery disease encompass inflammatory cascades, lipid plaque formation, platelet activation, and vascular injury responses [24, 25]. Previous studies have demonstrated that elevated heart rate serves as a critical determinant of adverse clinical outcomes in ACS patients undergoing PCI [26]. Our investigation revealed that both elevated heart rate and systolic blood pressure emerged as significant clinical correlates of MACEs in ACS patients. However, multivariate analysis demonstrated that neither parameter maintained independent predictive value for MACEs occurrence following comprehensive adjustment for established cardiovascular risk factors. The underlying reason might be related to the fact that sustained tachycardia and hypertension can cause damage to arterial endothelial cells. Specifically, at curved or bifurcated arteries, blood flow patterns characterized by oscillatory shear stress promote endothelial transformation into a pro-inflammatory phenotype [27]. This transformation increases cellular inflammation, oxidative stress response, metabolic abnormalities, and endothelial permeability, thereby promoting the occurrence and progression of atherosclerosis [28]. Histopathological analysis of atherosclerotic coronary arteries has revealed that unstable plaques are histologically characterized by infiltration of macrophages, lymphocytes, and mast cells [29]. Notably, activated platelets not only recruit leukocytes but also regulate monocyte migration and subsequent differentiation into macrophages. Atherosclerosis, recognized as a chronic inflammatory disease, progresses through a pathological continuum spanning from endothelial injury, inflammatory cell recruitment, and lipid deposition to eventual plaque rupture. Throughout this disease progression, multiple leukocyte subtypes-including monocytes, neutrophils, and lymphocytes-are actively involved in mediating these pathophysiological transitions [30, 31]. This mechanistic pathway may explain the observed associations between the inflammatory index based on blood cell analysis and adverse outcomes in our cohort study.
Like previous reports [3, 32], older age, hypertension, and diabetes are also
risk factors for poor prognosis of ACS. Our study revealed that among ACS
patients with advanced age or comorbid diabetes/hypertension, the high-MLR cohort
demonstrated significantly elevated MACE incidence compared to their counterparts
without these comorbidities. Particularly in three clinically relevant subgroups—geriatric patients (age
The immunopathological cascade critically orchestrates atherosclerotic lesion
formation and progression, wherein monocytes and lymphocytes emerge as principal
mediators of inflammatory pathogenesis. The MLR, calculated from monocytes and
lymphocytes, is effective in identifying the presence of vulnerable plaques in
ACS patients [44]. Song et al. [15] included MLR in the inflammatory
prognostic score and reported that a higher score was closely associated with
poorer long-term prognosis in patients with ACS undergoing PCI. However, Shumilah
et al. [45] reported that NLR was the strongest predictor of ACS (p
Tanimura et al. [46] demonstrated that a history of cancer in ACS
patients was independently associated with worse clinical outcomes, including
MACEs, compared to those without a cancer history (odds ratio: 4.00, p
Our findings are also in agreement with the results of previously published meta-analyses, which reported significant associations between AF and adverse outcomes in patients with ACS [50, 51]. Current evidence indicates that AF pathogenesis originates from inflammation-mediated myocardial necrosis and fibrotic remodeling [52]. Mechanistically, these structural alterations induce electrophysiological instability through inflammation-induced membrane potential destabilization, which directly facilitates ectopic impulse generation that disrupts the normal rhythm of the heart [53, 54]. Because of the intrinsic pathophysiological interplay between AF and systemic inflammation, AF did not show independent prognostic significance in the multivariable analysis (HR 0.645, 95% CI 0.277–1.503, p = 0.309). This suggested that the predictive value of AF may be mediated through inflammatory pathways rather than AF functioning as an autonomous risk determinant. However, Saleh et al. [51] suggested that AF served as an independent prognostic indicator for predicting adverse outcomes in ACS patients. This discrepancy may be caused by our study only including newly diagnosed ACS patients, of which only 1.61% were diagnosed with AF. In contrast, 25% of ACS patients included in the study by Saleh et al. [51] were previously diagnosed with AF. Therefore, this difference in the inclusion criteria is likely the main contributing factor for the differences in the outcome prediction between the two studies.
This study has several limitations. First, as an observational study, the results merely indicate a correlation rather than a causal relationship. Second, being a single-center retrospective analysis with a relatively small sample size, it may have introduced selection bias and restricted the generalizability of the results. Third, we could not evaluate body mass index as a potential prognostic factor because data for height and weight were not available for a significant proportion of participants. Finally, seasonal variations in blood cell counts could affect the broader applicability of our conclusions. Therefore, larger-cohort multicenter prospective studies are necessary in the future to externally validate our findings and minimize bias through comprehensive clinical data collection.
Elevated MLR was independently associated with MACEs in patients with newly diagnosed ACS. MLR demonstrated superior predictive performance compared to the other five inflammatory indicators. These findings suggested that MLR is a promising low-cost clinical tool for non-invasive inflammatory monitoring, precise risk stratification, and personalized therapeutic strategies in the management of ACS. The optimal cutoff value of MLR requires further validation through large-scale cohort multicenter studies to establish standardized criteria for the clinical application of these biomarkers.
CHD, coronary heart disease; CAD, coronary artery disease; ACS, acute coronary syndrome; UA, unstable angina; STEMI, ST-segment elevation myocardial infarction; NSTEMI, non-ST-segment elevation myocardial infarction; PCI, percutaneous coronary intervention; MACEs, major adverse cardiovascular events; CRP, C-reactive protein; NLR, neutrophil-to-lymphocyte ratio; PLR, platelet-to-lymphocyte ratio; MLR, monocyte-to-lymphocyte ratio; SII, systemic immune-inflammation index; SIRI, systemic inflammation response index; SIIRI, systemic immune-inflammatory response index; HR, hazard ratio; CI, confidence interval; HF, heart failure; AF, atrial fibrillation; LDL, low-density lipoprotein; HDL, high-density lipoprotein; ROC, receiver operating characteristic; AUC, area under the curve.
The data that support the findings of this study are available on request from the corresponding author.
ML and GPL initially conceived the research conception. ML, HLL, KYC, and MY then designed the research study. HL and XPC organized the database. ML and HLL performed the statistical analysis. ML, YZ, TL, and GPL contributed to the interpretation of the statistical data. ML wrote the first draft of the manuscript, and HL wrote sections of the manuscript. KYC, MY, and XPC contributed to drafting or critically revising sections of the manuscript. YZ, TL, and GPL provided critical revisions for important intellectual content. All authors contributed to editorial changes, read and approved the final manuscript, and agreed to be accountable for all aspects of the work.
The study was conducted in accordance with the Declaration of Helsinki. The research protocol was approved by the Ethics Committee of Binzhou People’s Hospital (Ethic Approval Number [YYKYLL20250202]). The ethics committee/institutional review board waived the requirement of written informed consent for participation from the participants or the participants’ legal guardians/next of kin because this study was retrospective, and no informed consent was signed.
The authors would like to thank all the participants for their cooperation when conducting the study.
This work was supported by the National Natural Science Foundation of China (Grant number [82470527]), Tianjin Key Medical Discipline (Specialty) Construction Project (Grant number [TJYXZDXK-029A]), the Shandong Province Medical and Health Science and Technology Development Program (Grant number [202203010589]) and the Project of Binzhou People’s Hospital (Grant number [XJ2022006307]).
The authors declare no conflict of interest. Tong Liu is serving as a Guest Editor and an Editorial Board member of this journal. We declare that Tong Liu had no involvement in the peer review of this article and has no access to information regarding its peer review. Full responsibility for the editorial process for this article was delegated to Allison B. Reiss.
Supplementary material associated with this article can be found, in the online version, at https://doi.org/10.31083/RCM39917.
References
Publisher’s Note: IMR Press stays neutral with regard to jurisdictional claims in published maps and institutional affiliations.