


 , Nan Chen 1,†, Peng Li 3, Fang-Hui Zhu 1, Ming Li 1, Xiao-Han Zhao 1, Hui-Ping Zhang 1,*
1 Department of Cardiology, Beijing Hospital, National Center of Gerontology, Institute of Geriatric Medicine, Chinese Academy of Medical Sciences, 100730 Beijing, China
2 Arrhythmia Center, Fuwai Hospital, National Center for Cardiovascular Diseases, Chinese Academy of Medical Sciences, Peking Union Medical College, 100730 Beijing, China
3 The Key Laboratory of Geriatrics, Beijing Institute of Geriatrics, Institute of Geriatric Medicine, Chinese Academy of Medical Sciences, Beijing Hospital/National Center of Gerontology of National Health Commission, 100730 Beijing, China
†These authors contributed equally.
Abstract
Transcatheter aortic valve replacement (TAVR) has become the preferred treatment for severe aortic stenosis, particularly in patients at high surgical risk. Conduction block requiring permanent pacemaker (PPM) implantation remains a common complication post-TAVR. This systematic review and meta-analysis aimed to clarify perioperative (≤30-day) predictors of PPM implantation.
A systematic search was performed using the PubMed, Web of Science, and Embase databases to gather all relevant studies examining the relationship between TAVR and pacemaker implantation outcomes within 30 days of the procedure. Pooled odds ratios (ORs) with 95% confidence intervals (CIs) were calculated using a random-effects model.
A total of 82 studies comprising 124,808 patients were included. The overall incidence of PPM implantation within 30 days post-TAVR was 17.5%. Key baseline risk factors included right bundle branch block (RBBB) (OR, 5.48; 95% CI, 4.52–6.64) and first-degree atrioventricular block (AVB) (OR, 2.30; 95% CI, 1.82–2.90). Baseline left bundle branch block (LBBB), mitral annular calcification, and male sex were not significantly associated with PPM implantation. A longer membranous septum (MS) length was associated with a reduced risk (OR, 0.78; 95% CI, 0.66–0.93). Additionally, procedural risk factors included greater implant depth (OR, 1.20; 95% CI, 1.13–1.28), the use of self-expanding valves (OR, 2.59; 95% CI, 2.06–3.27), and balloon predilation (OR, 1.37; 95% CI, 1.10–1.71). The cusp overlap technique (COT) significantly reduced PPM risk (OR, 0.45; 95% CI, 0.35–0.58). Furthermore, a greater difference between MS length and implantation depth (ΔMSID) was inversely correlated with PPM implantation risk (OR, 1.36; 95% CI, 1.22–1.50), and post-TAVR new-onset LBBB was a strong predictor of PPM implantation (OR, 2.26; 95% CI, 1.66–3.07).
This meta-analysis identified key perioperative predictors of PPM implantation following TAVR. RBBB, first-degree AVB, increased implant depth, self-expanding valves, and predilation all have been shown to increase PPM risk, whereas COT and lower ΔMSID are protective factors.
CRD42023438228, URL: https://www.crd.york.ac.uk/PROSPERO/view/CRD42023438228.
Keywords
- aortic stenosis
- transcathether aortic valve replacement
- cardiac conduction abnormalities
- permanent pacemaker implantation
- perioperative risk factors
Transcatheter aortic valve replacement (TAVR) is increasingly used to treat severe aortic stenosis [1]. TAVR has become the preferred treatment option, particularly in patients who are ineligible for surgery or approximately 6.8% of patients receiving balloon-expandable valves and 23.1% of those with self-expanding systems required permanent pacemaker (PPM) within 30 days, the latter carrying a 3.4-fold higher risk [2, 3]. The occurrence of PPM following TAVR is associated with prolonged hospitalization, increased mortality, and higher rates of heart failure readmission, emphasizing the critical need for improved risk stratification, particularly among patients at high surgical risk [4]. Additionally, its use is gradually being extended to include patients at intermediate and low risks [2]. Despite procedural refinements and new generation devices have reduced complications such as vascular injury and paravalvular leak, conduction disturbances necessitating PPM implantation remained a critical concern.
The anatomical vulnerability of the His-Purkinje system to mechanical
compression during valve deployment largely accounted for PPM risk [5]. A shorter
membranous septum length (
Although several meta-analyses have been conducted on this topic, most of the
existing literature has primarily focused on predictors without specifying a
clear timeframe, often mixing short-term and long-term factors. This lack of
distinction makes it difficult to identify perioperative predictors that
specifically influence early PPM implantation risk. In contrast, our study
systematically analyze perioperative risk factors specifically within the 30-day
window. Therefore, this systematic review and meta-analysis aims to clarify
perioperative (
This review was conducted in accordance with the Preferred Reporting Items for Systematic Reviews and Meta-Analyses (PRISMA) standards, based on a systematic review and quality assessment of meta-analyses. This study has been registered with the PROSPERO International prospective register of systematic reviews (CRD42023438228). The ethical approval was waived.
A systematic search was executed across the PubMed, Web of Science, and Embase databases to gather all relevant studies examining the relationship between TAVR and permanent pacemaker implantation outcomes. The search keywords were as follows: (“Transcatheter Aortic Valve Replacement” OR “Transcatheter Aortic Valve Implantation” OR “Transcatheter Aortic Valve Insertion” OR “TAVR” OR “TAVI”) AND (“pacemaker implantation” OR “permanent pacemaker” OR “pacemaker”) AND (“postoperative complications” OR “prognosis” OR “outcome” OR “risk factors” OR “predictors”). The search covered the literature published up to January 2024. Additionally, we also manually searched reference lists of included articles and relevant reviews, and scanned preprint servers (medRxiv, ResearchSquare) for unpublished studies meeting eligibility criteria. All retrieved records were managed in Endnote software, with deduplication algorithms applied before screening.
We included original studies that met the following criteria: (1) Population:
Patients undergoing TAVR. (2) Outcome: Studies explicitly reporting of PPM
implantation rates within 30 days post-procedure. (3) Design: Randomized
controlled trials (RCTs) or observational studies (retrospective
cohorts, Newcastle-Ottawa Scale (NOS) scores
Studies were excluded if they (1) involved non-human subjects or focused on basic science mechanisms; (2) lacked clear exclusion criteria for patients with preexisting pacemakers—a critical safeguard against selection bias; (3) compared TAVR with surgical valve replacement or evaluated valve brands without analyzing PPM risk factors; or (4) used aggregated public registry data, which may include duplicate individual patient records from primary studies. To minimize heterogeneity, we also excluded non-English publications and studies reporting outcomes beyond 30 days, as late conduction disturbances often reflected distinct pathophysiological mechanisms.
Two investigators independently performed a dual-phase screening process: initial title/abstract review followed by full-text assessment to determine study eligibility. Data extraction was restricted to articles meeting predefined quality thresholds. From eligible studies, we systematically extracted the following variables: (1) Study identifiers (first author, publication year); (2) Design (prospective/retrospective cohort, RCT); (3) Cohort characteristics (sample size, age, sex distribution, STS score); (4) Quantitative outcomes (number of pacemaker implantations within 30 days post-TAVR).
All extractions were conducted independently by two reviewers using standardized
electronic forms. Discrepancies in screening decisions or data interpretation
were resolved through iterative discussion, with unresolved cases adjudicated by
a third senior investigator. Inter-rater agreement was quantified using Cohen’s
Two independent investigators evaluated methodological quality using
standardized criteria. Cohort studies were assessed with the NOS, scoring
selection bias (e.g., cohort representativeness), comparability (adjustment for
age/comorbidities), and outcome validity (follow-up adequacy) on a 9-point scale;
studies scoring
Randomized trials were appraised via the Cochrane Risk of Bias Tool (RoB 2.0,
version 1, August 2019; Cochrane Methods Group, London, UK), examining
randomization integrity, intervention adherence, missing data handling, outcome
measurement consistency, and selective reporting-trials with
Categorical variables were summarized as counts and proportions (%), while
continuous variables were reported as means with standard deviations (SD) or
medians with interquartile ranges (IQR) based on distribution normality. We
employed a random-effects model (DerSimonian-Laird estimator) to pool adjusted
odds ratios (ORs) and 95% confidence intervals (CIs), prioritizing this approach
to account for anticipated clinical and methodological heterogeneity across
studies. Between-study heterogeneity was quantified using Cochran’s Q test
(significance threshold: p
To assess small-study effects and publication bias, we generated funnel plots
complemented by Egger’s regression test for asymmetry (p
Using the aforementioned search strategy, a preliminary identification of 8218 articles was performed. After removing duplicates, 4945 unique articles remained. Following an assessment of article type, abstracts, and keywords, 3994 articles were excluded because of irrelevant topics or because they were literature reviews, conference abstracts, editorial letters, or irrelevant studies. Full-text assessment was conducted on the remaining 951 articles. Subsequently, 802 articles were excluded as they did not meet the inclusion criteria. Finally, a quality assessment was performed on the remaining articles. We conducted a meta-analysis on the risk factors for PPM implantation within 30 days of TAVR, including only those factors that were evaluated in three or more studies. Fig. 1 shows the PRISMA flow diagram.
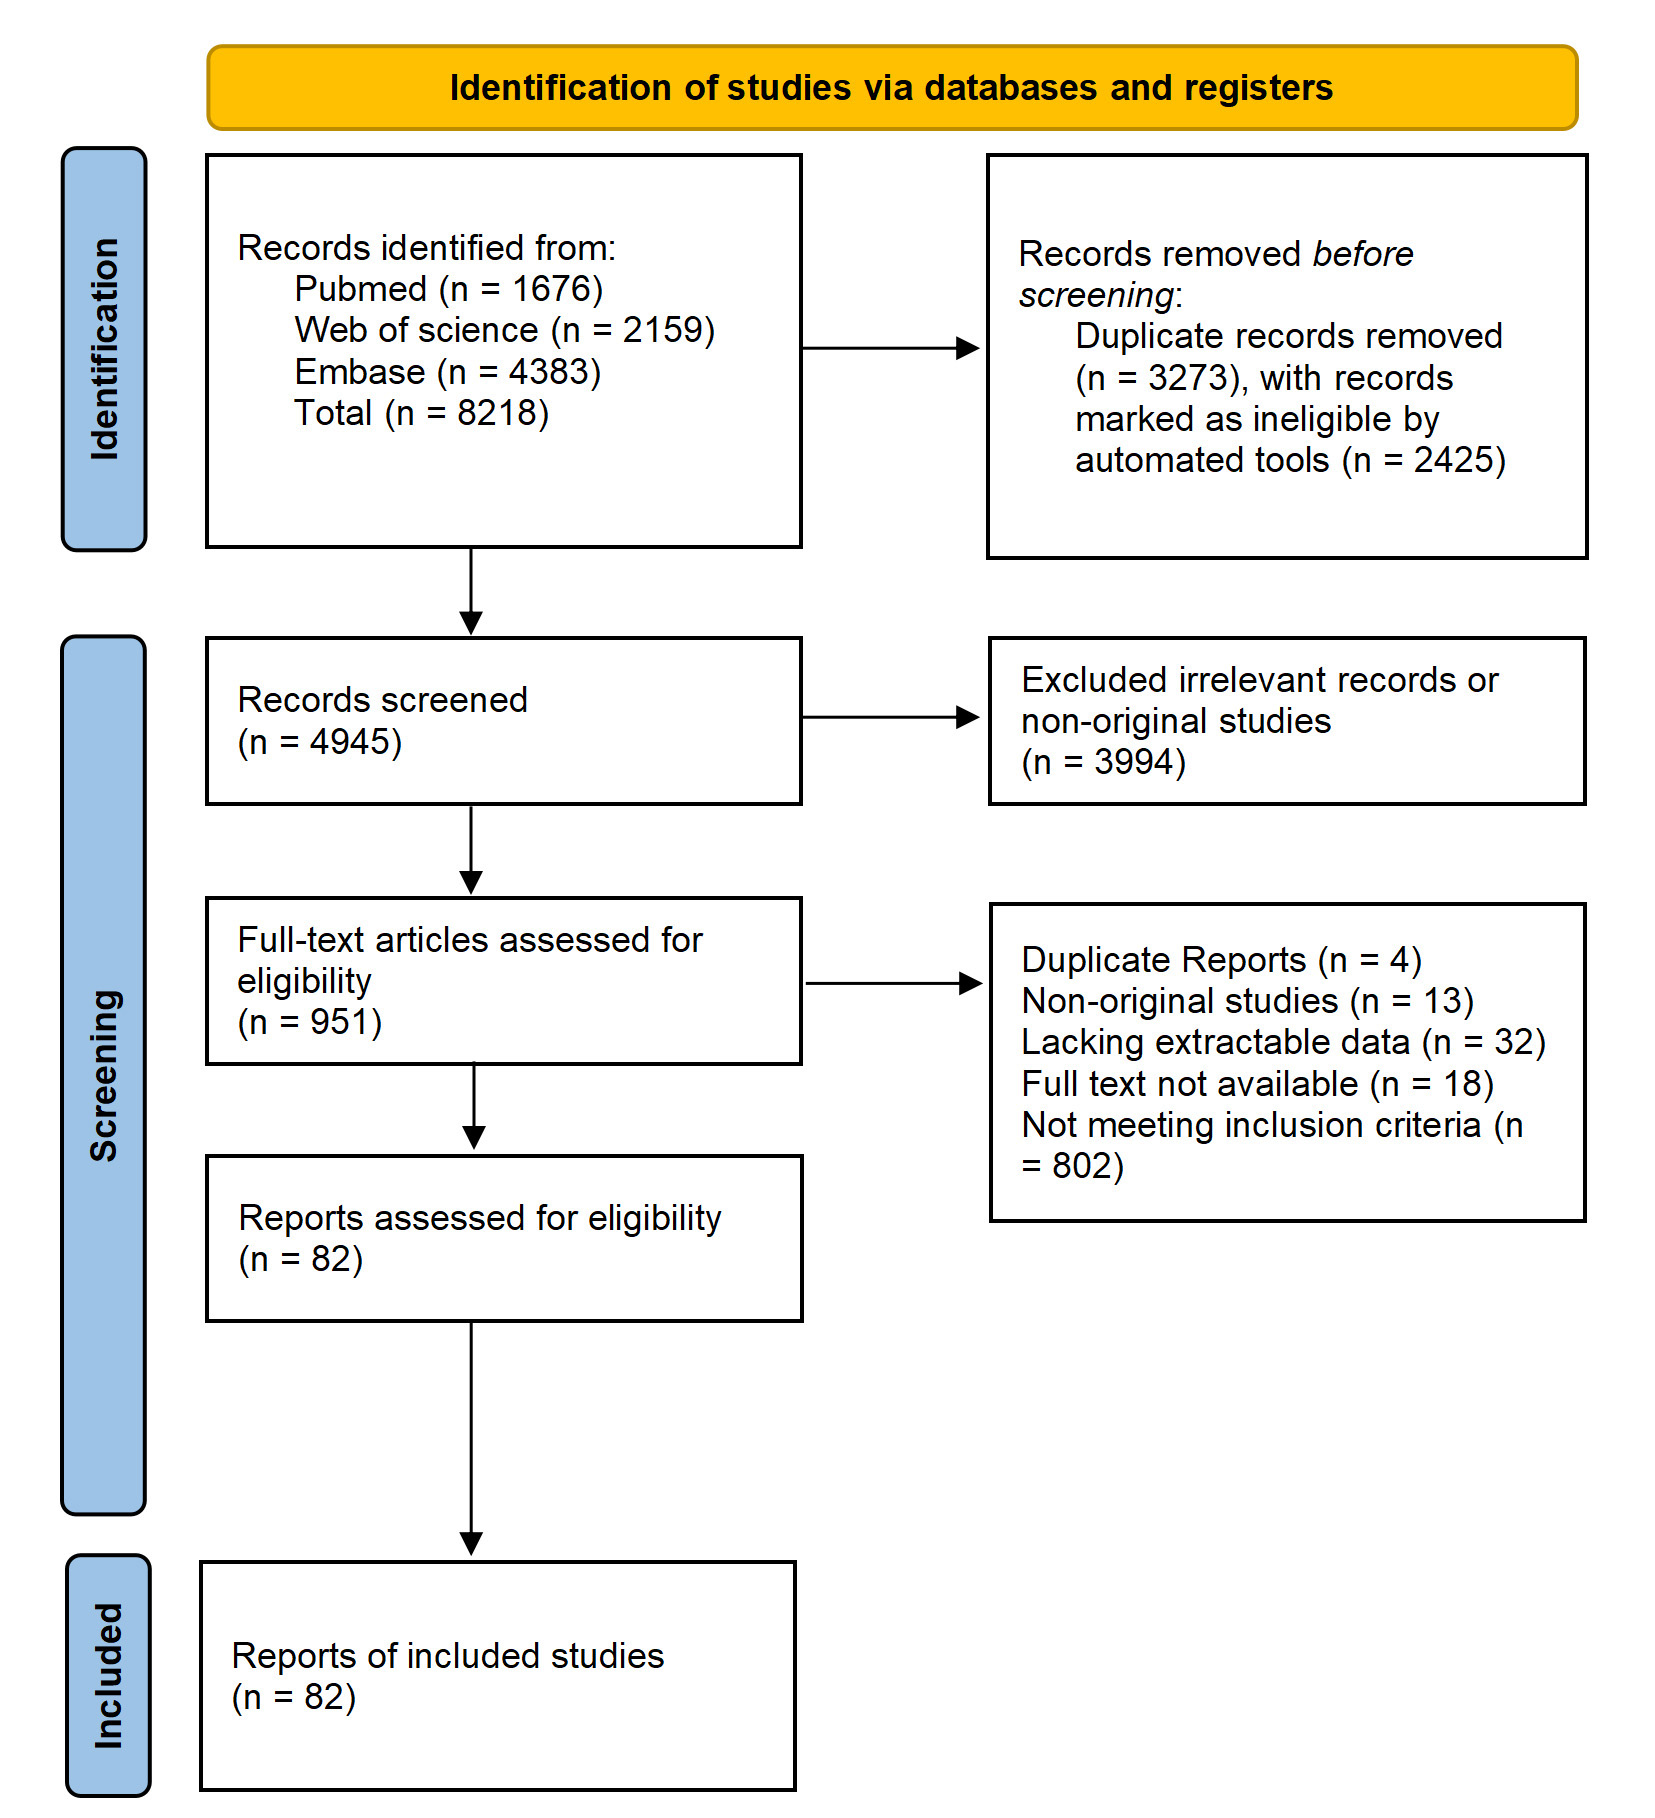 Fig. 1.
PRISMA flow diagram for the study selection process. PRISMA, Preferred Reporting Items for Systematic Reviews and Meta-Analyses.
Ultimately, we included 82 studies (Table 1, Ref. [4, 7, 8, 9, 10, 11, 12, 13, 14, 15, 16, 17, 18, 19, 20, 21, 22, 23, 24, 25, 26, 27, 28, 29, 30, 31, 32, 33, 34, 35, 36, 37, 38, 39, 40, 41, 42, 43, 44, 45, 46, 47, 48, 49, 50, 51, 52, 53, 54, 55, 56, 57, 58, 59, 60, 61, 62, 63, 64, 65, 66, 67, 68, 69, 70, 71, 72, 73, 74, 75, 76, 77, 78, 79, 80, 81, 82, 83, 84, 85, 86]) involving 124,808 patients.
Among these, 21,919 (17.5%) required PPM implantation within 30 days of TAVR. A
total of 29,443 patients (23.6%) received self-expanding prostheses, while
42,414 (34.0%) received balloon-dilated prostheses. The remaining patients
either did not have the specific valve type reported or were treated with other
types of valves. The average PPM implantation rate was 20.4% for self-expanding
prostheses and 12.8% for balloon-dilated prostheses. The average age of the
included population was 82
| First author | Publication year | Study type | Quality score | Total sample size (n) | Event sample size (n) | Mean age | Gender (male %) | STS Score | 30-day all-cause mortality (%) |
| Kim, W. K. [17] | 2018 | Prospective Cohort | 8/9 | 500 | 51 | 82.1 | 0.35 | 4.4 [3.1–6.6] | 3.3 |
| Abramowitz, Y. [18] | 2016 | Retrospective Cohort | 7/9 | 582 | 69 | 82.0 |
0.61 | 7.8 |
2.7 |
| Dhakal, B. P. [19] | 2020 | Retrospective Cohort | 9/9 | 176 | 25 | 80 |
0.6 | 5.7 |
NA |
| Ahmad, M. [13] | 2019 | Retrospective Cohort | 7/9 | 269 | 17 | 79.5 |
0.51 | 6.2 |
NA |
| Ko, E. [20] | 2022 | Prospective Cohort | 7/9 | 676 | 58 | 79.8 |
0.50 | 3.9 |
2 |
| Spargias, K. [21] | 2013 | Prospective Cohort | 7/9 | 126 | 27 | 80 |
0.41 | 7.0 |
1 |
| Corcione, N. [22] | 2021 | Prospective Cohort | 7/9 | 3075 | 401 | 79.8 |
0.50 | NA | 2.3 |
| Stankowski, T. [23] | 2021 | Retrospective Cohort | 9/9 | 148 | 9 | 80.5 |
0.50 | NA | 2 |
| Folliguet, T. A. [24] | 2019 | Prospective Cohort | 7/9 | 11,033 | 1689 | 83.1 |
0.48 | NA | 6.3 |
| Marie, B. [25] | 2021 | Retrospective Cohort | 7/9 | 500 | 60 | 81.0 |
0.54 | NA | 1.2 |
| Barki, M. [26] | 2022 | Retrospective Cohort | 7/9 | 166 | 28 | 82.7 |
0.57 | 3.7 |
2.4 |
| Kroon, H. G. [27] | 2022 | Prospective Cohort | 9/9 | 368 | 74 | 80 [74–84] | 0.53 | 4.3 [2.8–6.3] | 4 |
| Auffret, V. [28] | 2017 | Retrospective Cohort | 9/9 | 3527 | 573 | 82 |
0.50 | 6.9 |
7.2 |
| Okuno, T. [29] | 2021 | Prospective Cohort | 7/9 | 875 | 186 | 81.9 |
0.48 | 5.39 |
3.4 |
| Grubb, K. J. [7] | 2023 | Prospective Cohort | 9/9 | 504 | 46 | 78.7 |
0.54 | 3.0 |
0.6 |
| Nazif, T. M. [30] | 2014 | Prospective Cohort | 8/9 | 1151 | 39 | 83.7 |
0.43 | 11.3 |
3.6 |
| Haouzi, A. [31] | 2022 | Prospective Cohort | 9/9 | 181 | 21 | 77.9 |
0.62 | 3.49 |
3.8 |
| Tham, J. L. M. [32] | 2020 | Retrospective Cohort | 7/9 | 151 | 27 | 83.6 |
0.46 | 4.44 |
2.6 |
| Schofer, N. [33] | 2018 | Retrospective Cohort | 7/9 | 273 | 62 | 80.6 |
0.50 | 5.6 |
2.6 |
| Sawaya, F. J. [34] | 2016 | Retrospective Cohort | 9/9 | 790 | 87 | 82.8 |
0.52 | 5.3 |
6.3 |
| Abdel-Wahab, M. [35] | 2014 | RCT | Low Risk | 241 | 64 | 80.8 |
0.37 | 5.9 |
4.6 |
| Vlastra, W. [36] | 2019 | Prospective Cohort | 8/9 | 12,831 | 1730 | 81 |
0.42 | 6.4 |
5.5 |
| Thiele, H. [37] | 2020 | RCT | Low Risk | 447 | 90 | 81.6 |
0.49 | 4.8 [2.9–9.8] | 2.7 |
| Lak, H. M. [38] | 2022 | Retrospective Cohort | 7/9 | 468 | 23 | 80.0 |
0.59 | 5.3 |
1.5 |
| Abramowitz, Y. [39] | 2017 | Retrospective Cohort | 9/9 | 761 | 34 | 82.1 |
0.60 | 7.1 |
3.3 |
| Schewel, D. [40] | 2018 | Retrospective Cohort | 8/9 | 563 | 61 | 81.2 |
0.44 | 5.9 [3.4–8.0] | 9.9 |
| Simonato, M. [41] | 2019 | Retrospective Cohort | 7/9 | 113 | 7 | 76.5 |
0.66 | 8 |
NA |
| Asmarats, L. [42] | 2023 | Prospective Cohort | 7/9 | 85 | 19 | 81.7 |
0.27 | 4.2 |
2.4 |
| Maeno, Y. [11] | 2017 | Retrospective Cohort | 7/9 | 240 | 35 | 82.4 |
0.51 | 5.2 |
NA |
| Kiefer, N. J. [43] | 2019 | Retrospective Cohort | 7/9 | 378 | 50 | 83.0 |
0.49 | 7.1 |
NA |
| Kroon, H. G. [44] | 2022 | Prospective Cohort | 8/9 | 362 | 74 | 80 [73–84] | 0.54 | 4.2 [2.8–6.3] | 2.8 |
| Mendiz, O. A. [45] | 2021 | Retrospective Cohort | 7/9 | 257 | 28 | 79.7 |
0.50 | 5.9 |
3.5 |
| Hokken, T. W. [9] | 2022 | Retrospective Cohort | 9/9 | 1811 | 275 | 81.9 [77.2–85.4] | 0.54 | 3.2 [2.1–5.0] | NA |
| Mesnier, J. [46] | 2021 | Retrospective Cohort | 7/9 | 1177 | 323 | 80.8 |
0.53 | NA | 5.7 |
| Kim, K. [47] | 2022 | Retrospective Cohort | 7/9 | 364 | 7 | 80.8 |
0.46 | 5.9 |
10.4 |
| Ternacle, J. [48] | 2021 | Prospective Cohort | 7/9 | 495 | 21 | 73.2 |
0.64 | NA | 0.4 |
| Fischer, Q. [49] | 2018 | Prospective Cohort | 8/9 | 3404 | 529 | 81.0 |
0.46 | 5.5 |
5.7 |
| Ojeda, S. [50] | 2020 | Retrospective Cohort | 8/9 | 345 | 60 | 79 |
0.46 | NA | NA |
| Rajah, F. T. [51] | 2022 | Retrospective Cohort | 8/9 | 170 | 48 | 76 [72–83] | 0.57 | NA | NA |
| Al-Azzam, F. [52] | 2017 | Retrospective Cohort | 9/9 | 300 | 59 | 81.1 |
0.55 | 7.6 [5.3–10.6] | NA |
| Hamdan, A. [8] | 2015 | Prospective Cohort | 9/9 | 73 | 21 | 79.8 |
0.45 | NA | NA |
| Kooistra, N. H. M. [53] | 2020 | Prospective Cohort | 9/9 | 2804 | 341 | 82 [77–85] | 0.45 | NA | NA |
| Useini, D. [54] | 2022 | Prospective Cohort | 7/9 | 103 | 19 | 82.7 |
0.44 | 3.7 |
3.9 |
| Chamandi, C. [55] | 2019 | Prospective Cohort | 7/9 | 1020 | 157 | 80.6 |
0.57 | NA | 2.9 |
| Collas, V. M. [56] | 2015 | Prospective Cohort | 7/9 | 861 | 113 | 83 [79–87] | 0.47 | NA | 9 |
| Rheude, T. [57] | 2022 | Retrospective Cohort | 7/9 | 1612 | 110 | 82 [79–85] | 0.48 | NA | NA |
| Pellegrini, C. [58] | 2019 | Retrospective Cohort | 7/9 | 709 | 115 | 81 |
0.55 | NA | NA |
| Guzel, T. [59] | 2023 | Retrospective Cohort | 8/9 | 281 | 23 | 79.0 |
0.45 | 8.55 |
6.3 |
| Habertheuer, A. [60] | 2021 | Prospective Cohort | 7/9 | 563 | 78 | 82 [78–86] | 0.57 | NA | 1.9 |
| Dumonteil, N. [61] | 2019 | Prospective Cohort | 7/9 | 1544 | 207 | 82 | 0.51 | 6.9 | 2 |
| Hamdan, A. [62] | 2021 | Retrospective Cohort | 9/9 | 134 | 18 | 77.0 |
0.61 | NA | NA |
| Pascual, I. [63] | 2022 | Prospective Cohort | 8/9 | 444 | 54 | 82.4 |
0.52 | 4.5 |
1.8 |
| Toutouzas, K. [64] | 2019 | RCT | Low Risk | 171 | 41 | 81.7 |
0.53 | NA | 0 |
| Gama, F. [16] | 2022 | Prospective Cohort | 9/9 | 273 | 57 | 84 [80–87] | 0.39 | NA | NA |
| Leclercq, F. [65] | 2020 | RCT | Low Risk | 236 | 29 | NA | NA | NA | 1.7 |
| Maier, O. [66] | 2022 | Retrospective Cohort | 7/9 | 759 | 35 | 81.6 |
0.49 | 4.9 |
0.1 |
| Chiam, P. T. L. [67] | 2021 | Retrospective Cohort | 7/9 | 873 | 82 | 80 |
0.46 | NA | 4.9 |
| Havakuk, O. [68] | 2016 | Retrospective Cohort | 7/9 | 324 | 81 | 83.2 |
0.42 | NA | 2.5 |
| Bernhard, B. [69] | 2022 | Retrospective Cohort | 7/9 | 2213 | 453 | 82.1 |
0.49 | NA | 3.3 |
| Doldi, P. M. [70] | 2022 | Retrospective Cohort | 7/9 | 122 | 25 | 83.2 |
0.80 | 3.3 [2.2–4.6] | 0.8 |
| Siontis, G. C. M. [10] | 2014 | Retrospective Cohort | 9/9 | 353 | 89 | 82.0 |
0.54 | 14.4 |
NA |
| Kim, W. J. [71] | 2015 | Retrospective Cohort | 8/9 | 117 | 23 | 81.2 |
0.51 | NA | NA |
| Maan, A. [72] | 2015 | Retrospective Cohort | 9/9 | 110 | 31 | 83.6 |
0.54 | 4.04 [1.40–26.96] | NA |
| Monteiro, C. [73] | 2017 | Retrospective Cohort | 8/9 | 670 | 135 | NA | 0.59 | NA | 25.8 |
| Rampat, R. [74] | 2017 | Retrospective Cohort | 7/9 | 201 | 64 | 81.2 |
0.51 | NA | NA |
| van Gils, L. [75] | 2017 | Retrospective Cohort | 8/9 | 306 | 126 | 83 |
0.63 | 6.3 [4.1–10.2] | 7 |
| Iacovelli, F. [76] | 2018 | Retrospective Cohort | 9/9 | 86 | 8 | 81.7 |
0.42 | 20.23 |
0 |
| Costa, G. [4] | 2019 | Prospective Cohort | 9/9 | 1116 | 145 | 80.9 |
0.42 | 4.4 |
4.7 |
| Jilaihawi, H. [77] | 2019 | Retrospective Cohort | 9/9 | 248 | 24 | 83.2 |
0.57 | 6.0 |
1.2 |
| Katchi, F. [15] | 2019 | Retrospective Cohort | 9/9 | 136 | 51 | 84 |
0.47 | 6 [4–8] | NA |
| Meduri, C.U. [78] | 2019 | RCT | Low Risk | 912 | 245 | 82 |
0.49 | NA | 8.4 |
| Bisson, A. [14] | 2020 | Retrospective Cohort | 9/9 | 49201 | 11010 | 82.4 |
0.51 | NA | 3.5 |
| Droppa, M. [79] | 2020 | Retrospective Cohort | 9/9 | 1745 | 191 | 80.6 |
0.49 | NA | 2 |
| Du, F. [80] | 2020 | Retrospective Cohort | 8/9 | 256 | 38 | 76.5 |
0.42 | 7.1 |
3.3 |
| Krishnaswamy, A. [81] | 2020 | Retrospective Cohort | 9/9 | 284 | 19 | 81.4 | 0.54 | 5.57 |
0.4 |
| Eliav, R. [82] | 2021 | Retrospective Cohort | 8/9 | 338 | 83 | NA | 0.49 | NA | 3.8 |
| Nai Fovino, L. [12] | 2021 | Retrospective Cohort | 7/9 | 728 | 112 | 81.2 [77.9–84.7] | 0.54 | 4.06 [2.56–7.45] | NA |
| Hokken, T.W. [83] | 2021 | Retrospective Cohort | 8/9 | 653 | 120 | 80.6 [74.7–84.8] | 0.52 | 3.0 [1.9–4.8] | NA |
| Nicolas, J. [84] | 2021 | Retrospective Cohort | 8/9 | 922 | 120 | 82.4 |
NA | NA | NA |
| Hioki, H. [85] | 2022 | Retrospective Cohort | 9/9 | 754 | 31 | 85 [82–88] | 0.29 | 6.60 [4.58–9.92] | NA |
| Pascual, I. [86] | 2022 | Prospective Cohort | 9/9 | 226 | 40 | 83.5 |
0.60 | NA | 5.3 |
| Pascual, I. [63] | 2022 | Prospective Cohort | 7/9 | 444 | 79 | 82.4 |
0.52 | 4.5 |
4.2 |
RCT, Randomized controlled trial; STS, Society of Thoracic Surgeons; NA, not available.
Several baseline patient factors were significantly associated with PPM
implantation. RBBB showed a strong association with higher odds of PPM
implantation (OR = 5.48, 95% CI: 4.52–6.64, p
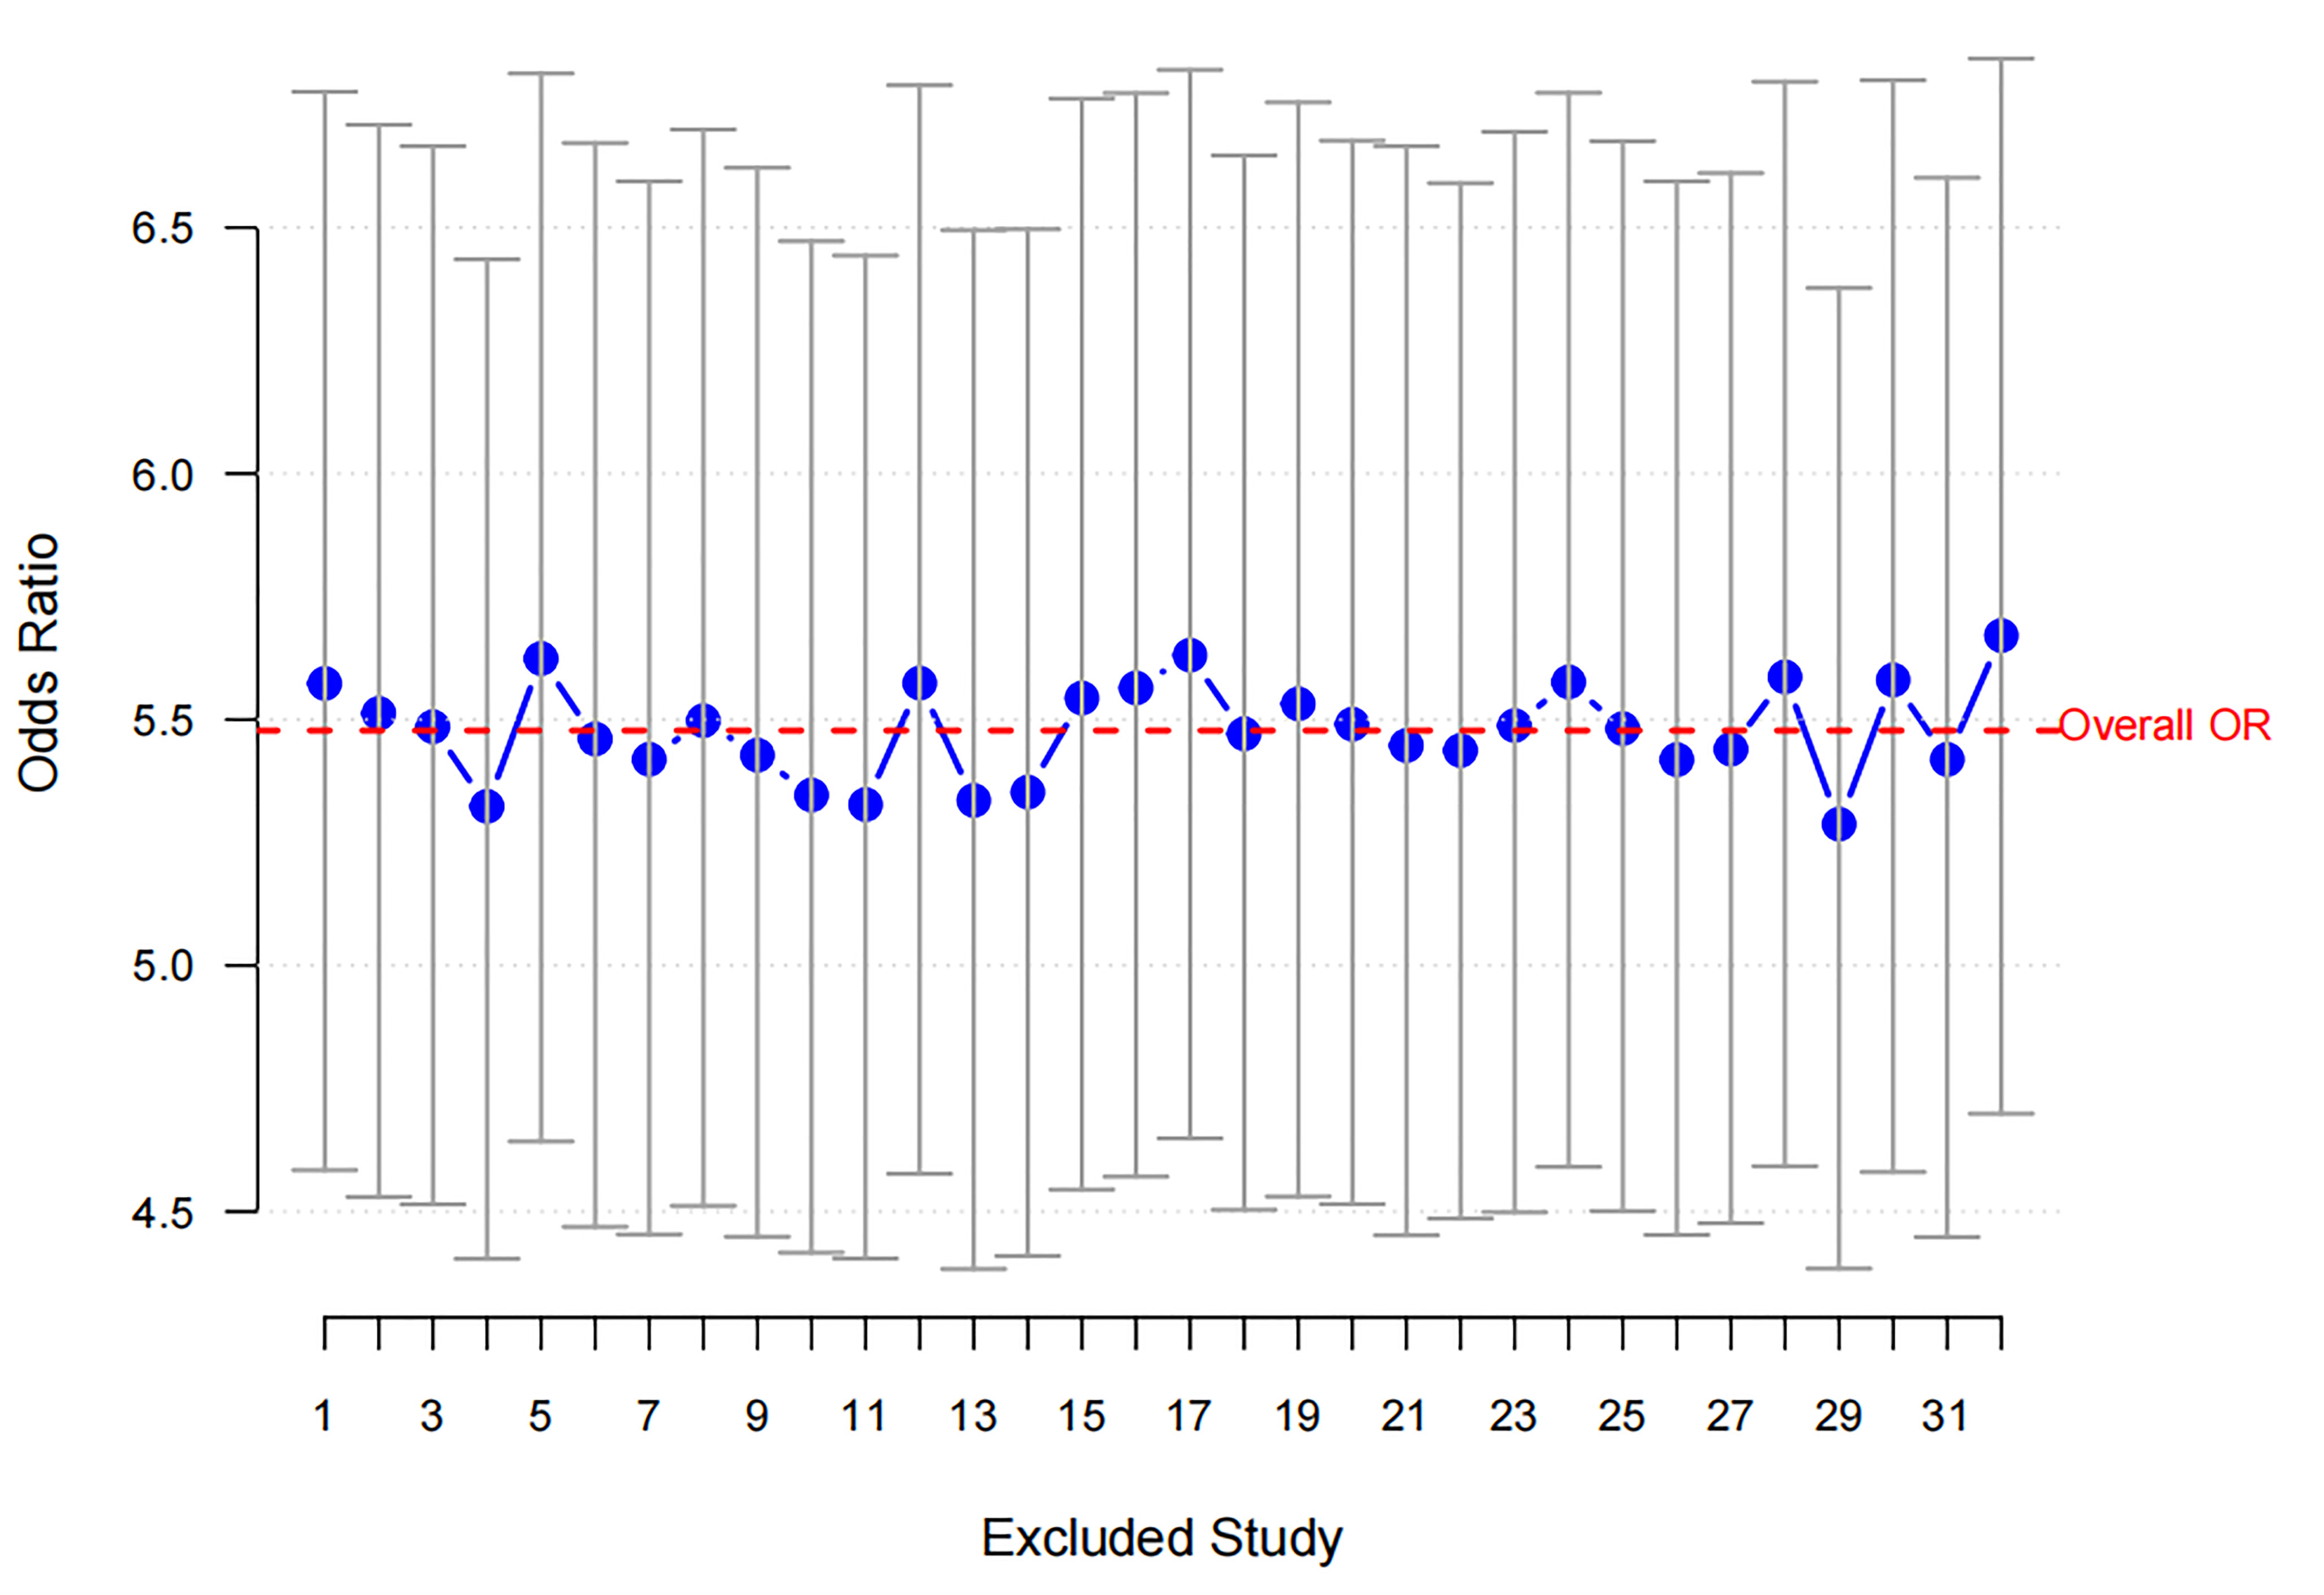 Fig. 2.
Sensitivity analysis for RBBB. The blue dots represent the ORs obtained after excluding each study, with the vertical lines indicating the 95% confidence intervals. The red dashed line represents the overall OR, showing consistent results across study exclusions. RBBB, Right Bundle Branch Block; OR, odds ratio.
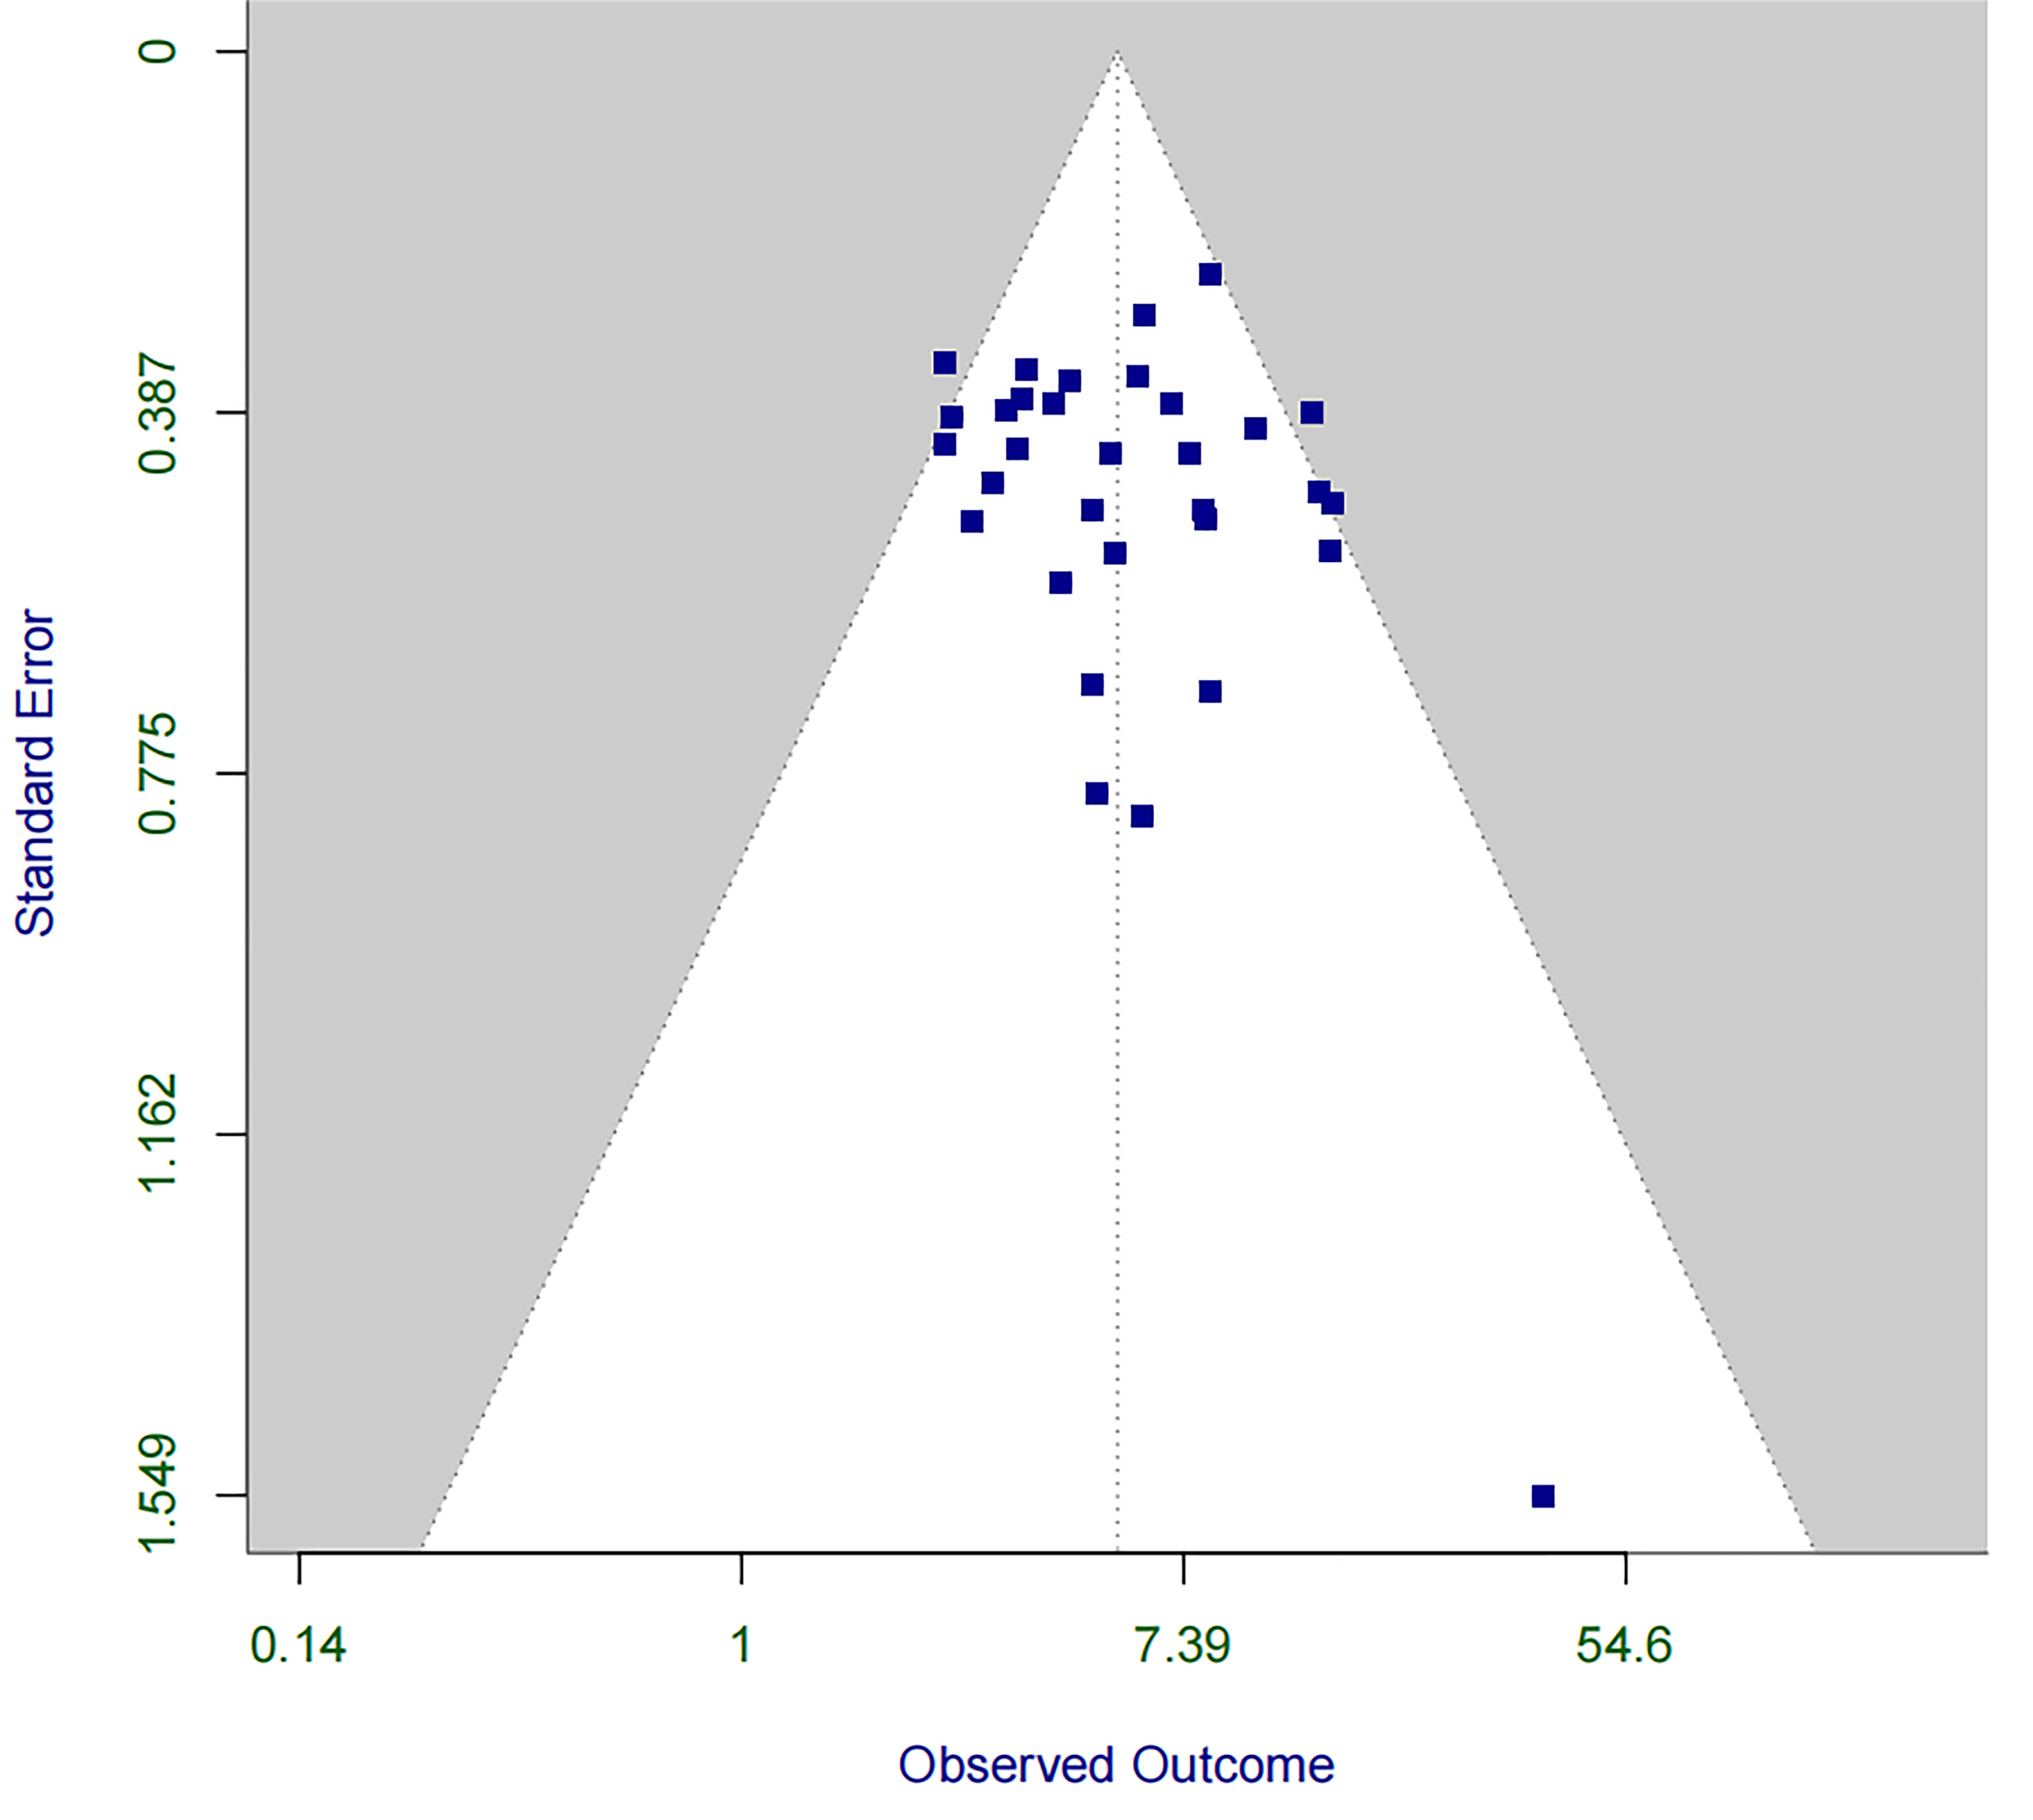
 Fig. 3.
Funnel plot for assessing publication bias in the association between RBBB and PPM implantation within 30 days post-TAVR. PPM, permanent pacemaker; TAVR, transcatheter aortic valve replacement.
Several procedural factors have been identified as significant risk factors for
PPM implantation. Increased implant depth per mm was significantly associated
with higher odds of PPM implantation (OR = 1.20, 95% CI: 1.13–1.28, p
Additionally, the use of the COT significantly reduced the risk of PPM
implantation (OR = 0.45, 95% CI: 0.35–0.58, p
Only one post-procedural risk factor met the inclusion criteria. New-onset LBBB
was identified as a significant post-procedural risk factor for PPM implantation
(OR = 2.26, 95% CI: 1.66–3.07, p
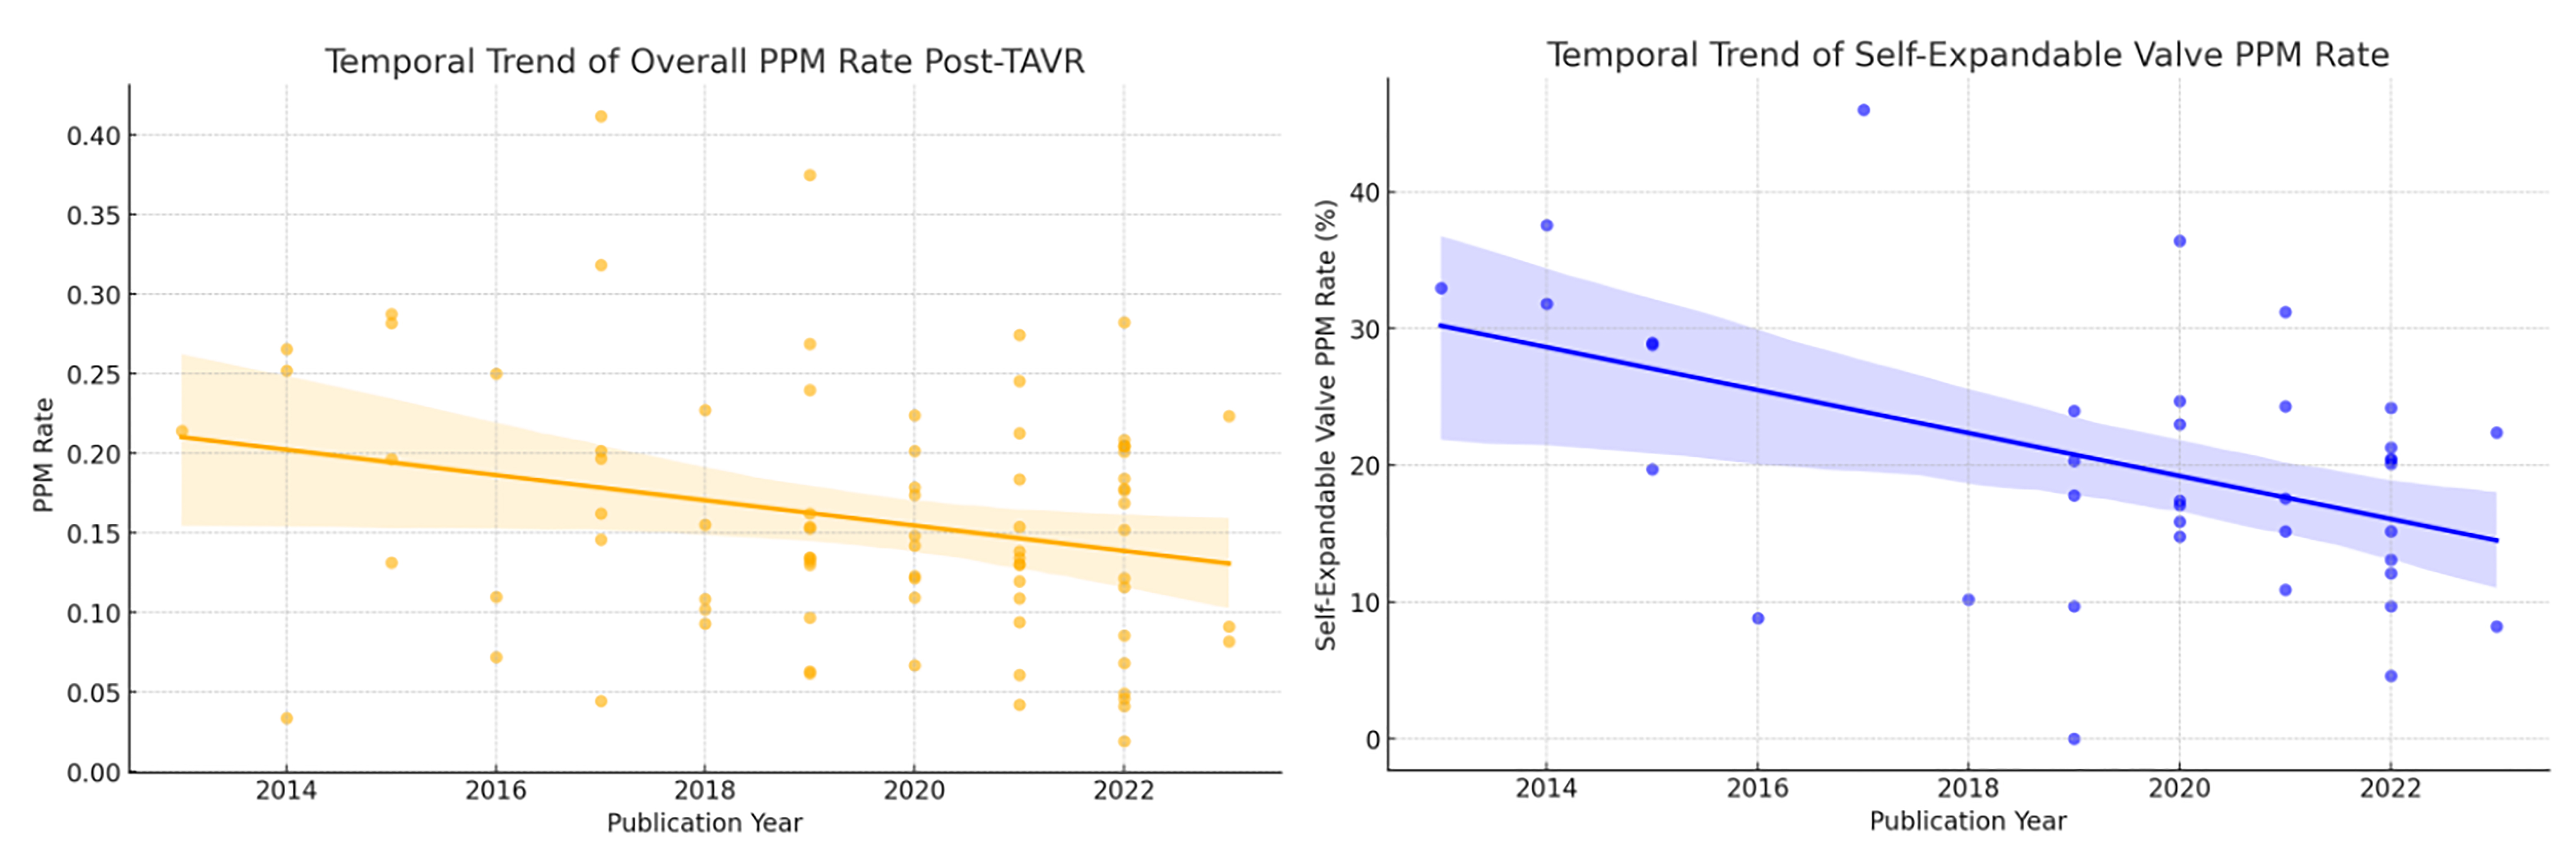
A temporal trend analysis based on the year of publication was performed to evaluate changes in the 30-day PPM implantation rate following TAVR (Fig. 4). Meta-regression revealed a significant decreasing trend in overall PPM implantation rates over time (coefficient = –0.008, 95% CI: –0.015 to –0.001, p = 0.023). Specifically, a notable decline was observed in the self-expanding valve subgroup (coefficient = –1.571, 95% CI: –2.620 to –0.521, p = 0.004), whereas no significant temporal change was observed for the balloon-expandable valve subgroup (coefficient = –0.248, 95% CI: –1.408 to 0.911, p = 0.666).
 Fig. 4.
Temporal trend in 30-Day PPM implantation rates after TAVR.
Subgroup analysis by study design was performed to investigate the potential
impact of different study methodologies (RCT, prospective cohort, retrospective
cohort) on reported risk factors for PPM implantation. The overall PPM rates did
not significantly differ among these study types (Kruskal-Wallis test: statistic
= 4.00, p = 0.261). Furthermore, subgroup analyses for specific risk
factors (e.g., baseline RBBB, self-expanding valve use, increased implantation
depth, baseline LBBB, low implant depth, MAC, and pre-dilation) did not reveal
significant heterogeneity between RCTs and observational studies, with all risk
factors demonstrating non-significant differences across different study designs
(all p
This study aimed to investigate the risk factors for PPM implantation within 30
days of TAVR to provide evidence for perioperative management [87]. Our findings
indicated that baseline factors such as RBBB and first-degree AVB were associated with an
increased risk of PPM implantation, whereas a longer MS length was associated
with a lower risk. Procedural factors, including increased implant depth, low
implant depth, use of self-expanding valves, and predilation, were associated
with a higher risk of PPM implantation. Conversely, a lower
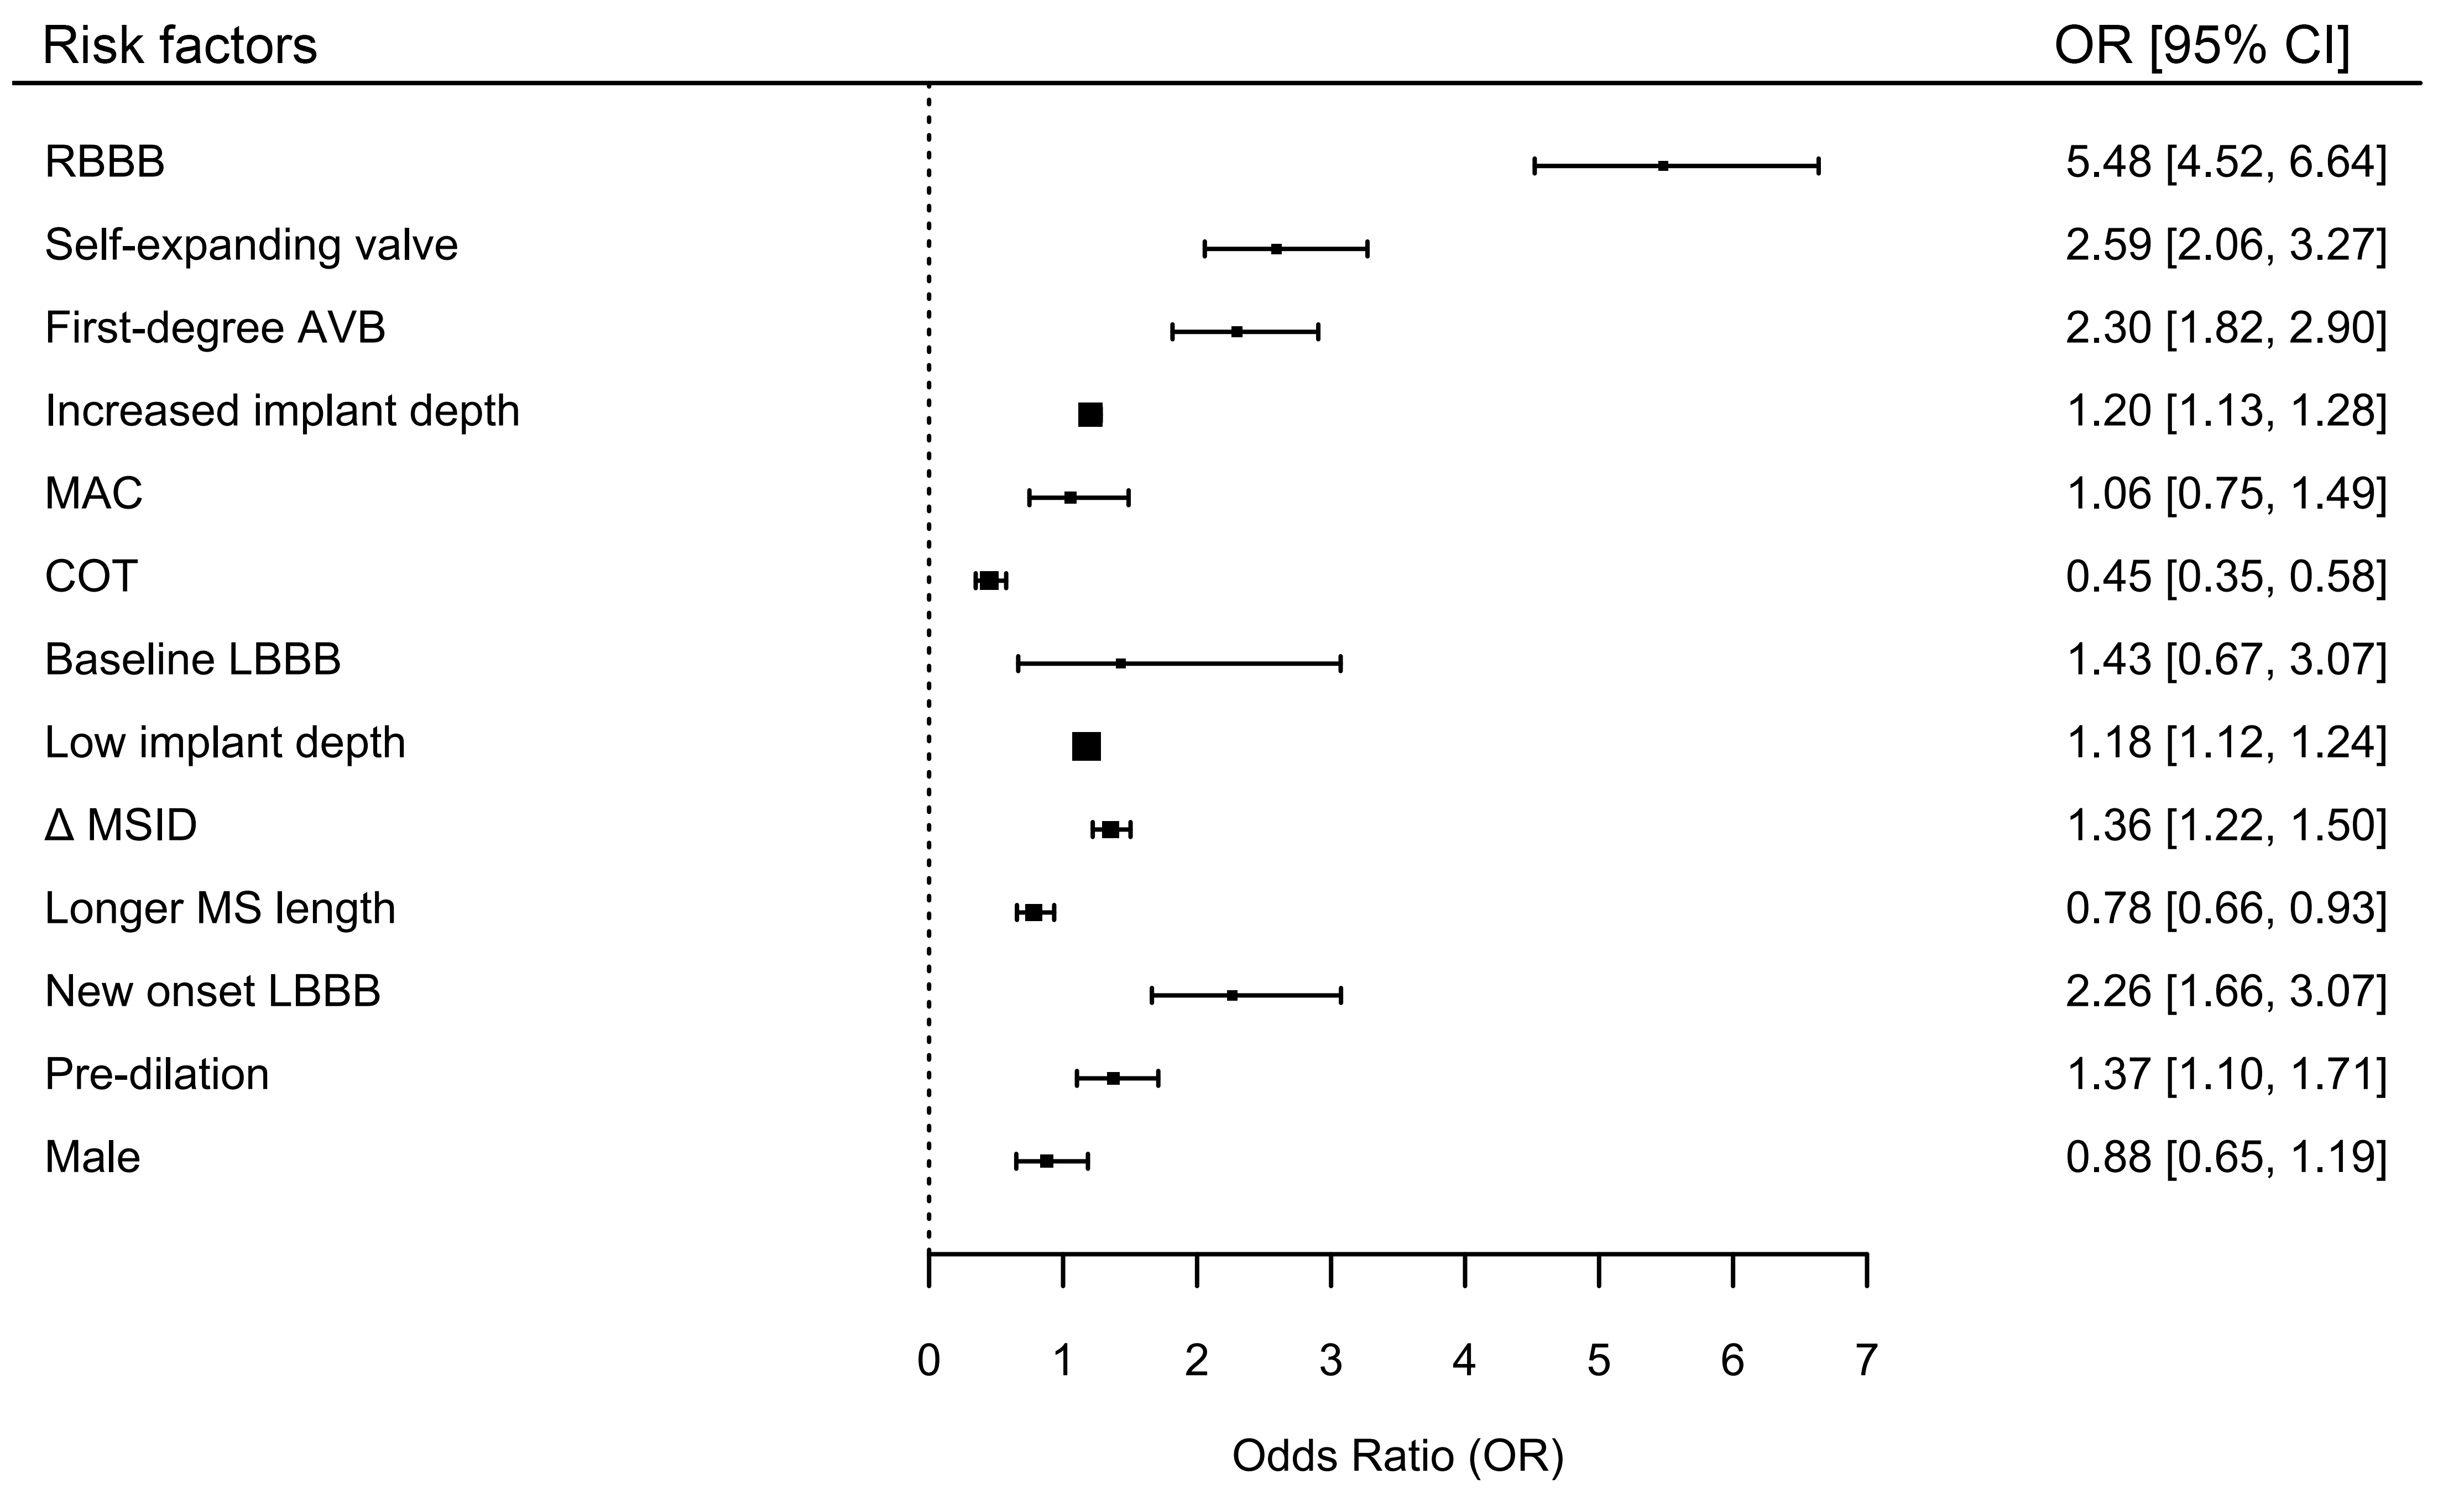 Fig. 5.
Overall forest plot for various risk factors associated with PPM
implantation within 30 days post-TAVR using random effects model. SEV, Self-Expanding Valve; AVB, Atrioventricular Block;
MAC, Mitral Annular Calcification; COT, Cusp Overlap Technique; LBBB, Left Bundle
Branch Block;
Identifying high-risk patients for PPM implantation before intervention is crucial, as it can significantly influence the treatment strategy and patient’s prognosis. Our meta-analysis found that baseline RBBB increased the risk of PPM implantation by approximately 5.5 times, which is much higher than that of other risk factors. This increased risk was likely because valve implantation could easily damage the left bundle branch. If patients with a preexisting RBBB developed LBBB after TAVR, the incidence of chronic arrhythmias and high-grade AVB increased [6, 7]. However, our study found that the baseline LBBB was not associated with an increased need for PPM implantation after TAVR. This finding may further indicated why patients with a baseline RBBB were more prone to PPM implantation due to the damage to the LBBB caused by the valve deployment and positioning during the procedure. Additionally, first-degree AVB significantly increased the risk of PPM implantation, indicating that preoperative attention to conduction abnormalities was necessary.
Patients with longer MS had a lower risk of PPM implantation, which might be related to anatomical factors. Typically, the His bundle originates from the atrioventricular node, traverses the central fibrous body, and extends into the membranous septum, coursing below the junction of the noncoronary and right coronary cusps, with a total length of approximately 20 mm [88]. As the His bundle and left bundle branch are close to the aortic annulus, some conduction abnormalities during surgery are secondary to mechanical damage to the aortic root, leading to tissue inflammation, edema, or ischemia [89]. A longer MS suggests a greater distance from the annulus to the His bundle, reducing the likelihood of valve-induced compression and thus lowering the risk of conduction block [8, 9].
Interestingly, other meta-analyses have reported that male patients have a higher risk of PPM implantation after TAVR [10, 90], whereas some have found that female patients are more likely to develop new-onset LBBB [6]. However, in our study, which analyzed studies that adjusted for sex in multivariate analyses, we found that sex was not associated with the risk for PPM implantation. These results were consistent across the included studies, indicating no heterogeneity. Some studies have suggested that the higher risk in males may be due to the more frequent use of oversized valves and the higher prevalence of baseline comorbidities [91]. The effect of sex on the risk of PPM implantation remains controversial and warrants further investigation.
Except for baseline factors, procedure-related risk factors were crucial for
outcomes. Our findings were consistent with those of previous studies indicating
that the use of self-expanding valves significantly increased the risk of PPM
implantation after TAVR [6, 89, 90]. This increase might be due to mechanical
damage or pressure exerted on the conduction system, leading to tissue
inflammation, ischemia, edema, and subsequent conduction abnormalities [2, 11, 12, 92]. Similarly, predilation procedures also elevated the risk of conduction
abnormalities by 1.37 times, although the funnel plot indicated potential
publication bias for predilation. Predilation should not be performed routinely
unless necessary. Valve implantation depth was another critical factor that
influenced outcomes. As previously mentioned, the cardiac conduction system was
associated with the MS length. Our meta-analysis indicated that valve
implantation depth was closely related to the occurrence of conduction
abnormalities, which supported the mechanism underlying these post-TAVR
complications. Consequently, the measurement of
In recent years, the COT has been proposed as a novel projection method for valve deployment. This technique involved overlapping the right and left coronary cusps to eliminate parallax, thereby facilitating accurate assessment of implantation depth and reducing the risk of conduction abnormalities [93]. Our study demonstrated that the COT significantly reduced the risk of PPM implantation after TAVR, with no heterogeneity observed among the included studies. COT is beneficial for high-risk patients, especially those with RBBB or first-degree AVB, to mitigate conduction injury.
Among the postoperative factors, only new-onset LBBB met the inclusion criteria. New-onset LBBB was common after TAVR, and we found that it increased the risk of PPM implantation by 2.26 times. Although one-third of patients could reach a resolution of LBBB within 30 days postoperatively as myocardial injury, inflammation, or edema subsided, it is important to note that new-onset LBBB implied the cardiac conduction system had been affected [94]. Therefore, monitoring for conduction block complications in these patients should be warranted, and continuous electrocardiogram monitoring might be reasonable for this patient group [87, 95]. However, it should be paid attention that potential publication bias was observed in our study and the robustness of the findings was limited, necessitating cautious interpretation and further research on the relationship between new-onset LBBB and the need for PPM implantation after TAVR.
The temporal trend analysis demonstrates a significant overall decline in the incidence of PPM implantation following TAVR over recent years, particularly pronounced in self-expanding valve cohorts. This trend likely reflects technological advancements, such as the adoption of the cusp overlap technique, improved procedural optimization, and iterative upgrades in valve design, all contributing to more precise valve positioning and reduced conduction disturbances [93]. However, no significant temporal change was identified in balloon-expandable valve cohorts, possibly indicating a plateau in technological advancements or a consistent patient selection approach in this subgroup.
Our study has several limitations. First, as this is the first meta-analysis to focus on the perioperative period of TAVR, we excluded high-quality studies whose endpoints did not align with our criteria. Second, we only included studies that performed multivariate adjustments for risk factors to eliminate confounding effects. Consequently, compared with previous meta-analyses, only 13 factors met our criteria; however, this provided stronger evidence regarding the impact of these factors on PPM implantation after TAVR. Third, although some variables such as BMI [13, 14], choice of oversized valves [4], and changes in QRS duration [15, 16], have been identified in previous studies as potentially related to conduction abnormalities, we required a minimum of three studies for each variable to ensure reasonable evaluation. Owing to differences in definitions among studies, some variables were ultimately not included in our analysis [96]. Lastly, although the number of eligible RCTs included in our meta-analysis was limited, we employed rigorous quality assessment tools for observational studies and conducted subgroup analyses based on study design. The results showed that the estimated effects of risk factors were largely consistent across study types, thereby strengthening the reliability of our overall findings.
This study fills a critical evidence gap by systematically evaluating
perioperative predictors of PPM implantation within 30 days post-TAVR—a pivotal
timeframe for early clinical decision-making. Compared to prior meta-analyses
that focused on long-term outcomes or mixed timeframes, our study provides
actionable insights for immediate post-TAVR management. We identified several key
risk factors for PPM implantation, including baseline RBBB, first-degree AVB, shorter MS,
use of self-expanding valves, predilation, lower valve implantation positions,
and new-onset LBBB. However, the use of COT and a lower
TAVR, Transcatheter aortic valve replacement; PPM, Permanent pacemaker; RBBB, Right bundle branch block; first-degree AVB, first-degree atrioventricular block; LBBB, Left bundle branch block; MS, Membranous septum; COT, Cusp overlap technique;
Data extracted from included studies, data used for all analyses, analytic code, and other materials used in the systematic review are available upon request from the corresponding author.
XP, NC, PL: study design, data collection, funding acquisition, writing—original draft. XP, FHZ, NC, XHZ, ML: data collection, data analysis. HPZ: methodology, data analysis, supervision, funding acquisition, writing—review & editing. All authors contributed to editorial changes in the manuscript. All authors read and approved the final manuscript. All authors have participated sufficiently in the work and agreed to be accountable for all aspects of the work.
Not applicable.
Not applicable.
This study was supported by the Non-profit Central Research Institute Fund of Chinese Academy of Medical Sciences (2024-JKCS-04).
The authors declare no conflict of interest.
During the preparation of this work the authors used ChatGpt-4o in order to check spell and grammar. After using this tool, the authors reviewed and edited the content as needed and takes full responsibility for the content of the publication.
Supplementary material associated with this article can be found, in the online version, at https://doi.org/10.31083/RCM39299.
References
Publisher’s Note: IMR Press stays neutral with regard to jurisdictional claims in published maps and institutional affiliations.