


 , Yike Li 1,2,†, Xu Chen 3, Haoming He 1,2, Yingying Xie 1,2, Yonghui Xu 2, Yue Cai 2, Tao Ye 3, Yanxiang Gao 2, Shiqiang Xiong 3, Lin Cai 3, Jingang Zheng 1,2,*
1 China-Japan Friendship Hospital (Institute of Clinical Medical Sciences), Chinese Academy of Medical Sciences, Peking Union Medical College, 100029 Beijing, China
2 Department of Cardiology, China-Japan Friendship Hospital, 100029 Beijing, China
3 Department of Cardiology, The Third People's Hospital of Chengdu, Affiliated Hospital of Southwest Jiaotong University, 610031 Chengdu, Sichuan, China
†These authors contributed equally.
Abstract
The 2021 Chronic Kidney Disease Epidemiology Collaboration (CKD-EPI) equation, which incorporates both creatinine and cystatin C, provides enhanced estimation of glomerular filtration rate (eGFR) compared to creatinine-only equations. This study aimed to explore the incremental prognostic value of eGFR estimates in patients with acute coronary syndrome (ACS).
This retrospective analysis evaluated 1400 ACS patients undergoing a percutaneous coronary intervention (PCI). The primary endpoint was defined as major adverse cardiovascular events (MACEs), a composite of all-cause death and nonfatal myocardial infarction (MI). The eGFR values were calculated using three equations: one based solely on serum creatinine (eGFRcr), another based only on cystatin C (eGFRcys), and a combined equation using both creatinine and cystatin C (eGFRcys-cr). Cox regression and the Kaplan–Meier analyses were employed to identify predictors of MACEs. The incremental prognostic value of the three eGFR equations on ACS outcomes was individually assessed.
Over a median follow-up of 31.03 (27.34, 35.06) months, 135 (9.6%) patients experienced MACEs, including 99 (7.1%) deaths and 41 (2.9%) MIs. Lower eGFR values correlated with higher MACEs and the risk of death. Incorporating eGFRcys or eGFRcys-cr into the established risk model improved the predictive accuracy for MACEs. When compared to eGFRcr, eGFRcys-cr demonstrated greater capacity to reclassify the risk for MACEs (category-free continuous net reclassification improvement (cNRI)>0: 0.205 (0.011–0.397); p = 0.03; integrated discrimination improvement (IDI): 0.010 (0.002–0.019); p = 0.01), whereas eGFRcys did not demonstrate a similar effect.
The eGFR based on the 2021 CKD-EPI equation using both creatinine and cystatin C significantly improves risk prediction and reclassification in ACS patients compared with a creatinine-based equation.
Keywords
- cystatin C
- estimating glomerular filtration rate
- acute coronary syndrome
- risk stratification
Acute coronary syndrome (ACS) is a critical and severe manifestation of coronary artery disease, associated with significant morbidity and mortality. Despite improvements in reperfusion techniques, the long-term morbidity and mortality following percutaneous coronary intervention (PCI) continue to be substantial [1]. Accurate prognostic evaluation in ACS patients is crucial for guiding clinical decision-making and optimizing therapeutic strategies. Renal impairment has been identified as a significant risk factor influencing the progression and prognosis of coronary heart disease [2, 3]. Traditional cardiovascular risk assessment tools, such as the Global Registry of Acute Coronary Events (GRACE) score, typically include estimates of renal function based on serum creatinine levels [4, 5, 6]. However, serum creatinine concentrations can be influenced by various non-renal factors, potentially limiting the accuracy in evaluating the “true” renal function [7, 8].
Cystatin C, an endogenous cysteine protease inhibitor, has been recognized as a more reliable biomarker for estimating glomerular filtration rate (eGFR) compared to serum creatinine [8, 9, 10]. Furthermore, cystatin C exhibits enhanced prognostic accuracy for cardiovascular morbidity and mortality, especially in patients with chronic kidney disease (CKD) [11], diabetes mellitus [12], atrial fibrillation [13, 14], and ACS [15, 16]. Recently, the 2021 Chronic Kidney Disease Epidemiology Collaboration (CKD-EPI) equation, which incorporates both serum creatinine and cystatin C and excludes race as a variable, offers a more accurate assessment of renal function [8]. Additionally, it enhances the prediction of heart failure [9, 17], atrial fibrillation [14], end-stage renal disease [18], and cardiovascular mortality [18] across diverse demographic populations.
While reduced renal function is an established risk factor for adverse outcomes in ACS, current prognostic models remain predominantly dependent on creatinine-based eGFR (eGFRcr)—a marker susceptible to fluctuations in muscle mass and inflammatory states. In contrast, cystatin C-based eGFR (eGFRcys) offers significant advantages as a biomarker of glomerular filtration [15, 16]. The combined equation (eGFRcys-cr) further refines risk stratification by integrating both biomarkers, thereby providing a more comprehensive assessment of renal function in ACS patients [19].
Despite these advancements, the incremental prognostic value of cystatin C-based eGFR using the 2021 CKD-EPI equation in ACS patients who underwent PCI has not been fully explored. This study seeks to bridge this research gap by employing the revised 2021 CKD-EPI formula that integrates both creatinine and cystatin C measurements.
We enrolled a total of 1400 patients who were hospitalized at the Third People’s
Hospital of Chengdu (Sichuan, China) who underwent PCI between July 2018 and
December 2020. Plasma creatinine and cystatin C values were available for all
enrolled patients. Exclusion criteria included: (1) history of coronary artery
bypass graft (CABG); (2) Severe valvular heart disease necessitating
intervention; (3) end-stage hepatic disease (Child-Pugh Class C); (4) End-stage
disease of any major organ system (e.g., malignancy, respiratory failure) and an
anticipated survival of
Demographic information, medical history, smoking status, and specific medical
details were systematically extracted from electronic health records. ACS
included unstable angina, ST-segment elevation myocardial infarction (STEMI), and
non-ST-segment elevation myocardial infarction (NSTEMI), as defined by
corresponding guidelines [1]. Peripheral venous blood was sampled from patients
after overnight fasting (
eGFR values were calculated using three different equations: one based solely on serum creatinine (eGFRcr), one based only on cystatin C (eGFRcys), and another based on a combined equation using both creatinine and cystatin C (eGFRcys-cr). The 2021 CKD-EPI equations [8] were used for eGFRcr and eGFRcys-cr, while the 2012 CKD-EPI equation [21] was applied for eGFRcys.
Standardized follow-up evaluations were performed at 1, 6, and 12 months after discharge, followed by annual assessments via telephone interviews or clinical visits. Clinical outcomes were prospectively recorded by trained personnel. The primary endpoint was defined as major adverse cardiovascular events (MACEs), a composite of all-cause mortality and nonfatal myocardial infarction (MI). Secondary endpoints comprised all-cause death, cardiac death, MI, unplanned revascularization (ischemia-driven due to lesion progression or in-stent restenosis), and stroke. All events were rigorously adjudicated through a review of medical records in accordance with international diagnostic criteria.
Continuous variables were summarized using mean
Participants were categorized into four groups based on different eGFR levels as
determined by the eGFcr, eGFRcys, and eGFRcys-cr equations,
respectively. For each equation, the grouping was as follows: T1: eGFR
Likelihood ratio tests (
The final analysis included 1400 eligible patients, with a mean age of 67.09
| Variable | No MACEs | MACEs | p value | |
| (n = 1265) | (n = 135) | |||
| Age, years | 66.35 |
73.98 |
||
| Female, n (%) | 356 (28.1) | 49 (36.3) | 0.047 | |
| sBMI, kg/m2 | 24.45 |
23.85 |
0.024 | |
| Smoking, n (%) | 680 (53.8) | 62 (45.9) | 0.083 | |
| Previous PCI, n (%) | 105 (8.3) | 16 (11.9) | 0.163 | |
| COPD, n (%) | 34 (2.7) | 10 (7.4) | 0.003 | |
| Hypertension, n (%) | 852 (67.4) | 99 (73.3) | 0.157 | |
| Diabetes mellitus, n (%) | 489 (38.7) | 69 (51.1) | 0.005 | |
| Previous stroke, n (%) | 60 (4.8) | 6 (4.4) | 0.870 | |
| SBP, mmHg | 133.12 |
133.39 |
0.889 | |
| Heart rate, bpm | 76.77 |
80.37 |
0.005 | |
| Laboratory Measurements | ||||
| Creatinine, mg/dL | 0.86 (0.74, 1.02) | 0.97 (0.76, 1.37) | ||
| Cystatin C, mg/L | 1.13 (0.96, 1.37) | 1.37 (1.12, 2.11) | ||
| eGFRcr, mL/min/1.73 m2 | 91.43 (74.68, 99.89) | 76.05 (49.63, 91.75) | ||
| eGFRcr |
156 (12.3) | 44 (32.6) | ||
| eGFRcys, mL/min/1.73 m2 | 63.37 (47.63, 79.52) | 47.02 (26.73, 62.69) | ||
| eGFRcys |
565 (44.7) | 97 (71.9) | ||
| eGFRcys-cr, mL/min/1.73 m2 | 77.50 (61.11, 92.38) | 62.19 (35.77, 76.14) | ||
| eGFRcys-cr |
305 (24.1) | 62 (45.9) | ||
| cTnT, pg/mL | 51.00 (11.60, 1211.90) | 194.40 (25.40, 1507.00) | ||
| BNP, pg/mL | 117.90 (40.95, 328.49) | 328.49 (93.30, 999.00) | ||
| FBG, mmol/L | 6.93 |
7.22 |
0.312 | |
| TG, mmol/L | 1.87 |
1.66 |
0.089 | |
| TC, mmol/L | 4.48 |
4.45 |
0.789 | |
| HDL-C, mmol/L | 1.16 |
1.15 |
0.855 | |
| LDL-C, mmol/L | 2.74 |
2.73 |
0.872 | |
| LVEF | 55.38 |
51.36 |
||
| AMI, n (%) | 620 (49.0) | 82 (60.7) | 0.010 | |
| Diagnosis, n (%) | 0.009 | |||
| Unstable angina | 645 (51.0) | 53 (39.3) | ||
| NSTEMI | 262 (20.7) | 42 (31.1) | ||
| STEMI | 358 (28.3) | 40 (29.6) | ||
| bSS | 13.00 (8.00, 19.50) | 19.00 (12.00, 27.50) | ||
| rSS | 3.00 (0.00, 7.00) | 5.00 (1.00, 10.50) | ||
| GRACE score | 103.30 |
130.36 |
||
| Discharge medications | ||||
| Statins, n (%) | 1240 (98.0) | 132 (97.8) | 0.846 | |
| 878 (69.4) | 93 (68.9) | 0.901 | ||
| ACEI/ARB, n (%) | 569 (45.0) | 69 (51.1) | 0.174 | |
| Diuretics, n (%) | 191 (15.1) | 51 (37.8) | ||
| Insulin, n (%) | 123 (9.7) | 24 (17.8) | 0.004 | |
Abbreviations: GRACE score, Global Registry of Acute Coronary Events score; BMI, body mass index; PCI, percutaneous coronary intervention; COPD, chronic obstructive pulmonary disease; SBP, systolic blood pressure; FBG, fasting blood glucose; TG, triglyceride; TC, total cholesterol; HDL-C, high density lipoprotein cholesterol; LDL-C, low density lipoprotein cholesterol; cTnT, cardiac troponin T; BNP, brain natriuretic peptide; AMI, acute myocardial infarction; UA, unstable angina; STEMI, ST-segment elevation myocardial infarction; NSTEMI, non-ST-segment elevation myocardial infarction; ACEI/ARB, angiotensin converting enzyme inhibitor/angiotensin receptor blocker; bSS, baseline SYNTAX score; LVEF, left ventricular ejection fraction; eGFR, estimated glomerular filtration rate; eGFRcys-cr, eGFR calculated using a combined creatinine-cystatin C method; eGFRcys, eGFR calculated using cystatin C only; eGFRcr, eGFR calculated using creatinine only; MACEs, major adverse cardiovascular events.
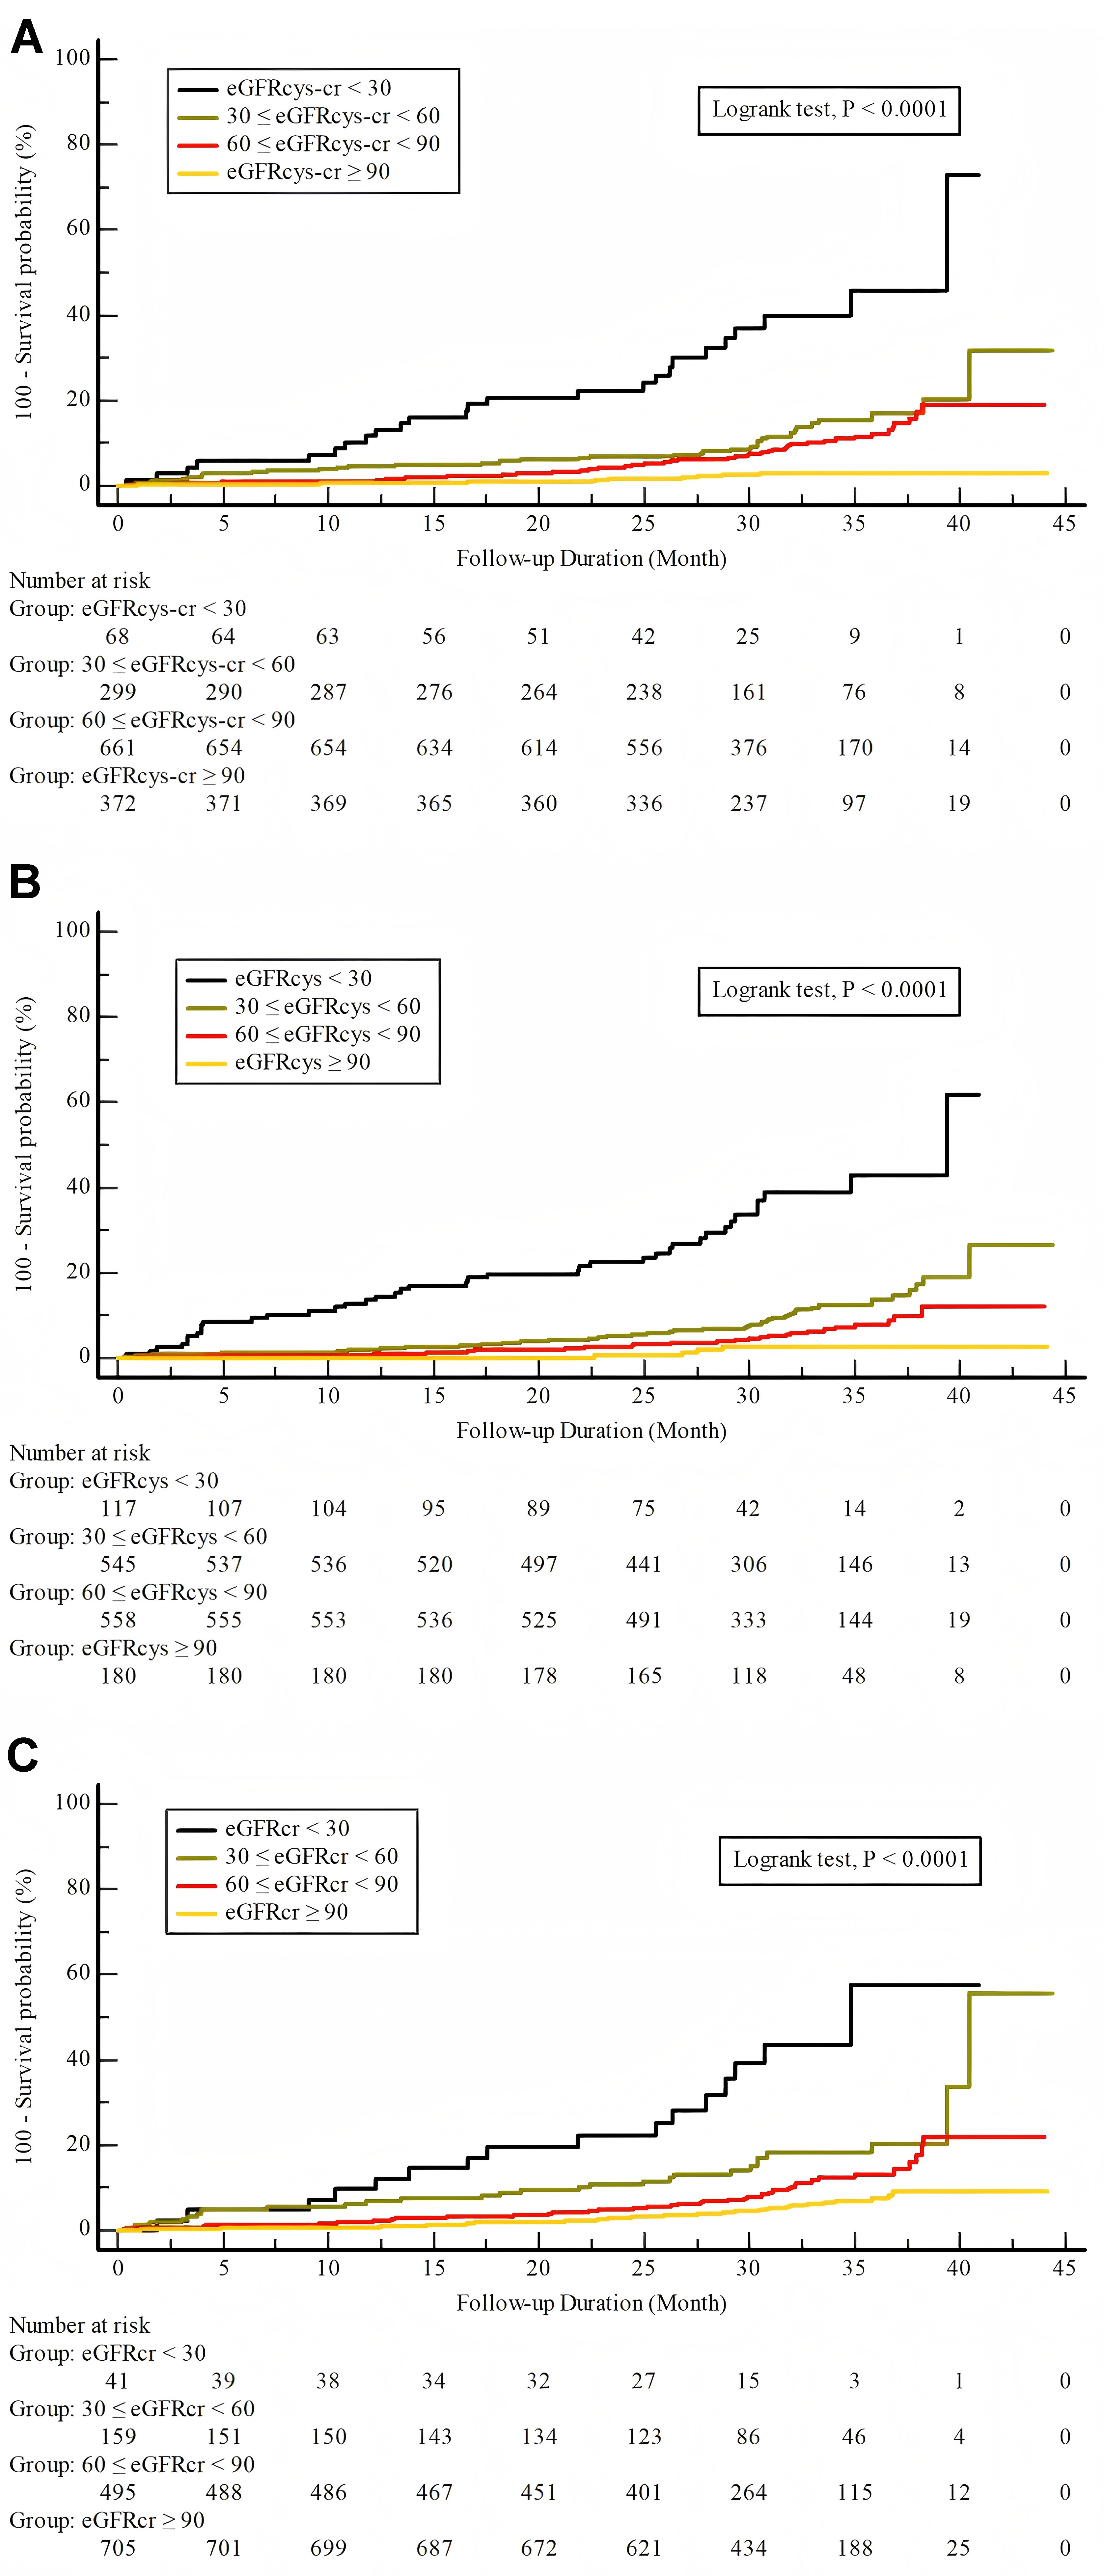
We observed a significant and progressive increase in the incidence of MACEs,
all cause death and cardiac death in groups with reduced eGFR values (p
 Fig. 1.
Incidence of MACEs stratified by eGFR categories. Incidence of MACEs stratified by eGFR categories as estimated by three different equations. Each panel represents results from a different eGFR estimation method. (A) Combined creatinine-cystatin C equation (eGFRcys-cr). (B) Cystatin C-based equation (eGFRcys). (C) Creatinine-based equation (eGFRcr).
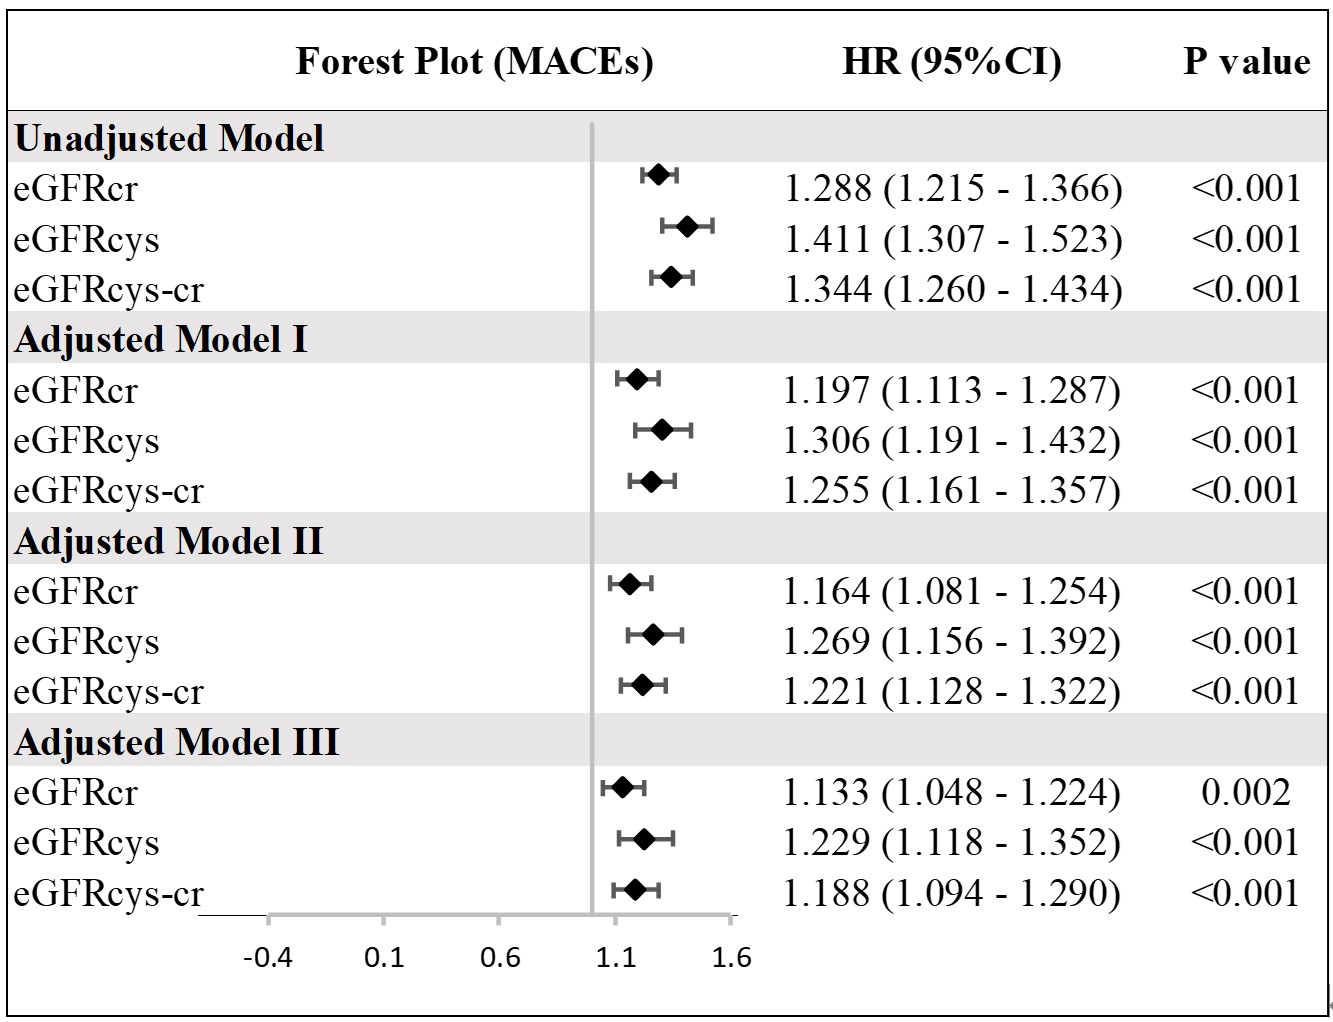
The univariate Cox regression analysis consistently demonstrated that lower eGFR values, as determined by the eGFRcr, eGFRcys, and eGFRcys-cr equations, are associated with an increased risk of MACEs (Supplementary Table 3). These associations remained significant even after adjusting for confounders in different multivariate Cox regression models as illustrated in the forest plot (Fig. 2). This underscores the critical role of kidney function as a predictor of adverse cardiovascular prognosis in ACS.
 Fig. 2.
Multivariate analysis of MACEs by different eGFR calculated using three equations. Hazard ratio (HR) indicates an increased risk for each 10-unit decrease in eGFR. Model I was adjusted for age, BMI, sex, HTN, DM, smoking; Model II was adjusted for Model I plus Heart rate, AMI, LVEF; Model III was adjusted for Model II plus Diuretics, Insulin, bSS. HTN, hypertension; DM, diabetes mellitus.
The ROC analysis indicated (Fig. 3, Supplementary Tables 4,5) that
using eGFR as determined by any of these equations (eGFRcys-cr,
eGFRcys, eGFRcr) provides superior predictive performance for MACEs
compared to using serum creatinine alone (p
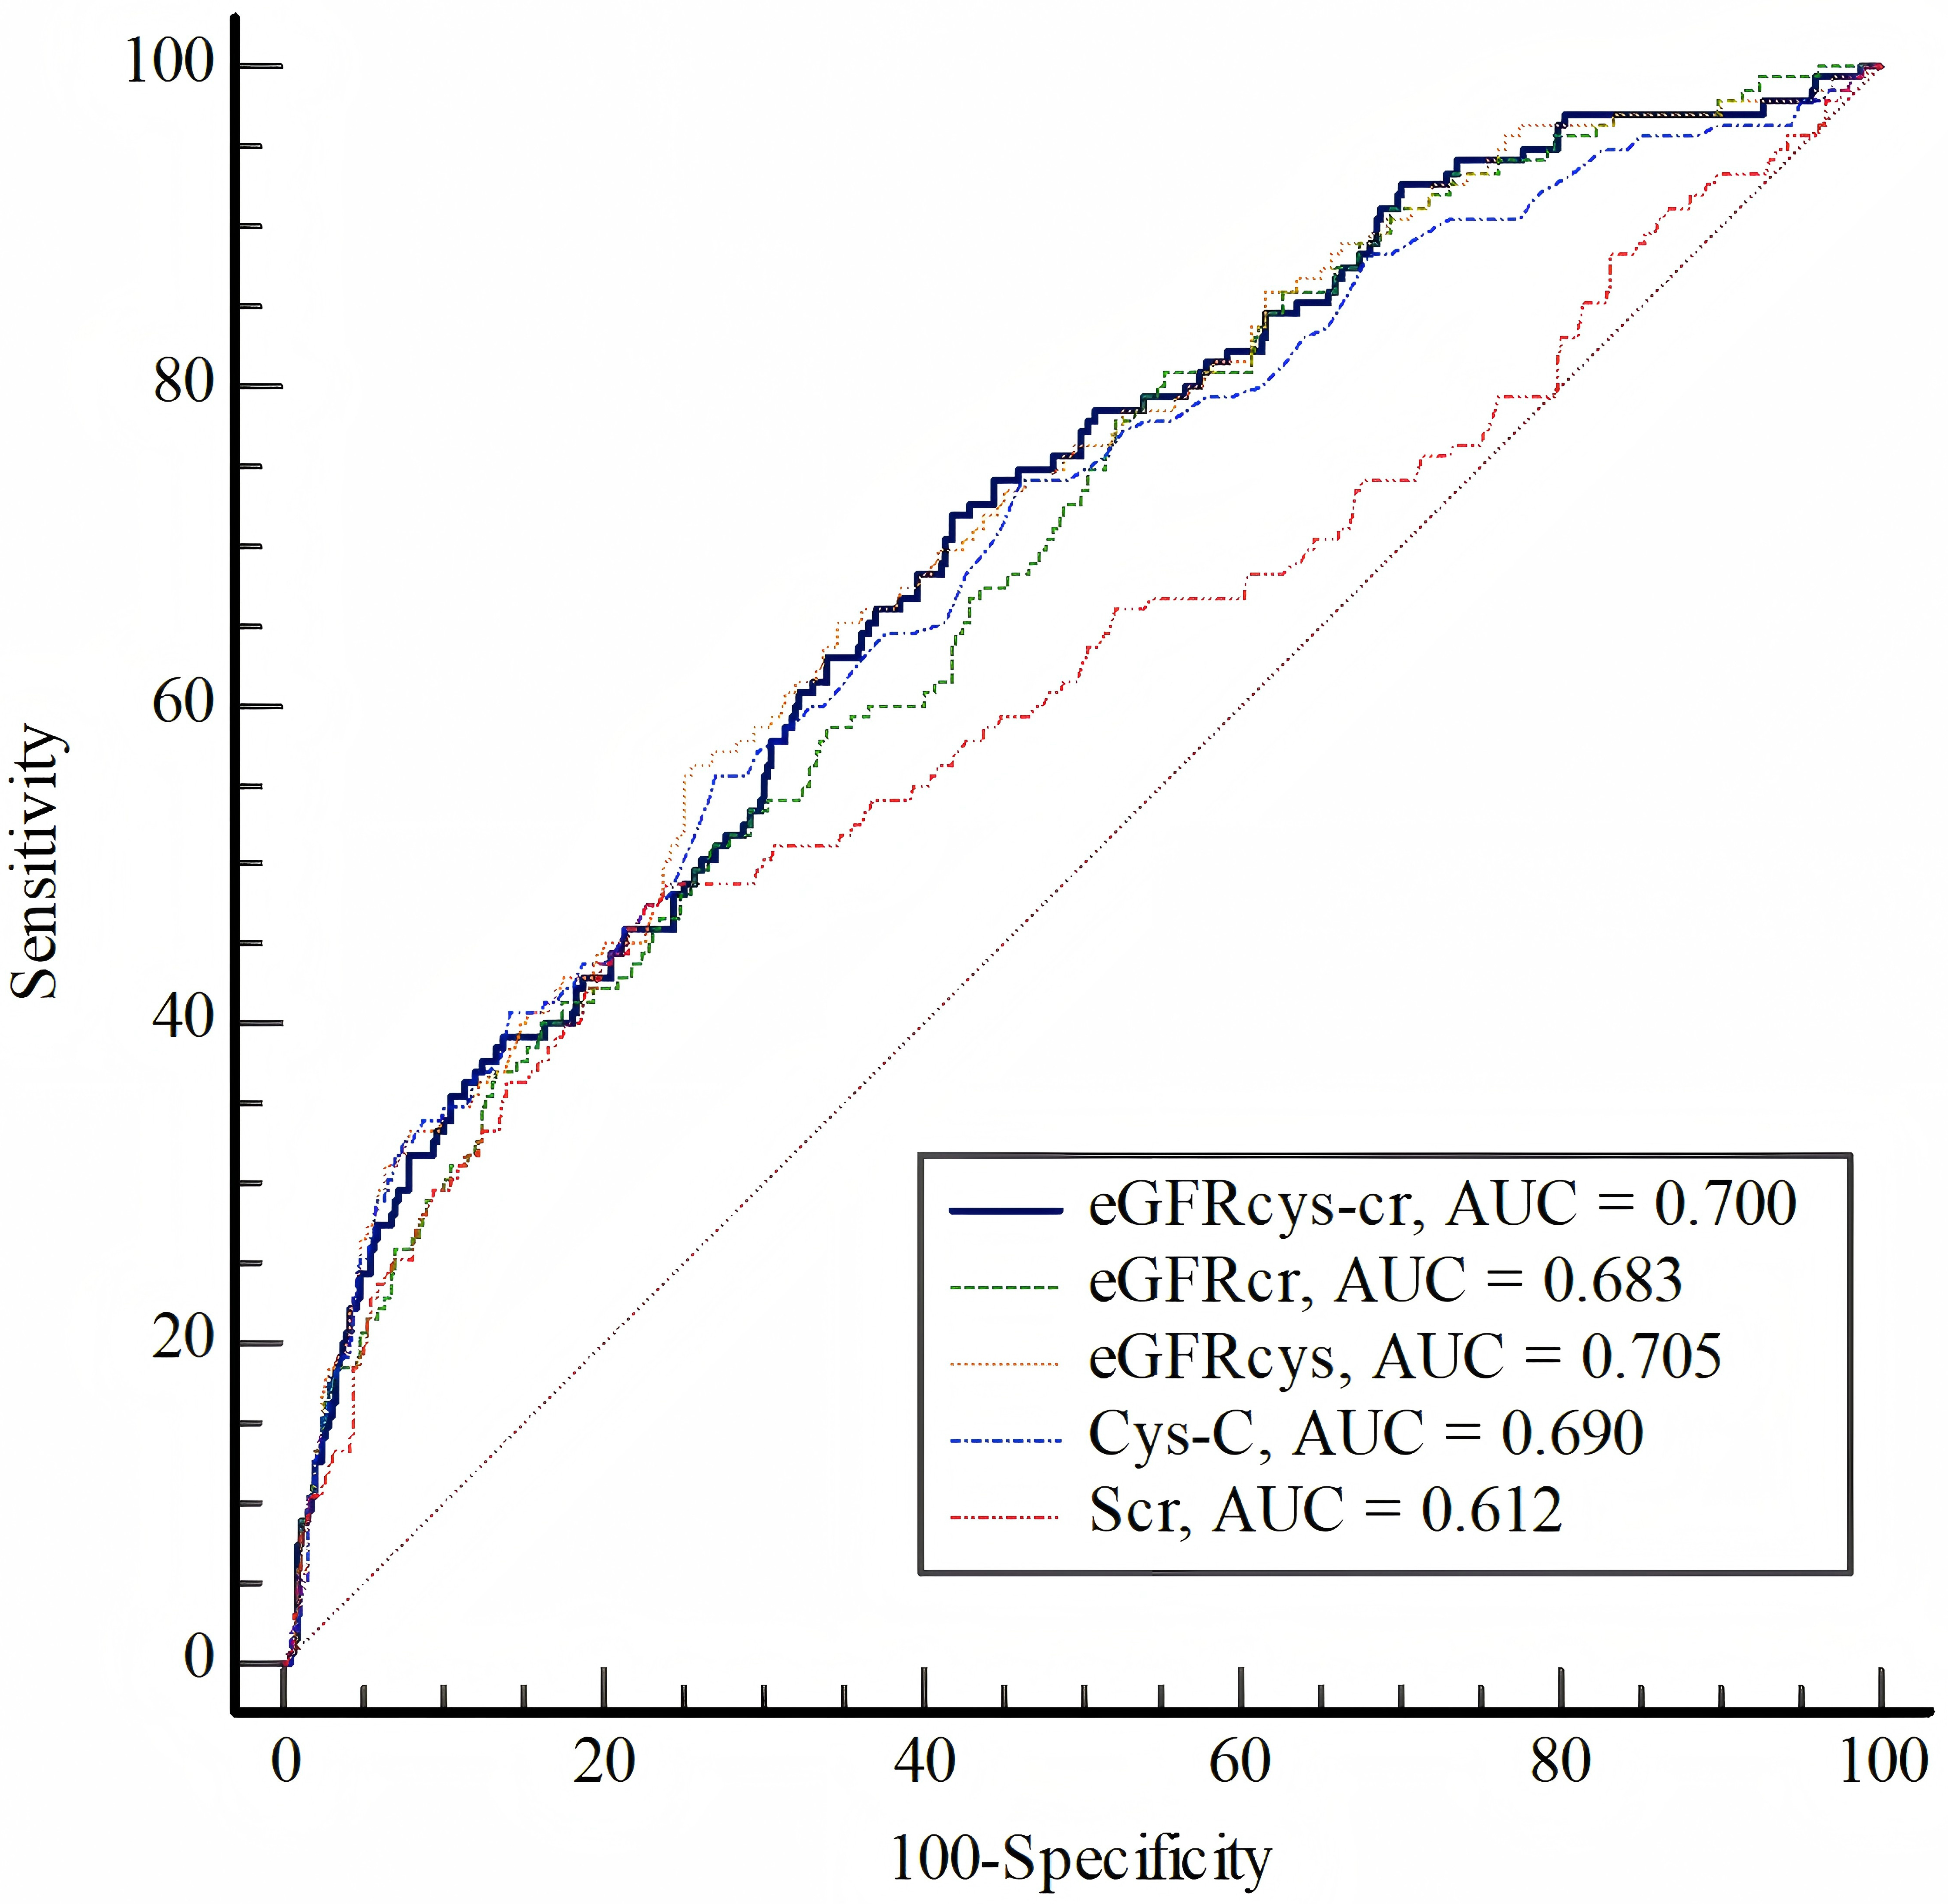 Fig. 3.
Receiver Operating Characteristic (ROC) analysis of the eGFRcys-cr, eGFR𝐜𝐲𝐬, eGFR𝐜𝐫, Creatinine and Cystatin C to predict MACEs.
The performance of integrating various eGFR measures into the baseline risk model for ACS undergoing PCI was analyzed. Likelihood ratio tests indicated significant enhancements in the prediction of MACEs when these eGFR metrics were added as continuous variables to the baseline risk model (Table 2). Models incorporating eGFRcys or eGFRcys-cr demonstrated lower corrected AIC and BIC values compared to those incorporating eGFRcr, indicating an improved model fit (Table 2).
| Akaike’s information criteria | BIC | Likelihood ratio test | ||||
| AICc | df | p value | ||||
| Baseline risk model | 1748.82 | 16.20 | 1783.45 | ref | ref | ref |
| Baseline risk model + eGFRcr | 1741.67 | 9.05 | 1779.18 | 9.18 | 1.00 | |
| Baseline risk model + eGFRcys | 1732.62 | 0.00 | 1770.13 | 18.23 | 1.00 | |
| Baseline risk model + eGFRcys-cr | 1734.76 | 2.14 | 1772.26 | 16.09 | 1.00 | |
Baseline risk model was adjusted for age, BMI, sex, HTN, DM, smoking, heart
rate, AMI, LVEF, Diuretics, Insulin, bSS. HTN, hypertension; DM, diabetes mellitus; eGFR, estimated glomerular filtration
rate; eGFRcys-cr, eGFR calculated using a combined creatinine-cystatin C
method; eGFRcys, eGFR calculated using cystatin C only; eGFRcr, eGFR
calculated using creatinine only; AICc, corrected Akaike’s information criterion;
The performance of these models, as estimated through internal bootstrap validation for predicting MACEs, is presented in Supplementary Table 6. The baseline risk model exhibited moderate discrimination with C-indices of 0.770. The inclusion of eGFRcr, eGFRcys, or eGFRcys-cr into the model significantly enhanced the C-index, with the highest improvement observed in models integrating eGFRcys (C-index: 0.780 for the baseline risk model). Additionally, the Brier scores for the baseline risk model were 0.144. Models including eGFRcys or eGFRcys-cr displayed lower Brier scores (0.154), indicating superior calibration. Calibration plots for MACEs demonstrated strong agreement between observed outcomes and predicted probabilities (Supplementary Fig. 1).
The addition of eGFRcys or eGFRcys-cr to the baseline risk model
resulted in significant improvements in risk reclassification for MACEs (Table 3), as assessed by cNRI>0 (all p
| cNRI>0 (95% CI) | p | IDI (95% CI) | p | |
| eGFRcr | Ref. | Ref. | Ref. | Ref. |
| eGFRcys | 0.154 (–0.044, 0.349) | 0.119 | 0.012 (–0.001, 0.027) | 0.080 |
| eGFRcys-cr | 0.205 (0.011, 0.397) | 0.030 | 0.010 (0.002, 0.019) | 0.010 |
| Baseline risk model | Ref. | Ref. | Ref. | Ref. |
| Baseline risk model + eGFRcr | 0.118 (–0.099, 0.255) | 0.209 | 0.007 (–0.001, 0.028) | 0.169 |
| Baseline risk model + eGFRcys | 0.187 (0.034, 0.321) | 0.021 | 0.015 (0.003, 0.045) | 0.020 |
| Baseline risk model + eGFRcys-cr | 0.124 (0.018, 0.290) | 0.032 | 0.013 (0.001, 0.046) | 0.039 |
Baseline risk model was adjusted for age, sex, BMI, HTN, DM, smoking, Heart rate, AMI, LVEF, Diuretics, Insulin, bSS. HTN, hypertension; DM, diabetes mellitus.
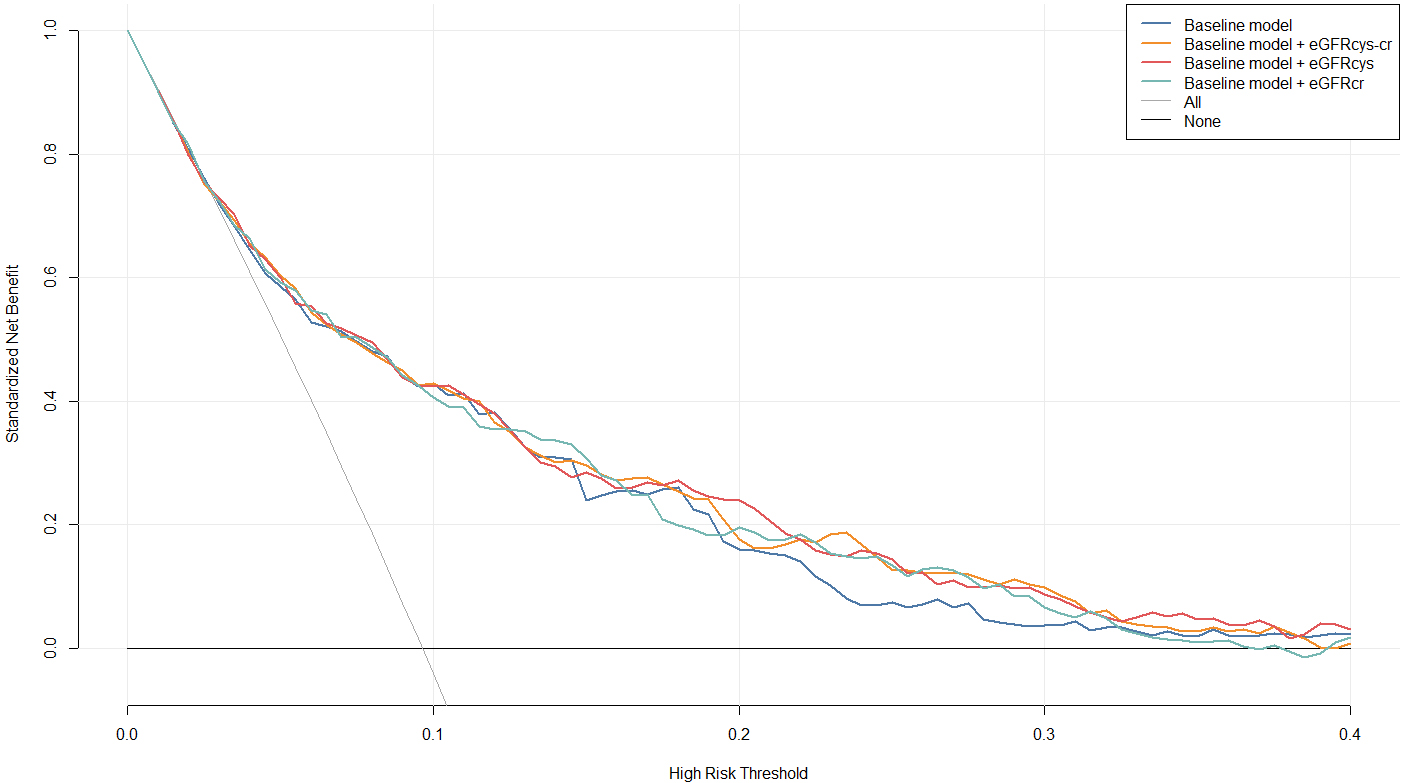
 Fig. 4.
Decision Curve Analysis (DCA). Net benefits for predicting MACEs using the baseline risk model and models incorporating eGFRcr, eGFRcys, and eGFRcys-cr. Baseline model was adjusted for age, BMI, sex, HTN, DM, smoking, Heart rate, AMI, LVEF, Diuretics, Insulin, bSS. HTN, hypertension; DM, diabetes mellitus.
Our findings demonstrate that incorporating cystatin C-based eGFR, particularly eGFRcys-cr using the CKD-EPI 2021 equations, significantly enhances the prediction of MACEs in this population compared to traditional creatinine-based measures alone. This suggests creatinine-cystatin C-based renal assessment may refine therapeutic and monitoring protocols in ACS patients after PCI.
Impaired renal function results in alterations in calcium and phosphorus metabolism, endothelial dysfunction, and increases oxidative stress and lipid metabolism disorders [3, 22, 23]. These factors independently contribute to the onset and poor prognosis of cardiovascular diseases, significantly elevating the risk of adverse cardiovascular events in patients with ACS [3]. Traditionally, serum creatinine levels and creatinine-based estimation formulas, such as the Modification of Diet in Renal Disease (MDRD) [24] or CKD-EPI equations [21, 25], are commonly used to calculate the eGFR. In recent years, eGFR estimation based on cystatin C, as well as combined creatinine and cystatin C estimation, has been shown to provide more accurate assessments of kidney function in certain diseases [8]. Higher cystatin C levels were associated with 2.53-fold mortality risk and 3.24-fold MACE risk in ACS patients [26]. Prior studies demonstrated that cystatin C-containing CKD-EPI equations (2012) outperform creatinine-based eGFR for ACS risk stratification [19]. In our study, lower eGFR values, as determined by the eGFRcr, eGFRcys, and eGFRcys-cr equations, were associated with an increased risk of MACEs, resulting in better predictive values than using serum creatinine alone.
We found that incorporating cystatin C-based eGFR (eGFRcys or eGFRcys-cr) improves the predictive capability of the established risk models for MACEs. However, eGFRcr alone did not enhance the predictive ability for adverse cardiovascular events. This is generally consistent with previous research findings. The Stabilization of Plaques Using Darapladib-Thrombolysis in Myocardial Infarction (SOLID-TIMI) 52 trial showed that cystatin C improved the prediction of cardiovascular disease/heart failure (CVD/HF) hospitalization when added to a non-eGFR adjusted model in ACS [15]. Inês Almeida et al. [19] found that eGFRcys, calculated using the CKD-EPI 2012 equation, offers a novel and superior method for assessing mortality risk in patients admitted for ACS. This method outperforms the MDRD-4 equation and enhances the predictive value of the GRACE score [19]. The superior performance of eGFRcys and eGFRcys-cr in predicting cardiovascular outcomes can be attributed to several factors related to their underlying pathophysiology. Cystatin C is less influenced by muscle mass, inflammation, gender, ethnicity, and diet compared to serum creatinine, offering a more consistent reflection of the glomerular filtration rate across diverse patient populations, serving as a more sensitive and specific biomarker for the early detection of impaired kidney function [7, 8, 27]. Consequently, this leads to more accurate risk stratification, which is particularly critical in the ACS population where comorbidities such as frailty and malnutrition can alter creatinine-based estimates.
Furthermore, our study revealed that, despite the AUC value of eGFRcys being greater than that of eGFRcys-cr, the latter remarkably improved the reclassification of MACEs compared to eGFRcr. In contrast, eGFRcys did not demonstrate a similar benefit, which is consistent with previous research findings. Although cystatin C is more sensitive than serum creatinine for detecting early impairment of kidney function, it is also influenced by factors such as obesity, smoking, inflammation, thyroid activity, and glucocorticoid levels, which can result in potential overestimation of kidney damage [8, 28]. Numerous studies have shown that the accuracy of eGFR using both cystatin C and creatinine, which reduces the measurement errors associated with both filtration markers, surpasses that of estimates using either creatinine or cystatin C alone [8, 21, 29]. Besides, our study demonstrates that among individuals who have experienced MACEs, the proportion of patients identified with an eGFR of less than 60 mL/min/1.73 m2 by eGFRcys [97 (71.9%)] is significantly higher than those identified using eGFRcys-cr [62 (45.9%)] or eGFRcr [44 (32.6%)]. Statistically, eGFRcys may detect a greater number of patients with an adverse prognosis in various patient populations. However, it also tends to classify more borderline cases as high-risk, which may increase the risk of misclassification. Consequently, from the perspective of precision medicine and individualized risk prediction, the eGFRcys-cr equation may provide superior reclassification capabilities in clinical practice, thus enhancing its clinical utility.
The 2024 Kidney Disease: Improving Global Outcomes (KDIGO) guidelines for the management and evaluation of CKD recommend using an eGFR that combines cystatin C and creatinine to stage kidney function [7]. Additionally, they advise that cardiovascular risk prediction models for CKD patients should incorporate both eGFR and proteinuria [7]. In 2023, the American Heart Association (AHA) issued a Presidential Advisory on cardiovascular-renal-metabolic syndrome (CKM), highlighting the relationship of cardiovascular disease, CKD, and metabolic disorders [30]. The advisory emphasized the necessity of integrating kidney function into cardiovascular risk assessments. This underscores the need for more precise and individualized evaluation of kidney function. Moreover, traditional prognostic models for ACS patients, such as the GRACE score [20], often overlook kidney function or assess it solely based on serum creatinine levels, which is inadequate for precise, personalized management.
Thus, incorporating cystatin C into existing prognostic models has significant clinical implications, particularly for ACS patients. First, it enhances risk stratification by more accurately identifying high-risk individuals, enabling clinicians to allocate more intensive monitoring and targeted therapeutic interventions [7, 8]. This is crucial for ACS patients, as refined stratification allows for better management of conditions affecting muscle mass or in those with advanced age, which are common challenges in creatinine-based assessments. Moreover, the updated CKD-EPI 2021 equations, which incorporate both cystatin C and creatinine, ensure equitable prognostication across racial and ethnic populations by eliminating race as a variable. This equitable approach is essential in providing personalized care that meets the diverse needs of ACS patients.
Despite the robustness of our study, several limitations must be acknowledged. First, although we thoroughly adjusted for clinical and biochemical variables, residual confounding—notably potential interference from contrast agents on renal function biomarkers—persists due to the inherent limitations of our retrospective observational design. Second, the generalization of our findings may be constrained by the study’s single-center design based on a Chinese population. Future multicenter studies that include a more diverse cohort would be necessary to validate these findings across different populations. Furthermore, our current approach evaluates the impact of the eGFR measured at a single point during hospitalization on long-term prognosis. However, fluctuations in kidney function throughout the hospital stay may introduce bias. Future research should consider assessing kidney function immediately before discharge to enhance the predictive value for long-term outcomes and minimize potential bias. Additionally, while eGFRcys and eGFRcys-cr provide improved prognostic value, the integration of even more specific biomarkers associated with inflammation, endothelial dysfunction, and cardiovascular stress could further enhance prediction models. Emerging biomarkers in cardiovascular and renal pathology, such as genomic and metabolic markers [31], could be explored in conjunction with cystatin C to develop more comprehensive risk stratification tools.
In summary, our study highlights the significant incremental prognostic value of cystatin C-based eGFR equation, particularly the CKD-EPI 2021 equation that incorporates both cystatin C and creatinine, in ACS patients when compared to creatinine-based eGFR equation. This approach will aid in risk stratification and the development of precise, individualized secondary prevention strategies for ACS patients.
The datasets used and analyzed in the study are available from the corresponding author upon reasonable request.
QC, and YKL drafted the manuscript, and were major contributors in the collection, analysis and interpretation of data. XC, HMH, YYX, YHX, YC, TY, YXG, and SQX were major contributors in the acquisition and interpretation of data and contributed to revision of the manuscript. LC and JGZ designed the study and provided constructive suggestions for revisions of the manuscript. All authors read and approved the final manuscript. All authors have participated sufficiently in the work and agreed to be accountable for all aspects of the work.
The ethics committee of the Third People’s Hospital of Chengdu approved this study (ethical approval number [2019S-67]), which was conducted in full compliance with the Declaration of Helsinki. Informed consent was obtained from all participants in written.
The authors would like to thank all the participants.
This work was supported by National High Level Hospital Clinical Research Funding (2024-NHLHCRF-YS-01), Beijing Research Ward Construction Clinical Research Project (2022-YJXBF-04-03), National Natural Science Foundation of China (No. 82270352), Capital’s Founds for Health Improvement and Research (No. 2022-1-4062), Chinese Society of Cardiology’s Foundation (No. CSCF2021B02), National High Level Hospital Clinical Research Funding (2023-NHLHCRF-YXHZ-ZRMS-09), and Chengdu High-level Key Clinical Specialty Construction Project.
The authors declare no conflict of interest.
Supplementary material associated with this article can be found, in the online version, at https://doi.org/10.31083/RCM39246.
References
Publisher’s Note: IMR Press stays neutral with regard to jurisdictional claims in published maps and institutional affiliations.