


 , Tianze Wang 2,†, Manyun Tang 3, Peizhu Dang 4, Changying Zhao 5, Yang Yan 5, Jianying Li 6, Tao Shi 5, Jianxin Guo 1,*
1 Department of Radiology, The First Affiliated Hospital of Xi’an Jiaotong University, 710061 Xi’an, Shaanxi, China
2 Department of Neurosurgery, The First Affiliated Hospital of Xi’an Jiaotong University, 710061 Xi’an, Shaanxi, China
3 Department of Hepatobiliary Surgery, The First Affiliated Hospital of Xi’an Jiaotong University, 710061 Xi’an, Shaanxi, China
4 Department of Cardiovascular Medicine, The First Affiliated Hospital of Xi’an Jiaotong University, 710061 Xi’an, Shaanxi, China
5 Department of Cardiovascular Surgery, The First Affiliated Hospital of Xi’an Jiaotong University, 710061 Xi’an, Shaanxi, China
6 GE Healthcare, Computed Tomography Research Center, 100000 Beijing, China
†These authors contributed equally.
Abstract
Atrial fibrillation (AF) can increase the risk of stroke by five-fold; strokes associated with AF are more likely to lead to death or severe disability in patients. Thus, preventing the formation of thrombosis is of vital importance in the treatment of patients with AF. Epicardial adipose tissue (EAT) is a risk factor for AF and is closely associated with many AF-related complications. However, to our knowledge, no in-depth studies on the relationship between the incidence of thrombosis in AF patients and EAT have been conducted. Therefore, it is of great clinical significance to explore the potential of EAT quantification in predicting intra-atrial thrombosis in patients with AF.
This is a case–control study; patients with AF who underwent coronary computed tomography angiography (CCTA) were included. These patients were divided into the thrombus group and the non-thrombus group according to the results of transesophageal echocardiography (TEE). The volume of EAT, the mean density of EAT, and the ratio of EAT volume to the whole heart volume were measured by CCTA, and the data of the two groups were compared. Meanwhile, the diagnostic efficiency of using these parameters was analyzed.
A total of 308 patients with AF who underwent both TEE and CCTA were enrolled in this study. After a 1:1 propensity score matching (PSM) analysis based on age and sex, a total of 76 patients were finally included. Compared with the patients in the non-thrombus group, those in the thrombus group had a larger volume of EAT (132.38 ± 45.25 cm3 vs. 95.51 ± 25.38 cm3; p < 0.001) and a higher ratio of EAT volume to the whole heart volume (0.13 ± 0.05 vs. 0.10 ± 0.03; p < 0.05). However, there was no difference in the mean density of EAT between the two groups. The volume of EAT was identified as an independent risk factor (odds ratio = 1.042; p = 0.003). Moreover, the receiver operating characteristic (ROC) analysis presented the EAT volume as a potential diagnostic value in predicting intra-atrial thrombus in AF patients, with an area under the curve (AUC) of 0.755.
The EAT volume may be a potential biomarker for predicting intra-atrial thrombosis in patients with AF; however, further validation is required to confirm the diagnostic value.
Keywords
- epicardial adipose tissue
- prediction
- intra-atrial thrombus
- atrial fibrillation
Atrial fibrillation (AF) is a cardiovascular disease associated with a higher risk of complications and mortality [1]. Epidemiological evidence has shown that the incidence and prevalence of AF have increased significantly in the past 20 years [2, 3]; one of the most concerning complications associated with AF is a stroke caused by left atrial thrombus [4]. Cardiomyopathy often accompanies the later stage of AF. Through various mechanisms such as inflammation, oxidative stress, and stretching, it will further lead to fibrosis, electrophysiological and autonomic nerve remodeling, as well as a pre-thrombotic state. The complex interactions among these mechanisms increase the risks of stroke and other thromboembolic events. Previous studies have shown that AF can increase the risk of stroke by five-fold [5, 6], and the strokes associated with AF are more likely to be fatal or severely incapacitating [2, 3]. AF is estimated to be responsible for 15% of all strokes worldwide. Thus, a more comprehensive understanding of this association and the development of intensive stroke prevention measures are needed. Moreover, preventing thrombosis in the treatment of patients with AF is critical.
Obesity is an independent risk factor for AF [7]. An increasing amount of evidence indicates that epicardial adipose tissue (EAT), as a manifestation of visceral obesity, is considered to be closely associated with the occurrence and development of AF [8, 9, 10]. EAT is a type of visceral adipose tissue deposited on the surface of the heart, which has special anatomy, physiology, biochemistry, and the characteristics of secreting various adipose cytokines [11, 12]. Furthermore, EAT can affect the myocardium and coronary artery through paracrine regulation and the capillary mechanism, thus affecting cardiac and metabolic functions. Many studies have concluded that EAT is a risk factor for AF and is closely related to many AF complications [13, 14]. However, to our knowledge, no in-depth study on the relationship between the incidence of thrombus formation in AF patients and EAT has previously been performed.
Although transesophageal echocardiography (TEE) represents the gold standard for thrombosis after AF, TEE is an invasive examination and is not suitable for large-scale implementation. Therefore, coronary computed tomography angiography (CCTA) is a commonly used clinical cardiac examination method with the characteristics of being non-invasive, safe, and cheap. Consequently, using EAT in CCTA images is of great significance to quantitatively predict atrial thrombus in patients with AF.
This study recruited AF patients who had received both CCTA and TEE and compared EAT characteristics among patients with and without intra-atrial thrombus to investigate the potential of EAT quantification in predicting intra-atrial thrombus in AF patients.
This was a single-center, retrospective, case–control study that enrolled patients with AF who received TEE and CCTA examinations in our hospital between January 2010 and August 2022. The inclusion criteria included the following: (1) patients were clinically diagnosed with AF by standard 12-lead electrocardiogram (ECG) or 24 h Holter monitor, (2) patients underwent TEE and CCTA examinations within one week. The exclusion criteria included patients with incomplete clinical and imaging information. The subjects were then divided into the thrombus group and the non-thrombus group according to the TEE results. To control for bias, the final number of patients included in each group was determined after a 1:1 propensity score matching (PSM) analysis based on age and sex (Fig. 1).
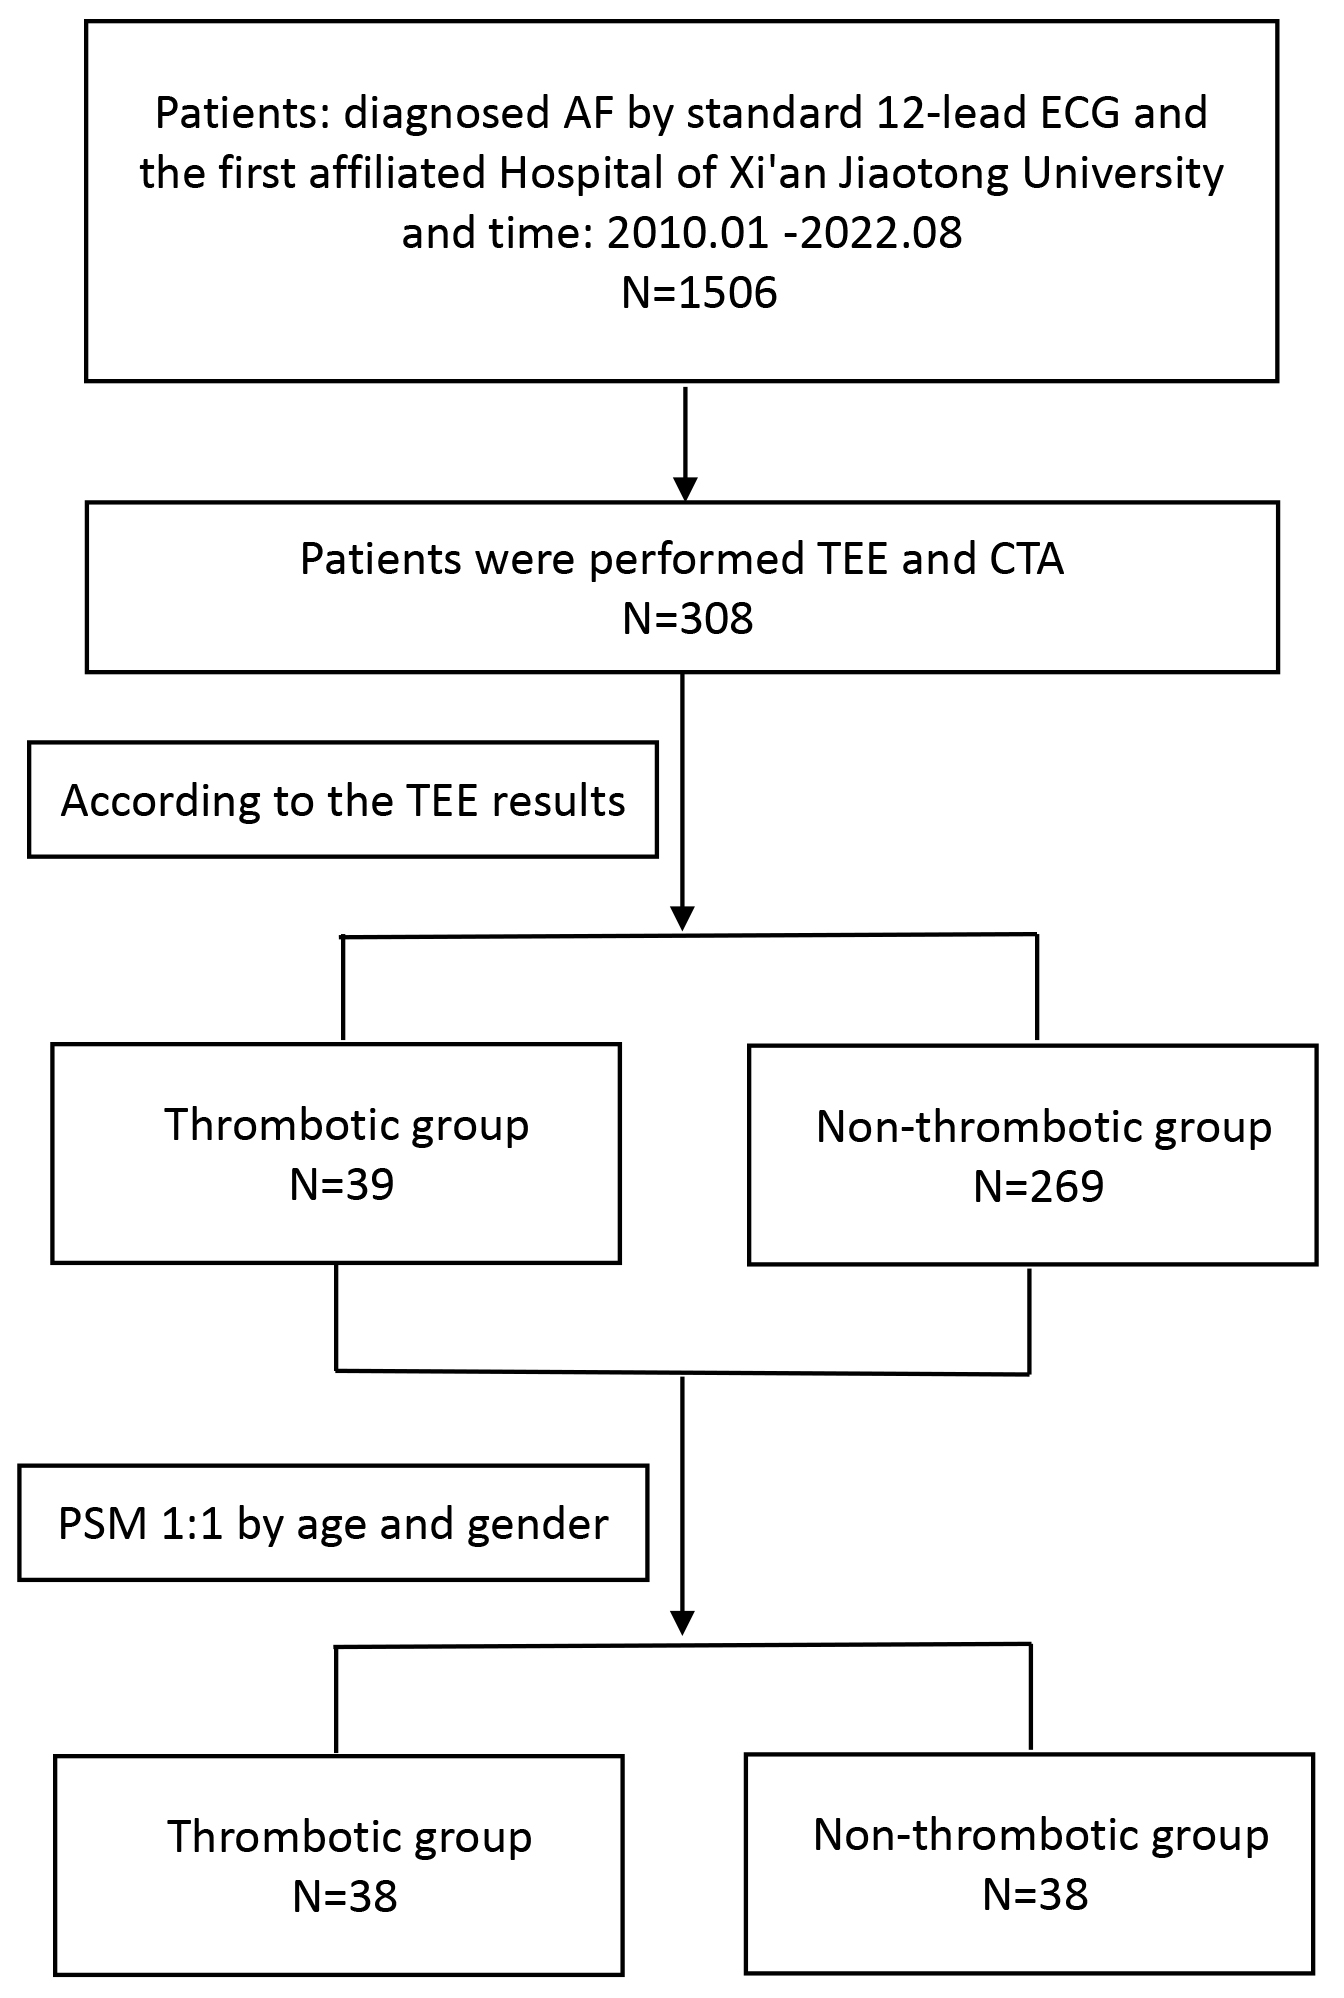 Fig. 1.
Flowchart of the EAT volume for predicting thrombotic events in AF patients. Note: AF, atrial fibrillation; TEE, transesophageal echocardiography; CTA, computerized tomography angiography; PSM, propensity score matching; EAT, epicardial adipose tissue; ECG, electrocardiogram.
This study was approved by the Ethics Committee of our hospital (NO. XJTU1AF2023LSK-168). Since this study was observational in nature, the requirement for patient-informed consent was waived.
All CCTA scans were conducted using a 256-slice computed tomography (CT) scanner
with a 160 mm-wide detector collimation (Revolution CT, GE HealthCare, Waukesha,
WI, USA). The scans were performed in a prospective electrocardiogram-triggered
cardiac scan mode and completed within one heartbeat. All subjects were scanned
in a free-breathing state. Patients were required to remain stable and take
shallow breaths during the scanning process. The scanning parameters were as
follows: tube voltage: 120 kV; tube current: smart mA (100–700 mA); gantry
rotation speed: 0.28 s per revolution; detector width: adjusted between 120 and
160 mm according to the heart size of the patient. A total of 40–50 mL of the
non-ionic contrast agent Iopamidol (350 mgI/mL) was injected into the anterior
cubital vein with a high-pressure syringe at a flow rate of 4–5 mL/s, followed
by the injection of 30 mL of 0.9% sodium chloride solution at the same flow
rate. The bolus tracking technique was employed, and a region of interest (ROI)
was selected at the aortic level to monitor the increase in the CT value. The
scan was triggered when the CT value in the ROI exceeded 220 Hounsfield units
(HUs), and the actual scan started after a delay of 1.6 s. A dedicated
workstation (Advanced Workstation 4.6, GE HealthCare) was used to reconstruct the
CCTA images with an image slice thickness of 0.625 mm. Two experienced
radiologists (both with over 20 years of experience in reading CCTA images)
separately reconstructed the appropriate cardiac phase images in three dimensions
on a post-processing workstation (Advanced Workstation 4.6, GE HealthCare,
Beijing, China), and manually outlined the epicardial boundary layer by layer
using the VolumeViewer software (Shanghai United Imaging Healthcare, Shanghai,
China). The two radiologists conducted the relevant measurements separately. The
specific steps were as follows: (1) The approximate range of adipose tissue
around the heart was delimited with a rectangular frame. The upper margin was at
the level of the pulmonary valve, the lower margin was at the level of the
diaphragm, the front reached the sternum, and the back reached the esophagus; (2)
a manual depiction of the boundary along the pericardium every five layers in the
cross-section; (3) defined CT value range of the EAT as –190 to –30 HUs; (4)
the VolumeViewer software generated the EAT volume, the mean density of the EAT,
and the whole heart volume, and the EAT volume/whole heart volume ratio was
calculated (Fig. 2). If the measurement results of the two radiologists showed
good consistency (with the intra-class correlation coefficient (ICC)
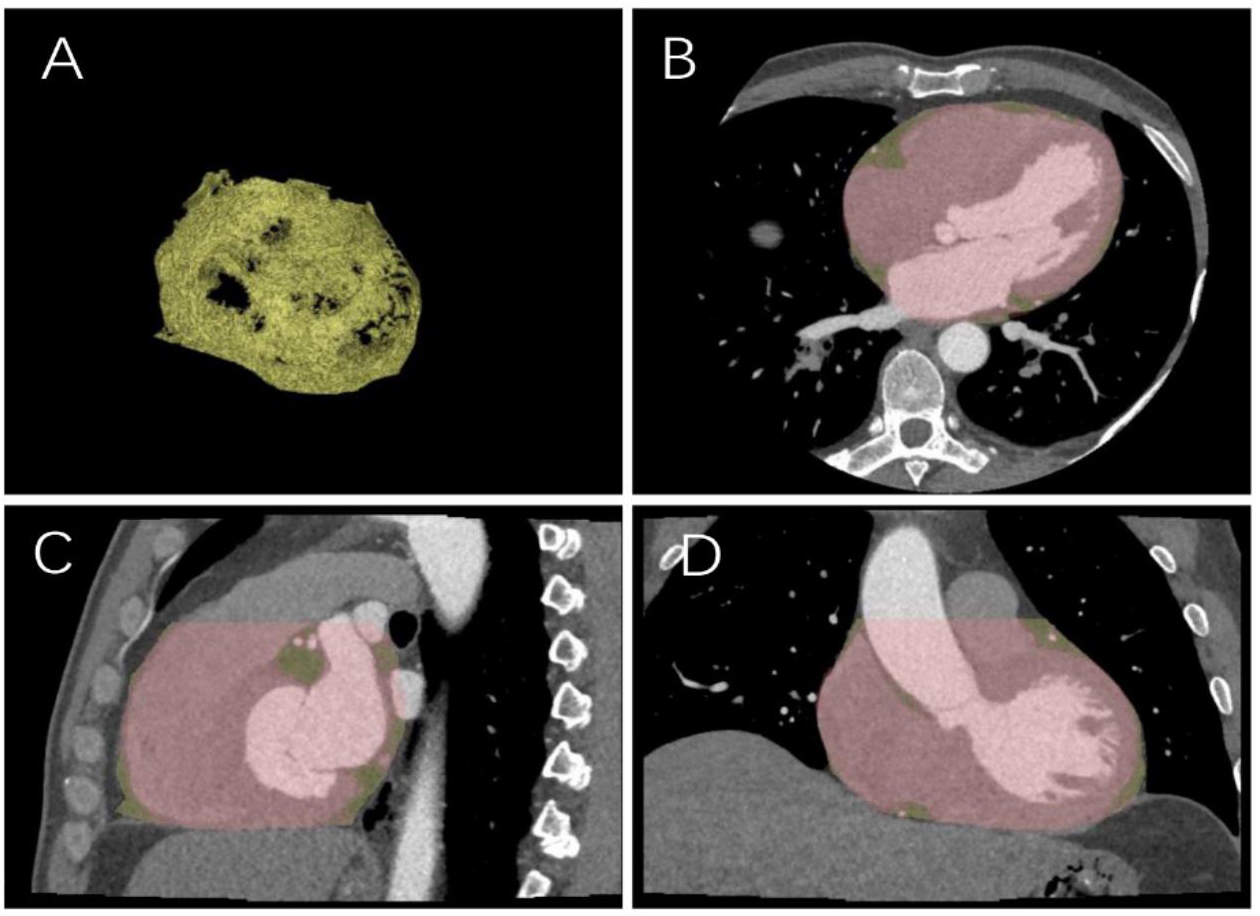 Fig. 2.
Sketch diagram of epicardial fat. (A) Epicardial fat diagram. (B) Axial cardiac image. (C) Sagittal cardiac image. (D) Coronal cardiac image.
Statistical analysis was performed using SPSS software (version 26, IBM, Armonk,
NY, USA). PSM was conducted based on gender and age to reduce bias, with study
subjects matched at a 1:1 ratio. If normality was satisfied for quantitative
data, the data were presented as the mean (
A total of 308 patients were initially considered. After PSM, 76 patients were
finally enrolled, 38 of whom were in the thrombus group; the baseline
characteristics are shown in Table 1. There was no significant difference in age,
sex, body mass index (BMI), diabetes mellitus (DM), hypertension (HTN), coronary
heart disease (CHD), or oral anticoagulant (OAC) use. In the thrombus group, the
EAT volume (132.38
| Variable | Atrial fibrillation with thrombus group | Atrial fibrillation with non-thrombus group | p-value |
| Sex (male/female) | 38 (20/18) | 38 (23/15) | 0.494 |
| Age (y) | 64.92 |
65.29 |
0.833 |
| BMI (kg/m2) | 24.33 |
25.54 |
0.113 |
| EAT (cm3) | 132.38 |
95.51 |
|
| Ratio | 0.13 |
0.10 |
0.004 |
| HU | –82.56 |
–80.89 |
0.224 |
| DM | 0.89 |
0.95 |
0.402 |
| HTN | 0.71 |
0.50 |
0.062 |
| CHD | 0.95 |
0.89 |
0.042 |
| OACs | 0.68 |
0.42 |
0.021 |
Ratio, EAT volume-to-whole heart volume ratio; HU, Hounsfield unit; BMI, body mass index; DM, diabetes mellitus; HTN, hypertension; CHD, coronary heart disease; OACs, oral anticoagulants; EAT, epicardial adipose tissue.
The ICC test was used for the intra-group correlation to examine the consistency of the data measured by the two radiologists; the ICC value was 0.980 (Table 2).
| Intraclass correlation | 95% confidence interval | ||
| Lower bound | Upper bound | ||
| Single measure | 0.961 | 0.936 | 0.977 |
| Average measure | 0.980 | 0.967 | 0.988 |
When the occurrence of thrombosis was used as the dependent variable, and gender, age, BMI, DM, HTN, CHD, OAC, EAT volume, average density, and the ratio of EAT volume to whole heart volume were applied as independent variables, logistic regression analysis identified that the EAT volume was an independent risk factor for the formation of intra-atrial thrombus in patients with AF (Table 3).
| Variables in the Equation | |||||||
| B | S.E. | Wald | Sig | Exp(B) | 95% Confidence Interval | ||
| Lower | Upper | ||||||
| Sex (1) | 0.574 | 0.594 | 0.932 | 0.334 | 1.775 | 0.554 | 5.690 |
| Age | –0.037 | 0.037 | 0.986 | 0.321 | 0.964 | 0.896 | 5.690 |
| EAT | 0.041 | 0.014 | 8.898 | 0.003 | 1.042 | 1.014 | 1.037 |
| Ratio | –5.397 | 12.451 | 0.188 | 0.665 | 0.005 | 0 | 1.037 |
| HU | 0.070 | 0.059 | 1.408 | 0.235 | 1.073 | 0.955 | 1.071 |
Variable(s) entered on step 1: sex (1: female, 2: male), age (y), EAT (EAT volume in cm3), ratio (EAT volume-to-whole heart volume ratio), HU (average EAT density). EAT, epicardial adipose tissue; HU, Hounsfield unit.
By analyzing the ROC curves and comparing the area under the curve (AUC) (Fig. 3
and Table 4), the EAT volume (AUC = 0.755) and the ratio of EAT volume to whole
heart volume (AUC = 0.661) demonstrated potential diagnostic values in predicting
intra-atrial thrombus in patients with AF. Upon calculation, the sensitivity and
specificity of EAT volume in predicting thrombus formation after AF at a value of
137.05 cm3 were 52.6% and 99%, respectively. This indicates that compared
with other patients, those with an EAT volume
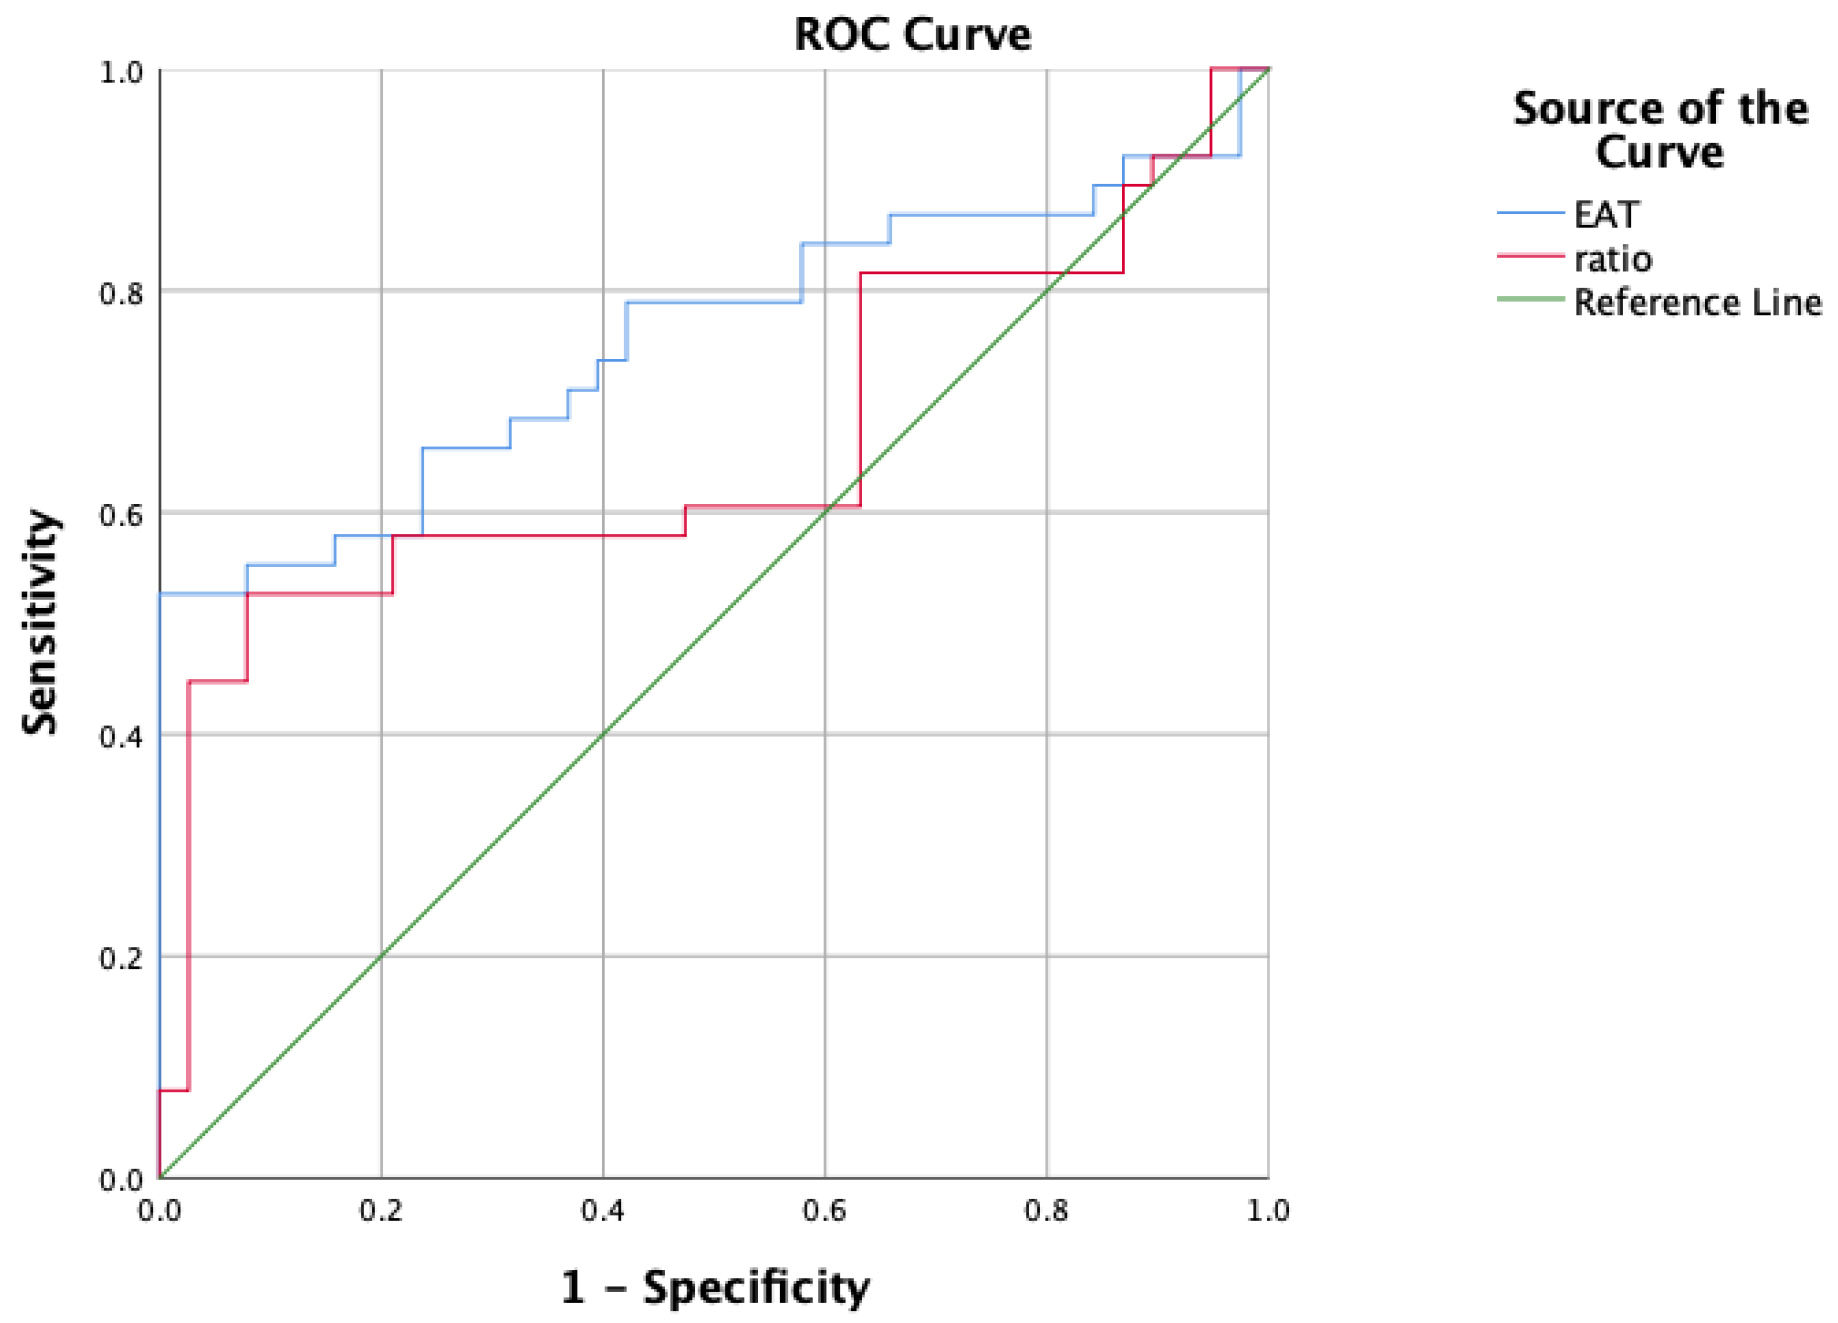 Fig. 3.
ROC curve for predicting thrombotic events in AF patients using EAT volume. Note: ratio, EAT volume-to-whole heart volume ratio; ROC, receiver operating characteristic; AF, atrial fibrillation; EAT, epicardial adipose tissue.
| Test result variable(s) | Area | 95% confidence interval | |
| Lower bound | Upper bound | ||
| EAT | 0.755 | 0.641 | 0.868 |
| Ratio | 0.661 | 0.532 | 0.789 |
EAT, epicardial adipose tissue.
This study explored the potential of quantifying EAT in predicting intra-atrial thrombus in patients with AF through logistic regression analysis and ROC curves. Our findings indicate that the EAT volume is an independent risk factor and exhibits good diagnostic efficacy in predicting thrombus formation in AF patients. Additionally, we discovered that the ratio of EAT volume to the whole heart volume is higher in AF patients with thrombus. However, the logistic regression analysis reveals that this ratio is not an independent risk factor. Many studies [15, 16] have highlighted that the EAT is a risk factor for AF. Zhu et al. [10] conducted a systematic review and analysis of the relationship between the EAT volume and AF. The study [17] showed that in ten case studies, both the total EAT volume and the EAT volume around the left atrium in patients with AF increased significantly; the amount of EAT may be associated with an increased risk of AF. Kogo et al. [11] surveyed 77 patients who underwent cardiac surgery and found that there was a strong association between high EAT volume and the occurrence of postoperative AF (POAF), confirming the relationship between EAT and AF. However, EAT volume as a risk factor for thrombosis after AF remains under debate. A study [18] has found that EAT may be involved in the formation of thrombus in the pre-thrombus state in patients with AF. Liu et al. [12] conducted a study on 90 patients with non-valvular AF who had undergone radiofrequency catheter ablation. Baseline data and concomitant diseases were recorded, and indicators of the coagulation status were measured. Meanwhile, the total EAT volume (EAT-total) and the EAT volume around the left atrium (EAT-LA) were simultaneously recorded. A statistical analysis was conducted on the correlations between EAT-total, EAT-LA, and the blood coagulation status indicators. The analysis presented that both EAT-total and EAT-LA were positively correlated with D-dimer and fibrinogen (FIB), and there was an independent association. The study [19] suggests that EAT in patients with AF may be involved in the formation of the pre-thrombotic state during AF, and the EAT volume may be an independent risk predictor for thromboembolism in patients with AF. Ju et al. [13] studied the factors of thrombosis recurrence in patients after surgical treatment and highlighted that EAT was significantly higher after one-stop treatment, suggesting that EAT may be a risk factor for increased thromboembolic events after one-stop treatment. The Ju et al. [13] study shares certain similarities with ours, which provides a starting point and theoretical support for our research. We studied the occurrence of untreated thromboembolism in our patients, with a greater emphasis on prevention than in previous studies, hoping to demonstrate that EAT prevents a factor in thrombosis.
At present, the mechanism through which EAT leads to thrombosis in AF patients remains unclear. Nonetheless, there is growing evidence that inflammation may be the cause of how EAT affects thrombosis after AF. Indeed, prior studies [20, 21] have found that EAT has strong biological activity and can secrete various proinflammatory factors. The inflammatory response and activation of coagulation do not work independently, but cooperate in a complex and synchronous manner [22]; meanwhile, inflammation has been shown to cause endothelial dysfunction, promote the formation of a pro-thrombus state, and lead to the occurrence of thromboembolism [9]. Mazurek et al. [9] observed EAT glucose metabolism using electron emission computed tomography and found that the EAT glucose metabolism of patients in the AF group was significantly higher than that in the control group, which confirmed that the EAT in patients with AF had higher inflammatory activity compared with normal people. In addition, some scholars [23] have reported that EAT thickness in patients with AF is significantly correlated with the ratio between neutrophils and lymphocytes, which is a reliable indicator of inflammation. Therefore, there is reason to suspect that EAT in patients with non-valvular AF is involved in the formation of a pre-thrombus state in AF and promotes the formation of thrombus in AF by causing local and systemic inflammation.
In addition, we speculate that the impact of EAT on thrombus formation in patients with AF may be related to the duration of AF. Nagashima et al. [24] found that patients with persistent AF had a larger volume of EAT and higher levels of high-sensitivity C-reactive protein and interleukin-6 compared to patients with paroxysmal AF. Some studies [25, 26, 27, 28] have also shown that patients with persistent or permanent AF have a higher risk of stroke than those with paroxysmal AF, and the duration of AF may influence thrombus formation. Therefore, we believe that the higher incidence of thrombus formation in patients with persistent AF may be due to the significant increase in the level of C-reactive protein, which is an important indicator of inflammation. We hope to investigate further whether thrombus formation in patients with AF is related to the duration of AF and the level of inflammation in the future. We acknowledge that there are some limitations in our study. Firstly, this was a single-center, retrospective, observational study, with a small sample size in the thrombus group. Secondly, we performed the manual delineation of EAT in the workstation, which could have introduced a slight error. Although we tested the consistency, we still actively explored the realization of artificial intelligence automatic delineation to reduce the bias further. Finally, EAT alone cannot completely exclude or confirm the existence of intra-atrial thrombus. To provide more accurate predictions, increased data and other clinical markers are needed to enhance and refine the prediction in the future.
The EAT volume may serve as an important imaging marker for predicting intra-atrial thrombosis in patients with AF. This finding provides a new perspective for assessing the risk of thrombosis in AF patients and is expected to assist clinicians in accurately identifying those at high risk of intra-atrial thrombosis, thus enabling early warning and the formulation of personalized thrombosis prevention and treatment strategies. In the future, it is necessary to incorporate more evaluation parameters and expand the sample size to conduct in-depth research, to provide more solid evidence to support the precision medicine of AF patients with thrombosis-related complications.
All data generated or analysed during this study are included in this published article.
HW: Significant contributions to conception and design, data acquisition, or data analysis and interpretation; Drafting or critically revising essays for important intellectual content; Final approval of the version for publication. TW: Made significant contributions to data acquisition or data analysis and interpretation; Draft or critically revise articles for important intellectual content. MT: Drafted or critically revised the article for important intellectual content. PD: Drafting or critically revising the article for important intellectual content. CZ: Drafted or critically revised the article for important intellectual content. YY: Significant contribution to the concept and design; Draft or critically revise articles for important intellectual content. JL: Made significant contributions to data analysis and interpretation, drafted or critically revised the article for important intellectual content. JG: Significant contributions to concept and design; Final approval of the version for publication. TS: Significant contributions to concept and design. All authors contributed to the conception and editorial changes in the manuscript. All authors read and approved the final manuscript. All authors have participated sufficiently in the work and agreed to be accountable for all aspects of the work.
The study was conducted according to the guidelines of the Declaration of Helsinki, and approved by the Ethics Committee of the First Affiliated Hospital of Xi’an Jiaotong University (NO. XJTU1AF2023LSK-168). Since this study was observational in nature, the requirement for patient-informed consent was waived.
We gratefully acknowledge the assistance and instruction from professor Guoliang Li.
This research received no external funding.
The authors declare no conflict of interest. Jianying Li is an employee of GE Healthcare. However, the company had no role in the handling or conduct of the study. The authors had full access to all data in the study and take full responsibility for the integrity of the data and the accuracy of the data analysis.
References
Publisher’s Note: IMR Press stays neutral with regard to jurisdictional claims in published maps and institutional affiliations.