


 , Shuang Liu 1, Jing Wang 1, Zhen Liu 1, Chunmei Qi 1,*
1 Department of Cardiology, The Second Affiliated Hospital of Xuzhou Medical University, 221000 Xuzhou, Jiangsu, China
Abstract
This study aimed to analyze the metabolic risk factors for microcirculation disorders in patients with unstable angina (UA) after percutaneous coronary intervention (PCI), evaluating their predictive value for developing microcirculation disorders.
A single-center retrospective study design was used, which included 553 patients with UA who underwent PCI. The angiographic microcirculatory resistance (AMR) index was calculated based on coronary angiography data. Patients were divided into two groups according to their post-PCI AMR values: a post-PCI AMR ≤2.50 group and a post-PCI AMR >2.50 group. Variables were included in the multivariate regression model through univariate regression and variance inflation factor (VIF) screening. Subgroup analyses were conducted by sex to further evaluate the predictive value of selected variables in the overall sample. The total sample was randomly split into a 7:3 ratio for the training and validation sets. A nomogram based on the training sets was then constructed to visualize these predictions. The discrimination and calibration of the prediction model were evaluated using the receiver operating characteristic (ROC) curve and calibration curve.
The post-PCI AMR >2.50 group had a higher percentage of females, increased incidence of diabetes, and elevated fasting blood glucose (FBG), glycated hemoglobin (HbA1c), triglyceride (TG), total cholesterol (TC), low-density lipoprotein cholesterol (LDL-C), very low-density lipoprotein cholesterol (VLDL-C), and lipoprotein(a) (Lp(a)) levels (p < 0.05). Logistic regression analysis identified HbA1c, TG, LDL-C, and Lp(a) as independent predictors of elevated AMR post-PCI after adjusting for confounders. Subgroup analysis confirmed no significant interaction between the model and sex (p > 0.05). A nomogram was constructed based on the training set, with the area under the curve (AUC) for the ROC of 0.824 in the training set and 0.746 in the validation set. The calibration curves showed a good fit (training set: p = 0.219; validation set: p = 0.258).
HbA1c, TG, LDL-C, and Lp(a) levels are independent risk factors for microcirculation disorders in patients with UA post-PCI. The constructed nomogram provides good predictive accuracy.
Keywords
- coronary microvascular dysfunction
- angiographic microvascular resistance
- metabolic
- unstable angina
Acute coronary syndrome (ACS) is a major global public health issue with a high
mortality rate. Unstable angina (UA), a critical component of ACS, represents a
severe phenotype of coronary artery disease (CAD) [1]. UA presents as chest pain
caused by an imbalance between myocardial oxygen supply and demand. Moreover, UA
is a transitional state between stable angina and acute myocardial infarction.
Notably, the clinical prognosis of patients with UA has significantly improved
due to the continuous advancement of interventional techniques such as
percutaneous coronary intervention (PCI) [2]. However, some patients still face
the challenge of residual coronary ischemia after PCI, which further increases
the risk of major adverse cardiovascular events [3, 4]. The index of
microcirculatory resistance (IMR) is widely recognized in clinical practice as
the “gold standard” for assessing coronary microcirculatory dysfunction due to
its accuracy and reproducibility [5]. However, the measurement method for IMR is
complex, requiring pressure wires, vasodilators, and repeated saline injections,
extending the measurement time and increasing procedural risks. In recent years,
angiographic microcirculatory resistance (AMR) has gained increasing attention as
a potential alternative to IMR. Indeed, studies have shown that an AMR
With changes in modern lifestyle, the prevalence of metabolic disorders continues to rise. Metabolic diseases, particularly glucose and lipid metabolism disorders, have become global health challenges [10, 11]. Abnormalities in glucose and lipid metabolism not only increase the risk of cardiovascular diseases, such as coronary artery disease and heart failure but also contribute to dysfunction in various metabolic organs, constituting a complex systemic disorder [12, 13, 14]. Clinical biomarkers such as fasting blood glucose (FBG), glycated hemoglobin (HbA1c), and lipid profiles play crucial roles in diagnosing and screening glucose and lipid metabolism disorders. Further, these biomarkers provide important information for personalized treatment and drug development [15]. Although previous studies have shown an association between HbA1c, the triglyceride glucose (TyG) index, and coronary microcirculatory disorders [16, 17], these studies mostly rely on single metabolic indicators and lack a comprehensive evaluation of the overall correlation between glucose and lipid metabolism abnormalities and coronary microcirculatory disorders.
Given these limitations, this study aimed to analyze the association between glucose and lipid metabolism markers and coronary microcirculatory dysfunction in patients with UA after PCI. The goal was to identify high-risk patients following PCI and develop long-term management strategies to reduce the likelihood of future adverse cardiovascular events.
This study included patients with UA who were admitted to the Department of Cardiology, Second Affiliated Hospital of Xuzhou Medical University, between June 2022 and February 2024 and underwent successful PCI.
The inclusion criteria were as follows: (1) admission due to UA and underwent PCI; (2) preoperative use of aspirin, ticagrelor, and statins.
The exclusion criteria were as follows: (1) age
A total of 654 patients with UA were initially assessed, and after applying the exclusion criteria, 553 patients were included in this study. This single-center, retrospective study was conducted in accordance with the Helsinki Declaration and approved by the Ethics Committee of the Second Affiliated Hospital of Xuzhou Medical University (2020120205). The patients and their families were informed about the study, and all participants provided written informed consent.
Patient demographics included age, sex, and medical history (smoking, alcohol
consumption, history of prior percutaneous coronary intervention, hypertension,
diabetes mellitus); laboratory tests included peripheral blood white blood cells
(WBC), hemoglobin (Hb), FBG, HbA1c, total cholesterol (TC), triglycerides (TGs),
high-density lipoprotein cholesterol (HDL-C), low-density lipoprotein cholesterol
(LDL-C), very low-density lipoprotein cholesterol (VLDL-C), apolipoprotein A1
(Apo A1), apolipoprotein B (Apo B), apolipoprotein E (Apo E), lipoprotein(a)
(Lp(a)), homocysteine (HCY); echocardiography parameters included left atrial
anteroposterior diameter (LAAPD), left ventricular anteroposterior diameter
(LVAPD), interventricular septum thickness (IVS), left ventricular posterior wall
thickness (LVPW), right ventricular anteroposterior diameter (RVAPD), left
ventricular ejection fraction (LVEF). The post-PCI AMR values for patients with
UA were calculated and classified into two groups: post-PCI AMR
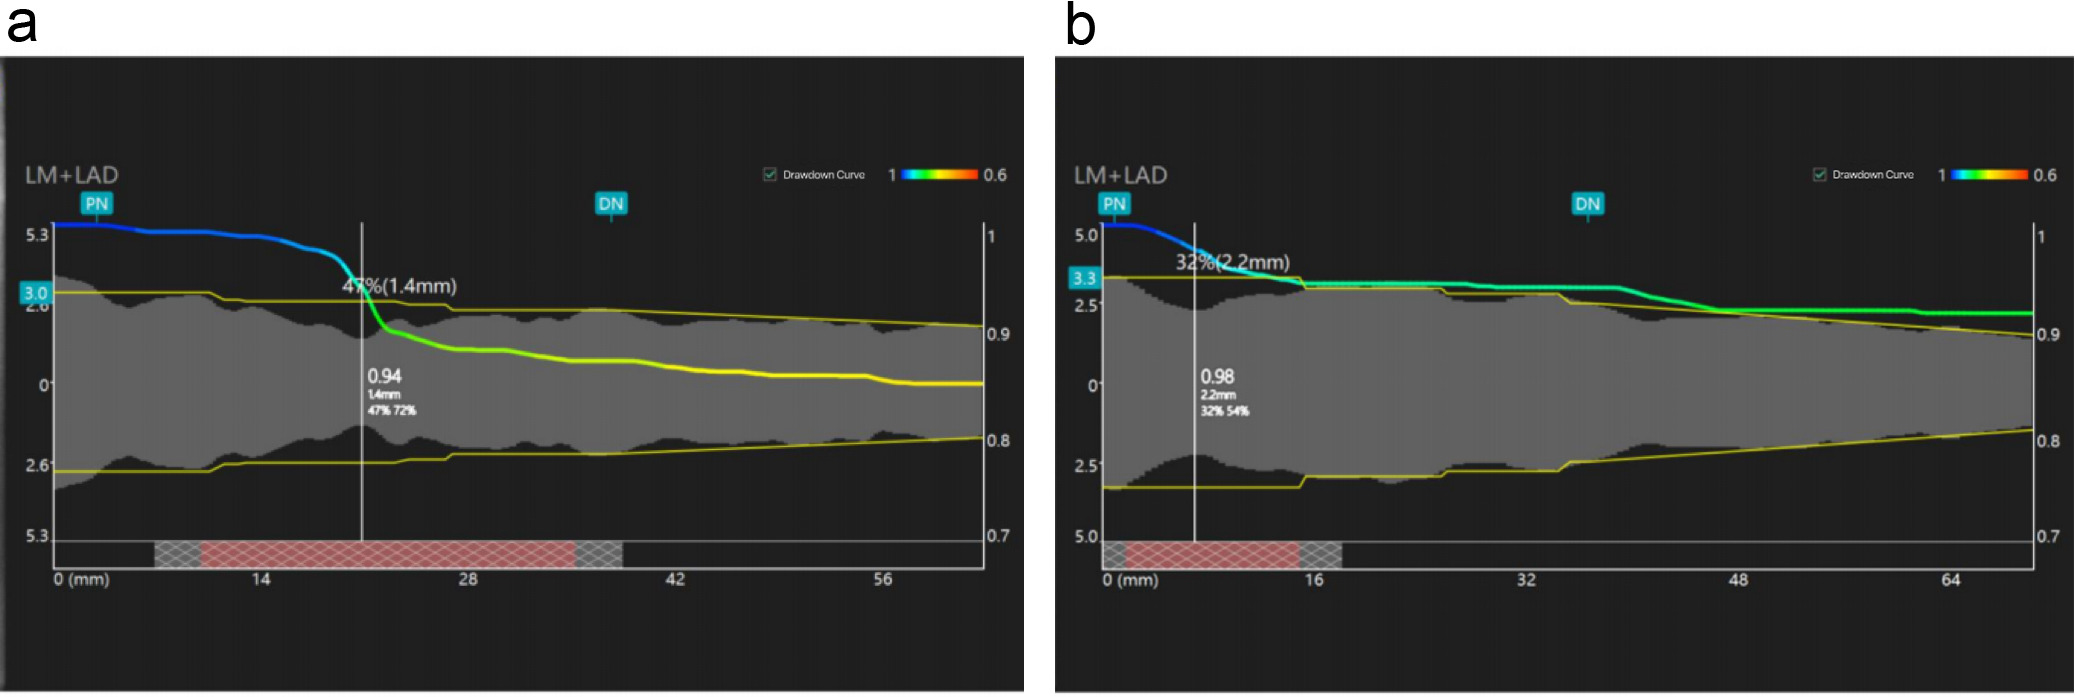 Fig. 1.
Angiographic microcirculatory resistance (AMR) measurements in post-PCI patients. (a) Post-percutaneous coronary intervention (PCI) patient AMR = 2.65 mmHg*s/cm. (b) Post-PCI patient AMR = 1.98 mmHg*s/cm. LM, left main coronary artery; LAD, left anterior descending branch; PN, proximal node; DN, distal node.
AMR was calculated using quantitative flow ratio (QFR) software (AngioPlus Core, version V3, Shanghai Pulse Medical Technology Inc., Shanghai, China) through a single-view Murray’s law-based QFR (µQFR) analysis. The single-view µQFR calculation method involved using QFR software to delineate the contours of the coronary artery lumen. The single-view µQFR calculation method was performed by dividing the length of the vessel centerline by the contrast agent filling time to compute the hyperemic flow velocity [18]. Subsequently, fully contrasted and exposed lumen contour frames were selected to outline the boundaries of the vessels and the major side branches of the examined patient. The reference vessel diameter was reconstructed by considering the phenomenon of diameter reduction at bifurcations based on Murray’s branching fractal law [19]. Finally, using hyperemic flow as a boundary condition, the pressure drop was calculated based on the fluid dynamics equation. The distal coronary pressure (Pd) was obtained based on the pressure drop, and the µQFR was calculated as Pd divided by the mean aortic pressure (Pa). The AMR was calculated as Pd divided by the simulated maximum flow velocity under hyperemic conditions (hyperemic flow velocity, Vhyp) [20].
AMR = Pd/Vhyp = Pa
SPSS 27.0 (IBM Corp., Armonk, NY, USA) and R 4.3.1 (The R Foundation for Statistical
Computing, Vienna, Austria) statistical analysis software were used. Normally
distributed data were assessed using the Shapiro–Wilk test and are presented as
the mean
This study included 553 patients with UA. Compared with
patients presenting a post-PCI AMR
| Variables | Post-PCI | Post-PCI | p | |
| AMR |
AMR | |||
| (n = 279) | (n = 274) | |||
| Age, years | 68.5 (60–74) | 68 (57–73) | 0.197 | |
| Female | 89 (43.8%) | 114 (56.2%) | 0.041 | |
| Medical history | ||||
| Smoking | 91 (51.1%) | 87 (48.9%) | 0.610 | |
| Alcohol use | 58 (50.4%) | 57 (49.6%) | 0.831 | |
| Hypertension | 179 (50.7%) | 174 (49.3%) | 0.468 | |
| DM | 64 (34.2%) | 123 (65.8%) | ||
| History of PCI | 98 (54.1%) | 83 (45.9%) | 0.132 | |
| Laboratory tests | ||||
| WBC, 109/L | 6.38 (5.2–7.67) | 6.33 (5.24–7.85) | 0.480 | |
| Hb, g/L | 135 (124–145) | 136 (126–149) | 0.146 | |
| FBG, mmol/L | 5.24 (4.69–5.86) | 6.12 (5.05–7.25) | ||
| HbA1c, g/L | 5.9 (5.5–6.3) | 6.4 (5.7–7.4) | ||
| Creatinine, µmol/L | 68 (60–82) | 67 (58–79) | 0.316 | |
| TG, mmol/L | 1.23 (0.89–1.66) | 1.51 (1.11–2.19) | ||
| TC, mmol/L | 3.99 |
4.75 |
||
| HDL-C, mmol/L | 1.08 (0.94–1.26) | 1.09 (0.93–1.32) | 0.530 | |
| LDL-C, mmol/L | 1.79 (1.44–2.32) | 2.48 (1.8–3.04) | ||
| VLDL-C, mmol/L | 0.65 (0.44–0.93) | 0.71 (0.52–1.09) | 0.013 | |
| Apo A1, g/L | 1.24 (1.05–1.40) | 1.24 (1.08–1.45) | 0.479 | |
| Apo B, g/L | 1.25 |
1.58 |
0.452 | |
| Apo E, mg/L | 37.5 (29.88–48) | 40 (31–50) | 0.109 | |
| Lp(a), mg/dL | 14.25 (6.2–24.73) | 22.5 (9.7–46.2) | ||
| HCY, µmol/L | 14.7 (11.95–18.85) | 14.4 (12–18.5) | 0.847 | |
| Myocardial enzyme | ||||
| CTnI, ng/mL | 0.004 (0.002–0.0101) | 0.004 (0.002–0.0082) | 0.672 | |
| CK, U/L | 67 (48–93) | 66 (46–93) | 0.957 | |
| CK-MB, ng/mL | 0.8 (0.6–1.3) | 0.8 (0.6–1.2) | 0.370 | |
| Echocardiography | ||||
| LAAPD, mm | 36.38 |
35.92 |
0.460 | |
| LVAPD, mm | 46 (43–48) | 46 (42–48) | 0.868 | |
| IVS, mm | 9.75 (9–10) | 9 (9–10) | 0.507 | |
| LVPW, mm | 9 (9–10) | 9 (8–10) | 0.268 | |
| RVAPD, mm | 22 (21–24) | 22 (21–24) | 0.428 | |
| LVEF, % | 59 (57–60) | 59 (57–60) | 0.240 | |
DM, diabetes mellitus; WBC, white blood cells; HbA1c, glycated hemoglobin; FBG, fasting blood glucose; TG, triglyceride; TC, total cholesterol; HDL-C, high-density lipoprotein cholesterol; LDL-C, low-density lipoprotein cholesterol; VLDL-C, very low-density lipoprotein cholesterol; Apo A1, apolipoprotein A1; Apo B, apolipoprotein B; Apo E, apolipoprotein E; Lp(a), lipoprotein(a); HCY, homocysteine; LAAPD, left atrial anteroposterior diameter; LVAPD, left ventricular anteroposterior diameter; IVS, interventricular septum thickness; LVPW, left ventricular posterior wall thickness; RVAPD, right ventricular anteroposterior diameter; LVEF, left ventricular ejection fraction; Hb, hemoglobin; PCI, percutaneous coronary intervention; AMR, angiographic microcirculatory resistance; CTnI, cardiac troponin I; CK, creatine kinase; CK-MB, creatine kinase isoenzyme MB.
The results of single-factor logistic regression analysis of factors influencing
AMR indicated that female sex (OR = 1.436, 95% CI: 1.014–2.033, p =
0.041) and diabetes mellitus (OR = 2.587, 95% CI: 1.794–3.732, p
| Variables | OR | 95% CI | p |
| Age, years | 0.989 | 1.975–1.004 | 0.154 |
| Female | 1.436 | 1.014–2.033 | 0.041 |
| Smoking | 1.097 | 0.768–1.568 | 0.610 |
| Alcohol use | 1.064 | 0.705–1.608 | 0.766 |
| Hypertension | 1.137 | 0.803–1.609 | 0.469 |
| DM | 2.587 | 1.794–3.732 | |
| History of PCI | 0.761 | 0.533–1.086 | 0.132 |
| WBC, 109/L | 1.046 | 0.974–1.125 | 0.217 |
| Hb, g/L | 1.009 | 0.999–1.019 | 0.086 |
| FBG, mmol/L | 1.526 | 1.336–1.743 | |
| HbA1c, g/L | 1.982 | 1.630–2.410 | |
| Creatinine, µmol/L | 1.000 | 0.997–1.002 | 0.743 |
| TG, mmol/L | 1.588 | 1.291–1.954 | |
| TC, mmol/L | 1.812 | 1.530–2.147 | |
| HDL-C, mmol/L | 1.285 | 0.774–2.134 | 0.332 |
| LDL-C, mmol/L | 2.457 | 1.943–3.105 | |
| VLDL-C, mmol/L | 1.504 | 1.055–2.144 | 0.024 |
| Apo A1, g/L | 1.330 | 0.713–2.483 | 0.370 |
| Apo B, g/L | 1.013 | 0.979–1.048 | 0.460 |
| Apo E, mg/L | 1.008 | 1.000–1.016 | 0.058 |
| Lp(a), mg/dL | 1.017 | 1.010–1.025 | |
| HCY, µmol/L | 1.005 | 0.990–1.020 | 0.533 |
| LAAPD, mm | 0.991 | 0.969–1.014 | 0.459 |
| LVAPD, mm | 1.008 | 0.972–1.045 | 0.672 |
| IVS, mm | 0.951 | 0.844–1.071 | 0.408 |
| LVPW, mm | 0.914 | 0.787–1.062 | 0.240 |
| RVAPD, mm | 0.966 | 0.900–1.037 | 0.340 |
| LVEF, % | 1.014 | 0.979–1.049 | 0.439 |
UA, unstable angina; DM, diabetes mellitus; WBC, white blood cells; HbA1c, glycated hemoglobin; FBG, fasting blood glucose; TG, triglyceride; TC, total cholesterol; HDL-C, high-density lipoprotein cholesterol; LDL-C, low-density lipoprotein cholesterol; VLDL-C, very low-density lipoprotein cholesterol; Apo A1, apolipoprotein A1; Apo B, apolipoprotein B; Apo E, apolipoprotein E; Lp(a), lipoprotein(a); HCY, homocysteine; LAAPD, left atrial anteroposterior diameter; LVAPD, left ventricular anteroposterior diameter; IVS, interventricular septum thickness; LVPW, left ventricular posterior wall thickness; RVAPD, right ventricular anteroposterior diameter; LVEF, left ventricular ejection fraction; Hb, hemoglobin; PCI, percutaneous coronary intervention; AMR, angiographic microcirculatory resistance.
Before including variables with a value of p
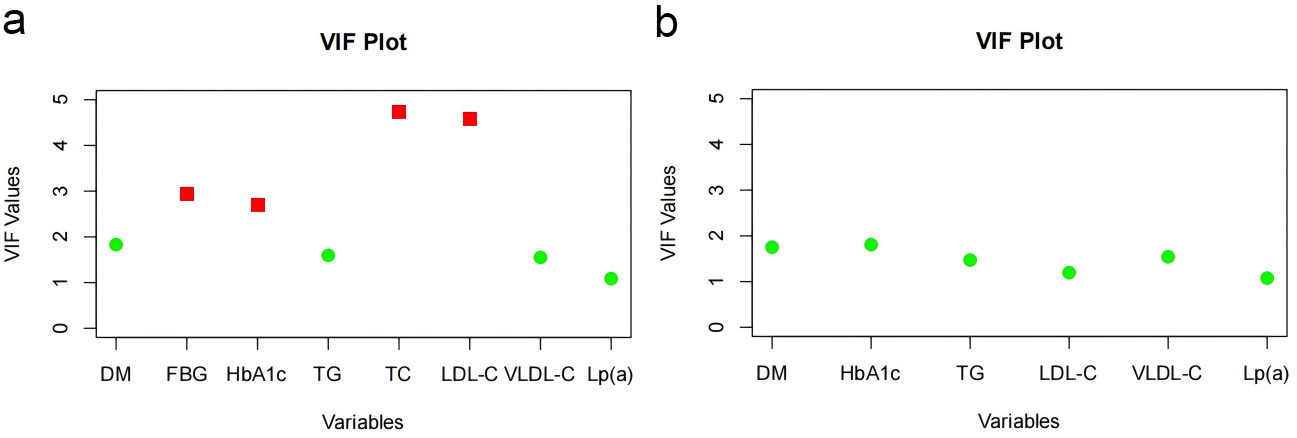 Fig. 2.
Variance inflation factor (VIF) comparison before and after variable adjustment. (a) VIF chart before variable adjustment. (b) VIF chart after variable adjustment. DM, diabetes mellitus; HbA1c, glycated hemoglobin; FBG, fasting blood glucose; TG, triglyceride; TC, total cholesterol; LDL-C, low-density lipoprotein cholesterol; VLDL-C, very low-density lipoprotein cholesterol; Lp(a), lipoprotein(a).
We included variables with a value of p
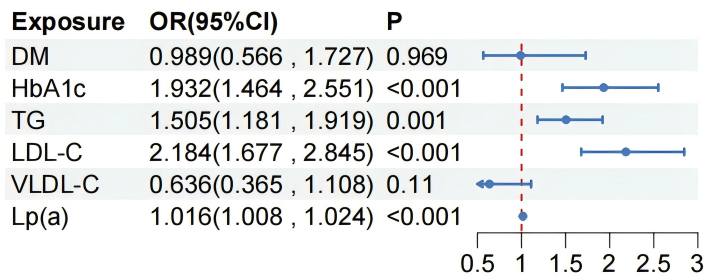 Fig. 3.
Multivariate analysis of risk factors with an
AMR
Subgroup analysis confirmed that there was no significant interaction between
the model and sex (p
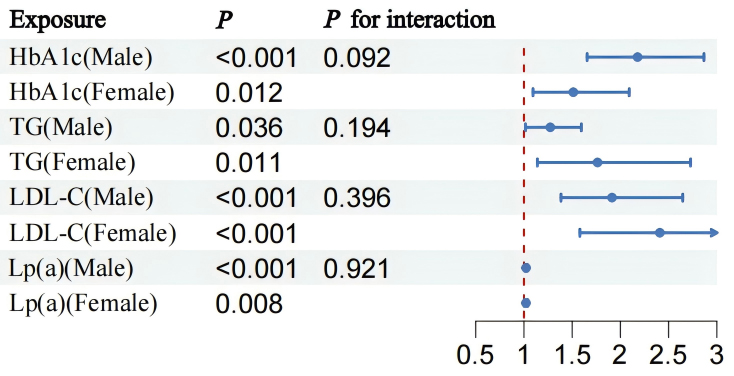 Fig. 4.
Statistical comparison of HbA1c, TG, LDL-C, and Lp(a) levels as indicators in males and females. HbA1c, glycated hemoglobin; TG, triglyceride; LDL-C, low-density lipoprotein cholesterol; Lp(a), lipoprotein(a).
The samples were randomly divided into training and validation sets in a 7:3 ratio. Four independent risk factors were used to create a nomogram based on a training set of logistic regression coefficients to construct a risk estimate of coronary microcirculatory disturbance in patients with UA after PCI (Fig. 5). As shown in Fig. 2, the selected biomarkers were scored using the values obtained from the predictive model. Fig. 2 illustrates the predictions of coronary microvascular dysfunction after PCI in patients with UA at different biomarker levels using a linear prediction model and their corresponding risk levels. As the biomarker scores increased, the predicted risk values also significantly increased, suggesting a close association between these biomarkers and the risk of coronary microvascular dysfunction after PCI in patients with UA.
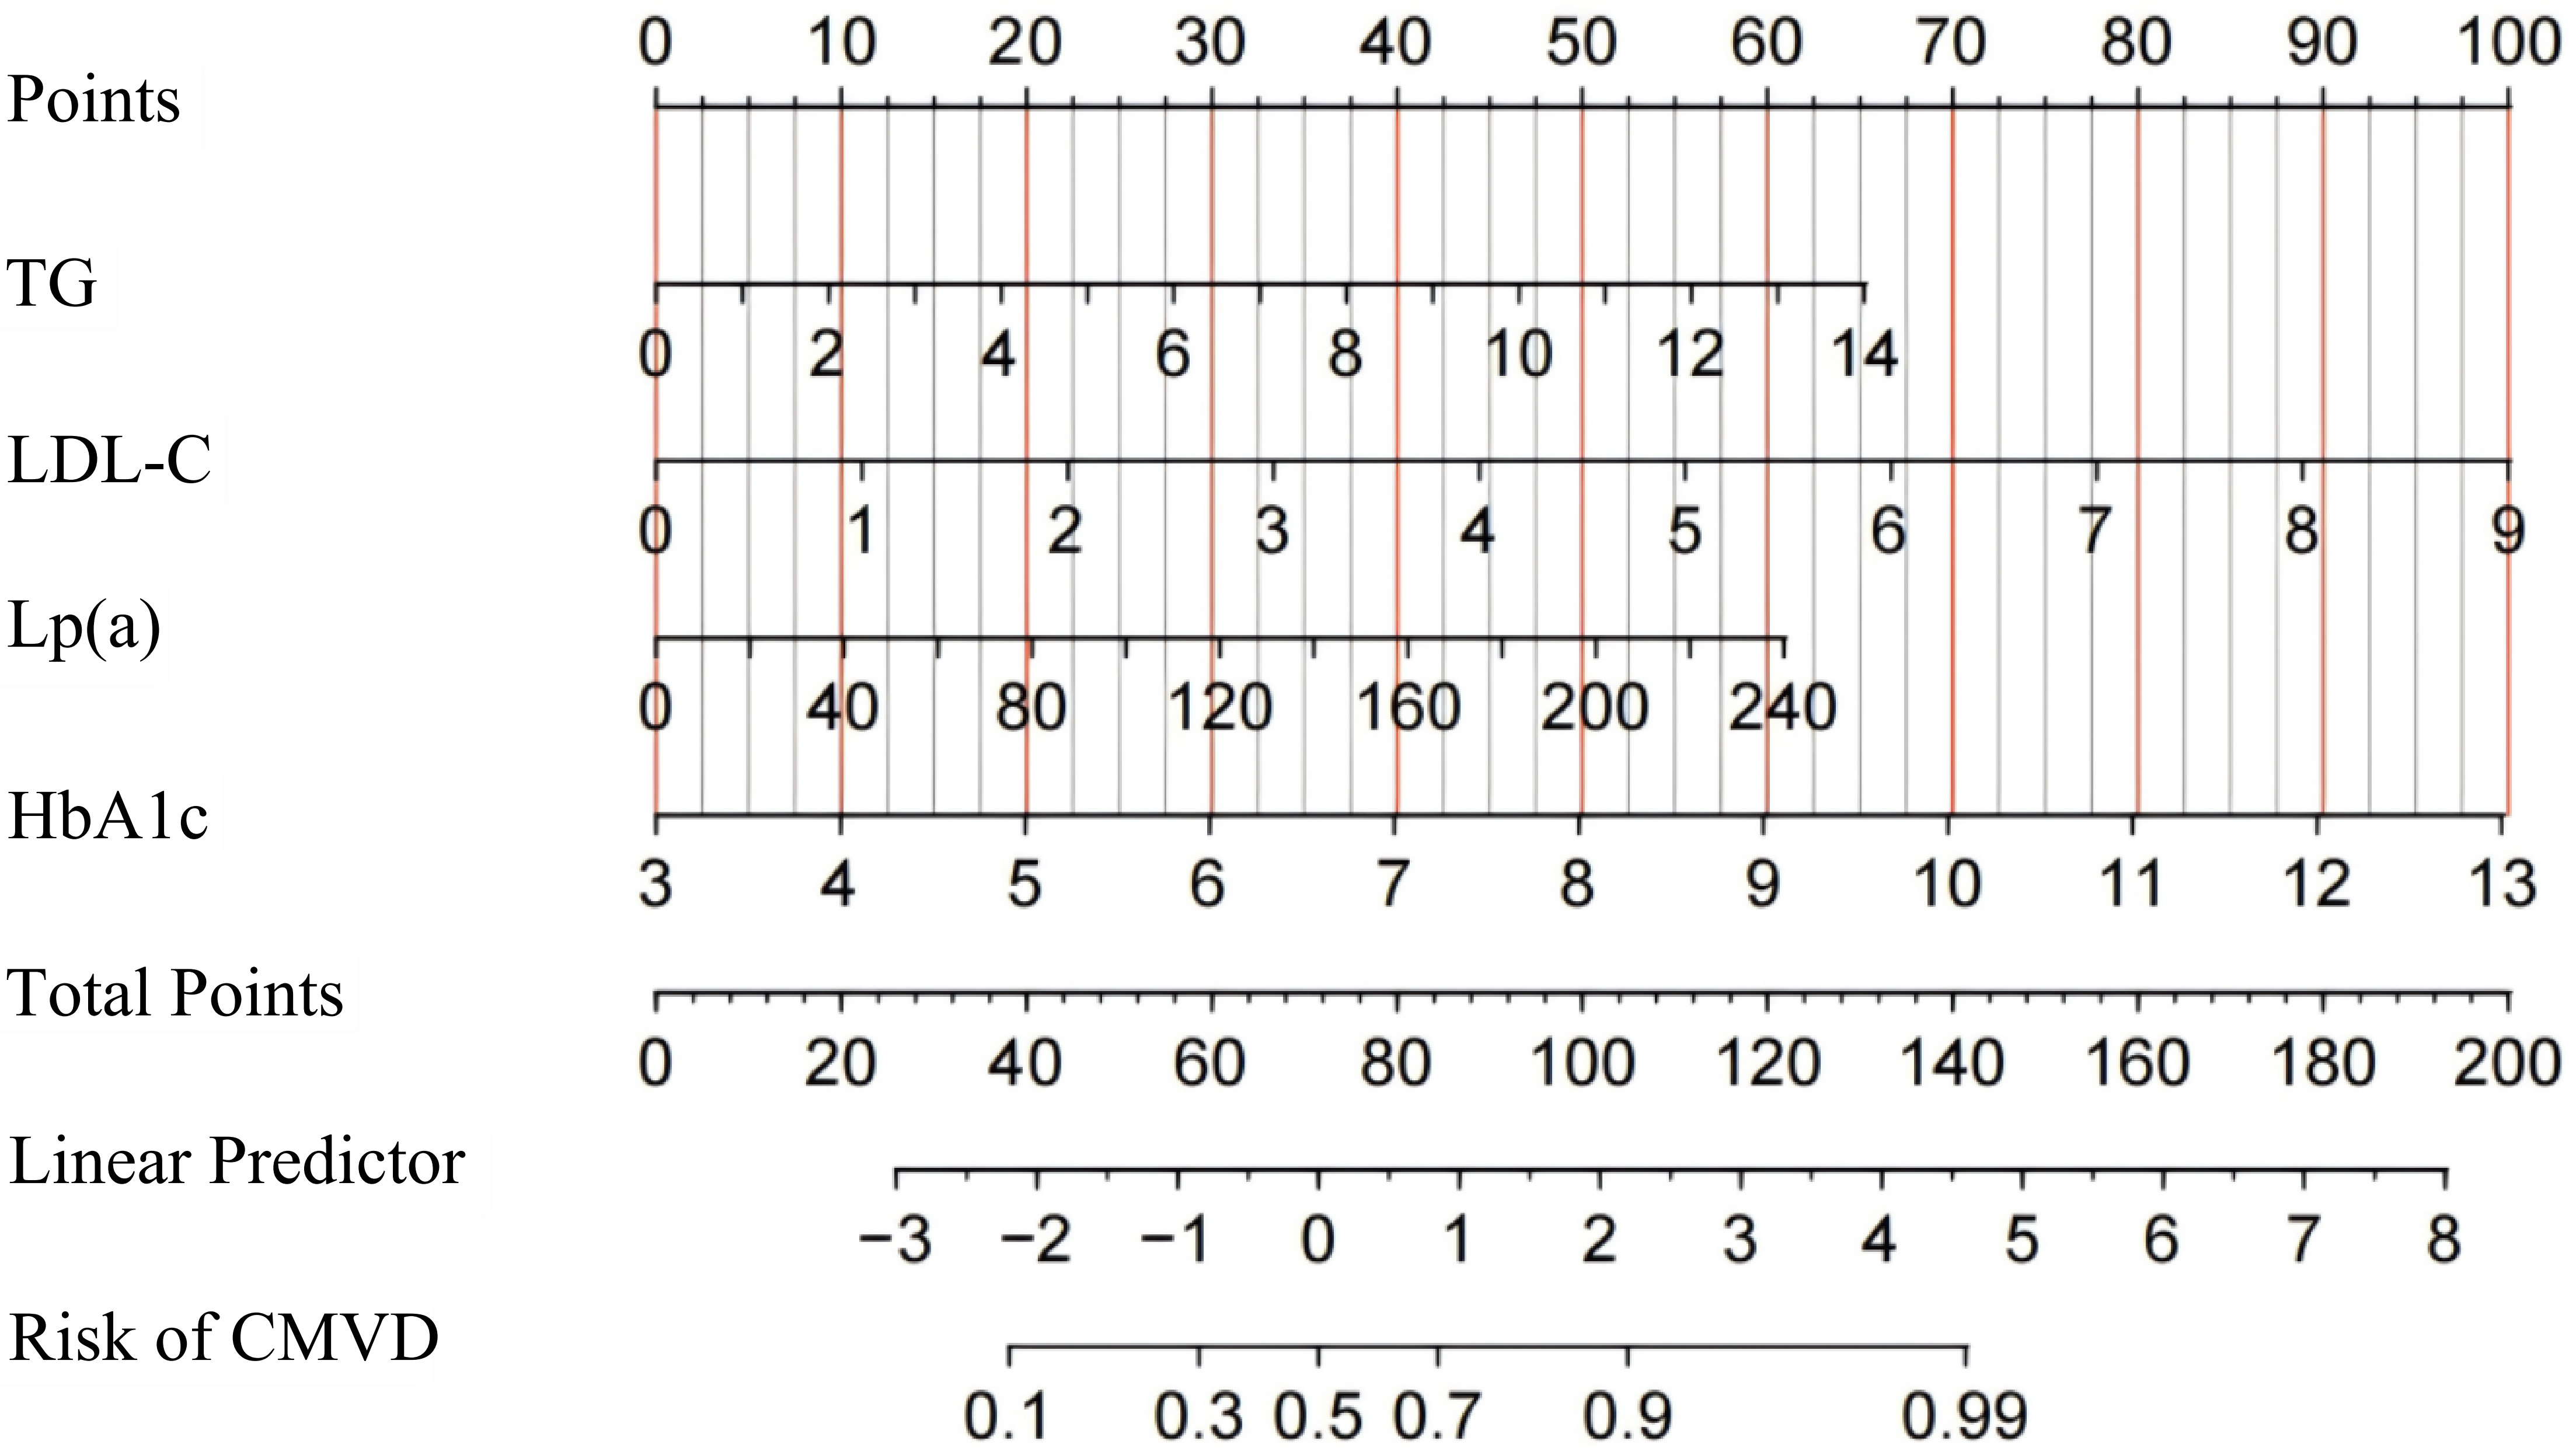 Fig. 5.
Nomogram for diagnosing coronary microvascular dysfunction after PCI in patients with UA. UA, unstable angina; PCI, percutaneous coronary intervention; CMVD, coronary microvascular disease; HbA1c, glycated hemoglobin; TG, triglyceride; LDL-C, low-density lipoprotein cholesterol; Lp(a), lipoprotein(a).
The discrimination ability of the nomogram model was assessed using the receiver
operating characteristic (ROC) curve. In the training set, the model achieved an
area under the curve (AUC) for the ROC of 0.824 with an optimal cutoff of 0.487,
yielding a sensitivity of 0.818 and a specificity of 0.698. In the validation
set, the AUC was 0.746, with an optimal cutoff of 0.367, sensitivity of 0.811,
and specificity of 0.579 (Fig. 6a,c). Calibration of the model was assessed using
the Hosmer–Lemeshow test, with results of p = 0.219 for the training
set and p = 0.258 for the validation set (both p
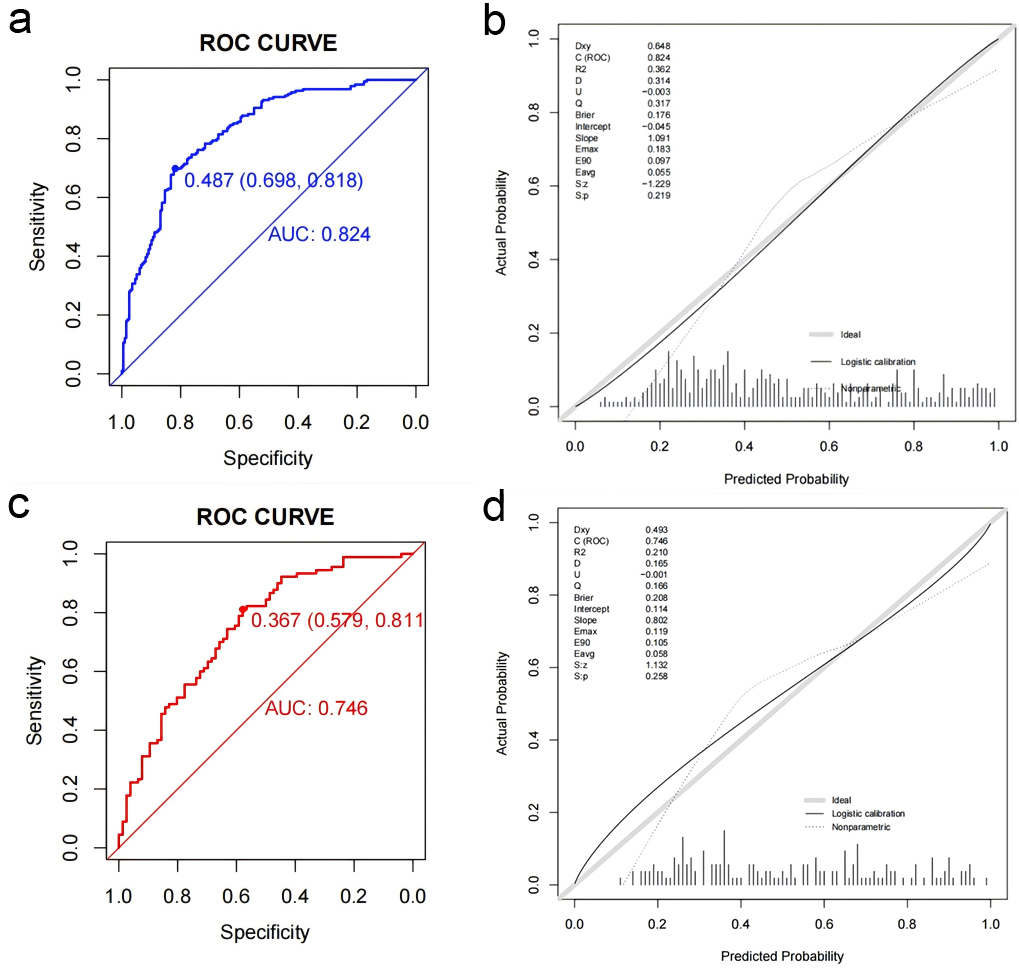 Fig. 6.
Receiver operating characteristic curves and calibration plots of the nomogram in the training and validation set. (a) ROC curve for predicting coronary microcirculation disorder post-PCI in the training set. (b) Calibration curve for the training set. (c) ROC curve for predicting coronary microcirculation disorder post-PCI in the validation set. (d) Calibration curve for the validation set. PCI, percutaneous coronary intervention; ROC, receiver operating characteristic; AUC, area under the curve.
UA, a disease that significantly affects patients’ quality of life, has long
been a focus of cardiovascular treatment and management. Despite significant
advancements in PCI technology improving patient outcomes, residual coronary
ischemia remains a critical factor leading to adverse cardiovascular events [4, 21, 22]. Yongzhen Fan et al. [23] validated the effectiveness of AMR in
diagnosing coronary microcirculatory dysfunction, highlighting an AMR
The root cause of glycemic and lipid metabolism disorders stems from the imbalance between pro-oxidant and antioxidant levels, leading to endothelial dysfunction promoting cardiovascular disease development [10]. Biological markers, as indicators for disease diagnosis and staging, allow the detection of changes in patient biomarkers and can develop personalized treatments [15]. Moreover, FBG, HbA1c, and lipid profiles are biological markers of glycemic and lipid metabolism and are significantly associated with the risks of cardiovascular events [13, 14, 22, 24]. HbA1c is the gold standard for long-term blood glucose control, reflecting the glycemic status over the past 2–3 months. Prolonged hyperglycemia results in advanced glycation end products (AGEs) that inhibit endothelial nitric oxide synthase (eNOS) and induce vascular and myocardial collagen cross-linking, thereby impairing vascular dilation [25]. The study have confirmed a significant correlation between HbA1c levels and residual coronary ischemia post-PCI [17]. Furthermore, research indicates that optimal control of LDL-C in patients undergoing PCI can significantly improve coronary microvascular function after one year due to a reduction in LDL-C, which improves endothelial cell function [26, 27]. Most studies analyze the correlation between a single metabolic abnormality and cardiovascular events, meaning the close relationship between glycemic and lipid metabolism abnormalities is often overlooked in single-angle analyses [28, 29]. Therefore, analyzing the independent risk factors for residual coronary ischemia post-PCI in patients with UA from a comprehensive glycemic and lipid metabolism perspective and conducting subgroup analysis can provide more precise clinical guidance. This comprehensive analytical approach helps to improve understanding of the overall impact of glycemic and lipid metabolism abnormalities on cardiovascular events, enabling the development of more effective personalized treatment strategies.
This study thoroughly explored the relationship between
glucose and lipid metabolism disorders and microcirculatory dysfunction in
patients with UA after PCI and evaluated the predictive value of relevant
metabolic indicators. The results revealed that HbA1c, TG, LDL-C, and Lp(a)
levels can be independent risk factors for post-PCI microcirculatory dysfunction.
Subgroup analyses based on sex further demonstrated that these risk factors,
identified in the overall sample, remained significant across both male and
female groups. This indicates the robustness of these indicators in predicting
post-PCI AMR
The findings of this study have several important implications for clinical practice. First, they emphasize the importance of monitoring and controlling metabolic risk factors in managing patients with UA post-PCI. Second, the predictive model based on the nomogram helps in the early identification of high-risk patients and facilitates timely interventions.
The results of this study also have some limitations. First, our model is based
on a clinical single-institution study with only 553 patients with UA post-PCI,
meaning the findings may not be generalizable to the broader population. Second,
while previous studies have confirmed that an AMR score
HbA1c, TG, LDL-C, and Lp(a) are independent risk factors for microcirculatory dysfunction after PCI in patients with UA. A predictive model incorporating these factors was established, demonstrating good predictive value and clinical utility, which can provide clinicians with valuable information to develop treatment strategies to minimize future major adverse cardiovascular events.
UA, unstable angina pectoris; PCI, percutaneous coronary intervention; QFR, quantitative flow ratio; IMR, index of microcirculatory resistance; AMR, angiographic microvascular resistance; CMVD, coronary microvascular disease; DM, diabetes mellitus; TG, triglyceride; HDLC, high-density lipoprotein cholesterol; LDLC, low-density lipoprotein cholesterol; VLDL, very low-density lipoprotein; FBG, fasting blood glucose; HbA1c, glycated hemoglobin.
The datasets used and/or analyzed during the current study are available from the corresponding author on reasonable request.
KML, CMQ and JW—Conception and design; KML and CMQ—administrative support; KML and SL—provision of study materials; JW, SL and ZL—collection and assembly of data; KML and CMQ—data analysis and interpretation. All the authors have written and approved the final manuscript. All authors read and approved the final manuscript. All authors have participated sufficiently in the work and agreed to be accountable for all aspects of the work.
This study adhered to the principles outlined in the Helsinki Declaration and was approved by the Ethics Committee of the Second Affiliated Hospital of Xuzhou Medical University (2020120205). Written informed consent was obtained from all participants.
We would like to express our gratitude to all those who helped us in the writing of this manuscript.
This research received no external funding.
The authors declare no conflict of interest.
References
Publisher’s Note: IMR Press stays neutral with regard to jurisdictional claims in published maps and institutional affiliations.