


1 Department of Cardiology, Huadong Hospital Affiliated to Fudan University, 200040 Shanghai, China
2 Department of Cardiology, Kunshan Hospital of Traditional Chinese Medicine, 215300 Kunshan, Jiangsu, China
†These authors contributed equally.
Abstract
A fractional flow reserve (FFR)-fixed-SYNTAX score could decrease the number of high-risk patients. This study explored the prognostic value of non-invasive quantitative flow ratio (QFR)-fixed-SYNTAX I/II scores in multivessel disease patients.
This was a single-center, small-sample, observational study. Multivessel coronary disease patients were enrolled and finished a 1-year follow-up. SYNTAX scores I/II and functional SYNTAX scores I/II based on QFR (cut-off value of 0.85) were calculated for all patients. The composite occurrence of cardiac deaths, any myocardial infarction, or ischemia-driven revascularization were analyzed using a different score system.
A total of 160 patients were stratified into risk groups based on a different scoring system. FSS (functional SYNTAX score) and FSSII (functional SYNTAX score II) reduce the radio of high-risk major adverse cardiovascular events (MACEs), transforming the patients from high-risk to medium- and low-risk. Furthermore, FSSII (hazard ratio (HR): 1.069, 95% CI: 1.025–1.115, p = 0.002) showed a better relationship with MACEs than the other score systems. After recalculating SSII, the survival-free ratio stratified by FSSII decreased from 38.46% to 27.27% in the high-risk group and increased from 84.09% to 86.05% in the low-risk group.
FSS or FSSII could decrease the number of high-risk patients compared to SYNTAX score (SS) and FSS. SYNTAX II score (SSII) and FSSII showed a better predictive ability than other scoring systems for under-risk stratification.
Keywords
- multivessel disease
- SYNTAX score I
- SYNTAX score II
- quantitative flow ratio
- functional SYNTAX score
The prognosis of patients with complex coronary heart disease (CAD) depends on anatomical complexity, patients’ clinical characteristics, and comorbidities. It has been shown that the clinical outcome of patients with incomplete revascularization (IR) after percutaneous coronary intervention (PCI) is worse than that of patients with complete revascularization (CR) [1, 2]. However, in most previous studies, the completeness of revascularization was judged based on the severity of anatomical stenosis without considering the functional significance of the remaining stenosis [3, 4].
The SYNTAX score (SS) is a comprehensive angiographic scoring system based on coronary artery anatomy and lesion characteristics [5]. However, with the advancement of coronary intervention technologies and coronary stents, purely anatomical SSs can no longer objectively predict the prognosis or outcome of patients. Therefore, based on SS, some scholars calculated patients’ clinical factors, including age, comorbidities, and other factors, and applied them to the SS, defined as the SYNTAX II score (SSII) [2, 6, 7].
However, even though the SSII can effectively reduce data deviations in SYNTAX studies, with increased research on coronary artery hemodynamics and pathophysiology, coronary angiography alone can no longer meet the clinical requirements for the anatomical characteristics or physiological functions of stenotic lesions [8]. The main reason for the need for additional assessments is that coronary angiography cannot be used to accurately evaluate the relationship between stenosis and myocardial ischemia. Many studies have shown that the prognosis of patients with coronary heart disease mainly depends on the presence or absence of myocardial ischemia rather than the degree of coronary stenosis. Interventions for stenosis without functional significance will not benefit patients [9, 10]. Therefore, functional disease is even more important in treating multivessel or diffuse segmental lesions.
Several studies have shown that through SS combined with fractional flow reserve (FFR), the prognosis of patients can be effectively predicted [1, 11, 12]. Quantitative flow ratio (QFR) is a novel method for deriving FFR without the use of pressure wires or the induction of hyperemia [13, 14]. The diagnostic ability of SS combined with QFR in the prognosis of patients with multivessel disease has also been confirmed [15, 16]. In this study, we aimed to test the diagnostic value of these scores by calculating the preoperative and postoperative SSs and those corrected based on QFR in combination with the incidence of major adverse cardiovascular events (MACEs) among patients after 1 year. In addition, we used the final 1-year incidence of MACEs in patients to verify the correct rate of risk stratification and patients’ outcomes.
We enrolled 187 multivessel disease patients who underwent complete revascularization in the Department of Cardiology, Huadong Hospital, from January 2019 to May 2020; a total of 160 patients completed the follow-up.
SYNTAX I/II scores and residual SYNTAX I/II scores were calculated based on the
official website of SYNTAX (https://syntaxscore.org/). Functional SYNTAX I/II and
residual SYNTAX I/II scores were recalculated based on the QFR cut-off value. All
lesions recalculated by QFR
In this study, all patients were eligible for QFR measurements. QFR was performed for all lesions calculated in the SS before and after PCI. An offline QFR analysis was performed by trained technicians of our department using the QFR system (AngioPlus, Pulse Medical Imaging Technology, Shanghai, China). All data were calculated by two cardiologists who passed the training test independently. The cut-off value for the physiological significance of QFR was 0.85 [18].
MACEs were defined as the composite of cardiac deaths, any myocardial infarction, or ischemia-driven revascularization. An independent and blinded clinical event committee adjudicated all adverse events. A cardiologist followed patients in the clinic at the end of the study period. Telephone or WeChat were used to contact patients once a month.
Continuous variables were expressed as the mean
A total of 160 patients with multivessel CAD were enrolled and completed the
follow-up. All patients underwent complete revascularization. Sirolimus-eluting
stents were used in all patients in this study, and no bare metal stents were
used. The baseline characteristics of the study population were grouped by risk
stratification based on SSI and SSII, shown in Tables 1,2. After
recalculation of SS, 7.5% of patients (N = 12) were reclassified from the
high-risk group into the low-risk group, and 12.5% (N = 20) were reclassified
from the medium group into the low-risk group (Table 1, Fig. 1A,B). The cut-off
value for SSII was defined as
 Fig. 1.
Risk stratification of patients. (A) Regroup of patients in different risk stratification after recalculation by FSS. (B) Percentage change of different risk stratification after recalculation by FSS. (C) Regroup of patients in different risk stratification after recalculation by FSSII. (D) Percentage change of different risk stratification after recalculation by FSSII. SS, SYNTAX score; FSS, functional SYNTAX score; SSII, SYNTAX score II; FSSII, functional SYNTAX score II.
| Variables | All patients | SS | FSS | |||||||
| Low risk | Medium risk | High risk | p-value | Low risk | Medium risk | High risk | p-value | |||
| N = 160 | (N = 30) | (N = 82) | (N = 48) | (N = 62) | (N = 62) | (N = 36) | ||||
| Age, years | 67.15 |
63.87 |
69.44 |
65.29 |
0.006 | 65.87 |
69.55 |
65.22 |
0.040 | |
| Male | 128 (80.00) | 24 (80.00) | 64 (78.05) | 40 (83.33) | 0.768 | 12 (19.35) | 14 (22.58) | 6 (16.67) | 0.769 | |
| Hypertension | 116 (72.50) | 18 (40.00) | 66 (80.49) | 32 (66.67) | 0.055 | 48 (77.42) | 42 (67.74) | 26 (72.22) | 0.484 | |
| Diabetes | 66 (41.25) | 12 (6.67) | 34 (41.46) | 20 (41.67) | 0.988 | 28 (45.16) | 22 (35.48) | 16 (44.44) | 0.498 | |
| Hypercholesterolemia | 14 (8.75) | 2 (6.67) | 6 (7.32) | 6 (12.50) | 0.653 | 4 (6.45) | 6 (9.68) | 4 (11.11) | 0.771 | |
| Previous MI | 4 (2.50) | 0 (0.00) | 2 (2.44) | 2 (4.17) | 0.656 | 0 (0.00) | 4 (6.45) | 0 (0.00) | 0.078 | |
| LVEF | 61.00 |
62.20 |
60.41 |
61.25 |
0.128 | 60.52 |
61.84 |
60.39 |
0.343 | |
| eGFR | 83.41 |
84.69 |
80.19 |
88.09 |
0.329 | 85.71 |
77.60 |
89.44 |
0.019 | |
| Medications | ||||||||||
| Antiplatelet | 160 (100) | 30 (100.00) | 82 (100.00) | 48 (100.00) | - | 62 (100.00) | 62 (100.00) | 36 (100.00) | - | |
| Stains | 160 (100) | 30 (100.00) | 82 (100.00) | 48 (100.00) | - | 62 (100.00) | 62 (100.00) | 36 (100.00) | - | |
| ACEI/ARB | 116 (72.50) | 18 (60.00) | 64 (78.05) | 34 (70.83) | 0.159 | 40 (64.52) | 46 (74.19) | 30 (83.33) | 0.123 | |
| 112 (70.00) | 14 (46.67) | 60 (73.17) | 38 (79.17) | 0.006 | 38 (61.29) | 46 (74.19) | 28 (77.78) | 0.149 | ||
| Angiographic | ||||||||||
| SYNTAX score | 28.26 |
18.07 |
26.96 |
36.83 |
22.09 |
29.57 |
36.61 |
|||
| Bifurcation lesion | 6 (3.75) | 0 (0.00) | 4 (4.88) | 2 (4.17) | 0.264 | 2 (3.23) | 2 (3.23) | 2 (5.56) | 0.757 | |
| Total occlusion | 56 (35.00) | 6 (20.00) | 30 (36.59) | 20 (41.67) | 0.136 | 16 (25.81) | 22 (35.48) | 18 (50.00) | 0.053 | |
| Severe tortuosity | 2 (1.25) | 0 (0.00) | 0 (0.00) | 2 (4.17) | 0.123 | 0 (0.00) | 0 (0.00) | 2 (5.56) | 0.050 | |
| Severe calcification | 8 (5.00) | 2 (6.67) | 4 (4.88) | 2 (4.17) | 0.795 | 6 (9.68) | 0 (0.00) | 2 (5.56) | 0.033 | |
SS, SYNTAX score; FSS, functional SYNTAX score; MI, myocardial infarction; eGFR,
estimated glomerular filtration rate; LVEF, left ventricular ejection fraction;
ACEI, angiotensin-converting enzyme inhibitor; ARB, angiotensin receptor blocker.
Values are the mean
| Variables | SSII | FSSII | |||||||
| Low risk | Medium risk | High risk | p-value | Low risk | Medium risk | High risk | p-value | ||
| (N = 46) | (N = 88) | (N = 26) | (N = 52) | (N = 86) | (N = 22) | ||||
| Age, years | 58.39 |
69.09 |
76.08 |
60.08 |
69.35 |
75.27 |
|||
| Male | 42 (91.30) | 70 (79.55) | 16 (61.54) | 0.009 | 48 (92.31) | 60 (69.77) | 14 (63.64) | 0.003 | |
| Hypertension | 32 (69.57) | 64 (72.73) | 20 (76.92) | 0.796 | 38 (73.08) | 60 (69.77) | 18 (81.82) | 0.525 | |
| Diabetes | 18 (39.13) | 36 (40.91) | 12 (46.15) | 0.841 | 20 (38.46) | 36 (41.86) | 10 (45.45) | 0.843 | |
| Hypercholesterolemia | 4 (8.70) | 8 (9.09) | 2 (7.69) | 1.000 | 4 (7.69) | 8 (9.30) | 2 (9.09) | 1.000 | |
| Previous MI | 0 (0.00) | 4 (4.55) | 0 (0.00) | 0.285 | 0 (0.00) | 4 (4.65) | 0 (0.00) | 0.273 | |
| LVEF | 61.61 |
60.89 |
60.31 |
0.633 | 61.65 |
60.35 |
62.00 |
0.298 | |
| eGFR | 95.59 |
83.89 |
60.89 |
94.39 |
83.50 |
57.10 |
|||
| Medications | |||||||||
| Antiplatelet | 46 (100.00) | 88 (100.00) | 26 (100.00) | - | 52 (100.00) | 86 (100.00) | 22 (100.00) | - | |
| Stains | 46 (100.00) | 88 (100.00) | 26 (100.00) | - | 52 (100.00) | 86 (100.00) | 22 (100.00) | - | |
| ACEI/ARB | 28 (60.87) | 64 (72.73) | 24 (92.31) | 0.016 | 34 (65.38) | 62 (72.09) | 20 (90.91) | 0.079 | |
| 30 (65.22) | 64 (72.73) | 18 (69.23) | 0.664 | 34 (65.38) | 64 (74.42) | 14 (63.64) | 0.417 | ||
| Angiographic | |||||||||
| SYNTAX score | 26.04 |
28.78 |
30.39 |
0.028 | 26.12 |
28.74 |
31.41 |
0.009 | |
| Bifurcation lesion | 2 (4.35) | 4 (4.55) | 0 (0.00) | 0.729 | 2 (3.85) | 4 (4.65) | 0 (0.00) | 0.859 | |
| Total occlusion | 14 (30.43) | 36 (40.91) | 6 (23.08) | 0.183 | 16 (30.77) | 34 (39.53) | 6 (27.27) | 0.414 | |
| Severe tortuosity | 0 (0.00) | 2 (2.27) | 0 (0.00) | 0.682 | 0 (0.00) | 2 (2.33) | 0 (0.00) | 0.648 | |
| Severe calcification | 0 (0.00) | 4 (4.55) | 4 (15.38) | 0.013 | 2 (3.85) | 4 (4.65) | 2 (87.50) | 0.684 | |
SSII, SYNTAX score II; FSSII, functional SYNTAX score II; MI, myocardial
infarction; eGFR, estimated glomerular filtration rate; LVEF, left ventricular
ejection fraction; ACEI, angiotensin-converting enzyme inhibitor; ARB,
angiotensin receptor blocker. Values are the mean
Thirty-four patients suffered MACEs. An univariable analysis was performed on clinical and anatomy factors in all patients for each MACE. The results showed only left ventricular ejection fraction (LVEF) significantly influenced MACEs (Table 3). Except for SS, FSS, and the residual SYNTAX score (rSS) system, the other five scoring systems showed significant predictive ability for MACEs. SSII (HR: 1.072, 95% CI: 1.026–1.120, p = 0.002) and functional SYNTAX score II (FSSII) (HR: 1.069, 95% CI: 1.025–1.115, p = 0.002) showed a better correlation with MACEs than the other scoring system (Table 4).
| Variables | HR (95% CI) | p-value |
| Age, years | 1.035 (0.999–1.072) | 0.055 |
| Male | 1.252 (0.602–2.605) | 0.547 |
| Hypertension | 1.881 (0.782–4.523) | 0.158 |
| Diabetes | 1.372 (0.721–2.608) | 0.335 |
| Hypercholesterolemia | 1.205 (0.425–3.416) | 0.726 |
| eGFR | 1.001 (0.985–1.017) | 0.941 |
| LVEF | 1.104 (1.003–1.216) | 0.043 |
| Bifurcation lesion | 1.127 (0.268–4.733) | 0.871 |
| Total occlusion | 0.990 (0.474–2.067) | 0.979 |
| Severe tortuosity | 0.048 (0.000–715.463) | 0.535 |
| Severe calcification | 2.124 (0.498–9.069) | 0.309 |
MACEs, major adverse cardiovascular events; eGFR, estimated glomerular filtration rate; LVEF, left ventricular ejection fraction; HR, hazard ratio; CI, confidence interval.
| Variables | HR (95% CI) | p-value | |
| SS | 1.048 (0.999–1.099) |  |
0.056 |
| FSS | 1.040 (0.996–1.087) | 0.077 | |
| rSS | 1.044 (1.004–1.087) | 0.032 | |
| rFSS | 1.064 (1.027–1.103) | ||
| SSII | 1.072 (1.026–1.120) | 0.002 | |
| FSSII | 1.069 (1.025–1.115) | 0.002 | |
| rSSII | 1.064 (1.020–1.109) | 0.004 | |
| rFSSII | 1.068 (1.025–1.113) | 0.002 |
rSS, residual SYNTAX score; rFSS, residual SYNTAX score; MACEs, major adverse cardiovascular events; QFR, quantitative flow ratio; HR, hazard ratio; CI, confidence interval; SS, SYNTAX score; FSS, functional SYNTAX score.
Log-risk analysis showed significant differences from different risk stratification on MACEs except SS (log-risk p = 0.089). After recalculating the SS, the survival-free ratio stratified by FSS decreased from 70.83% to 61.29% in thehigh-risk group. After recalculating the SSII, the survival-free ratio stratified by FSSII decreased from 38.46% to 27.27% in the high-risk group and increased from 84.09% to 86.05% in the low-risk group (Fig. 2).
 Fig. 2.
Survival free from MACEs in different risk stratification under different scoring systems. (A,B) After recalculation by QFR-based SS, the survival-free ratio decreased from 70.83% to 61.29% in the high-risk group. (C,D) After recalculation by QFR-based SSII, the survival-free ratio decreased from 38.46% to 27.27% in a high-risk group and increased from 84.09% to 86.05% in a low-risk group. SS, SYNTAX score; FSS, functional SYNTAX score; SSII, SYNTAX score II; FSSII, functional SYNTAX score II; QFR, quantitative flow ratio; MACEs, major adverse cardiovascular events; HR, hazard ratio; CI, confidence interval.
Although the area under the curve (AUC) of SSII (AUC = 0.669) and FSSII (AUC = 0.670) were larger than the SS (AUC = 0.647) and FSS (AUC = 0.618), no significant differences were found. Furthermore, FSSII showed no superior predictive ability than SSII. There were also no remarkable differences in predictive ability between the SS and SSII groups (Fig. 3).
 Fig. 3.
Receiver-operator characteristic (ROC) curve analysis for different scoring systems. (A) Classified by SS and FSS. (B) Classified by SSII and FSSII. (C) Classified by SS and SSII. AUC, area under the curve; SS, SYNTAX score; FSS, functional SYNTAX score; SSII, SYNTAX score II; FSSII, functional SYNTAX score II.
The main finding of this study was that either SS or SSII combined with the functional score system could decrease the portion of high-risk and medium-risk patients. Furthermore, the study also showed that SSII and FSSII had accurate predictive abilities. Risk stratification based on FSSII showed a better MACE predictive ability. These findings revealed that a non-invasive QFR-based SYNTAX score II might be a good prognostic predictor in multivessel disease patients with different risk stratification.
SYNTAX score was a classical anatomy score system to predict the prognosis of
multivessel disease patients. In high-risk SS multivessel disease patients, coronary artery bypass surgery (CABG)
showed a mortality benefit over PCI [19, 20]. SYNTAX score II decreased the bias
of clinical factors by bringing the factors of age, creatinine clearance (CrCl), LVEF, sex, left main
lesion, chronic obstructive pulmonary disease (COPD), and peripheral vascular disease (PVD) into the calculation. It even showed a better predictive
ability than SS in PCI patients with complex coronary disease [2, 21]. In this
study, we calculated SSII cut-off values of 28, 28–38, and
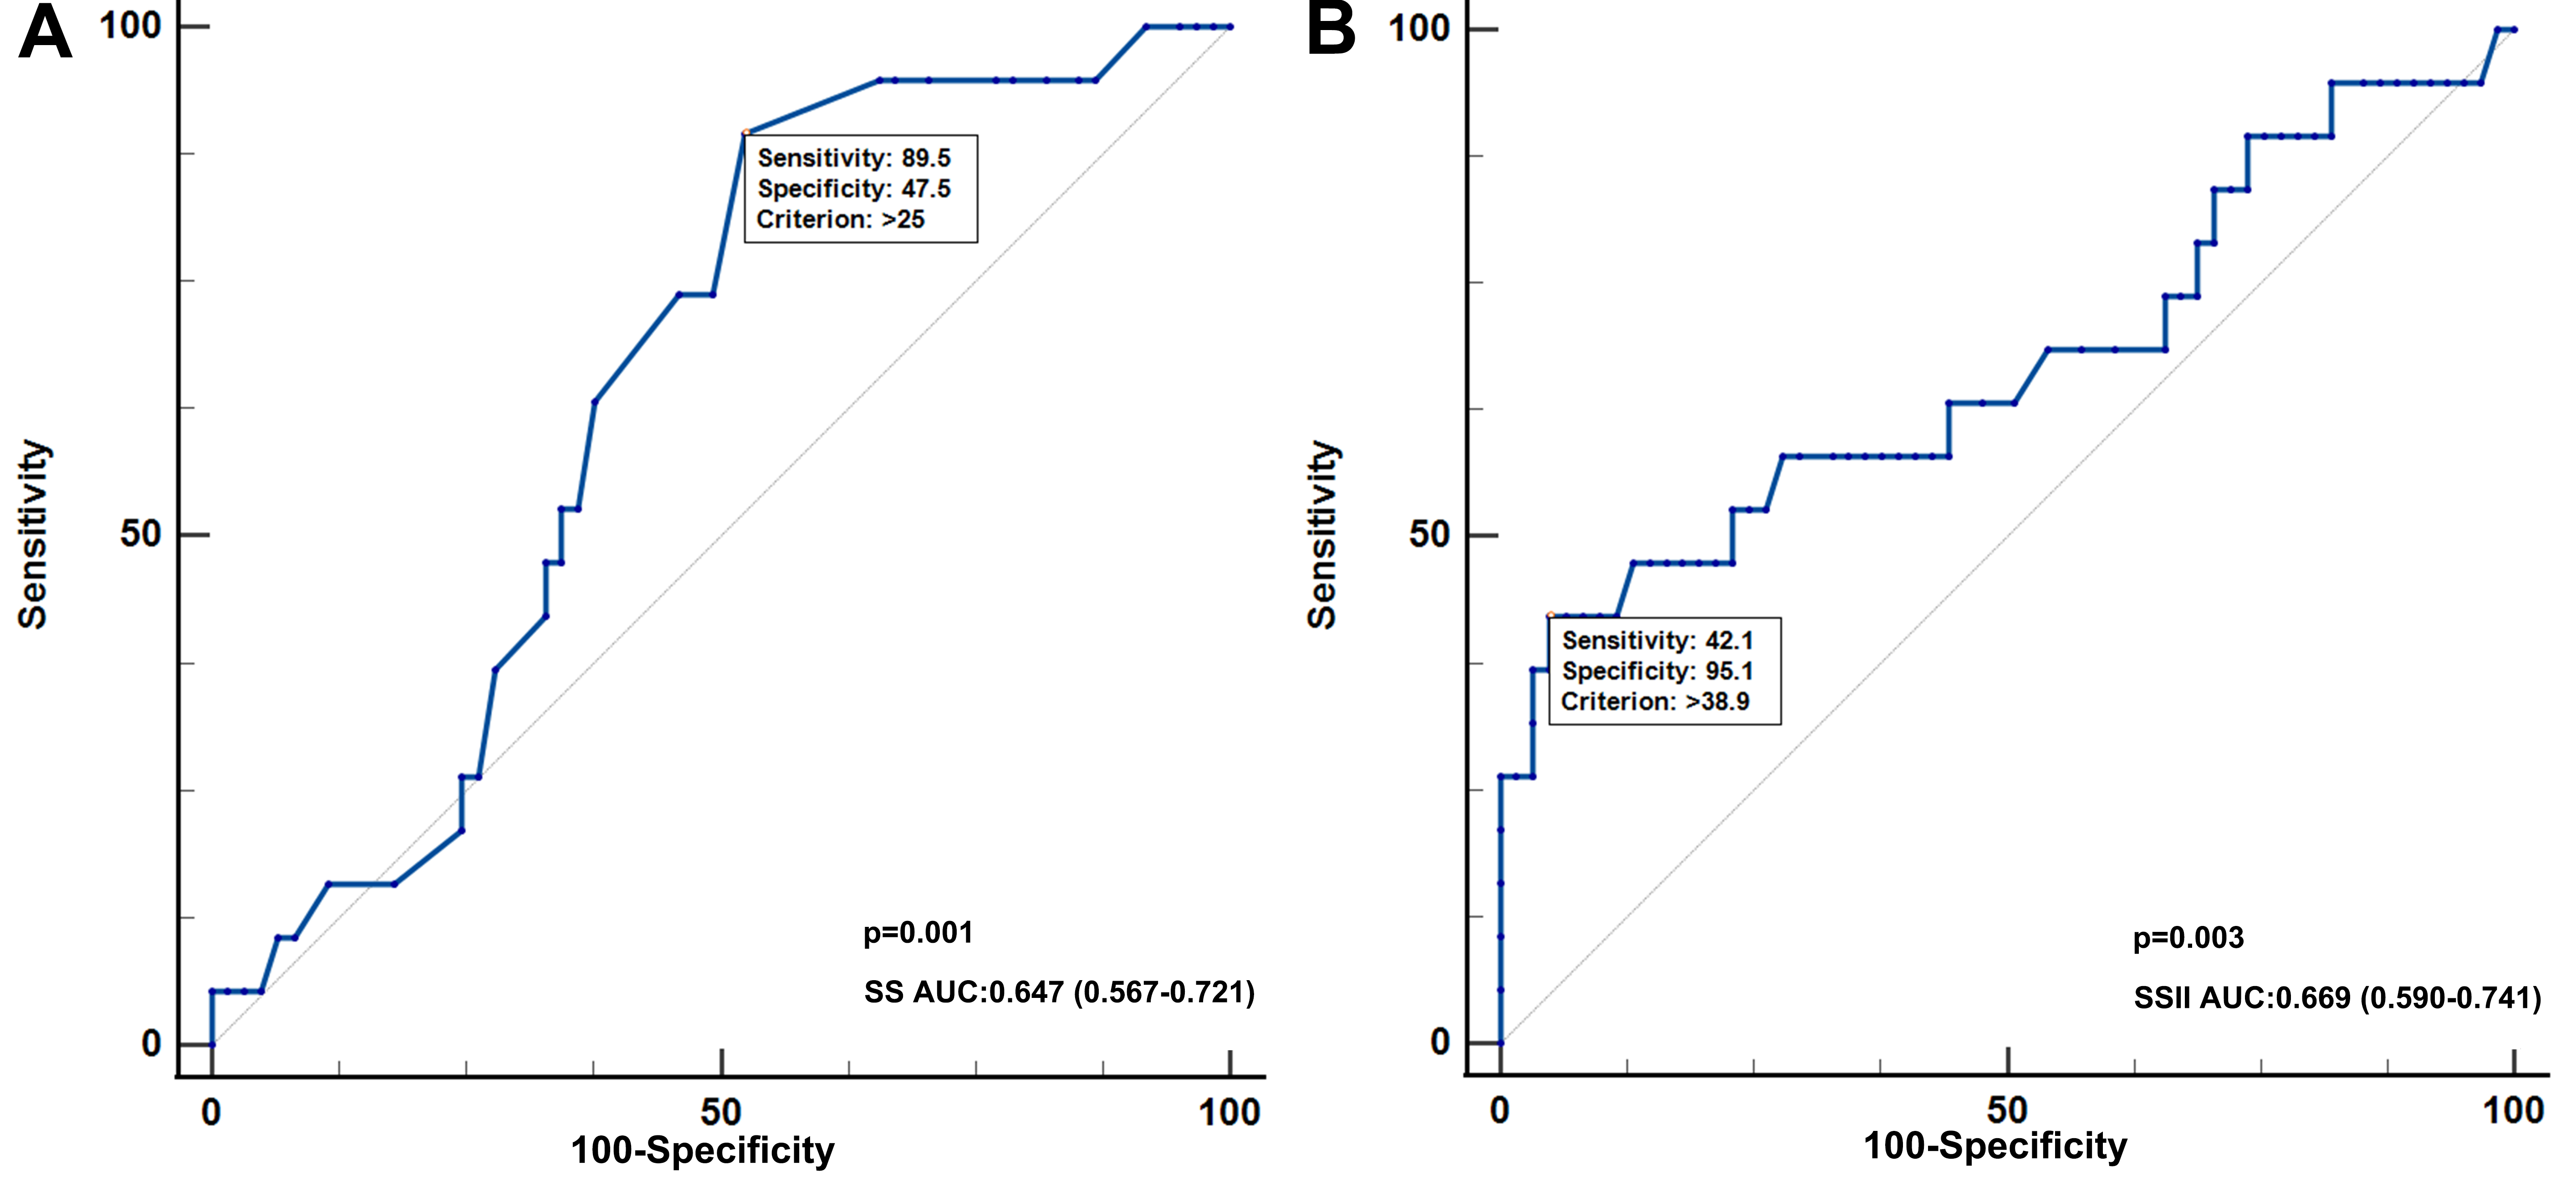 Fig. 4.
Receiver-operator characteristic (ROC) curve analysis of SS and SSII for MACE patients. (A) The predictive ability of SS in diagnosis of MACE in all patients. (B) The predictive ability of SSII in diagnosis of MACEs in all patients. SSII, SYNTAX score II; AUC, area under the curve; SS, SYNTAX score; MACE, major adverse cardiovascular event.
Nam et al. [11] integrated the SS and FFR to develop the concept of the
functional SYNTAX score. They calculated the SS only in vessels with low FFR
(
Studies on the value of FFR after PCI when predicting the prognosis of patients are relatively common [11], but there are still few studies on QFR after PCI [16]. In the study by Xu et al. [22], a QFR-guided PCI strategy improved 1-year clinical outcomes of patients compared with standard angiography guidance. We analyzed the Kaplan–Meier curves in different groups under different scoring systems to evaluate the prognostic value of the different score systems. We found that after recalculation using FSS, the survival free ratio from MACEs in different risk stratifications showed significant differences in high-, medium- and low-risk groups compared with SS (log-risk p = 0.089 in SS, log-risk p = 0.014 in FSS). In Table 3, the univariable analysis showed no significant impact on MACEs when clinical factors were independently assessed, except LVEF. However, when clinical factors were integrated into SS for SSII, either SSII (HR: 1.072, 95% CI: 1.026–1.120, p = 0.002) or FSSII (HR: 1.069, 95% CI: 1.025–1.115, p = 0.002) showed significant effects on MACEs. In addition, based on FSSII risk stratification, survival-free from the MACE ratio decreased from 38.48% to 27.27% in the high-risk group and increased from 84.09% to 86.05% in the low-risk group compared with SSII risk stratification. Considering these results, FSSII may be an appropriate scoring system to predict MACEs in patients with different risk stratification.
Unfortunately, FSSII showed better AUC in predicting MACEs, but it did not result in statistically significant results compared with the FSS system (p = 0.881). rSS, rFSS, rSSII, and rFSSII were also analyzed in this study. Even though they were independent predictors of MACEs, they did not meet statistical significance when compared. In recent studies, 0.80 was used for the cut-off value to decide the physiological function of lesions [22, 23]. A lower cut-off value will change the number of patients in different risk stratification based on the FSSII system. Considering the cut-off value and sample size, a further study based on the results of this study may enhance the predictive ability of FSSII.
This study’s limitation was its small sample size, which lowered its statistical efficiency. Furthermore, some studies showed that 0.80 could be a possible cut-off value for QFR. Therefore, the different criteria of QFR may also affect the efficacy of FSSII in predicting MACEs. Moreover, the discrepancy between different methods of calculating QFR was also a factor that may affect the result. Considering these limitations, our ongoing prospective study with a bigger sample may provide more definitive results in the near future.
Compared with classical SS and SSII, FSS and FSSII provided better risk stratification criteria to predict the occurrence of MACEs by regrouping patients. SSII and FSSII might be good predictors for MACEs in multivessel patients.
The original contributions presented in the study are included in the article, further inquiries can be directed to the corresponding author.
SYZ, MW and QG: Conceptualization, Investigation, Writing – original draft. XRZ, YC and SFG: Patient follow-up management, Data collection, Writing – review & editing. XXX, JSW and XKQ: Data analysis, Statistics and Writing – review & editing; WZH: Conceptualization, Design, Critical article revision. All authors have participated sufficiently in the work and agreed to be accountable for all aspects of the work.
This observational study was approved by the lead ethical committee of Huadong Hospital (No. 2020K064). Written informed consent was obtained from the parents.
Not applicable.
This study was supported by Research subject of Shanghai Municipal Health Commission (202040298) and Clinical research project of Huadong Hospital (HDLC2022014).
The authors declare no conflict of interest.
References
Publisher’s Note: IMR Press stays neutral with regard to jurisdictional claims in published maps and institutional affiliations.