


 , Xiao-rong Fu 3, Yi-ju Chen 1, Ya-bo Zheng 1, Liu Wang 1, Wen-sheng Zhang 1
1 Image Center, Hainan Enhance International Medical Center, 571437 Boao, Hainan, China
2 Image Center, Wuhan Asia Heart Hospital, 430022 Wuhan, Hubei, China
3 Department of Pediatrics, Wuchang Hospital of Wuhan University of Science and Technology, 430062 Wuhan, Hubei, China
Abstract
Background: Using fluid dynamic modeling, noninvasive
fractional flow reserve (FFR) derived from coronary computed tomography
angiography (CCTA) data provides better anatomic and functional
information than CCTA, with a high diagnostic and discriminatory value for
diagnosing hemodynamically significant lesions. Myocardial blood flow index
(MBFI) based on CCTA is a physiological parameter that reflects myocardial
ischemia. Thus, exploring the relationship between computed tomography derived fractional flow reserve (CT-FFR) and MBFI could be
clinically significant. This study aimed to investigate the
relationship between CT-FFR and MBFI and to analyze the feasibility of MBFI
differing from CT-FFR in diagnosing suspected coronary artery disease (CAD).
Methods: Data from 61 patients (35 males, mean age: 59.2
Keywords
- coronary artery disease
- CT-FFR
- myocardial blood flow index
- function assessment
- diagnostic test
Recently, there has been an increasing emphasis on evaluating the functionality of coronary lesions [1, 2]. Several studies have clarified the value of functional indicators for diagnosing coronary artery disease (CAD) accurately. For example, fractional flow reserve (FFR)-guided percutaneous coronary intervention can significantly improve the prognosis of patients [3], the myocardial microcirculation resistance index can allow the evaluation of the degree of damage to the myocardial microcirculation [4], and myocardial blood flow can assess the semiquantitative degree of ischemia in patients with CAD [5]. Although the above methods are effective, they involve expensive, invasive examinations, making them less conducive to clinical popularization [6, 7].
Regarding noninvasive functional methods, FFR derived from coronary computed tomography angiography (CCTA) data, which mimics FFR based on the pressure measurement of the invasive catheter, can play a significant role in functional evaluation to assess myocardial ischemia. It provides a one-stop assessment of the anatomical and functional information of CAD through a single examination, without additional imaging and the use of vasoactive drugs, making it a new hot topic in clinical research. However, there are shortcomings, as its accuracy relies on high-quality CCTA imaging. Currently, the inclusion criteria for various large-scale clinical studies are relatively strict. Among patients who have experienced myocardial infarction in the past or have undergone revascularization, there is limited clinical data related to computed tomography derived fractional flow reserve (CT-FFR), which limits its widespread clinical application.
Researchers have also highlighted that CT-FFR, which mimics FFR based on the
pressure measurement of the invasive catheter, can play a significant role in
functional evaluation to assess myocardial ischemia using the cutoff value of
Our previous study demonstrated that myocardial blood flow index (MBFI), a reflective index derived from CCTA without additional scanning time and radiation dose, can evaluate the risk of CAD in suspected patients [2]. In the present study, using invasive coronary angiography (ICA) as the gold standard for determining high-risk suspected CAD, the potential feasibility of MBFI was evaluated in comparison with CT-FFR.
This study aimed to further explore the diagnostic value of MBFI in determining the risk of suspected CAD.
Inclusion criteria: Clinical medical prospective data of 7500 patients suspected of angina pectoris (AP) (including stable AP, unstable AP, and atypical AP) [9] and who had undergone CCTA were continuously collected with continuous Arabic numeral numbering from March 2022 to October 2022. Patient data with a number in multiples of 5 were further analyzed via CT-FFR. A total of 61 cases were selected for the CT-FFR protocol (Fig. 1, Table 1). This study was approved by the ethics committee of the Hainan Enhance International Medical Center (No. 20220010). The study was implemented according to the standards of the Declaration of Helsinki (https://www.wma.net/policy/). All patients provided written informed consent.
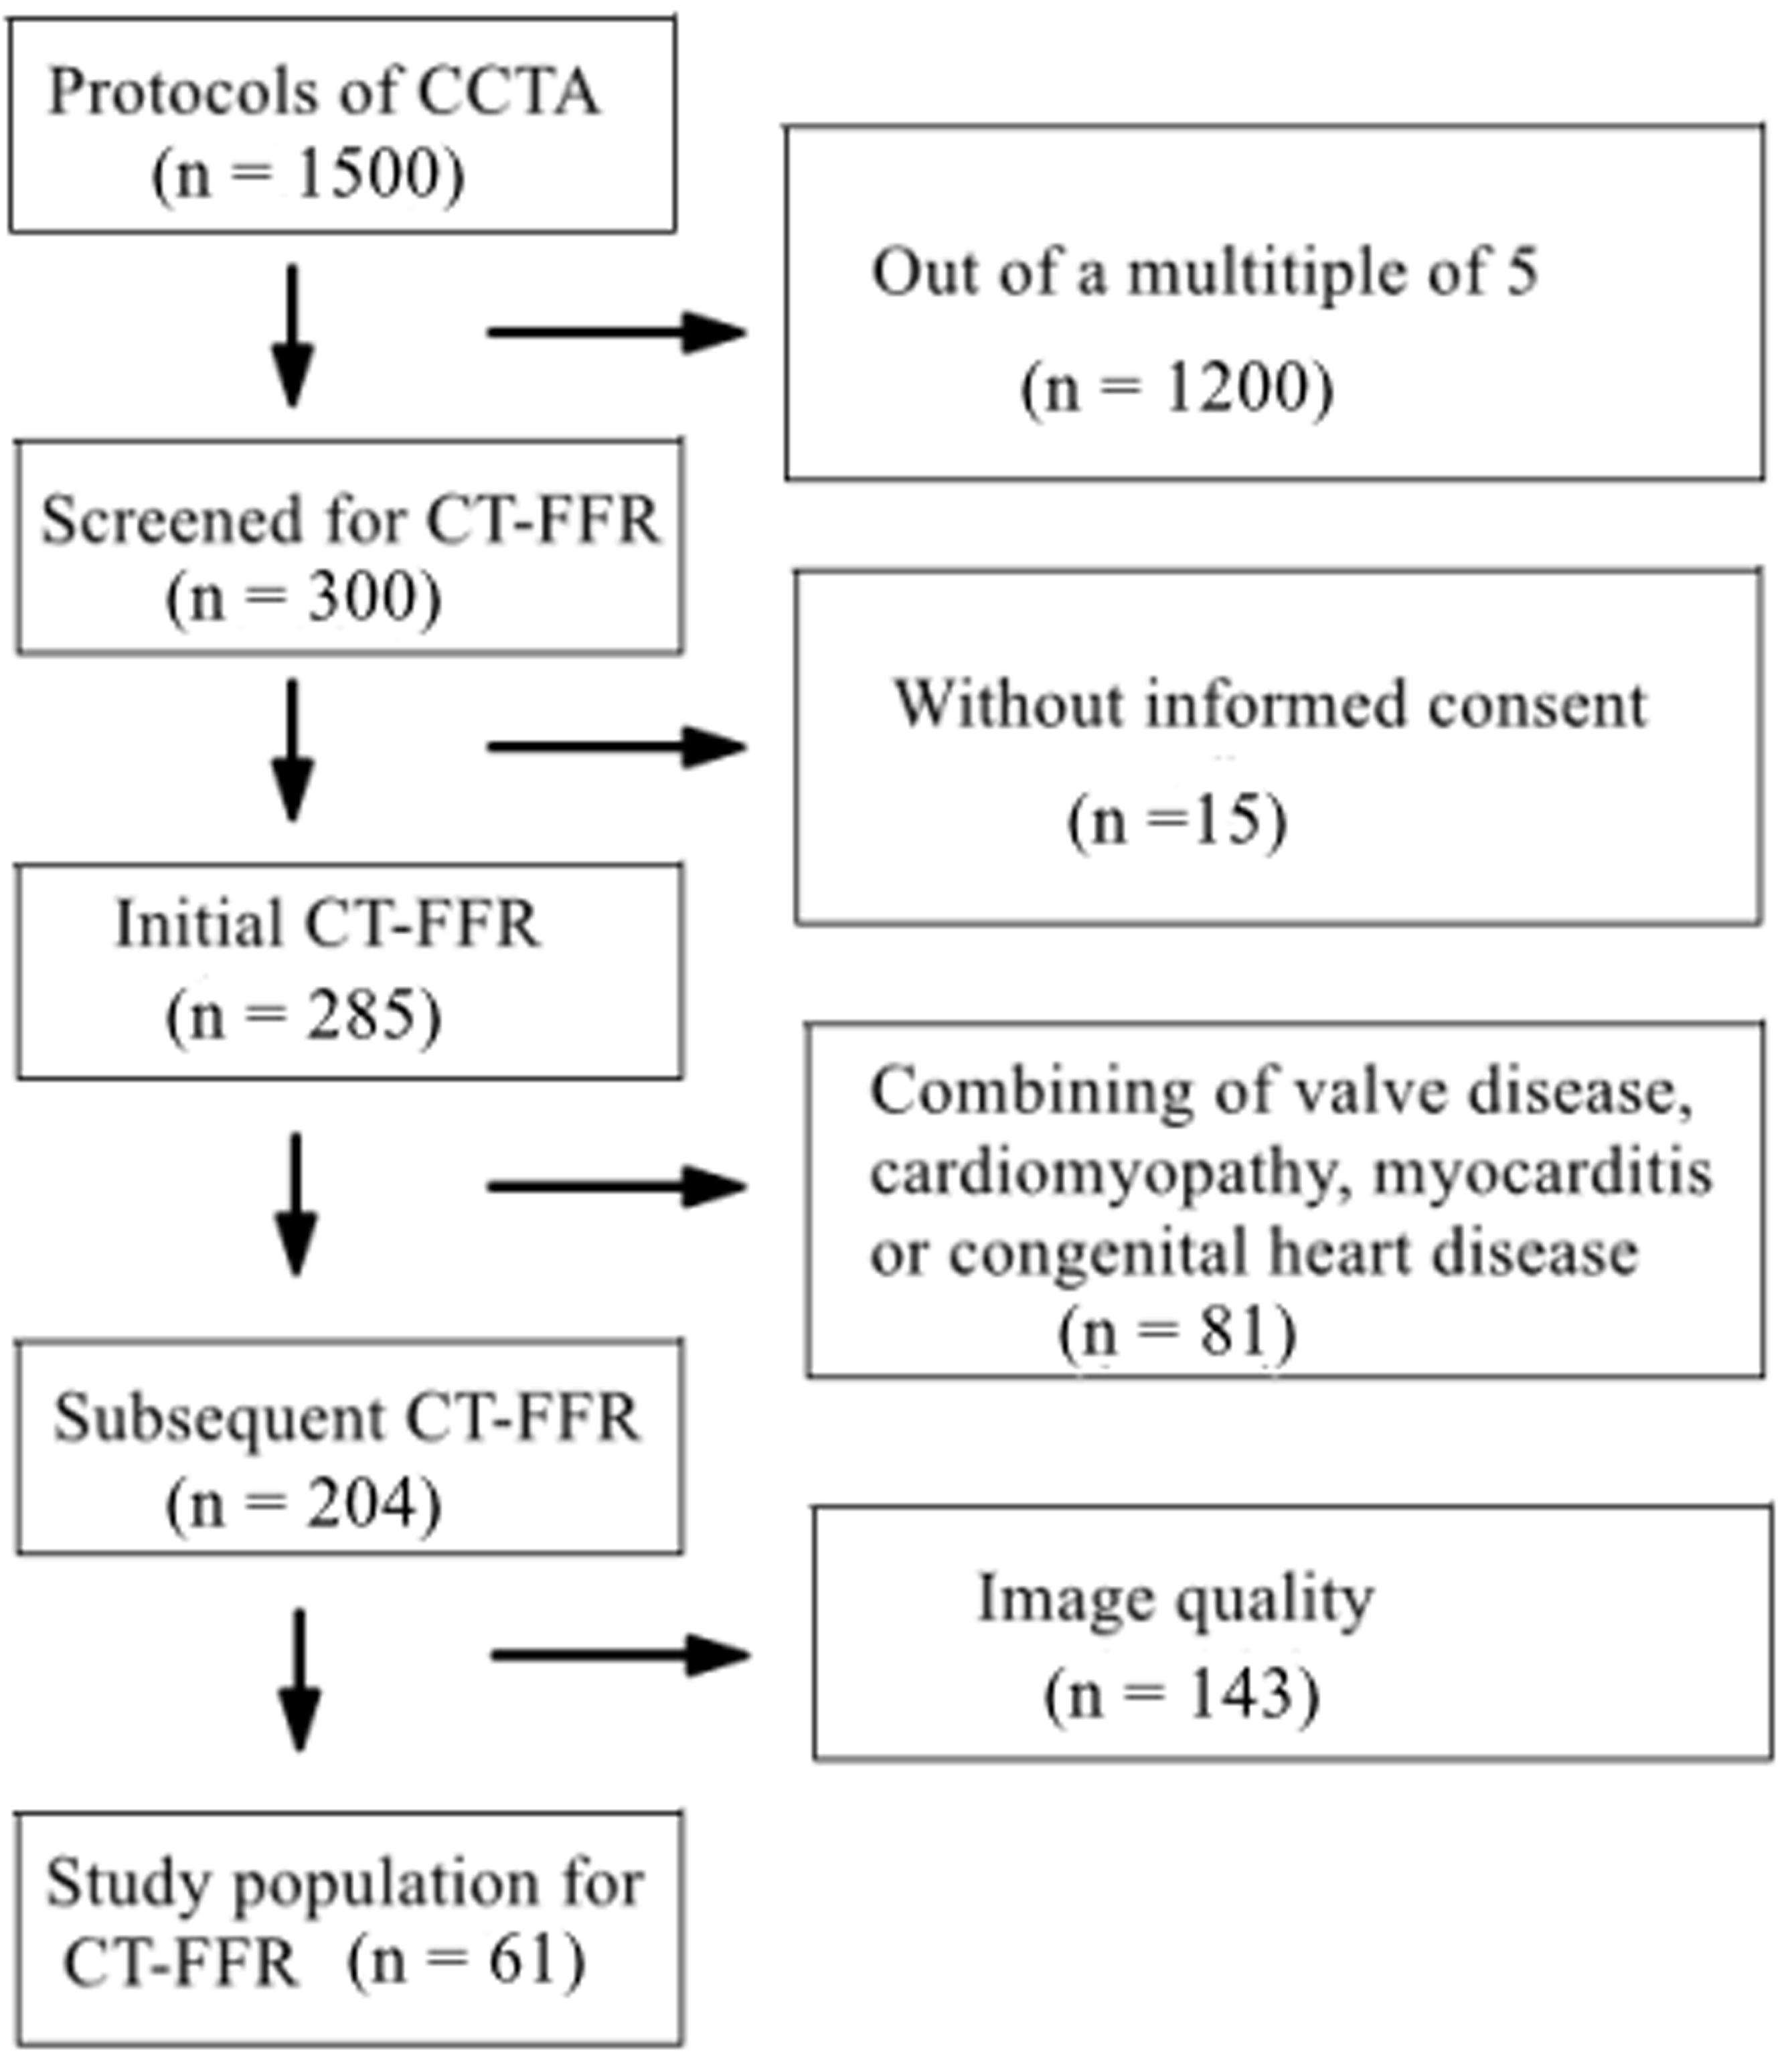 Fig. 1.
Flowchart of patient selection. Note: CCTA, coronary computed tomography angiography; CT-FFR, computed tomography derived fractional flow reserve.
| Characteristics | Total (n = 61) | |
| Men/Women | 35/26 | |
| Average age (years) | 59.2 | |
| History of risk factors | ||
| Hypertension |
15 | |
| Diabetes mellitus |
10 | |
| Dyslipidaemia |
31 | |
| Smoking (n) | 13 | |
| Family history of CAD | 6 | |
| Average heart rate (times/minute) | 76 | |
| Average diastolic blood pressure (mmHg) | 82 | |
| Average serum creatinine (µmol/L) | 79 | |
| Average body mass index (kg/m |
24 | |
| AP | ||
| Stable AP | 46 | |
| Unstable AP | 15 | |
| Results of ICA | ||
| Normal | 2 | |
| One-vessel diameter stenosis | 33 | |
| Two-vessel diameter stenosis | 17 | |
| Three-vessel diameter stenosis | 9 | |
| Average radiation dose | (3.06 | |
Values are mean
Note: CAD, coronary artery disease; AP, angina pectoris; ICA, invasive coronary angiography.
Exclusion criteria: Patients with the following combined diseases were excluded: ST-elevation myocardial infarct, non-ST-elevation myocardial infarct, heart valve disease, cardiomyopathy, myocarditis, congenital heart disease, pulmonary hypertension, and emphysema. Patients with poor-quality CCTA scans, diffuse calcification in the coronary artery, and deep or diffuse myocardial bridge were also excluded.
For the prospectively electrocardiogram-triggered CCTA (dual-source CT, SOMATOM
Definition, Siemens Healthcare, Forchheim, Germany) protocol (Adaptive Sequential, Siemens
Healthcare, Forchheim, Germany), the scanning parameters were set as follows using the CARE Dose 4D (Siemens Healthcare, Forchheim, Bavaria, Germany)
fully automatic exposure control: Collimation, 2
Anonymized CCTA data were analyzed. The commercial syngo.via service platform
(Siemens Medical Solutions, Erlangen, Germany; an offline work platform) was
used. If several lesions in the same coronary artery existed, the more obvious
lesion was selected and used for analysis. Using semiautomatic software, lesion
severity was assessed, and the percent diameter reduction was calculated based on
the lumen profile detected according to the minimum lumen and the corresponding
reference diameter value obtained from the automatic variation trend of the total
vessel. The degree of diameter narrowing was categorized as follows: normal,
Two experts with 10 years of experience in CCTA evaluation conducted the image quality assessment. In case of disagreement, a consensus was reached through discussion. Images without artifacts or sharpness noise were selected [10].
The myocardial blood flow model is based on a physical principle, i.e., the ratio of myocardial perfusion pressure to myocardial resistance (referred to as the myocardial blood flow) [11]. According to the lumped parameter network model [12], myocardial perfusion is a parallel characteristic impedance model [13], and the myocardial blood flow is primarily evaluated using myocardial blood perfusion pressure and myocardial microcirculation resistance (myocardial mass) [14]. Blood circulation in the heart comprises a series of pulses from the aorta to the venous end, and the entire process consists of approximately five cardiac cycles [15]. After five cardiac cycles, a certain volume of blood is distributed throughout the myocardium; hence, the myocardial blood flow to complete one cycle should include the blood flow of five cardiac cycles (Fig. 2). Furthermore, at rest, the right atrial pressure is usually 0 mmHg [16]; thus, the patient’s diastolic blood pressure (DP) can be considered as myocardial blood perfusion pressure. Therefore, the ratio of the DP multiplied by five cardiac cycles to the mass is called the myocardial blood flow. Since BMI [17], in addition to sex [18] and age [19], has been reported to be associated with myocardial blood flow [20], this study introduced a model of myocardial blood flow, which not only accounted for BMI and cardiac mass but also for sex and age to assess its clinical value in patients with chronic obstructive CAD [2, 11].
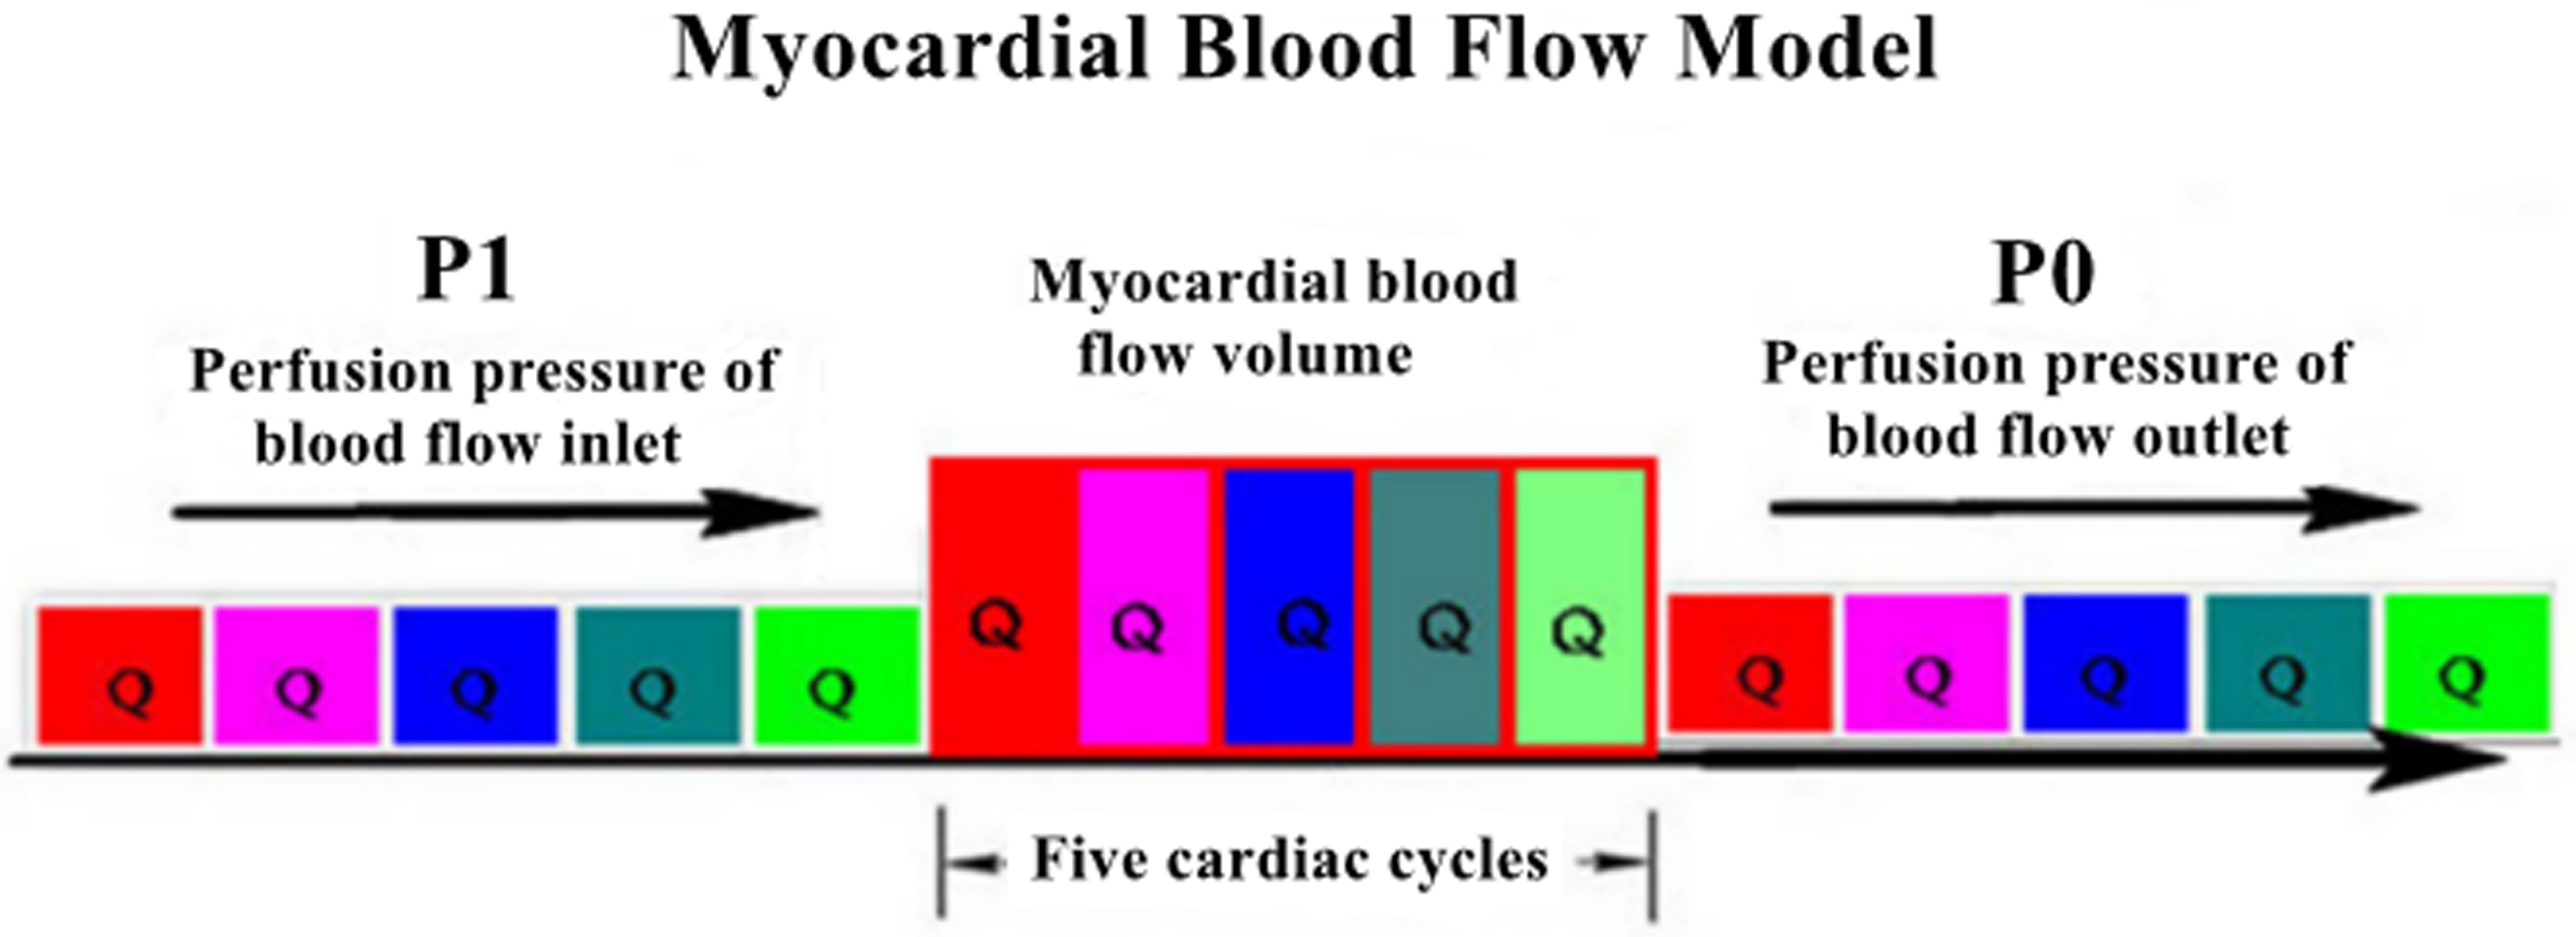 Fig. 2.
Myocardial blood flow model.
The Omron arm sphygmomanometer (Omron U10K, Dalian, China) was used. The
patient’s DP and HR were recorded in the sitting posture thrice, at intervals of
10 min. Subsequently, post-image processing software was used to measure cardiac
mass (M). The cardiac cycle time (T) was measured as 60 s divided by HR in 1 min.
The myocardial perfusion time (PT) is equivalent to 5
CT-FFR was analyzed in a blinded manner by two experienced observers at an independent core laboratory using a dedicated off-site software system (RuiXin-FFR, version 1.0, Raysight Medical, Shenzhen, China). The core laboratory indicated the location(s) of the wire-based FFR measurement(s) on a reconstructed coronary anatomy model [22].
ICA was performed according to the standard operating procedure used as the gold
standard method for diagnosing CAD and severe CAD. At least six views of the left
coronary arteries and two views of the right coronary arteries were projected.
Two cardiologists with over 10 years of experience in cardiac catheterization,
who were blinded to the results of CCTA, independently interpreted the
angiograms. All coronary artery segments
Continuous variables are expressed as mean
MBFI and CT-FFR were negatively correlated with ICA (r = –0.3670 and –0.4922, p = 0.0036 and 0.0001, respectively; Figs. 3,4).
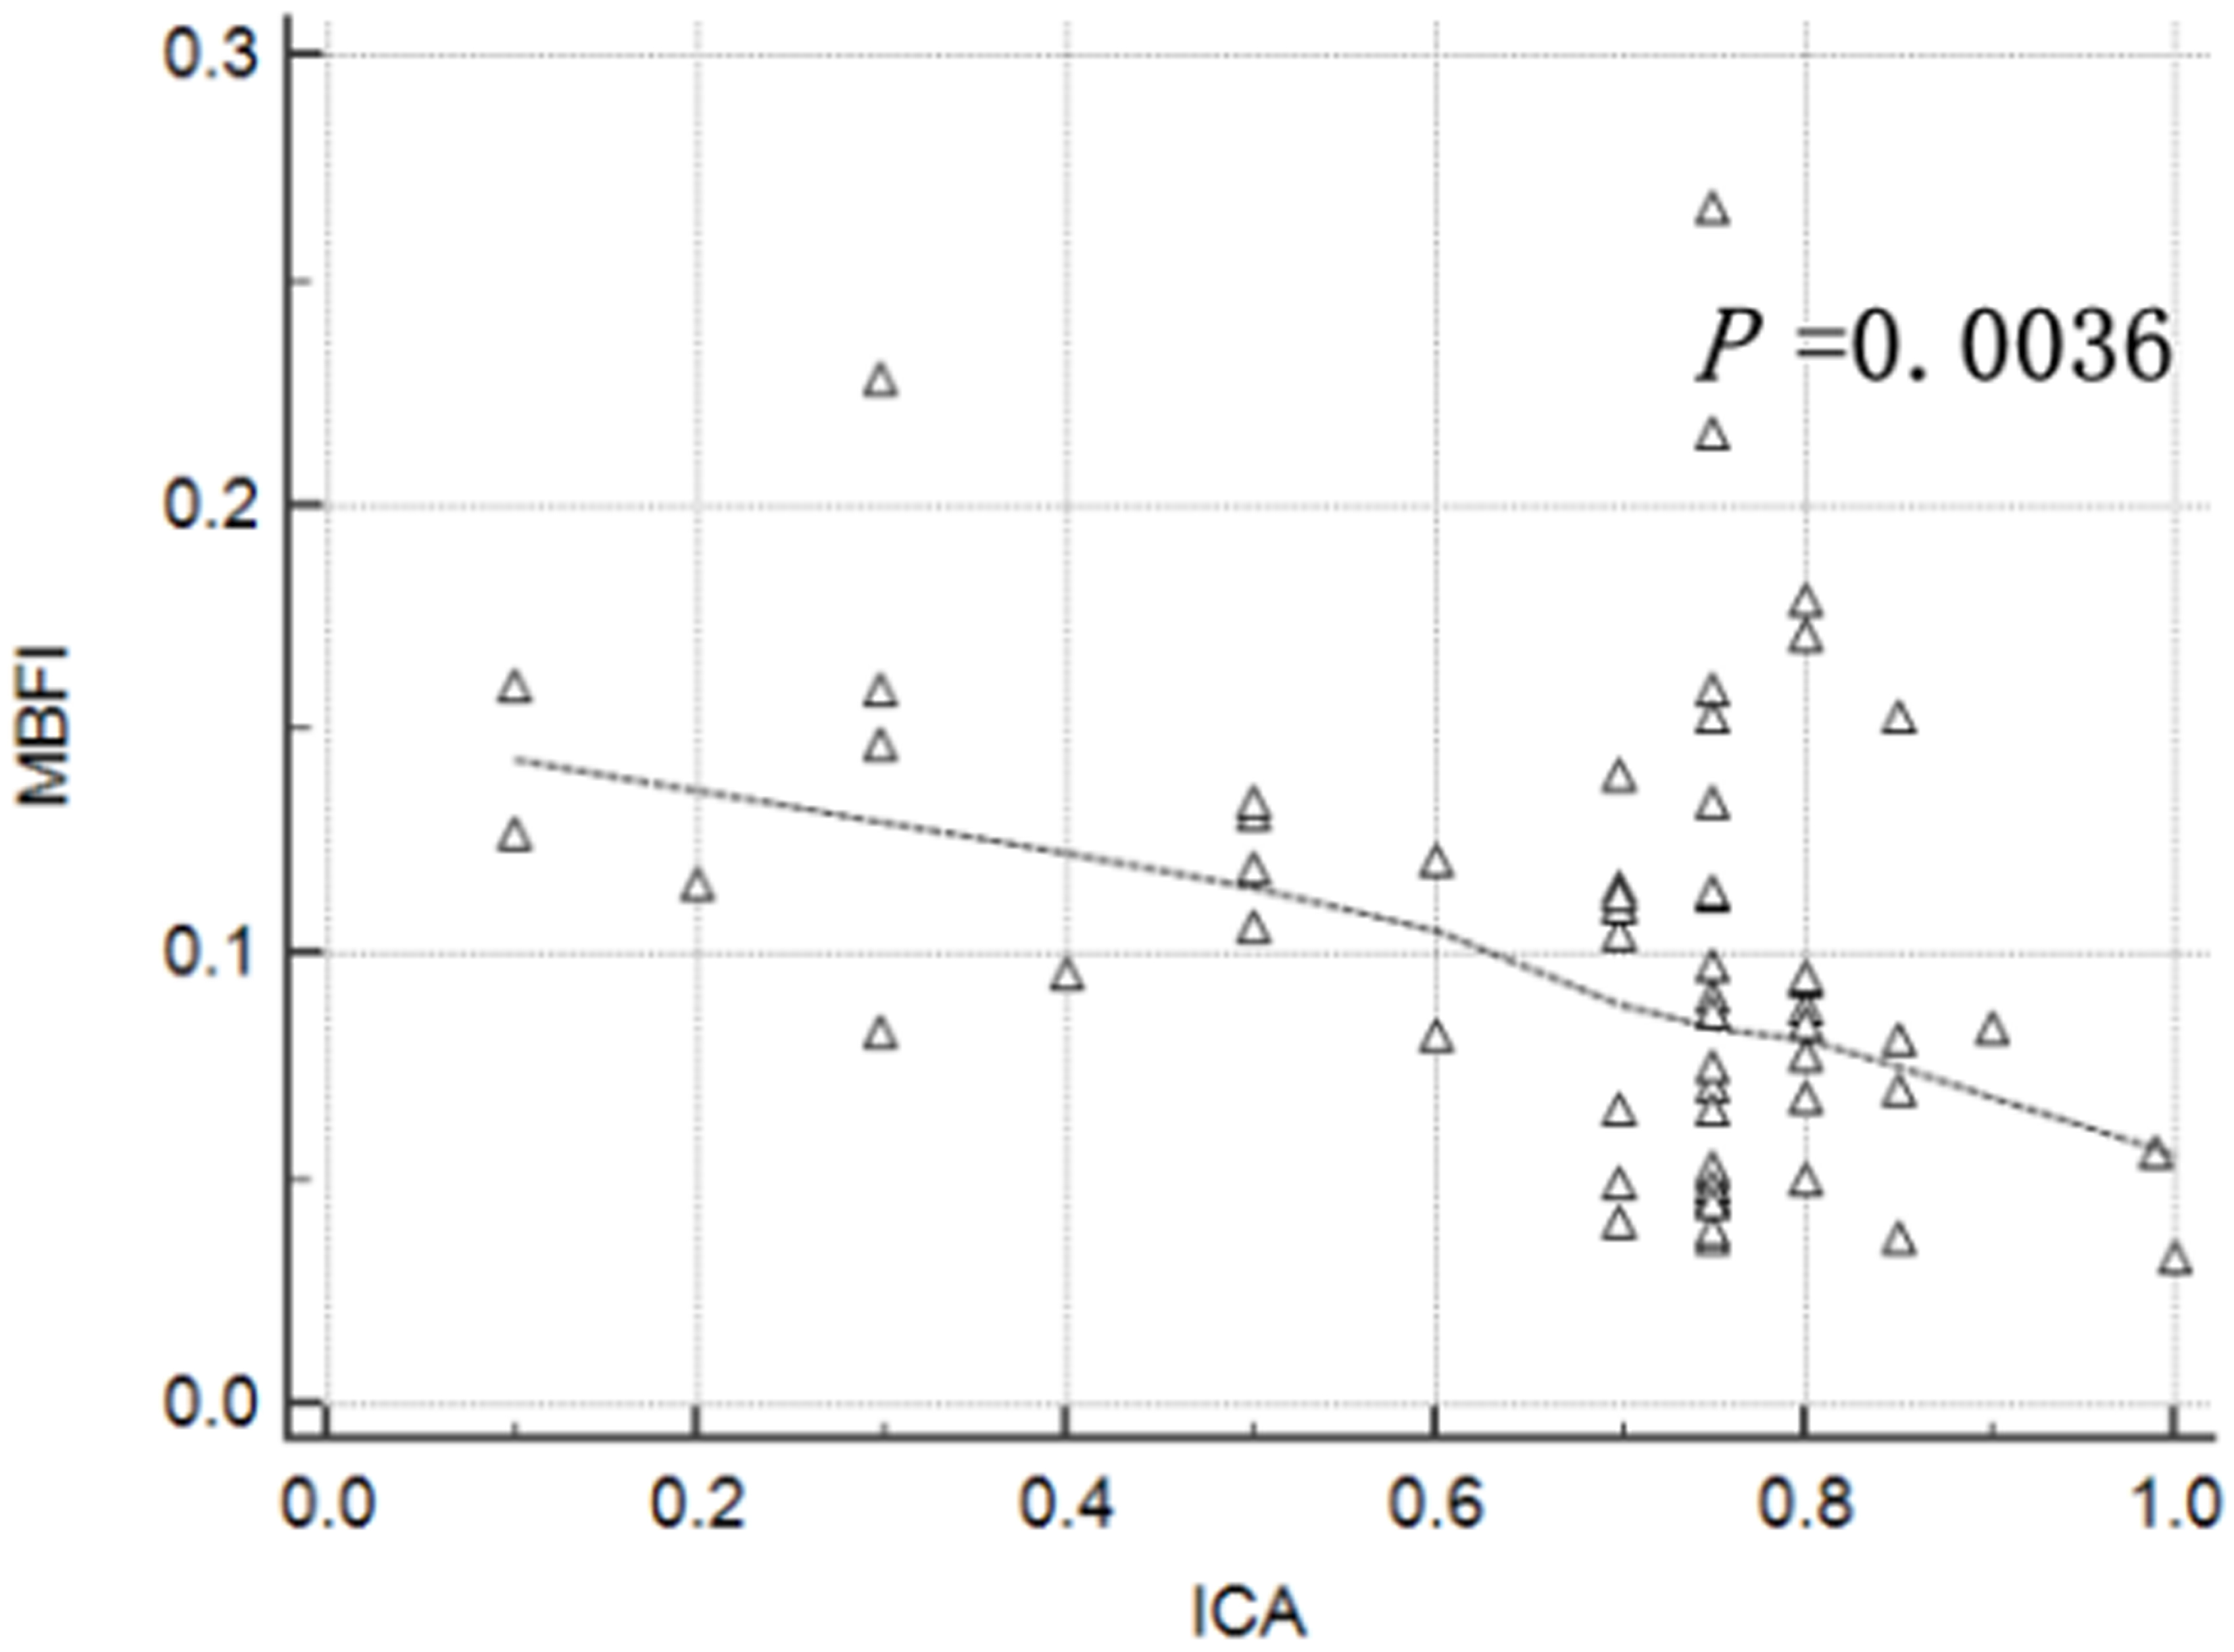 Fig. 3.
Correlation between myocardial blood flow index (MBFI) and invasive coronary angiography (ICA).
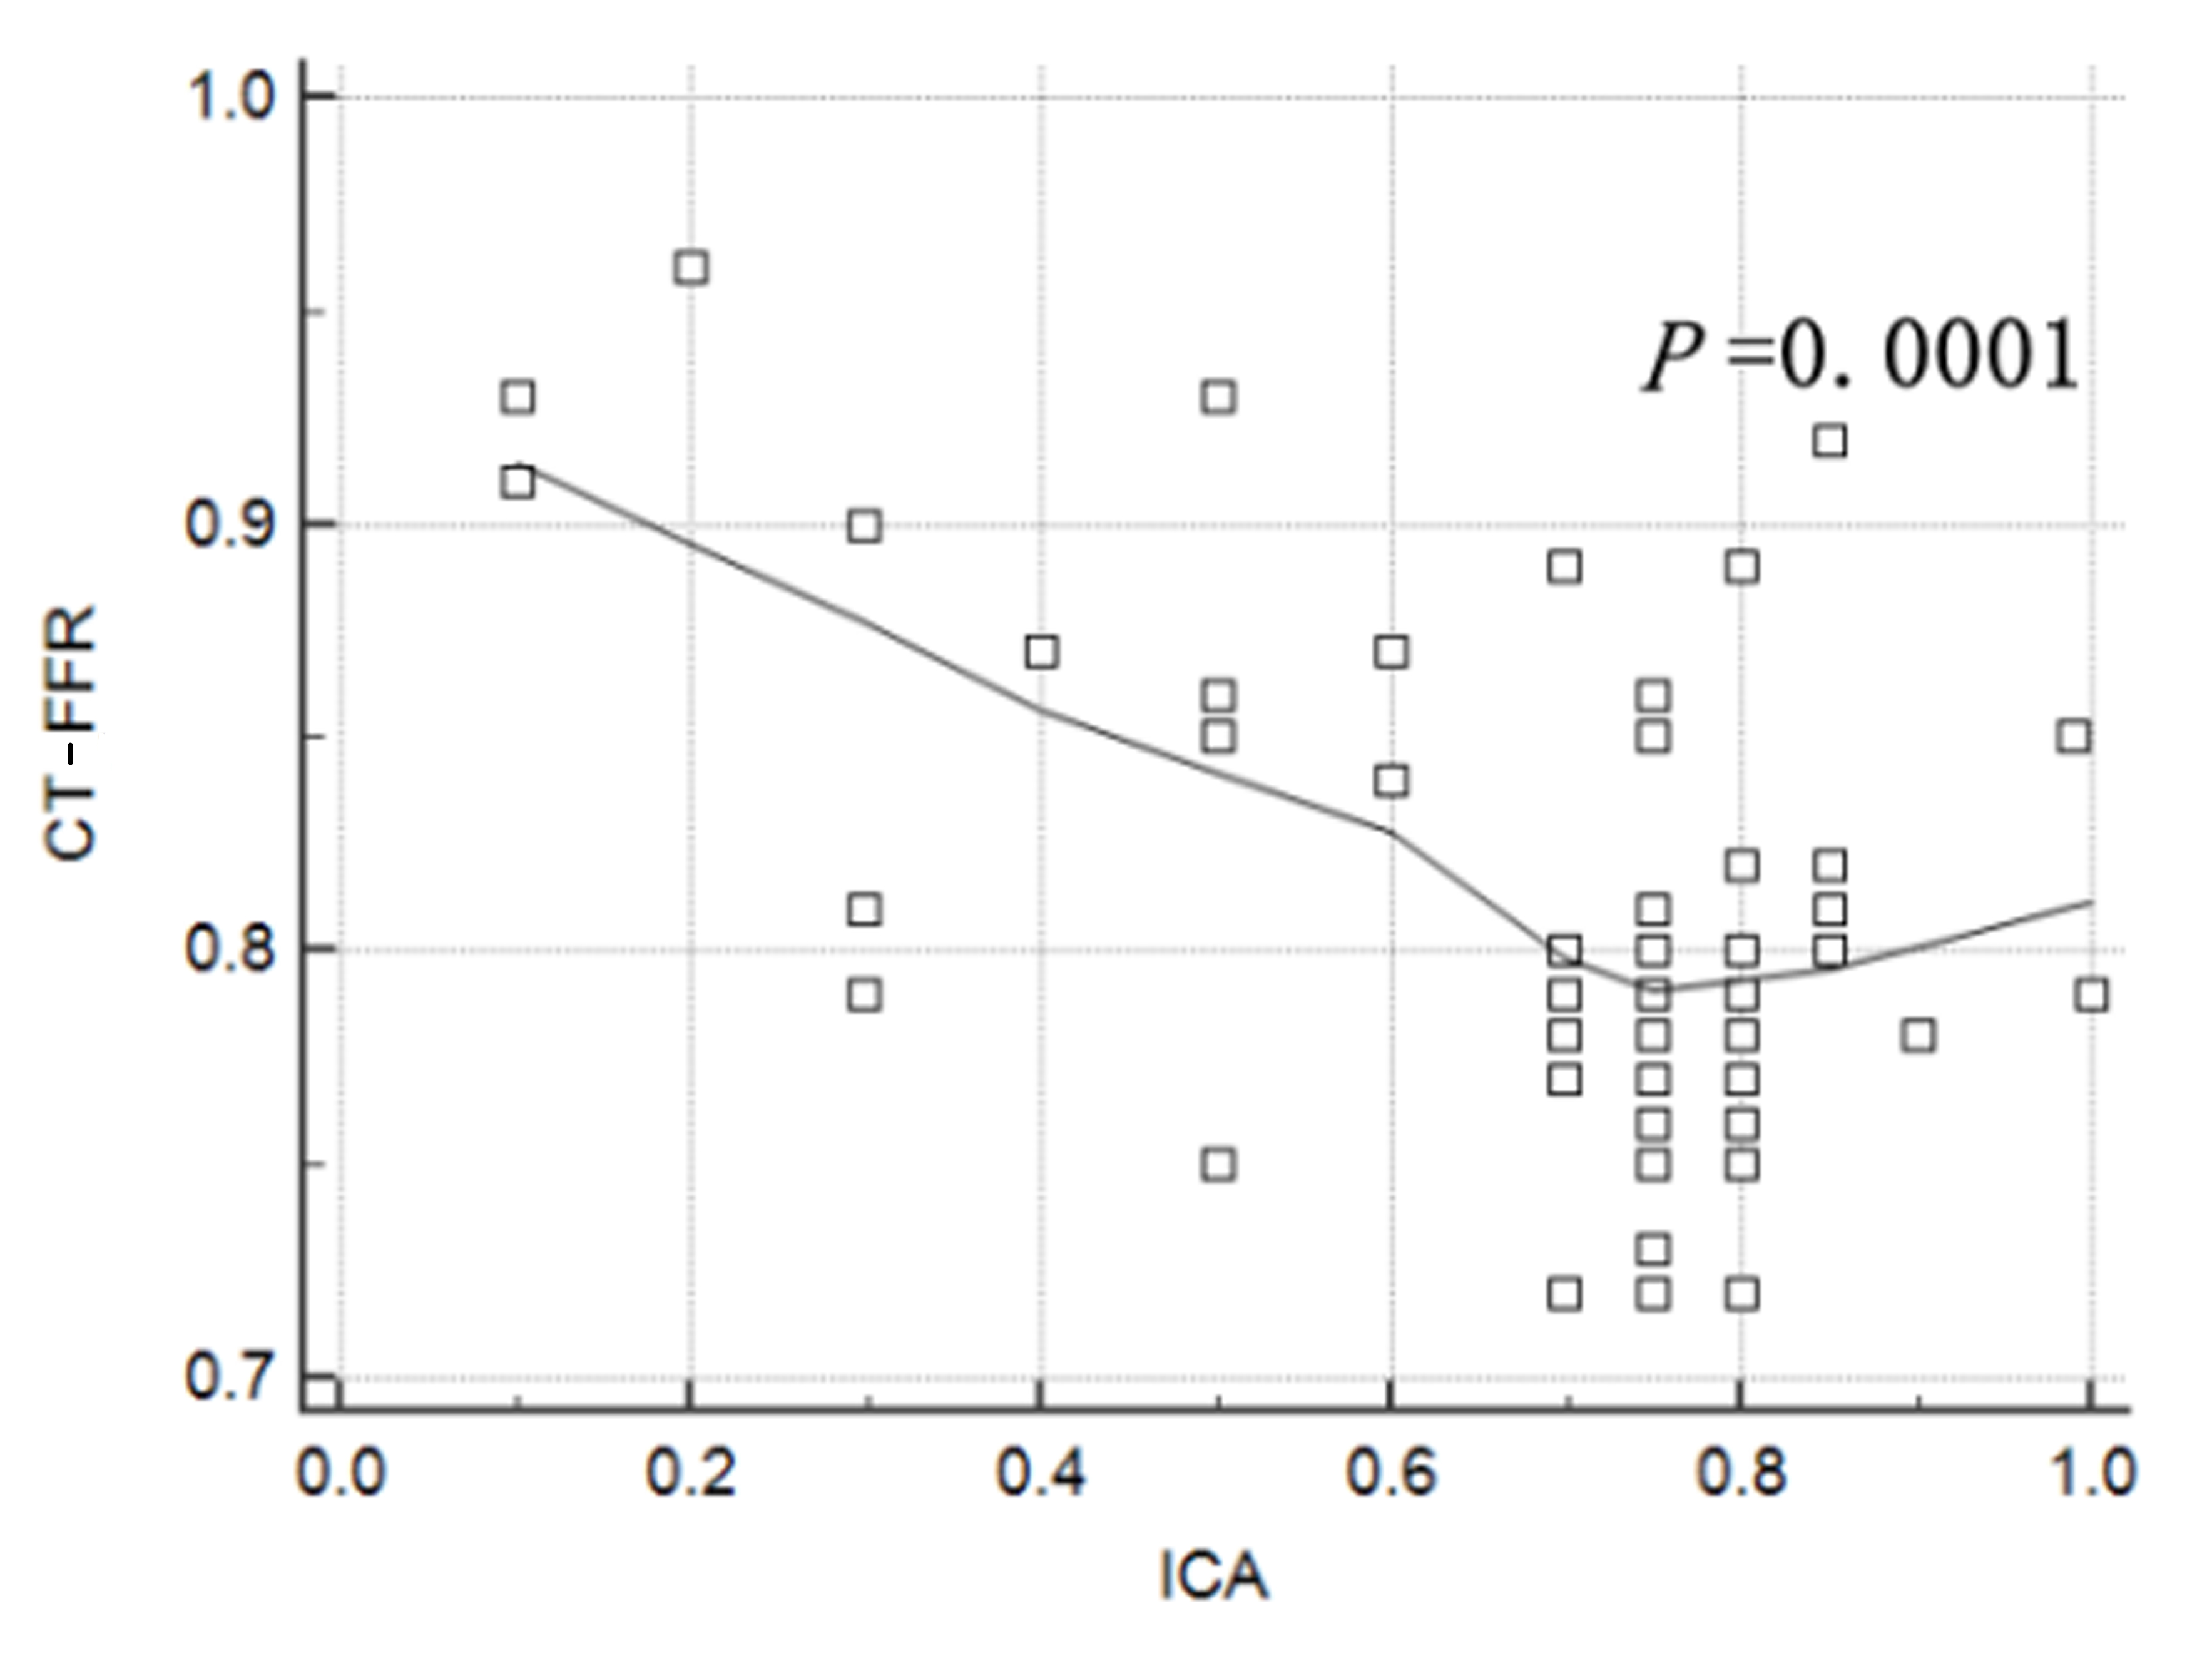 Fig. 4.
Correlation between computed tomography derived fractional flow reserve (CT-FFR) and invasive coronary angiography (ICA).
Using ICA (value
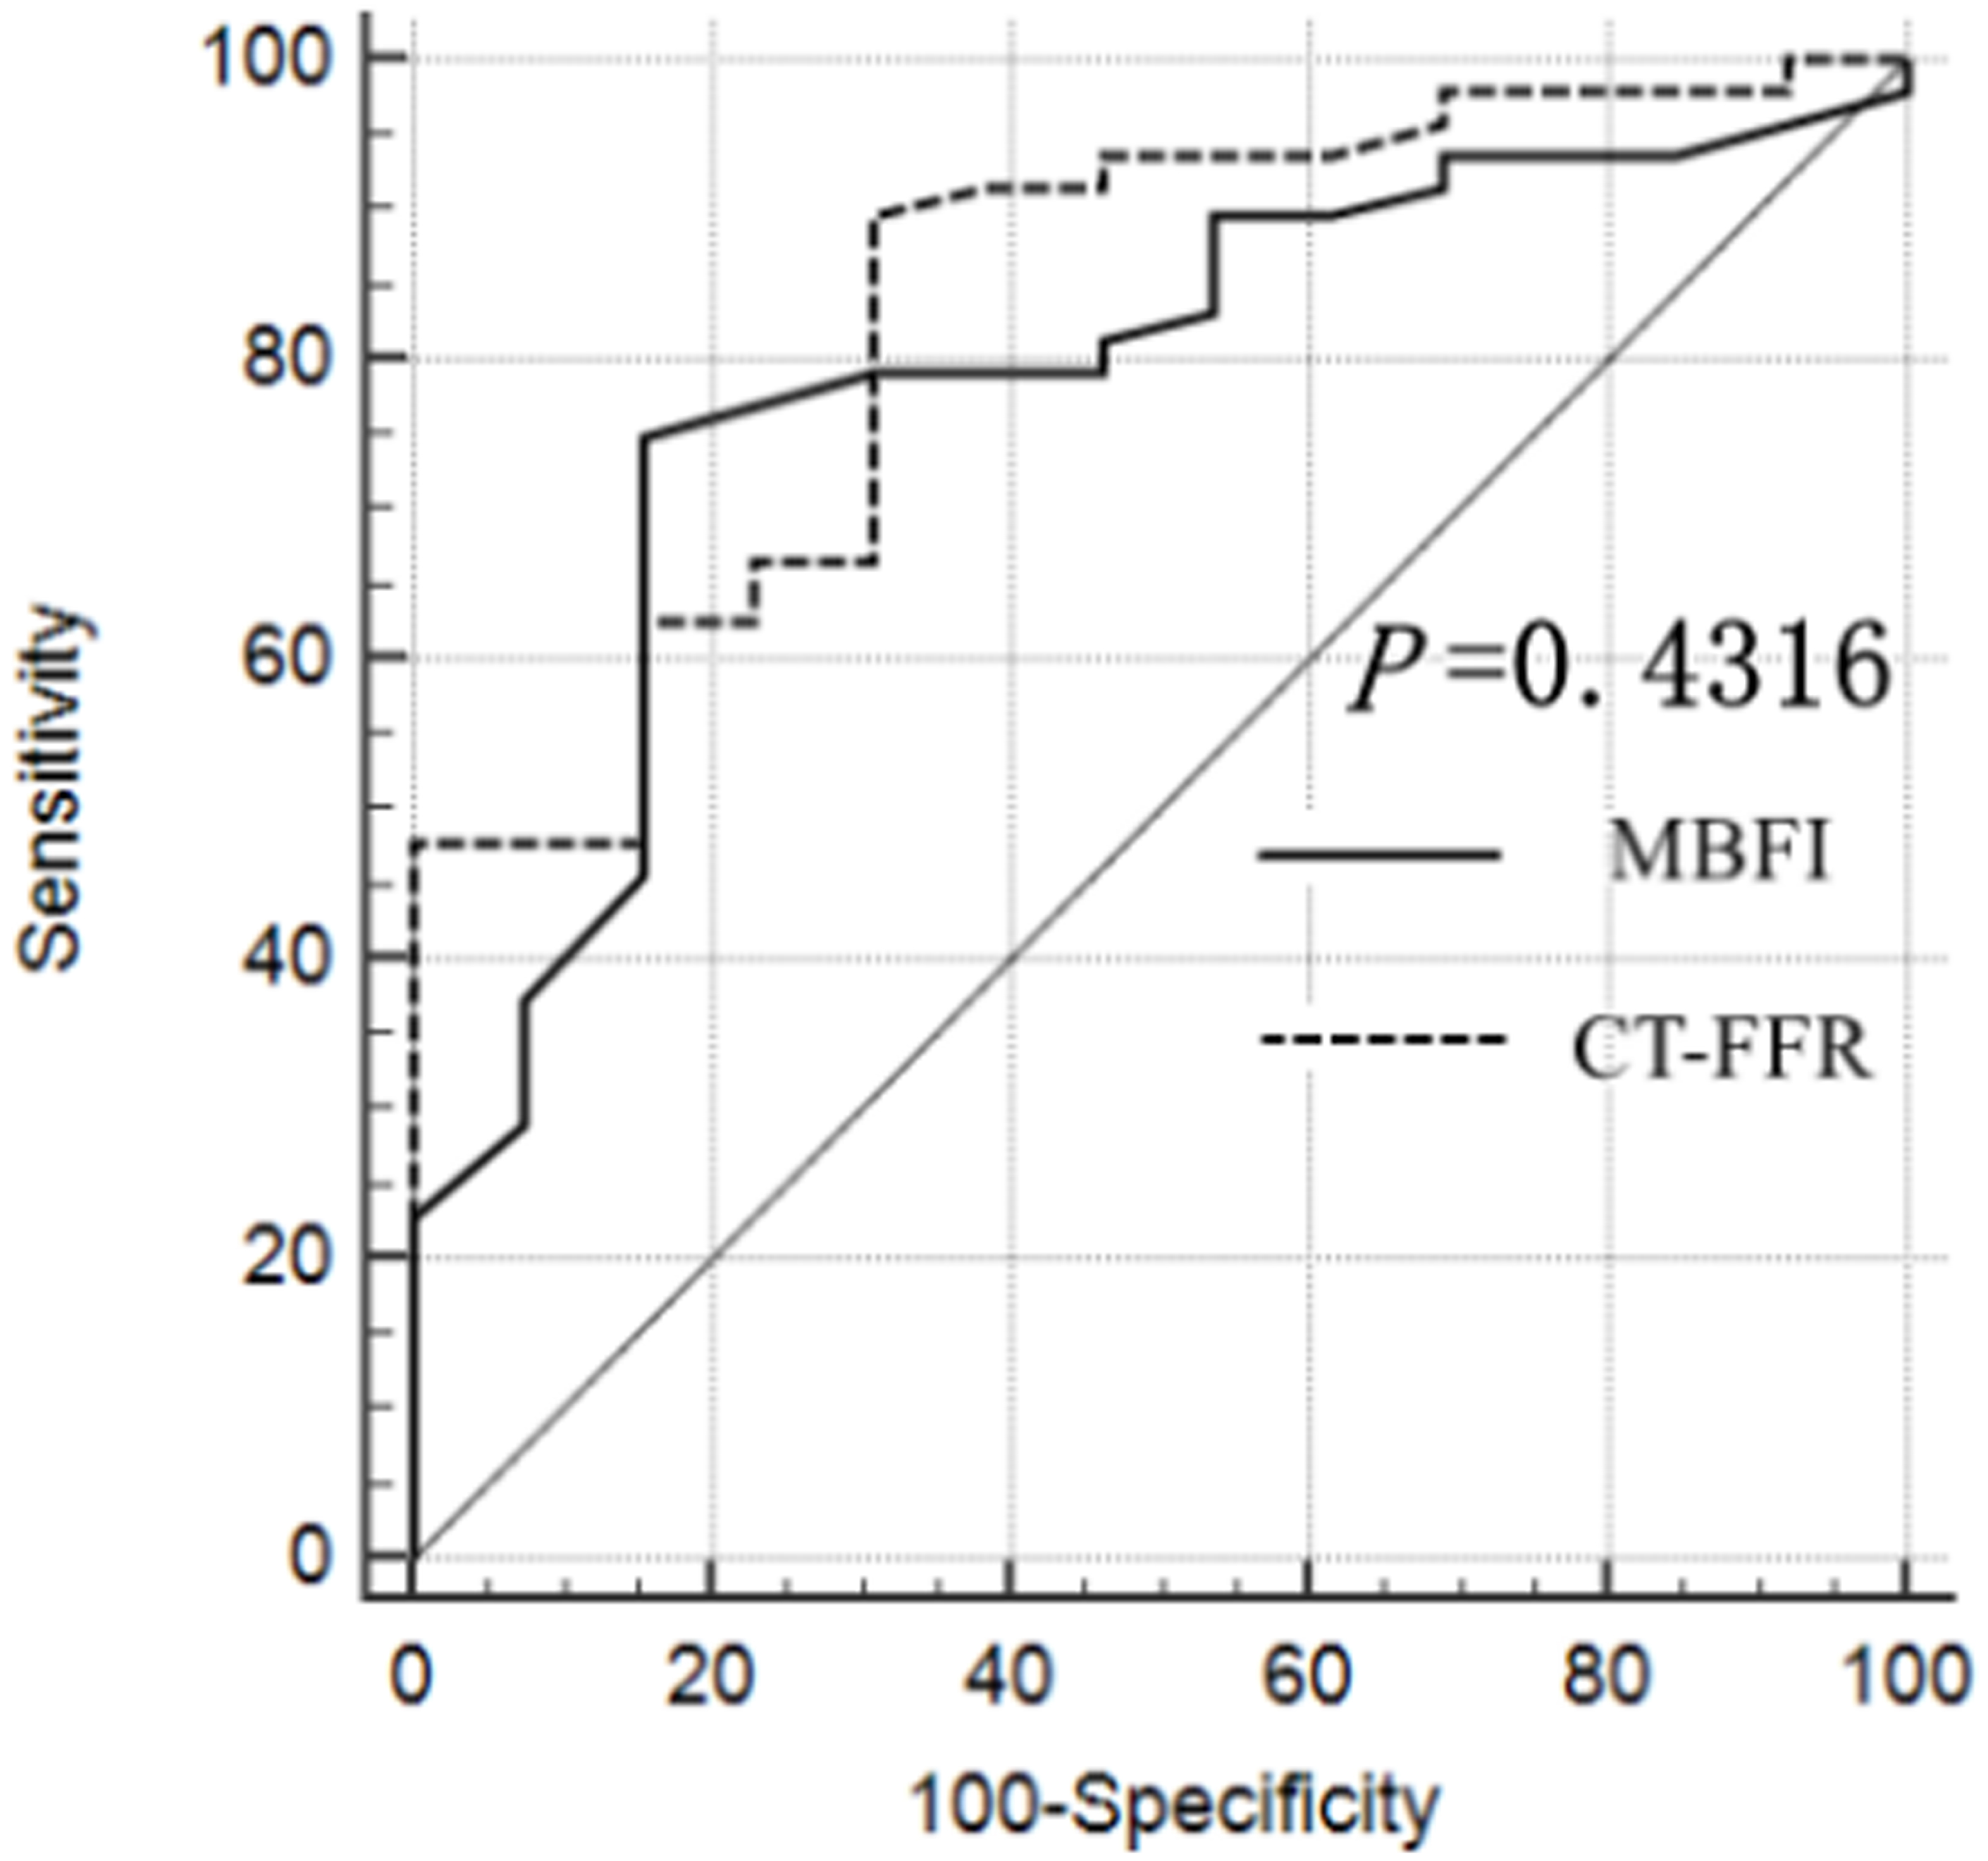 Fig. 5.
Receiver operating characteristic (ROC) curve of myocardial blood flow index (MBFI) and computed tomography derived fractional flow reserve (CT-FFR) generated using invasive coronary angiography (ICA) as the gold standard.
| COV | Sensibility | Specificity | PPV | NPV | AUC | 95% CI | p value | |
| MBFI | 0.115 | 80.85% | 71.43% | 90.48% | 52.63% | 0.833 | 0.716–0.916 | |
| CT-FFR | 0.80 | 78.72% | 92.86% | 97.37% | 56.52% | 0.759 | 0.632–0.859 | 0.0002 |
Note: COV, cutoff value; PPV, positive predictive value; NPV, negative predictive value; AUC, area under the curve; CI, confidence interval.
We further evaluated the 6-month revascularization of the patients. Among the 61
patients diagnosed using CT-FFR and MBFI, 9 and 11 underwent revascularization,
respectively, with no significant difference observed between the two groups
(
CCTA is a safe, accurate, and reliable noninvasive imaging method to diagnose and screen low- and medium-risk CAD [24, 25]. However, it does not allow functional evaluation of severe stenosis or suspected severe stenosis coronary lesions, which is vital for their treatment [26]. Similar to other functional methods [1, 2, 3, 4, 5], CT-FFR based on coronary artery anatomical stenosis has significantly improved patients’ prognoses [20].
CT myocardial perfusion imaging also belongs to the category of functional imaging. Traditional CT myocardial perfusion refers to continuous CT scanning during cardiac-specific phases using high-pressure injectors to inject iodine-containing contrast agents intravenously to obtain the time variation curve. The mathematical model of the curve is used for semi- or full-quantitative evaluation of the myocardial blood flow and then evaluation of coronary artery-related myocardial ischemia or microvascular angina [27]. After injecting an iodine-containing contrast agent, scanning during a fixed phase can obtain a fine contrast of the ischemic myocardium to the normal myocardium in the resting state. Adenosine stress perfusion can further obtain the compensatory ability of myocardial blood flow [28]. Therefore, a one-stop cardiac scanning protocol can evaluate the anatomical stenosis of coronary arteries and the coronary artery-related myocardial perfusion, which is helpful for detecting hemodynamically significant CAD. If the scanning protocol adds delayed scanning, it can predict myocardial viability [29]. It is not difficult to see that the shortcomings of CT perfusion perhaps include the complex protocol of CT scanning, the increased risk of myocardial infarction in patients with coronary artery disease during myocardial stress perfusion, increased radiation dose during delayed scanning, and prolonged overall scanning time, which imperceptibly increases patient discomfort. Compared with the traditional method of evaluating myocardial perfusion, MFBI has potential outstanding clinical application value. Our previous study demonstrated that MBFI, as a functional parameter, can be used to evaluate myocardial ischemia in obstructive CAD [11]. Since MBFI is closely correlated with myocardial remodeling, it can also be used to evaluate in-stent restenosis [2]. Therefore, elaborating on the differences in the functional features between CT-FFR and MBFI is necessary.
CT-FFR is based on the
anatomical model of the coronary artery, combined with mathematical models of
coronary artery physiology and physical laws of fluid dynamics, to obtain the
results of simulated catheter method FFR, and is a highly effective noninvasive
imaging method, and as a functional index, a CT-FFR value of
Using ICA (
According to the literature, CT-FFR is significantly correlated with coronary artery anatomical stenosis, indicating that CT-FFR, as a functional parameter, is closely related to coronary artery anatomical stenosis [31]. In this study, CT-FFR was negatively correlated with ICA (p = 0.0001), and the more severe the anatomical stenosis of the coronary artery, the smaller the CCTA-FFR. Moreover, MBFI was also negatively correlated with ICA (p = 0.0036). Interestingly, as the degree of stenosis worsened, MBFI showed an increasing trend. This could be because CT-FFR was based on coronary artery anatomical stenosis, whereas MBFI was not only related to coronary artery anatomical stenosis but also to other factors such as CAD functional features and myocardial collateral circulation.
This study had several limitations. First, the number of cases was relatively small as this was a single-center study; thus, a large sample size and multicenter research are warranted in the future. Second, the selected cases were suspected cases of CAD; however, there may be patients with coronary artery spasms or abnormal myocardial microcirculation function, resulting in inconsistent CT-FFR and MBFI results. Third, this study also needs to consider some confounding factors, such as sex differences in patients and the professional quality of the personnel using the technology.
First, in this study, MBFI is based on CCTA similar to CT-FFR, which is also derived from CT; Second, MBFI can be used to evaluate myocardial ischemia similar to CT-FFR in suspected CAD; Third, it should be noted that CT-FFR is a functional index based on the anatomical stenosis of the coronary artery, whereas MBFI is a physiological index reflecting myocardial mass remodeling.
The datasets used and/or analyzed during the current study are available from the corresponding author on reasonable request.
QFX, XRF, YJC, LW, YBZ, WSZ—made substantial contributions to analyze and interpret the research data available, drafted and revised the manuscript critically for important intellectual content, and gave their final approval of the version to be published. All authors read and approved the final manuscript. All authors have participated sufficiently in the work and agreed to be accountable for all aspects of the work.
The study followed the Declaration of Helsinki and was approved by Institutional Review Board of the Hainan Enhance International Medical Center (20220010). Written informed consent was obtained from participants.
Not applicable.
This research received no external funding.
The authors declare no conflict of interest.
References
Publisher’s Note: IMR Press stays neutral with regard to jurisdictional claims in published maps and institutional affiliations.