


 , Yao He 2,*
1 Department of Infectious Diseases Medicine, The Fifth Medical Center of Chinese PLA General Hospital, 100039 Beijing, China
2 Institute of Geriatrics, Beijing Key Laboratory of Research on Aging and Related Diseases, National Clinical Research Center for Geriatrics Diseases, 100853 Beijing, China
Abstract
Background: As a population ages, blood pressure levels gradually
increase, leading to a higher incidence of hypertension and increased
cardiovascular diseases risk. This study examines factors affecting hypertension
grading among centenarians in the Hainan Province. Methods: Data from
2014 to 2016 were accessed from the cross-sectional database “Hypertension
Levels and Epidemiological Characteristics of the Elderly and Centenarians in
Hainan province of China”. This study included 690 centenarians with
hypertension. Hypertension grading was the dependent variable, analyzed against
independent variables including demographic information (sex, age, ethnicity,
education level, marital status, cohabitation, and regional distribution),
lifestyle factors (smoking, alcohol consumption, and physical
activity), body mass index (BMI), and comorbid conditions (diabetes and
hyperlipidemia). Logistic regression models, adjusted for these factors, were
used to assess the determinants of hypertension grading among the participants.
Results: Multivariate regression analysis, after adjusting for other
variables, revealed significant associations between BMI, low-density lipoprotein (LDL) levels, and
hypertension grades. Individuals with BMI below 18.5 kg/m
Keywords
- centenarians
- hypertension
- healthy aging
Promotion of healthy aging has become essential due to the rapid increase of aging in the Chinese population [1, 2]. Centenarians, representing the oldest segment of this demographic, serve as an ideal cohort for studying he dynamics of healthy aging due to their longevity [3, 4]. Notably, the incremental rise in blood pressure with advancing age has been observed in older adults [5], which correlates with an elevated prevalence of hypertension in this population. This trend exacerbates the risk of cardiovascular diseases [5, 6].
Previous studies established a significantly increase in the risk of cardiovascular disease among centenarians emphasizing the health challenges within this unique population [5, 6]. Notably, our analysis reveals pronounced disparities in hypertension risk based on both sex and geography. Specifically, female centenarians face a 1.624-fold higher risk of developing hypertension compared to their male counterparts, while individuals residing in the northern and central regions of the Hainan province are subject to a 0.625-fold higher risk than those in the eastern region [7]. To deepen our understanding of these disparities and other contributing risk factors, we utilized data from 2014 to 2016 to conduct a comprehensive epidemiological study on blood pressure levels within the centenarian population of Hainan, China. This study aims to elucidate critical factors influencing hypertension, thereby informing strategies for promoting healthy aging among the oldest adults.
The data for this study were obtained from a cross-sectional research database
that recorded the epidemiological characteristics and blood pressure levels of
older adults and centenarians in the Hainan province of China. This comprehensive
dataset encompasses the epidemiological survey data of a sample of 1002
centenarians (aged
Inclusion criteria were as follows: (1) Individuals 100 years or older, and (2) Hypertension, classified based on the Chinese Guidelines for the Prevention and Treatment of Hypertension (CGPTH-2018) which was revised in 2018 [8]. Exclusion criteria included the presence of tumors as well as cardiovascular and cerebrovascular diseases that may serve as triggering factors for hypertension.
Blood pressure measurement: we dispatched a team of medical professionals to conduct blood pressure measurements at their homes. The resting blood pressure was measured using an upper arm electronic sphygmomanometer (Omron HEM-7200) with a precision level of 1 mmHg. Each subject’s blood pressure was recorded three times, with a three-minute interval between each measurement after they had sat down and rested for three minutes prior to the first reading.
Hypertension was characterized according to the CGPTH-2018, by
systolic blood pressure (SBP)
Severe cardiovascular diseases included myocardial infarction, aortic dissection, angina, heart failure, and arrhythmias. Severe cerebrovascular diseases included cerebral infarction, hypertensive intracerebral hemorrhage, subarachnoid hemorrhage, cerebral aneurysm, moyamoya disease, and cerebral vascular malformations.
The demographic information included gender, age, ethnicity, education level (illiterate, primary school, and above), marital status (married, widowed, divorced, or living alone), cohabitation status (living with family, living alone, or nursing homes), and regional distribution (Hainan province is divided into eastern, western, southern, northern, and central regions by administrative region). Habits included smoking, alcohol consumption, and exercise. Because almost all older males had a history of smoking and drinking at a certain time in the past, the specific time was not detailed owing to memory bias. None of the older females had a history of smoking or drinking, hence these variables were equivalent to sex.
To address this collinearity, smoking status was determined by the response to
the questionnaire item “Do you smoke?”. Similarly, alcohol consumption status
was determined by the response to the question “Have you consumed alcohol at
least once in the past 12 months?”. This approach was also used to analyze the
relationship between hypertension, smoking, and alcohol consumption. The extent
of physical exercise was determined by the response to the question, “How many
times per week do you engage in physical activities (such as housework and
exercise)?”. BMI was calculated as weight/height
The diabetes status was determined by inquiries regarding the patient’s medical history. Since most of the older individuals were not clear about whether they have hyperlipidemia, triglyceride (TG), cholesterol (TC), low-density lipoprotein (LDL) levels, and high-density lipoprotein (HDL) levels, values were obtained from laboratory tests during the investigation, and were used as analytical indicators to examine the relationship between hypertension and hyperlipidemia.
Categorical data were classified according to their clinical significance. Age
was categorized into two groups (
In the original cross-sectional study, our sample comprised 1002 participants. To ensure the integrity of the data, exclusions were made for participants with confounding health issues: one individual diagnosed with a tumor and 41 individuals with severe cardio-cerebrovascular diseases, resulting in a final sample size of 960 centenarians. Analysis of this cohort revealed that hypertension was present in 690 participants, accounting for 71.88% of the sample, while the remaining 270 participants, or 28.12%, did not exhibit hypertension (Fig. 1).
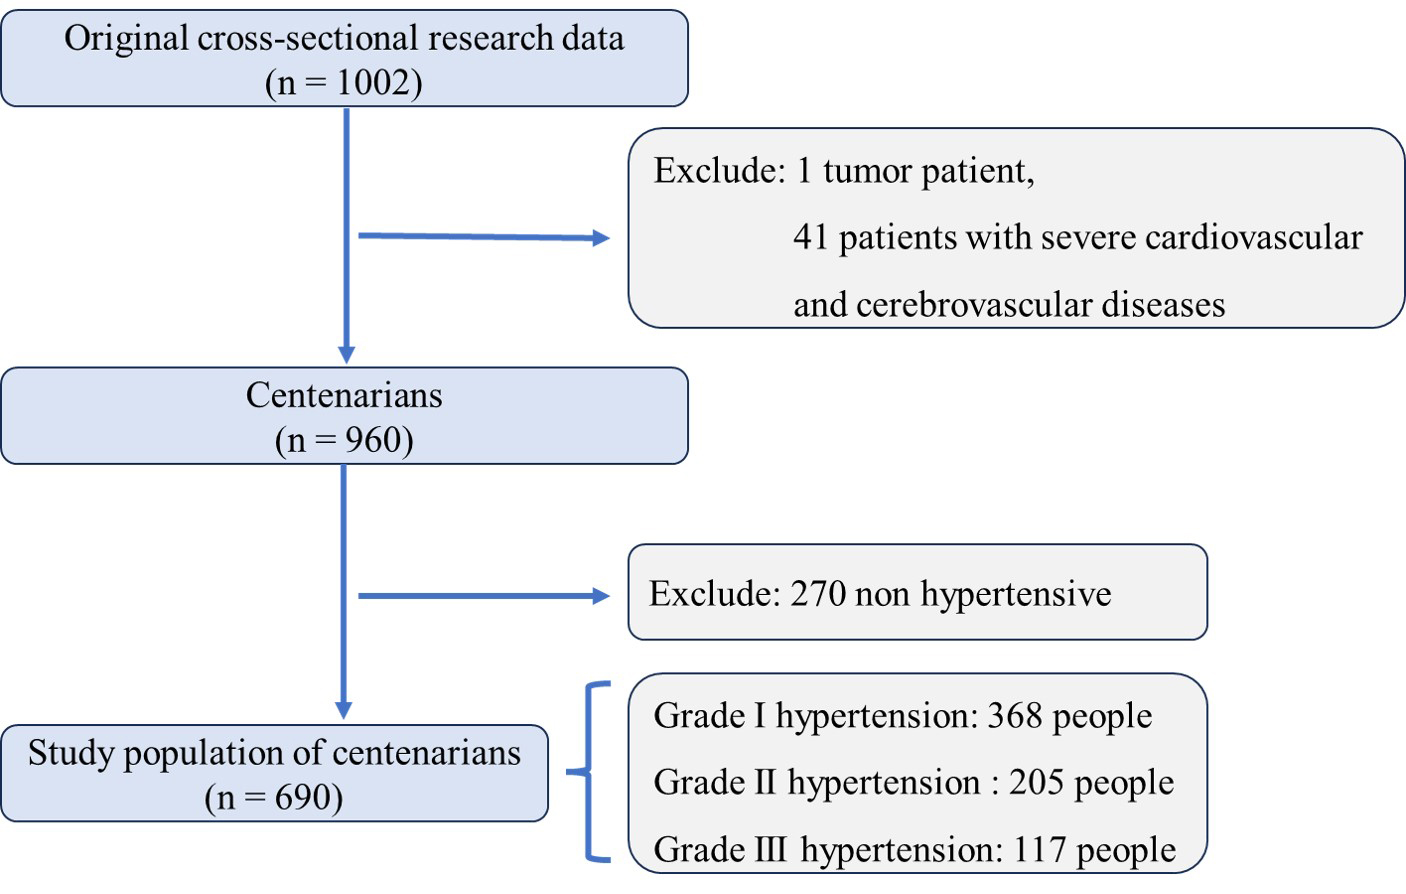 Fig. 1.
Enrollment and selection criteria for centenarian participants in hainan hypertension study. An overview of the enrollment and exclusion criteria applied to the initial sample of 1002 centenarians in our hypertension study. After excluding one participant with a tumor and 41 participants with severe cardio-cerebrovascular diseases, the final analysis included 960 participants. Among them, hypertension was prevalent, with 690 (71.88%) diagnosed with the condition. The figure also details the subdivision of hypertensive participants into different grades: Grade I hypertension was identified in 368 participants, Grade II in 205 participants, and Grade III in 117 participants, indicating the severity of hypertension across the study population.
Among the 690 hypertensive participants, the distribution of hypertension
severity was as follows: 368 participants (53.33%) were classified with grade I,
205 (29.71%) with grade II, and 117 (16.96%) with grade III hypertension (Fig. 2). Demographic analysis revealed a significant sex disparity, 110 males
(15.94%) and 580 females (84.06%) (Fig. 2). Notably, 551 participants were aged
between 100–104 years (79.86%), while 139 were aged 105 years or older
(20.14%) (Fig. 2). A total of 385 participants (55.80%) had a
body mass index (BMI) of
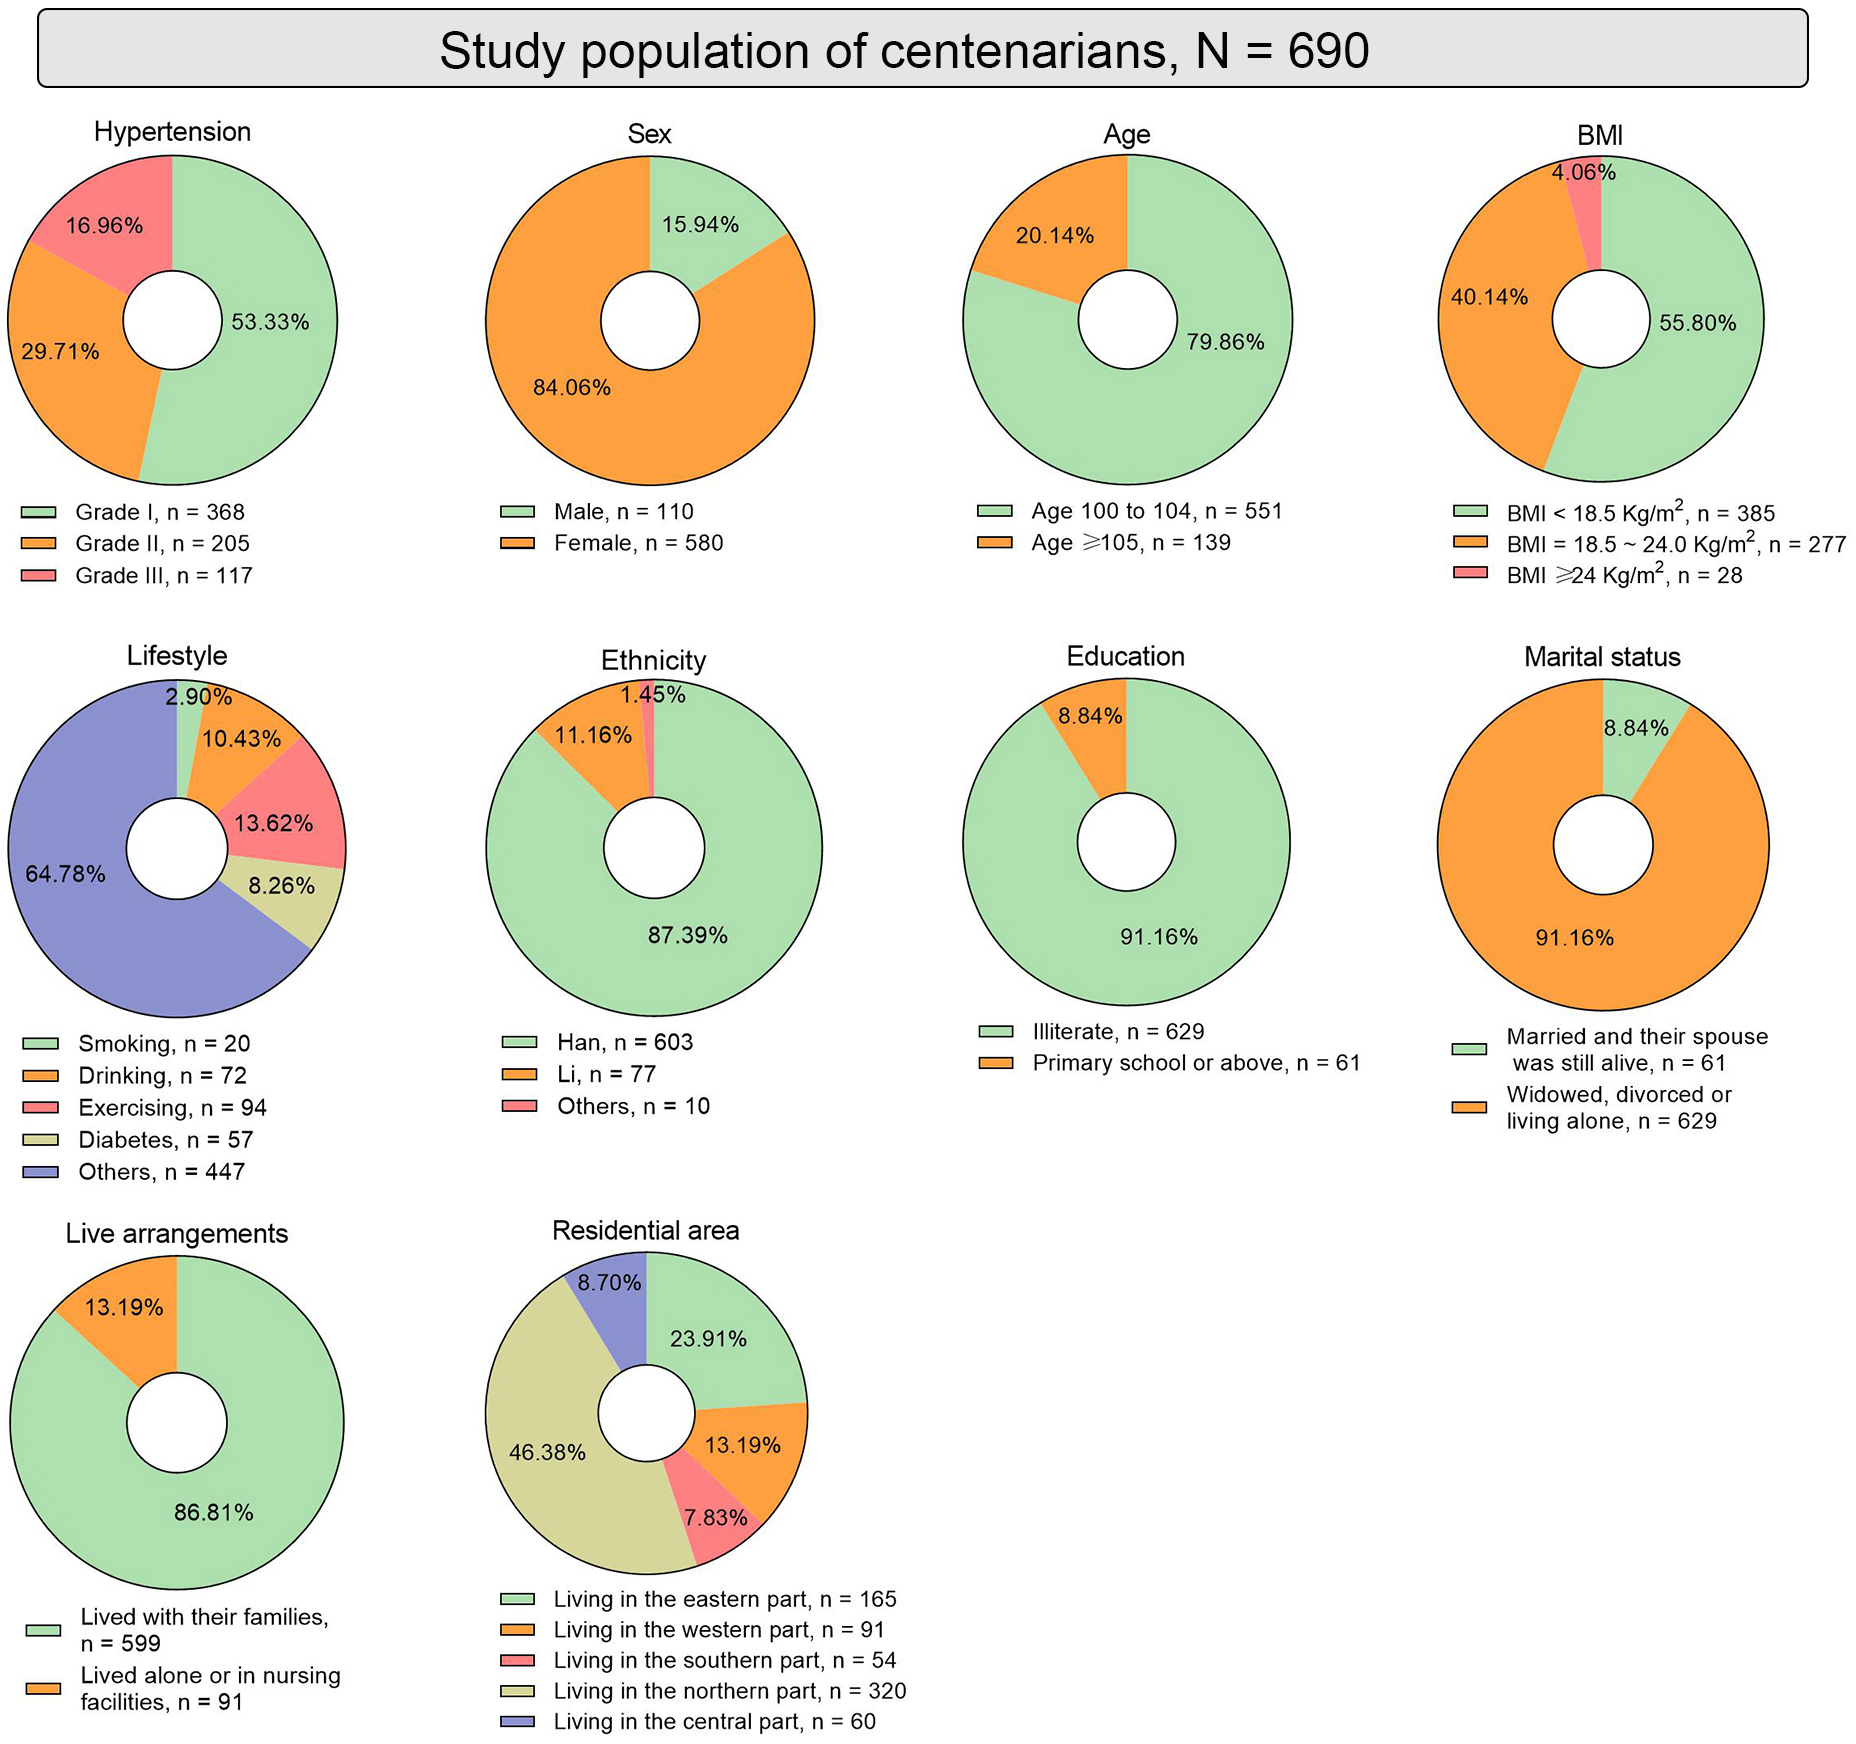 Fig. 2.
Baseline characteristics of hypertensive centenarians in the Hainan province. Fig. 2 illustrates the baseline characteristics of the hypertensive centenarian participants through multiple pie charts. These charts display the distribution of sex, age, BMI, lifestyle factors (smoking, alcohol consumption, and exercise frequency), diabetes prevalence, ethnic composition, educational levels, marital status, living arrangements, and geographic distribution within the Hainan province. BMI, body mass index.
A subgroup analysis was conducted with hypertension severity as the dependent variable to explore associations with various independent variables, which included demographic, lifestyle, and clinical factors such as age, sex, BMI, smoking status, alcohol consumption, physical activity, diabetes prevalence, and regional distribution. The results of this analysis are presented in Table 1. Despite the comprehensive range of factors analyzed, none of the independent variables showed a statistically significant association with the grades of hypertension among the participants.
| Index | Grade I hypertension (n = 368) | Grade II hypertension (n = 205) | Grade III hypertension (n = 117) | p value | |
| Sex, n (%) | |||||
| Male | 63 (17.12%) | 33 (16.10%) | 14 (11.97%) | 0.4138 | |
| Female | 305 (82.88%) | 172 (83.90%) | 103 (88.03) | ||
| Age, year, n (%) | |||||
| 100–105 | 297 (80.71%) | 159 (77.56%) | 95 (81.20%) | 0.6165 | |
| 71 (19.29%) | 46 (22.44%) | 22 (18.80%) | |||
| BMI, kg/m |
|||||
| 223 (60.60%) | 100 (48.78%) | 62 (52.99%) | 0.0571 | ||
| 18.5–24 | 131 (35.60%) | 94 (45.85%) | 52 (44.44%) | ||
| 14 (3.80%) | 11 (5.37%) | 3 (2.56%) | |||
| Smoking, n (%) | 9 (2.45%) | 7 (3.41%) | 4 (3.42%) | 0.7096 | |
| Drinking, n (%) | 38 (10.33%) | 23 (11.22%) | 11 (9.40%) | 0.8723 | |
| Physical exercise, n (%) | |||||
| Sedentary | 311 (84.51%) | 171 (83.41%) | 101 (86.32%) | 0.7077 | |
| 52 (14.13%) | 29 (14.15%) | 13 (11.11%) | |||
| Unclear | 5 (1.36%) | 5 (2.44%) | 3 (2.56%) | ||
| Diabetes, n (%) | 30 (8.15%) | 19 (9.27%) | 8 (6.84%) | 0.7434 | |
| TC abnormal, n (%) | 28 (7.61%) | 14 (6.83%) | 10 (8.55%) | 0.8516 | |
| TG abnormal, n (%) | 15 (4.08%) | 10 (4.88%) | 2 (1.71%) | 0.3555 | |
| HDL abnormal, n (%) | 41 (11.14%) | 19 (9.27%) | 7 (5.98%) | 0.2517 | |
| LDL abnormal, n (%) | 20 (5.43%) | 12 (5.85%) | 13 (11.11%) | 0.0861 | |
| Ethnicity, n (%) | |||||
| Han | 327 (88.86%) | 174 (84.88%) | 102 (87.18%) | 0.1091 | |
| Li | 39 (10.60%) | 24 (11.71%) | 14 (11.97%) | ||
| Other | 2 (0.54%) | 7 (3.41%) | 1 (0.85%) | ||
| Education, n (%) | |||||
| Illiterate | 335 (91.03%) | 182 (88.78%) | 112 (95.73%) | 0.1067 | |
| Primary school and above | 33 (8.97%) | 23 (11.22%) | 5 (4.27%) | ||
| Marital status, n (%) | |||||
| Married | 36 (9.78%) | 17 (8.29%) | 8 (6.84%) | 0.5874 | |
| Widow/Divorce/Living Alone | 332 (90.22%) | 188 (91.71%) | 109 (93.16%) | ||
| Live arrangements, n (%) | |||||
| Living with family | 321 (87.23%) | 177 (86.34%) | 101 (86.32%) | 0.9420 | |
| Living alone/Nursing facilities | 47 (12.77%) | 28 (13.66%) | 16 (13.68%) | ||
| Residential area, n (%) | |||||
| East | 90 (24.45%) | 45 (21.95%) | 30 (25.64%) | 0.5720 | |
| South | 24 (6.52%) | 21 (10.24%) | 9 (7.69%) | ||
| West | 55 (14.95%) | 21 (10.24%) | 15 (12.82%) | ||
| North | 165 (44.84%) | 99 (48.29%) | 56 (47.86%) | ||
| Center | 34 (9.24%) | 19 (9.27%) | 7 (5.98%) | ||
Abbreviations: BMI, body mass index; TC, total cholesterol; TG, triglycerides; HDL, high-density lipoprotein; LDL, low-density lipoprotein.
We employed a multiple logistic regression model with multivalued nominal variables to analyze risk factors associated with different stages of hypertension—stages I, II, and III—among older participants. The outcomes, stratified by the severity of hypertension, are detailed across three tables (Tables 2,3,4). Table 2 compares hypertension Grade III with Grade I, Table 3 compares Grade III with Grade II, and Table 4 compares Grade II with Grade I.
| Variable | OR (95% CI) | p |
| Age, years ( |
0.955 (0.552–1.651) | 0.8689 |
| Sex (Male vs. Female) | 1.465 (0.697–3.080) | 0.3139 |
| BMI, kg/m |
0.614 (0.390–0.966) | 0.0350 |
| BMI, kg/m |
0.605 (0.161–2.266) | 0.4554 |
| Smoking (Yes vs. No) | 2.215 (0.603–8.139) | 0.2313 |
| Drinking (Yes vs. No) | 0.897 (0.409–1.966) | 0.7863 |
| Physical exercise (Sedentary vs. |
0.733 (0.373–1.442) | 0.3684 |
| Diabetes (Yes vs. No) | 0.808 (0.351–1.857) | 0.6152 |
| TC elevated (Yes vs. No) | 0.256 (0.065–1.007) | 0.0511 |
| TG elevated (Yes vs. No) | 0.347 (0.071–1.701) | 0.1920 |
| HDL elevated (Yes vs. No) | 0.484 (0.202–1.162) | 0.1044 |
| LDL elevated (Yes vs. No) | 6.087 (1.635–22.660) | 0.0071 |
| Ethnicity (Li vs. Han) | 1.600 (0.789–3.243) | 0.1928 |
| Education (Primary school and above vs. Illiterate) | 0.537 (0.185–1.560) | 0.2529 |
| Marital status (Widow/Divorce/Living Alone vs. Married) | 1.344 (0.577–3.127) | 0.4931 |
| Live arrangements (Living alone/nursing facilities vs. Living with family) | 1.155 (0.606–2.201) | 0.6618 |
| Residential area (South vs. East) | 0.876 (0.317–2.422) | 0.7982 |
| Residential area (West vs. East) | 0.707 (0.327–1.532) | 0.3799 |
| Residential area (North vs. East) | 0.977 (0.570–1.677) | 0.9334 |
| Residential area (Central vs. East) | 0.402 (0.141–1.146) | 0.0882 |
| Residential area (West vs. South) | 0.808 (0.294–2.221) | 0.6791 |
| Residential area (North vs. South) | 1.116 (0.416–2.993) | 0.8274 |
| Residential area (Central vs. South) | 0.459 (0.143–1.473) | 0.1904 |
| Residential area (North vs. West) | 1.381 (0.671–2.844) | 0.3804 |
| Residential area (Central vs. West) | 0.568 (0.198–1.628) | 0.2923 |
| Residential area (North vs. Middle) | 2.433 (0.884–6.697) | 0.0852 |
Bold p-values denote p
| Variable | OR (95% CI) | p |
| Age, years ( |
0.764 (0.425–1.374) | 0.3693 |
| Sex (Male vs. Female) | 0.985 (0.438–2.216) | 0.9713 |
| BMI, kg/m |
1.024 (0.626–1.674) | 0.9257 |
| BMI, kg/m |
0.487 (0.125–1.900) | 0.3004 |
| Smoking (Yes vs. No) | 1.407 (0.352–5.620) | 0.6293 |
| Drinking (Yes vs. No) | 0.788 (0.328–1.892) | 0.5936 |
| Physical exercise (Sedentary vs. |
0.740 (0.371–1.598) | 0.4829 |
| Diabetes (Yes vs. No) | 0.691 (0.285–1.671) | 0.4114 |
| TC elevated (Yes vs. No) | 0.381 (0.087–1.658) | 0.1982 |
| TG elevated (Yes vs. No) | 0.354 (0.069–1.821) | 0.2142 |
| HDL elevated (Yes vs. No) | 0.609 (0.237–1.568) | 0.3044 |
| LDL elevated (Yes vs. No) | 4.356 (1.052–18.033) | 0.0423 |
| Ethnicity (Li vs. Han) | 1.571 (0.590–4.180) | 0.3659 |
| Education (Primary school and above vs. Illiterate) | 0.332 (0.110–1.003) | 0.0506 |
| Marital status (Widow/Divorce/Living Alone vs. Married) | 1.094 (0.433–2.761) | 0.8500 |
| Live arrangements (Living alone/nursing facilities vs. Living with family) | 1.057 (0.526–2.122) | 0.8772 |
| Residential area (South vs. East) | 0.512 (0.175–1.495) | 0.2207 |
| Residential area (West vs. East) | 0.949 (0.395–2.276) | 0.9061 |
| Residential area (North vs. East) | 0.822 (0.453–1.493) | 0.5203 |
| Residential area (Central vs. East) | 0.516 (0.166–1.605) | 0.2529 |
| Residential area (West vs. South) | 1.854 (0.627–5.482) | 0.2644 |
| Residential area (North vs. South) | 1.607 (0.572–4.516) | 0.3680 |
| Residential area (Central vs. South) | 1.007 (0.296–3.430) | 0.9905 |
| Residential area (North vs. West) | 0.867 (0.384–1.959) | 0.7313 |
| Residential area (Central vs. West) | 0.543 (0.171–1.729) | 0.3017 |
| Residential area (North vs. Middle) | 1.595 (0.534–4.766) | 0.4029 |
Bold p-values denote p
| Variable | OR (95% CI) | p |
| Age, years ( |
1.249 (0.811–1.926) | 0.3132 |
| Sex (Male vs. Female) | 1.489 (0.839–2.643) | 0.1739 |
| BMI, kg/m |
0.586 (0.402–0.852) | 0.0052 |
| BMI, kg/m |
1.156 (0.486–2.752) | 0.7425 |
| Smoking (Yes vs. No) | 1.816 (0.613–5.381) | 0.2815 |
| Drinking (Yes vs. No) | 0.913 (0.492–1.694) | 0.7737 |
| Physical exercise (Sedentary vs. |
0.945 (0.564–1.584) | 0.8311 |
| Diabetes (Yes vs. No) | 1.127 (0.605–2.099) | 0.7069 |
| TC elevated (Yes vs. No) | 0.663 (0.228–1.923) | 0.4491 |
| TG elevated (Yes vs. No) | 0.993 (0.411–2.399) | 0.9884 |
| HDL elevated (Yes vs. No) | 0.778 (0.421–1.440) | 0.4248 |
| LDL elevated (Yes vs. No) | 1.425 (0.444–4.577) | 0.5517 |
| Ethnicity (Li vs. Han) | 1.823 (1.033–3.218) | 0.0383 |
| Education (Primary school and above vs. Illiterate) | 1.591 (0.819–3.093) | 0.1707 |
| Marital status (Widow/Divorce/Living Alone vs. Married) | 1.195 (0.632–2.261) | 0.5834 |
| Live arrangements (Living alone/nursing facilities vs. Living with family) | 1.117 (0.657–1.900) | 0.6818 |
| Residential area (South vs. East) | 1.711 (0.773–3.788) | 0.1851 |
| Residential area (West vs. East) | 0.746 (0.385–1.446) | 0.3849 |
| Residential area (North vs. East) | 1.188 (0.752–1.879) | 0.4605 |
| Residential area (Central vs. East) | 0.779 (0.354–1.713) | 0.5347 |
| Residential area (West vs. South) | 0.436 (0.192–1.012) | 0.0573 |
| Residential area (North vs. South) | 0.694 (0.325–1.481) | 0.3454 |
| Residential area (Central vs. South) | 0.455 (0.192–1.081) | 0.0746 |
| Residential area (North vs. West) | 1.594 (0.867–2.931) | 0.1338 |
| Residential area (Central vs. West) | 1.045 (0.460–2.372) | 0.9163 |
| Residential area (North vs. Middle) | 1.525 (0.723–3.218) | 0.2680 |
Bold p-values denote p
Our analysis revealed that the risk of developing grade III hypertension in
participants with a low BMI (under 18.5 kg/m
Additionally, our findings highlight a pronounced impact of LDL cholesterol levels on hypertension severity. Participants with elevated LDL levels and grade I hypertension have a significantly higher risk of developing grade III hypertension (OR: 6.087, 95% CI: 1.635–22.660, p = 0.0071) (Table 2). This was also observed in participants with grade II hypertension and elevated LDL (OR: 4.356, 95% CI: 1.052–18.033, p = 0.0423) (Table 3). No significant differences were observed between Grades II and I regarding LDL levels.
Ethnicity also played a role in hypertension risk, particularly between the Han and Li ethnic groups. Older individuals of Li ethnicity and grade I hypertension were at greater risk of developing grade II hypertension (OR: 1.823, 95% CI: 1.033–3.218, p = 0.0383) when compared to individuals of Han ethnicity (Table 4). However, no statistically significant differences in ethnicity were found between grades III and II hypertension or between grades III and I hypertension.
The seventh National Population Census of China revealed a notable trend towards an aging society, with a significant correlation observed between aging and increased morbidity due to hypertension [10]. Among the older adult Chinese population, aged over 75 years, the rate of hypertension is expected to reach 60% [11]. Despite this, there is a scarcity of high-quality clinical studies targeting this population, inevitably adding to the difficulties in clinical decision making. In contrast, the Hainan province, often referred to as China’s ‘home of longevity’, reports a lower hypertension prevalence rate of 26.2% among adults—below the national average—possibly attributed to its unique natural environment and the dietary habits characterized by light flavors and low salt intake [12, 13]. Given these unique regional attributes, including centenarians from Hainan in this study offers a representative cross-section of the province’s diverse environments and genetic backgrounds, thereby providing valuable insights into the factors influencing hypertension in an aging population.
Numerous studies have established a robust link between obesity and
hypertension, identifying BMI as a critical risk factor that influences both the
likelihood and severity of hypertension [14, 15, 16]. Some studies suggest that
maintaining an ideal BMI (20.0–23.9 kg/m
This study found that older adults with BMI below 18.5 kg/m
This study indicates that elevated LDL cholesterol substantially increases the risk of advancing to more severe hypertension stages among older adults. Specifically, individuals with elevated LDL levels and grade I hypertension were significantly more likely to progressing to grade III hypertension than that among those with normal LDL levels. This association between higher LDL levels and increased blood pressure supports existing literature [19]. Furthermore, LDL levels may be improved through physical exercise, maintaining a lower BMI, and increasing fiber intake [20].
Our study also revealed a role for ethnicity in hypertension. Particularly, the risk transitioning from grade I to grade II hypertension was significantly higher in the older population of Li ethnicity when compared to that of the Han ethnicity. This disparity may be influenced by lifestyle factors [21], particularly in the higher prevalence of smoking, alcohol consumption, and dietary preference for foods with high cholesterol and fat content [22]. Moreover, the lower educational attainment among older Li individuals often leads to inadequate attention to personal health and a lack of medical health knowledge, both of which contributes to the persistently elevated prevalence of chronic diseases such as hypertension [23].
There are researches and analysis of the factors influencing hypertension, found that female centenarians had a higher risk of hypertension [7]. This increased risk is thought to be associated with factors such as physiological hormone differences, cumulative lifestyle impacts, and sex-specific expression of longevity genes [1, 24, 25]. Notably, the decline in estrogen levels after menopause is believed to play a significant role [1, 24, 25]. Despite these findings, we did not identify a significant effect of sex on the severity grading of hypertension. This unexpected result suggests a complex interplay of factors at this advanced age and underscores the need for further research to elucidate the mechanisms behind these observations.
In this study analyzing factors influencing hypertension among 960 centenarians, we found the prevalence of hypertension among centenarians in the central and northern regions of the Hainan province was lower than that in other regions (Supplementary Table 2). This regional disparity may be attributed to environmental factors unique to these areas, such as higher altitude, dense forests, and large areas of tropical rainforests in the central and northern parts of Hainan which are thought to enrich atmospheric oxygen levels [26]. Such conditions could facilitate better regulation of blood pressure by the vasomotor center, potentially reducing the incidence of hypertension [26]. Despite these findings, we did not observe significant differences in hypertension classification by residential area. This suggests that other unexamined factors might influence the regional distribution of hypertension severity. Further investigation is needed to fully understand these dynamics and their implications for public health strategies.
Previous studies have consistently identified overweight and obese status, diabetes [27, 28], and lifestyle factors such as smoking, alcohol consumption, and lack of physical activity [8, 29] as primary risk factors for hypertension in adults. However, our findings did not establish a correlation between these traditional lifestyle factors—such as high BMI, diabetes, smoking, alcohol consumption, lack of exercise—and hypertension among centenarians. This discrepancy has been previously observed, and it has been suggested that the influence of traditional risk factors on hypertension may gradually decrease among centenarians [30, 31]. The phenomenon of aging itself could explain the attenuated relationship between these risk factors and hypertension, as it might modulate physiological responses [32]. Another possibility is that the longevity-survival effect evident in centenarian populations allows them to avoid or postpone the health impacts of risk factors and chronic diseases that lead to premature death, thus enabling this group to maintain good health and live longer lives [33]. Moreover, mental health factors, such as the association between diastolic dysfunction and depression identified by Tudoran et al. [34], may be relevant in certain cases. Therefore, the impact of psychological conditions on hypertension classification in centenarians deserves further investigation.
The elderly population is a unique group requiring distinct strategies for the prevention, diagnosis, evaluation, and treatment of hypertension, distinct from those used in the general population. Given their particular needs, it is crucial to tailor comprehensive hypertension management strategies for their needs, encompassing specific blood pressure targets, antihypertensive drug treatments, and lifestyle interventions. The STEP study underscores the effectiveness of hypertensive therapy, targeting a systolic blood pressure range of 110- to less than 130 mmHg, which significantly reduces the incidence of cardiovascular events in elderly hypertensive patients compared to standard therapy targeting a systolic blood pressure range of 130–150 mmHg [35]. This study provides important evidence-based support for future development of clinical management norms and guidelines for hypertension. However, there is currently insufficient evidence-based medical data specifically pertaining to centenarians. Given that most patients within this age group have poor overall health and multiple complications, individualized blood pressure control goals should be formulated based on their specific circumstances [36].
The prevalence of hypertension among centenarians in Hainan is notably high. Our
findings indicate that the primary factors influencing hypertension
classification in this population include a BMI below 18.5 kg/m
This study is subject to several inherent limitations. First, all participants were recruited from the Hainan province, and although the dataset comprehensively represents this region, the results may not be generalized to centenarians nationwide or in other countries and territories. Second, the historical hypertension data and use of antihypertensive drugs were self-reported by the participants, introducing the potential for information bias. This could affect the accuracy of the data regarding hypertension prevalence and management.
The data that support the findings of this study are available from the corresponding authors upon reasonable request.
ML and YH designed the study. JL, JFB, SSW, SSY, SWY, SMC, KH, SDL, and QYJ participated in the data collection, analysis, and interpretation of the work. JL, JFB, SDL, QYJ, SMC, and KH wrote the manuscript. SSW, SSY, and SWY critically reviewed the statistical methods in the manuscript. ML and YH provided constructive suggestions for the manuscript and participated in its revision. All authors read and approved the final manuscript. All authors were fully involved in the work and agreed to be accountable for all aspects of the work.
All procedures performed in this study involving human participants were in accordance with the standards of the ethics committee of the Hainan Branch, General Hospital of Chinese PLA (approval number: 301hn11201601). A written informed consent was obtained from each patient.
This study thanks for all the subjects and staff in CHCCS.
This study was supported by the National Natural Science Foundation of China (Nos. 82173589 & 82173590), the National Key Research and Development Program of China (2022YFC2503605), the Capital’s Funds for Health Improvement and Research (Nos. 2022-2G-5031 & 2024-2G-5033).
The authors declare no conflict of interest.
References
Publisher’s Note: IMR Press stays neutral with regard to jurisdictional claims in published maps and institutional affiliations.