


 , Jian Gu 2,*,†
1 School of Medicine, Graduate School of Hebei Medical University, 050017 Shijiazhuang, Hebei, China
2 Department of Heart Center, Hebei General Hospital, 050051 Shijiazhuang, Hebei, China
3 School of Medicine, Graduate School of Hebei North University, 075000 Zhangjiakou, Hebei, China
4 School of Medicine, North China University of Science and Technology, 063210 Tangshan, Hebei, China
†These authors contributed equally.
Abstract
Background: Recent studies have indicated that heart
failure (HF) with preserved ejection fraction (HFpEF) within different left
ventricular ejection fraction (LVEF) ranges presents distinct morphological and
pathophysiological characteristics, potentially leading to diverse prognoses.
Methods: We included chronic HF patients hospitalized in the Department
of Cardiology at Hebei General Hospital from January 2018 to June 2021. Patients
were categorized into four groups based on LVEF: HF with reduced ejection
fraction (HFrEF, LVEF
Keywords
- chronic heart failure
- cardiovascular disease
- left ventricular ejection fraction
- prognosis
Heart failure (HF) is the ultimate stage of all heart diseases, affecting approximately 40 million individuals globally, with its incidence and mortality rates increasing annually [1, 2]. HF with preserved ejection fraction (HFpEF) is a subtype of HF, accounting for approximately half of all HF cases, with a 5-year survival rate of only approximately 50% [3, 4]. HFpEF has long been considered an independent subtype of HF. However, recent research has indicated that the pathophysiological mechanisms of HFpEF vary across different ranges of left ventricular ejection fraction (LVEF). Additionally, morphological and functional differences exist between them [5], which may result in distinct prognoses. Therefore, the purpose of this study was to evaluate the clinical characteristics and outcomes of HFpEF patients with different LVEF ranges to provide a basis for better individualized treatment approaches for HF patients.
This study is a single-center case‒control study that included hospitalized
patients with chronic HF at Hebei General Hospital from January 2018 to June
2021. Inclusion criteria were as follows: (1) diagnosis of HF meeting the
diagnostic criteria outlined in the “2022 American Heart Association/American
College of Cardiology/Heart Failure Society of America (AHA/ACC/HFSA) Guideline
for the Management of Heart Failure” [6]; (2) age
This study was reviewed and approved by the Ethics Committee of Hebei General Hospital, with informed consent waived (NO.2023142).
Baseline information of chronic HF patients, including age, sex, smoking
history, physical examination, comorbidities, treatment details, laboratory
tests, and cardiac ultrasound results, was obtained from the electronic medical
record system. Patients with baseline and follow-up LVEF
To observe the survival status of patients within 2 years, all patients were followed up through outpatient visits, telephone interviews, and medical records, with data collection on endpoint events and their respective timeframes. The follow-up period extended until June 1, 2023.
Statistical analysis was performed using SPSS 26.0 (SPSS Inc., Chicago, IL, USA)
and R software version 4.1.1 (R Foundation for Statistical Computing, Vienna,
Austria). Normally distributed or approximately normally distributed continuous
data are presented as the mean
A total of 940 patients diagnosed with chronic HF were identified, and after
applying the inclusion and exclusion criteria, 483 patients were ultimately
included in the study. The mean age of the patients was 71.6
 Fig. 1.
Flow chart of the study. CHF, chronic heart failure; HFrEF, HF with reduced ejection fraction; HFmrEF, HF with mildly reduced ejection fraction; LVEF, left ventricular ejection fraction; HFpEF, HF with preserved ejection fraction; HF, heart failure.
There were differences in several baseline characteristics among the four groups, including age, sex, systolic blood pressure, diastolic blood pressure, heart rate (HR), baseline left ventricular end-diastolic diameter (LVEDD), baseline left ventricular end-systolic diameter (LVESD), New York Heart Association (NYHA) class III/IV, atrial fibrillation (AF), hypertension, cerebrovascular disease, chronic obstructive pulmonary disease (COPD), hyperuricemia, anemia, angiotensin-converting enzyme inhibitor/angiotensin II receptor blocker/angiotensin receptor neprilysin inhibitor (ACEI/ARB/ARNI) usage, calcium channel blocker (CCB) usage, antiplatelet medication usage, digitalis usage, hemoglobin levels, and creatinine levels (Table 1).
| N (%) | ||||||
| HFrEF | HFmrEF | Low LVEF-HFpEF | High LVEF-HFpEF | p-value | ||
| Characteristic | (n = 131, 27.1) | (n = 44, 9.1) | (n = 168, 34.8) | (n = 140, 29) | ||
| Age, years | 66.0 |
70.5 |
74.0 |
74.4 |
||
| Male | 100 (76.3%) | 32 (72.7%) | 96 (57.1%) |
62 (44.3%) |
||
| BMI, kg/m |
24.2 (21.6, 27.3) | 24.2 (21.5, 28.4) | 24.3 (21.9, 27.3) | 24.4 (22.2, 27.5) | 0.732 | |
| Systolic pressure, mmHg | 117.7 |
136.7 |
141.0 |
138.0 |
||
| Diastolic pressure, mmHg | 76 (65, 85) | 78.5 (72, 89.5) | 79 (70, 89.8) |
74 (65.3, 84) |
0.022 | |
| Heart rate, beats per min | 87 (71, 100) | 78.5 (71, 89.8) | 79.5 (68, 93) |
73.5 (65.3, 85) |
||
| Smoking | 26 (19.8%) | 9 (20.5%) | 25 (14.9%) | 23 (16.4%) | 0.645 | |
| HF characteristics | ||||||
| Baseline LVEDD, mm | 64 (58, 69) | 56 (52, 60) |
49 (45, 54) |
48 (44, 51.8) |
||
| Baseline LVESD, mm | 55 (48, 6) | 43 (39, 46.8) |
34 (30, 38) |
31(29, 35.8) |
||
| NYHA class III/IV | 123 (93.9%) | 35 (79.5%) |
132 (78.6%) |
111 (79.3%) |
0.002 | |
| E/e |
80 (61.1%) | 24 (54.5%) | 74 (44.0%) |
61 (43.6%) |
0.010 | |
| Comorbidity | ||||||
| Atrial fibrillation | 33 (25.2%) | 10 (22.7%) | 86 (51.2%) |
72 (51.4%) |
||
| Hypertension | 64 (48.9%) | 35 (79.5%) |
116 (69.0%) |
108 (77.1%) |
||
| Coronary artery disease | 94 (71.8%) | 35 (79.5%) | 117 (69.6%) | 92 (65.7%) | 0.343 | |
| Valvular heart disease | 44 (33.6%) | 11 (25.0%) | 69 (41.1%) | 52 (37.1%) | 0.209 | |
| PCI | 20 (15.3%) | 8 (18.2%) | 23 (13.7%) | 14 (10.0%) | 0.448 | |
| CABG | 4 (3.1%) | 0 (0%) | 7 (4.2%) | 3 (2.1%) | 0.463 | |
| Cerebrovascular disease | 37 (28.2%) | 20 (45.4%) | 80 (47.6%) |
50 (35.7%) | 0.005 | |
| COPD | 6 (4.6%) | 2 (4.5%) | 5 (3.0%) | 15 (10.7%) |
0.028 | |
| Diabetes | 46 (35.1%) | 17 (38.6%) | 75 (44.6%) | 50 (35.7%) | 0.293 | |
| Chronic kidney disease | 34 (26.0%) | 16 (36.4%) | 49 (29.2%) | 32 (22.9%) | 0.304 | |
| Hyperlipidemia | 23(17.6%) | 9 (20.5%) | 22 (13.1%) | 27 (19.3%) | 0.432 | |
| Hyperuricemia | 58 (44.3%) | 15 (34.1%) | 48 (28.6%) |
26 (18.6%) |
||
| Hypoalbuminemia | 24 (18.3%) | 8 (18.2%) | 44 (26.2%) | 24 (17.1%) | 0.188 | |
| Anemia | 19 (14.5%) | 13 (29.5%) | 53 (31.5%) |
34 (24.3%) | 0.007 | |
| Pacemaker | 3 (2.3%) | 1 (2.3%) | 9 (5.4%) | 5 (3.6%) | 0.519 | |
| ICD | 1 (0.8%) | 0 (0%) | 0 (0%) | 1 (0.7%) | 0.665 | |
| Therapy | ||||||
| ACEI/ARB/ARNI | 82 (62.6%) | 18 (40.9%) | 73 (43.5%) |
57 (40.7%) |
0.001 | |
| CCB | 10 (7.6%) | 14 (31.8%) |
56 (33.3%) |
54 (38.6%) |
||
| 89 (68.0%) | 29 (65.9%) | 130 (77.4%) | 88 (62.9%) |
0.041 | ||
| Aldosterone antagonist | 85 (64.9%) | 25 (56.8%) | 99 (58.9%) | 87 (62.1%) | 0.677 | |
| Diuretics | 102 (77.9%) | 29 (65.9%) | 118 (70.2%) | 88 (62.9%) |
0.056 | |
| Antiplatelet agents | 94 (71.8%) | 31 (70.5%) | 91 (54.2%) |
74 (52.9%) |
0.002 | |
| Oral anticoagulations | 15 (11.5%) | 9 (20.5%) | 38 (22.6%) | 35 (25.0%) |
0.031 | |
| Statin | 81 (61.8%) | 28 (63.6%) | 111 (66.1%) | 97 (69.3%) | 0.624 | |
| Digitalis | 37 (28.2%) | 7 (15.9%) | 8 (4.8%) |
6 (4.3%) |
||
| Laboratory data | ||||||
| Hemoglobin, g/L | 134.6 |
127.6 |
115.64 |
119.59 |
||
| Potassium, mmol/L | 4.1 (3.8, 4.4) | 4.1 (3.8, 4.4) | 4 (3.7, 4.5) | 4 (3.5, 4.3) | 0.155 | |
| Creatinine, umol/L | 94 (81.3, 119.9) | 98.5 (78.6, 129.4) |
93.7 (73.7, 132.8) |
82.8 (67.9, 107.8) |
0.002 | |
| CK-MB, U/L | 14.1 (11.9, 19.2) | 13.35 (11.6, 19.5) | 14.1 (11.2, 18.5) | 14.2 (11.925, 17.5) | 0.809 | |
| eGFR, mL/min/1.73/m |
66.3 |
61.9 |
64.4 |
72.8 |
0.041 | |
| CRP, mg/L | 7.24 (1.54, 24.08) | 5.92 (1.48, 17.2425) | 7.365 (2.2975, 23.57) | 8.65 (2.82, 28.435) | 0.604 | |
Abbreviations: HF, heart failure; BMI, body mass index; LVEF, left ventricular
ejection fraction; NYHA, New York Heart Association; LVEDD, left ventricular
end-diastolic diameter; LVESD, left ventricular end-systolic diameter; eGFR,
estimate glomerular filtration rate; PCI, percutaneous coronary intervention;
CABG, coronary artery bypass graft; COPD, chronic obstructive pulmonary disease;
ICD, implantable cardioverter-defibrillator; CCB, calcium channel blockers;
CK-MB, creatine kinase MB; ACEI, angiotensin-converting enzyme inhibitors; ARB,
angiotensin II receptor blockers; ARNI, angiotensin receptor-neprilysin
inhibitors; CRP, C-reaction protein; HFmrEF, HF with mildly reduced ejection fraction; HFrEF, HF with reduced ejection fraction; HFpEF, HF with preserved
ejection fraction. (1) a, p
Specifically, the low LVEF-HFpEF group differed significantly from the HFrEF
group in terms of age, systolic blood pressure, HR, follow-up LVEF, baseline
LVEDD, baseline LVESD, NYHA class III/IV, AF, hypertension, cerebrovascular
disease, hyperuricemia, anemia, ACEI/ARB/ARNI usage, CCB usage, antiplatelet
medication usage, digitalis usage, and hemoglobin levels (p
During a median follow-up period of 414.0 (118.0, 569.0) days, a total of 114
patients (23.6%) experienced all-cause mortality, including 46 patients (9.5%)
in the HFrEF group, 7 patients (1.4%) in the HFmrEF group, 43 patients (8.9%)
in the low LVEF-HFpEF group, and 18 patients (3.7%) in the high LVEF-HFpEF
group. The comparison of all-cause mortality rates among the four groups showed
statistically significant differences (
 Fig. 2.
Kaplan-Meier survival curve for all heart failure patients. (A) Kaplan-Meier curves for the all-cause death of all HF phenotypes. (B) Kaplan-Meier curves for the cardiovascular death of all HF phenotypes. HF, heart failure; LVEF, left ventricular ejection fraction; HFmrEF, HF with mildly reduced ejection fraction; HFrEF, HF with reduced ejection fraction; HFpEF, HF with preserved ejection fraction.
 Fig. 3.
Kaplan-Meier survival curve for HFpEF patients. (A) Kaplan-Meier survival curves depicting the cumulative all-cause mortality rates of two groups of HFpEF patients. (B) Kaplan-Meier survival curves depicting the cumulative cardiovascular mortality rates of two groups of HFpEF patients. LVEF, left ventricular ejection fraction; HFpEF, heart failure with preserved ejection fraction.
A multivariate Cox regression model was used to analyze the independent risk
factors for all-cause mortality in all HF patients. The results showed that
baseline LVEF, group classification, age, body mass index (BMI), estimated
glomerular filtration rate (eGFR), and diuretic use were independent risk factors
for all-cause mortality (p
Separate multivariate Cox regression analyses were performed for the low
LVEF-HFpEF group and the high LVEF-HFpEF group. In the low LVEF-HFpEF group,
multivariate Cox regression analysis revealed that BMI, coronary artery disease,
cerebrovascular disease, hyperlipidemia, hypoalbuminemia, and diuretic use were
independent risk factors for all-cause mortality (p
| Univariate | Multivariate | ||||||||
| HR | 95% CI | p-value | SE | Wald |
HR | 95% CI | p-value | ||
| Age, years | 1.036 | 1.006–1.068 | 0.019 | - | - | - | - | - | - |
| Male | 1.114 | 0.604–2.053 | 0.730 | - | - | - | - | - | - |
| BMI, kg/m |
0.851 | 0.780–0.930 | –0.150 | 0.049 | 9.513 | 0.861 | 0.783–0.947 | 0.002 | |
| Atrial fibrillation | 1.693 | 0.917–3.125 | 0.092 | - | - | - | - | - | - |
| Coronary artery disease | 2.381 | 1.296–4.375 | 0.005 | 1.554 | 0.355 | 19.221 | 4.732 | 2.362–9.482 | |
| Cerebrovascular disease | 2.244 | 1.198–4.203 | 0.012 | 0.696 | 0.337 | 4.266 | 2.006 | 1.036–3.883 | 0.039 |
| Hyperlipidemia | 2.145 | 1.027–4.478 | 0.042 | 0.987 | 0.403 | 6.012 | 2.684 | 1.219–5.908 | 0.014 |
| Hypoalbuminemia | 0.307 | 0.169–0.559 | 0.834 | 0.334 | 6.220 | 2.302 | 1.196–4.434 | 0.013 | |
| Baseline LVEDD | 0.960 | 0.915–1.007 | 0.092 | - | - | - | - | - | - |
| eGFR, mL/min/1.73/m |
0.991 | 0.981–1.001 | 0.079 | - | - | - | - | - | - |
| 0.371 | 0.201–0.685 | 0.002 | - | - | - | - | - | - | |
| Diuretics | 0.503 | 0.274–0.923 | 0.026 | –1.290 | 0.351 | 13.527 | 0.275 | 0.138–0.547 | |
| Antiplatelet agents | 0.497 | 0.271–0.913 | 0.024 | - | - | - | - | - | - |
| Oral anticoagulations | 0.438 | 0.172–1.113 | 0.083 | –1.257 | 0.492 | 6.525 | 0.285 | 0.108–0.746 | 0.011 |
| Statin | 0.542 | 0.296–0.993 | 0.048 | - | - | - | - | - | - |
Abbreviations: BMI, body mass index; LVEDD, left ventricular end-diastolic diameter; eGFR, estimate glomerular filtration rate; -, not applicable; HR, hazard ratio; CI, confidence interval; LVEF, left ventricular ejection fraction; HFpEF, heart failure with preserved ejection fraction; SE, standard error.
| Univariate | Multivariate | ||||||||
| HR | 95% CI | p-value | SE | Wald |
HR | 95% CI | p-value | ||
| Age, years | 1.031 | 0.987–1.077 | 0.172 | - | - | - | - | - | - |
| Male | 1.205 | 0.474–3.065 | 0.695 | - | - | - | - | - | - |
| BMI, kg/m |
0.878 | 0.773–0.998 | 0.046 | - | - | - | - | - | - |
| Systolic pressure, mmHg | 1.019 | 1.000–1.038 | 0.056 | - | - | - | - | - | - |
| Hyperlipidemia | 3.045 | 1.095–8.472 | 0.033 | 1.397 | 0.537 | 6.758 | 4.044 | 1.410–11.594 | 0.009 |
| Hypoalbuminemia | 2.382 | 0.958–5.923 | 0.062 | - | - | - | - | - | - |
| eGFR, mL/min/1.73/m |
0.983 | 0.967–0.998 | 0.029 | –0.018 | 0.008 | 5.061 | 0.982 | 0.967–0.998 | 0.024 |
| 0.211 | 0.086–0.521 | 0.001 | –1.582 | 0.468 | 11.436 | 0.206 | 0.082–0.514 | 0.001 | |
Abbreviations: BMI, body mass index; eGFR, estimate glomerular filtration rate; -, not applicable; HR, hazard ratio; CI, confidence interval; LVEF, left ventricular ejection fraction; HFpEF, heart failure with preserved ejection fraction; SE, standard error.
| Univariate | Multivariate | ||||||||
| HR | 95% CI | p-value | SE | Wald |
HR | 95% CI | p-value | ||
| Age, years | 1.090 | 1.030–1.155 | 0.003 | 0.116 | 0.029 | 15.601 | 1.123 | 1.060–1.190 | |
| Male | 1.860 | 0.721–4.799 | 0.200 | - | - | - | - | - | - |
| COPD | 2.592 | 0.849–7.916 | 0.094 | - | - | - | - | - | - |
| Chronic kidney disease | 2.267 | 0.878–5.854 | 0.091 | - | - | - | - | - | - |
| Smoking | 3.338 | 1.293–8.617 | 0.013 | 1.331 | 0.530 | 6.317 | 3.785 | 1.340–10.687 | 0.012 |
| Hypoalbuminemia | 2.741 | 1.026–7.320 | 0.044 | 1.911 | 0.579 | 10.884 | 6.758 | 2.172–21.030 | 0.001 |
| Anemia | 2.746 | 1.083–6.961 | 0.033 | - | - | – | - | - | - |
| Baseline LVEDD | 0.938 | 0.879–1.002 | 0.057 | - | - | - | - | - | - |
| Baseline LVESD | 0.892 | 0.808–0.985 | 0.024 | - | - | - | - | - | - |
| Hemoglobin | 0.983 | 0.964–1.002 | 0.076 | - | - | - | - | - | - |
| eGFR, mL/min/1.73/m |
0.982 | 0.967–0.997 | 0.021 | –0.018 | 0.009 | 3.952 | 0.982 | 0.964–1.000 | 0.047 |
| Oral anticoagulations | 0.173 | 0.023–1.300 | 0.088 | - | - | - | - | - | - |
Abbreviations: LVEDD, left ventricular end-diastolic diameter; LVESD, left ventricular end-systolic diameter; eGFR, estimate glomerular filtration rate; -, not applicable; HR, hazard ratio; CI, confidence interval; LVEF, left ventricular ejection fraction; HFpEF, heart failure with preserved ejection fraction; SE, standard error.
| Univariate | Multivariate | ||||||||
| HR | 95% CI | p-value | SE | Wald |
HR | 95% CI | p-value | ||
| Age, years | 1.218 | 1.052–1.411 | 0.008 | 0.225 | 0.102 | 4.877 | 1.252 | 1.026–1.529 | 0.027 |
| Male | 1.758 | 0.293–10.530 | 0.537 | - | - | - | - | - | - |
| Heart rate, beats per min | 1.050 | 1.004–1.097 | 0.034 | - | - | - | - | - | - |
| Hyperuricemia | 6.267 | 1.044–37.619 | 0.045 | - | - | - | - | - | - |
| Potassium, mmol/L | 2.161 | 1.120–4.168 | 0.022 | 1.195 | 0.429 | 7.762 | 3.304 | 1.425–7.66 | 0.005 |
| eGFR, mL/min/1.73/m |
0.960 | 0.928–0.994 | 0.020 | - | - | - | - | - | - |
Abbreviations: eGFR, estimate glomerular filtration rate; -, not applicable; HR, hazard ratio; CI, confidence interval; LVEF, left ventricular ejection fraction; HFpEF, heart failure with preserved ejection fraction; SE, standard error.
Comparability between the low LVEF-HFpEF and high LVEF-HFpEF groups was adjusted
using 1:1 PSM. Baseline indicators between the two groups were included in the
analysis, with a caliper value set at 0.2. A total of 87 pairs were successfully
matched, and after PSM, there were no statistically significant differences in
baseline data between the two groups (p
 Fig. 4.
Kaplan-Meier survival curve of HFpEF patients after PSM. (A) All-cause death in the PSM population. (B) Cardiovascular death in the PSM population. PSM, propensity score matching. LVEF, left ventricular ejection fraction; HFpEF, heart failure with preserved ejection fraction.
During the follow-up period, differences were observed in cardiovascular and
noncardiovascular deaths among different HFpEF phenotypes. Therefore,
noncardiovascular death was considered a competing event in the competing risk
analysis. The results showed that the cardiovascular mortality risk of the high
LVEF-HFpEF group was lower than that of the low LVEF-HFpEF group (Fine-Gray
p
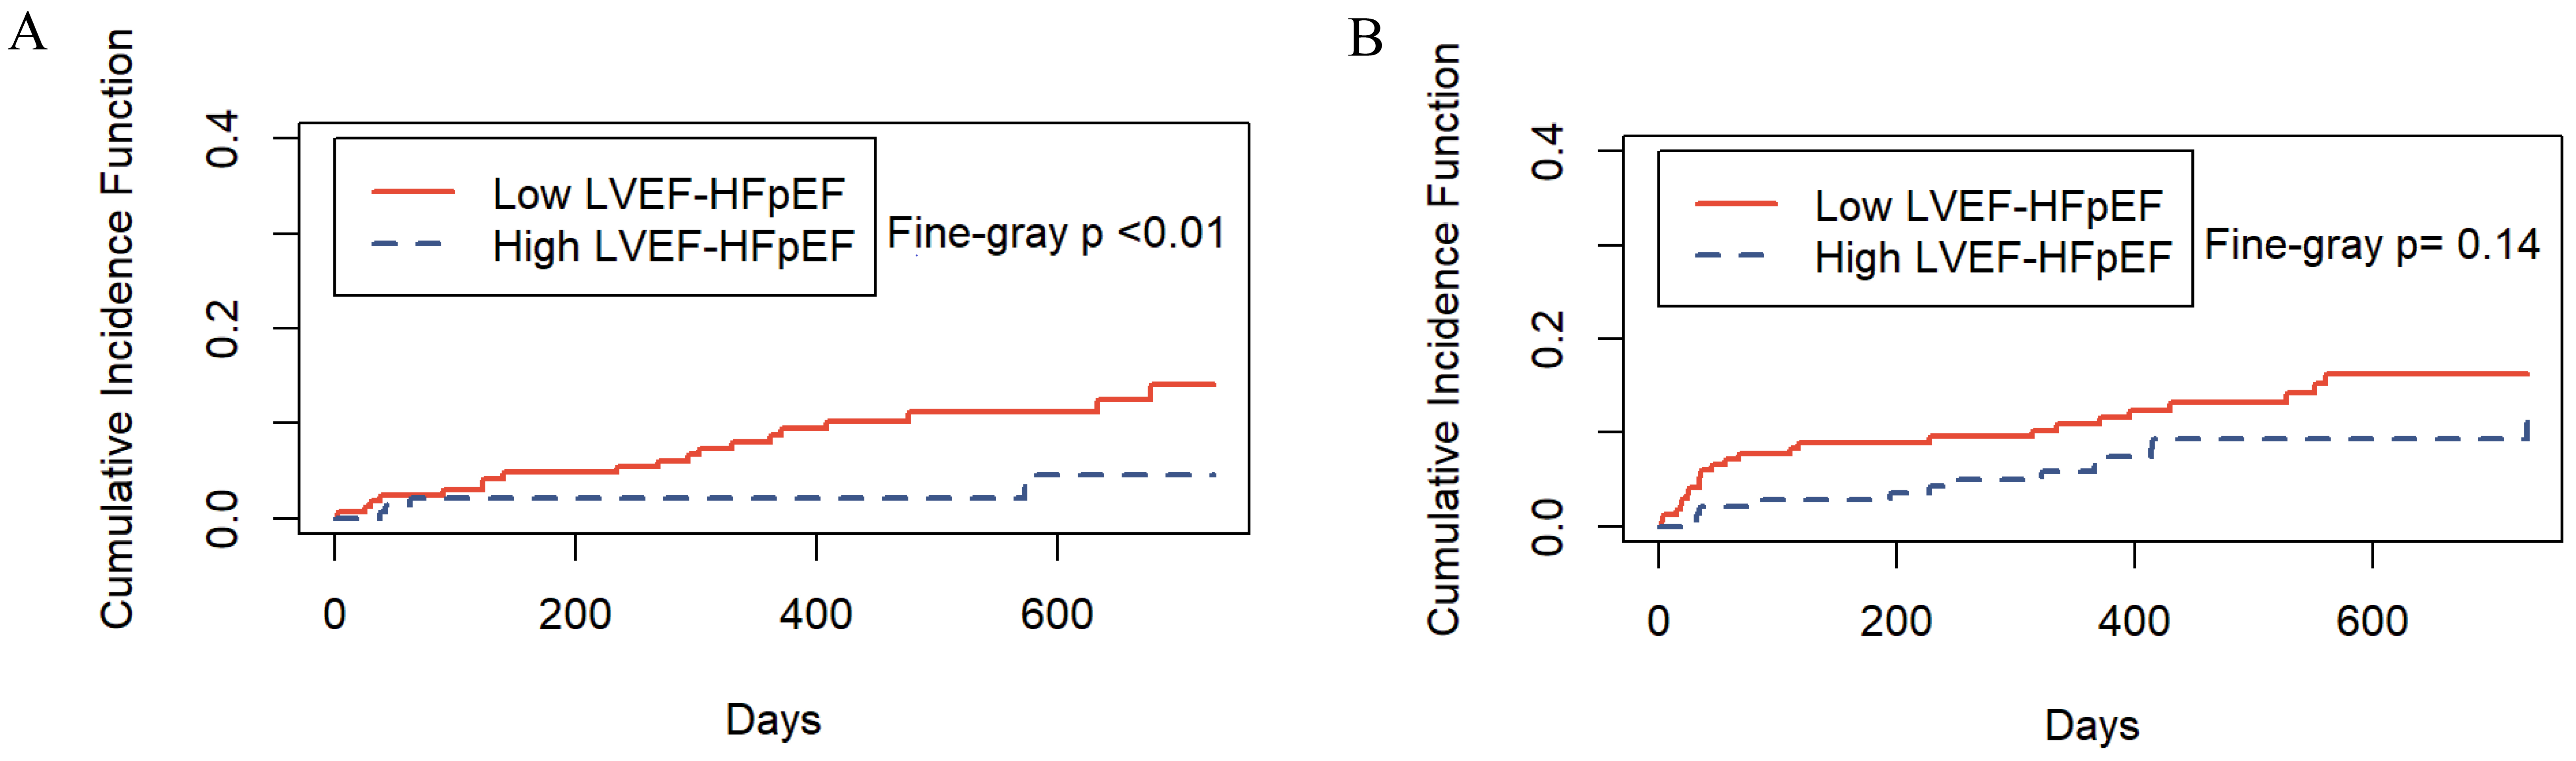 Fig. 5.
Incidence of cardiovascular and noncardiovascular deaths by HFpEF phenotype. (A) The risk of cardiovascular death. (B) The risk of competing events. LVEF, left ventricular ejection fraction; HFpEF, heart failure with preserved ejection fraction.
While there has been a considerable amount of research investigating the
clinical characteristics and outcomes of HFpEF, available data on HFpEF subtypes
based on different LVEF ranges are limited. This is partly due to the
categorization of HF patients with LVEF
The focus of this study was to explore the clinical features and prognosis of HFpEF within different LVEF ranges. This study revealed significant differences in clinical characteristics and two-year survival rates among HFpEF subtypes with varying LVEF ranges. Compared to the high LVEF-HFpEF group, the low LVEF-HFpEF group exhibited higher diastolic blood pressure and faster HR, suggesting that there may be an underlying decrease in arterial elasticity and myocardial contractility in patients in the low LVEF-HFpEF group.
In the past, HFpEF was traditionally considered to be solely caused by diastolic dysfunction of the heart. However, recent research has revealed that HFpEF also encompasses significant impairment in systolic function and a restricted contractile reserve during periods of stress [7, 8]. When cardiac contractility declines, LVEF decreases, and the heart needs to beat faster to maintain adequate blood supply. Therefore, patients with lower LVEF may exhibit a higher HR as the disease progresses normally.
Furthermore, in comparison to the high LVEF-HFpEF group, patients in the low LVEF-HFpEF group had higher levels of serum creatinine and lower eGFR. Notably, there were no significant differences between the low LVEF-HFpEF group and the HFmrEF or HFrEF groups. This suggests that low LVEF-HFpEF may share similarities with HFmrEF and HFrEF. In this study, for each unit increase in eGFR, there was a 1.2% reduction in the risk of all-cause mortality and a 1.8% reduction in the risk of cardiovascular mortality among HF patients (Tables 2,3). The findings indicate a negative correlation between the eGFR and both all-cause and cardiovascular mortality in HF, which aligns with previous research [9, 10, 11]. This correlation may be related to improved renal perfusion at higher LVEF levels. The intricate relationship between the heart and kidneys has long been a subject of extensive research [12], involving mechanisms such as neurohumoral drive, autonomic reflexes, and fluid balance alterations, all of which collectively maintain circulatory and internal environmental homeostasis. However, the findings of this study underscore the differences in HFpEF subtypes within different LVEF ranges, possibly reflecting distinct pathological processes between these two HFpEF subtypes.
This study observed differences in survival rates among various HF phenotypes, with the high LVEF-HFpEF group having the lowest mortality rate and the HFrEF group having the highest. In contrast, the survival rates of the low LVEF-HFpEF and HFmrEF groups were relatively close. HFmrEF patients are typically situated on a dynamic trajectory transitioning from HFrEF to either improvement or deterioration [6, 13]. This suggests that low LVEF-HFpEF may also represent a clinically unstable phenotype. Therefore, dynamic monitoring of LVEF changes over time and actively searching for the causes of EF variation are crucial.
After PSM, the survival rate of the low LVEF-HFpEF group remained lower than
that of the high LVEF-HFpEF group (Fig. 4A,B). This difference may be attributed
to variations in cardiac morphology and pathophysiology between the two subtypes.
Sebastian Rosch and colleagues analyzed patients with HFpEF whose LVEF fell
within the ranges of 50%–60% and LVEF
This study showed that HF patients with hypoalbuminemia were more likely to experience adverse outcomes. Hypoalbuminemia leads to decreased plasma oncotic pressure and effective circulating blood volume, exacerbating microcirculation and multiorgan dysfunction. Additionally, reduced serum albumin levels diminish antibody production and immune function while increasing the risk of various infections, further deteriorating the condition of HF patients [15]. Furthermore, elevated potassium (K+) levels were associated with an increased cardiovascular disease (CVD) risk in high LVEF-HFpEF patients. Blood potassium levels were reported to be independently associated with hospitalization and long-term mortality events in HF patients, exhibiting a “U”-shaped curve pattern [16]. Moreover, HF patients possess multiple risk factors for hyperkalemia, including advanced age, diabetes, chronic kidney disease, or metabolic acidosis, all of which are associated with an increased risk of hospitalization and mortality [17]. Therefore, the importance of monitoring blood potassium levels should not be underestimated in the management of HF patients.
This study did not reveal any significant impact of ACEI, ARB, or ARNI on the
prognosis of HFpEF. Additionally, due to the timeframe of the study,
sodium-glucose cotransporter-2 inhibitors (SGLT2is) were not included in this
research study. Initially, recommended for treating HFrEF, recent studies have
suggested that SGLT2is exhibit significant therapeutic potential for HF patients
across all LVEF categories, in part due to their capacity to reduce blood volume
in HF patients [18, 19]. Reducing blood volume can alleviate cardiac load, improve
both systolic and diastolic function, decrease myocardial oxygen consumption, and
potentially enhance cardiac structure and function. Hence, it is a valuable
strategy for HF patients. However, HFpEF patients exhibit notable differences in
hemodynamics and myocardial fibrosis between resting and exercise states, with
patients having LVEF
Furthermore, this study revealed that
In summary, recognizing the clinical significance of observed differences among HFpEF subgroups, our study underscores the heterogeneity of the HFpEF population and the necessity for tailored therapeutic strategies. The distinct clinical characteristics and prognoses of low LVEF-HFpEF versus high LVEF-HFpEF subgroups suggest that a one-size-fits-all approach is insufficient for managing HFpEF patients. The low LVEF-HFpEF subgroup may benefit from more aggressive management of risk factors. Optimal management of comorbidities such as hyperlipidemia, coronary artery disease, and cerebrovascular disease, alongside vigilant monitoring of renal function and cardiac structural changes (i.e., LVEDD and LVESD), could be key to improving prognosis in this subgroup. Moreover, attention to nutritional status to ensure appropriate body mass index and improvement of hypoalbuminemia would be beneficial. Conversely, the high LVEF-HFpEF subgroup may benefit more from primary prevention strategies and lifestyle modifications. This includes smoking cessation programs and targeted dietary interventions such as appropriate potassium intake.
(1) This is a single-center retrospective study. Although patients were rigorously selected based on inclusion and exclusion criteria, larger sample sizes and longer-term follow-up results are needed in the future to validate these findings. (2) A significant portion of HF patients in this study had received interventions at other health care institutions before their visits to the study center. For these patients, we did not have information on their EF before the intervention, and we did not obtain other information about them at that time, which could result in missing data bias. (3) This study primarily utilized noninvasive echocardiography to assess the LVEF in heart failure patients. Due to technical and resource limitations, we encountered challenges in collecting global longitudinal strain (GLS) data. Future research will aim to address these limitations to provide more comprehensive insights.
In conclusion, the results of this study support the notion that HFpEF with LVEF
The datasets used and/or analyzed during the current study are available from the corresponding author on reasonable request.
JJS: collected data, interpreted, analyzed data, wrote and authored the manuscript; critical revision of important elements. KKS and YPS: patient follow-up management, data collection; methodology; critical revision of important content. LHH, YTW: Data analysis and statistics and textual embellishment of the manuscript. SXC, JG: supervision; study design and critical revision of the manuscript based on comments from other authors and feedback from reviewers. All authors read and approved the final manuscript. All authors have participated sufficiently in the work and agreed to be accountable for all aspects of the work.
This study was reviewed and approved by the Ethics Committee of Hebei General Hospital, with informed consent waived (NO.2023142).
Not applicable.
This research received no external funding.
The authors declare no conflict of interest.
References
Publisher’s Note: IMR Press stays neutral with regard to jurisdictional claims in published maps and institutional affiliations.