


1 Neurology Department of Lishui Municipal Central Hospital, 323000 Lishui, Zhejiang, China
2 Lishui Cardio-Cerebrovascular Disease Prevention Center, 323000 Lishui, Zhejiang, China
†These authors contributed equally.
Abstract
Background: Post-stroke cognitive impairment
(PSCI) represents a serious post-stroke complication with poor cognitive
consequences. A vascular consequence after a stroke is that the occurrence and
progression of PSCI may be closely related to blood pressure (BP). Thus, we
systematically reviewed and performed a meta-analysis of the literature to
examine the correlations between BP and PSCI. Methods: We systematically
queried databases, including PubMed, the Cochrane Library, Embase, and Scopus,
and conducted meta-analyses on studies reporting odds ratios (ORs) related to the
association between BP and PSCI. Two authors autonomously assessed all titles,
abstracts, and full texts and extracted data following the Meta-Analysis of
Observational Studies in Epidemiology guidelines. The quality of the studies was
evaluated using the modified Newcastle–Ottawa scale. Results:
Meta-analyses incorporated 12 articles comprising a cumulative participant cohort
of 21,732 individuals. The quality assessment indicated good in five studies,
fair in one study, and poor in six. Through meta-analyses, we found that
hypertension, systolic or diastolic BP (SBP or DBP) was significantly associated
with PSCI (OR 1.53, 95% confidence interval (CI), 1.18–1.99;
p = 0.001, I
Keywords
- post-stroke cognitive impairment
- vascular cognitive impairment
- stroke
- blood pressure
- hypertension
- meta-analysis
Post-stroke cognitive impairment (PSCI) is a cognitive dysfunction or decline that occurs following a stroke and manifests as deterioration in orientation, memory, and executive function [1]. Moreover, the onset of PSCI has no specific time frame. The present study suggests that PSCI may manifest between 3 and 6 months post-incident stroke, exhibiting a potential stabilization within the initial 12 months. However, it is also accepted that PSCI may persist or advance in the years following a stroke [1, 2]. In some stroke survivors, PSCI could cause severe complications or comorbidities, such as incontinence, depression, and dementia. These complications tend to bring extreme distress to patients and caregivers. Cognitive impairment is observed in 20%–80% of post-stroke individuals, displaying variability based on geographic location, racial demographics, and diagnostic criteria [3]. In addition, some risk factors also predispose stroke patients to PSCI, including older age, diabetes, atrial fibrillation, small vascular diseases (SVDs), etc. [4, 5, 6]. Among these risk factors, blood pressure (BP) may also contribute to the occurrence and progression of PSCI [7].
The mechanism of BP on PSCI is complex and unclear; the consideration of treating vascular risk has been proposed as a potential preventive measure for cognitive impairment [8]. Furthermore, previous studies also found that abnormal BP at baseline or follow-ups was a risk factor for PSCI [3, 9]. In other words, hyper- and hypo-BP may increase the risk of cognitive impairment in patients following a stroke, which is a U-shaped relationship that has been reported in other articles [10, 11, 12]. Indeed, several studies have detailed a positive association between BP and PSCI [13, 14], although these results are inconsistent [5, 8, 15]. Therefore, we performed a meta-analysis to quantify the association between BP and PSCI and to provide a definite threshold if possible.
The protocol of this systematic review was registered with the International Prospective Register of Systematic Reviews (registration no. CRD 42023437783), following the Meta-Analysis of Observational Studies in Epidemiology (MOOSE) guidelines [16].
Two independent reviewers systematically searched PubMed, the Cochrane Library, Embase, and Scopus, with no restrictions on publication date. For publication language, only articles published in English were considered and included. Moreover, a manual search of reference lists for related reviews and studies was conducted. The search string was built as follows: (“blood pressure” OR hypertension OR hypotension) AND (“cognitive impairment” OR “cognitive decline” OR dementia) AND (stroke). A Supplementary File (Supplementary: Search key terms and strategy) describing the comprehensive search term framework is attached.
The systematic review adhered to the PECOS (P-participants, E-exposure, C-comparisons, O-outcomes, S-study design) framework for identifying potential eligible studies. The inclusion and eligibility criteria were defined as follows:
(1) Type of participants: Studies were included if participants were adults
(
(2) Type of exposures: Studies examined systolic or diastolic BP (SBP or DBP), or both, hypertension, or hypotension were included. Studies that focused on BP variability or pulse pressure were excluded.
(3) Type of comparisons: There was no restriction on comparisons.
(4) Type of outcomes: Cognitive impairment should be operationalized or assessed using standardized instruments, including but not limited to the Mini-Mental State Examination (MMSE), Montreal Cognitive Assessment (MoCA), Cambridge Cognition Examination (CAMCOG), etc. [1].
(5) Type of study designs: Observational studies (e.g., prospective or retrospective, and cross-sectional studies) or post-hoc or secondary analyses from randomized controlled trial (RCT) reporting the odds ratio (OR) of PSCI were included.
All retrieved records were initially exported to EndNote X9 (version EndNote X9.3.2, Captivate Analytics, San Francisco, CA, USA) for deduplication. First, two independent reviewers screened the title and abstracts of the records for eligibility. In cases where an abstract was unavailable, records were preserved for a comprehensive full-text review. Second, the same investigators evaluated the complete text of potential studies to ascertain their final inclusion in the review. Finally, any discrepancies would be resolved by consensus with a senior reviewer.
The following data from each included study were extracted by two independent reviewers: First author, publication year, country, source of study, design, sample size, participants characteristics (gender, age, type of stroke), exposure characteristics (type, timing), outcome characteristics (measurements, timing), missing data (loss rate, methods to missing data), and related methods of statistical analysis for association between BP and PSCI. If key information was missing from the study report, a communication would be dispatched to the original authors via email to acquire information. Any inconsistencies were addressed through discussions with a senior reviewer for resolution.
Two reviewers independently evaluated the risk of bias (RoB) for each study using modified iterations of the Newcastle–Ottawa scale [17]. The criteria for overall quality assessment were as follows [18]: (1) Good quality: Receiving 3 or 4 stars in the selection domain AND 1 or 2 stars in the comparability domain AND 2 or 3 stars in the outcome/exposure domain. (2) Fair quality: Receiving 2 stars in the selection domain AND 1 or 2 stars in the comparability domain AND 2 or 3 stars in the outcome/exposure domain. (3) Poor quality: Receiving 0 or 1 star in the selection domain OR 0 stars in the comparability domain OR 0 or 1 stars in the outcome/exposure domain.
Meta-analyses were conducted utilizing RevMan 5.3 software (version 5.3,
Cochrane Collaboration, Oxford, UK). The inverse variance method was used to pool
effect estimates. Higgins I
A total of 767 articles were identified in the electronic databases (212 from PubMed, 191 from the Cochrane Library, 200 from Embase, and 164 from Scopus), with five additional articles identified through reference screening. After excluding 22 duplicates, 750 titles, and abstracts were reviewed, and 43 full-text articles were assessed. Finally, after excluding 31 studies for ineligible outcomes [20, 21, 22, 23, 24, 25, 26], participants [27, 28, 29], exposures [13, 30, 31, 32], study designs [33, 34, 35, 36, 37, 38, 39, 40], methodological analyses [4, 14, 15, 41, 42, 43], and published languages [44], 12 articles were identified as eligible and included in this meta-analysis. Fig. 1 illustrates the study selection process flow, including the reasons for exclusion.
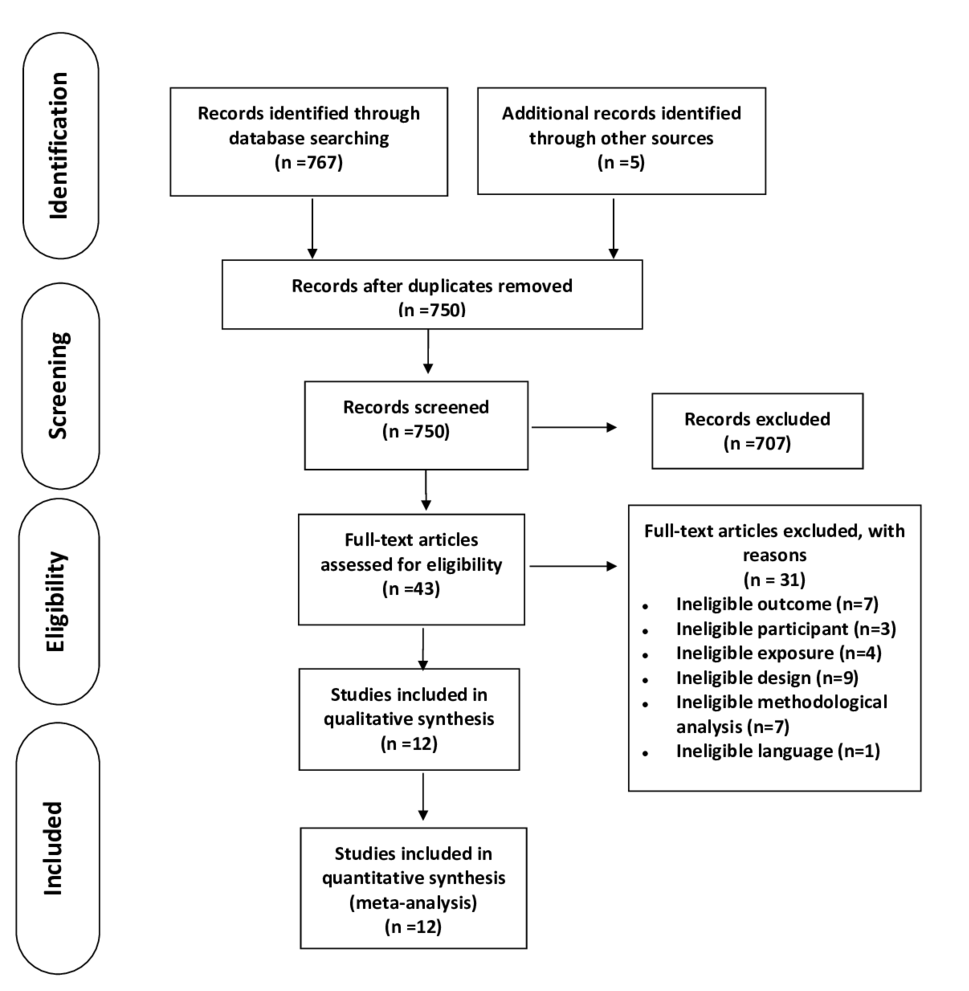 Fig. 1.
Flow chart depicting the search procedure. Systematic search of PubMed, the Cochrane Library, Embase, and Scopus was performed and identified 767 articles, with 5 additional articles identified through reference screening. After duplicate removal and title/abstract review, 43 citations were selected for full-text review. A total of 12 studies were included in the meta-analysis, with a total population of 21,732 patients.
Altogether, 12 articles [8, 11, 45, 46, 47, 48, 49, 50, 51, 52, 53, 54] with 21,732 participants were included (Table 1, Ref. [8, 11, 45, 46, 47, 48, 49, 50, 51, 52, 53, 54]). For different metrics of BP, six studies reported hypertension [46, 49, 51, 52, 53, 54], 3 reported SBP [47, 48, 50], and 1 reported DBP [45]. Individuals were classified as hypertensive if their BP exceeded 140/90 mmHg. Some of the included studies also reported the effects of different BP grades on PSCI [8, 11, 46, 47]. The details of BP measurements are presented in Table 2 (Ref. [8, 11, 45, 46, 47, 48, 49, 50, 51, 52, 53, 54]). For the timing of BP recorded, except for 1 study, which measured BP at the follow-up visit [46], the other 11 studies measured BP at baseline or admission [8, 11, 45, 47, 48, 49, 50, 51, 52, 53, 54]. For the tools used to measure PSCI, 11 studies used scales or examinations to test PSCI, and only 1 study reported PSCI by clinical diagnosis [46]. For the timing of PSCI being observed, the most common follow-up duration was 3 months (reported in 5 studies), the shortest was at discharge, and the longest was 4.4 years. Of these, 12 included studies [8, 11, 45, 46, 47, 48, 49, 50, 51, 52, 53, 54], 3 were secondary or post-hoc analyses from RCTs [8, 46, 48], 9 were observational studies [11, 45, 47, 49, 50, 51, 52, 53, 54], and every study used logistic regression for statistical analysis to explore the association between BP and PSCI.
| Study | Country | Source of study | Design | Sample size (female, %) | Age group mean (SD)/median (range) | Type of stroke | Type of BP | Outcome measure tool | Outcome timing | Rate of missing data | ITT | Statistical analysis | |
| Mok et al. 2012 [45] | HK, China | VITATOPS | Prospective | 100 (48) | 75.17 (7.60) | Ischemic stroke | Baseline DBP | CDR | 2 years | 16% | Yes | Logistic regression | OR |
| Hilkens et al. 2021 [46] | Netherlands | PRoFESS | Post-hoc analysis from RCT | 817 (41) | 70.1 (8.5) | Non-cardioembolic ischemic stroke | Mean SBP | Clinical diagnosis at the final follow-up visit | Median 2.4 years (range 0–4.4 years) | 1.2% | No | Logistic regression | OR |
| Mean DBP | |||||||||||||
| Hypertension | |||||||||||||
| Tuttolomondo et al. 2013 [47] | Italy | GIFA | Prospective | 514 (52.91) | 73.452 (6.2) | Acute ischemic stroke | SBP at admission | HAMT | Discharge | 53.1% | No | Logistic regression | OR |
| You et al. 2017 [48] | Australia | INTERACT | Secondary analysis from RCT | 231 (35.5) | 62.3 (12.4) | Acute intracerebral hemorrhage | Mean SBP at baseline | MMSE | 3 months | 42.8% | No | Logistic regression | OR |
| Ihle-Hansen et al. 2015 [8] | Norway | NCT00506818 | Secondary analysis from RCT | 150 (44%) | 71.5 (12.4) | Stroke | Baseline SBP | Clock Drawing Test | 1 year | 13% | No | Logistic regression | OR |
| Geng et al. 2017 [49] | China | ChiCTR-TRC-14004804 | Prospective cohort | 708 (45.9) | 63.1 (10.0) | Acute ischemic stroke | Hypertension at admission | MoCA | 3 months | 11% | No | Logistic regression | OR |
| He et al. 2018 [11] | China | ChiCTR-TRC-14004804 | Prospective cohort | 796 (47) | 63.19 (9.13) | Acute ischemic stroke | Mean SBP and DBP at baseline | MoCA | 3 months | 11% | No | Logistic regression | OR |
| Gong et al. 2020 [50] | China | NR | Prospective cohort | 90 (35.5) | 68.70 (12.76) | Intracerebral hemorrhage | SBP at admission | MoCA | 2 weeks | NR | NA | Logistic regression | OR |
| Sarfo et al. 2017 [51] | Ghana | NR | Cross-sectional study | 147 (47.6) | 59.9 (13.7) | Stroke | Baseline hypertension | V-NB | NR | 26.5% | No | Logistic regression | OR |
| Jacquin et al. 2014 [52] | France | NR | Prospective cohort | 220 (44.1) | 66.1 (16.6) | Stroke | Baseline hypertension | MMSE | 3 months | 21.4% | No | Logistic regression | OR |
| MoCA | |||||||||||||
| Arba et al. 2017 [53] | UK | VISTA | Retrospective | 1294 (35) | 63.7 (11.8) | Stroke | Baseline hypertension | MMSE | 1 year and 3 years | 58.4% and 76.3% | No | Logistic regression | OR |
| Lu et al. 2019 [54] | China | NR | Prospective | 213 (35) | 64.8 (11.5) | Acute ischemic stroke | Baseline hypertension | MoCA | 3 months | 8.2% | No | Logistic regression | OR |
Note: BP, blood pressure; ITT, intention-to-treat analysis; OR, odds ratio; VITATOPS, VITAmins TO Prevent Stroke study (NCT00097669); SBP, systolic blood pressure; DBP, diastolic blood pressure; CDR, Clinical Dementia Rating scale; MMSE, Mini-Mental State Examination; MoCA, Montreal Cognitive Assessment; PRoFESS, Prevention Regimen for Effectively avoiding Second Strokes (NCT00153062); GIFA, Gruppo Italiano di Farmacoepidemiologia nell’Anziano; HAMT, Hodkinson Abbreviated Mental Test; INTERACT, Intensive Blood Pressure Reduction in Acute Cerebral Hemorrhage Trial (NCT00226096); NR, not reported; V-NB, Vascular Neuropsychological Battery; VISTA, Virtual International Stroke Trial Archive; RCT, randomized controlled trial.
| Study | Hypertension | SBP | DBP | SBP grading (mmHg) | DBP grading (mmHg) |
| Mok et al. 2012 [45] | |||||
| Hilkens et al. 2021 [46] | |||||
| 120–129 | 70–79 | ||||
| 130–139 | 80–89 | ||||
| 140–149 | 90–99 | ||||
| 150–159 | |||||
| Tuttolomondo et al. 2013 [47] | |||||
| You et al. 2017 [48] | |||||
| Ihle-Hansen et al. 2015 [8] | |||||
| Geng et al. 2017 [49] | |||||
| He et al. 2018 [11] | 102–127 | 66–82 | |||
| 128–142 | 83–92 | ||||
| 143–158 | 93–102 | ||||
| 159–170 | 103–109 | ||||
| 171–215 | 110–138 | ||||
| Gong et al. 2020 [50] | |||||
| Sarfo et al. 2017 [51] | |||||
| Jacquin et al. 2014 [52] | |||||
| Arba et al. 2017 [53] | |||||
| Lu et al. 2019 [54] |
Note: SBP, systolic blood pressure; DBP, diastolic blood pressure; BP, blood pressure;
The general quality was assessed as good in five studies, fair in one study, and poor in six. In the included studies, BP was evaluated using dependable methods. For comparability, we considered baseline cognitive function or the National Institutes of Health Stroke Scale (NIHSS) score as key confounders and age, sex, antihypertensive treatment, and education as additional confounders. In the outcome assessment, four studies that reported PSCI were assessed by an independent, experienced neurologist or physician, while the other eight did not. The details of the RoB assessment are presented in Tables 3-1 (Ref. [8, 11, 45, 46, 47, 48, 49, 50, 52, 53, 54]) and 3-2 (Ref. [51]).
| Study | Selection | Comparability | Outcome | Total | ||||||
| Cohort representative | Non-exposed cohort | Exposure ascertainment | Outcome not presented at baseline | Controls for key confounder | Controls for additional confounder | Outcome assessment | Follow-up length | Follow-up rate | Overall quality | |
| Mok et al. 2012 [45] | ★ | ★ | ★ | - | - | ★ | ★ | ★ | ★ | Good (8) |
| Hilkens et al. 2021 [46] | ★ | ★ | ★ | - | ★ | ★ | - | ★ | ★ | Good (7) |
| Tuttolomondo et al. 2013 [47] | ★ | ★ | ★ | - | - | - | - | - | - | Poor (3) |
| You et al. 2017 [48] | ★ | ★ | ★ | - | - | - | - | ★ | - | Poor (4) |
| Ihle-Hansen et al. 2015 [8] | ★ | ★ | ★ | - | ★ | ★ | - | ★ | ★ | Good (7) |
| Geng et al. 2017 [49] | ★ | ★ | ★ | - | ★ | ★ | - | ★ | ★ | Good (7) |
| He et al. 2018 [11] | ★ | ★ | ★ | - | ★ | ★ | ★ | ★ | ★ | Good (8) |
| Gong et al. 2020 [50] | ★ | ★ | ★ | - | - | ★ | - | - | - | Poor (4) |
| Jacquin et al. 2014 [52] | ★ | ★ | ★ | - | - | - | ★ | ★ | ★ | Poor (6) |
| Arba et al. 2017 [53] | ★ | ★ | ★ | - | ★ | ★ | - | ★ | - | Poor (6) |
| Lu et al. 2019 [54] | ★ | ★ | ★ | - | - | ★ | - | - | ★ | Poor (6) |
Note: list of items and acceptable assessment (maximum stars per item):
1. Representativeness of the exposed cohort: whether it is genuinely (all subjects or random sampling) or somewhat (non-random sampling) reflective of the average in the target population (★).
2. Selection of the non-exposed cohort: drawn from the identical community as the exposed cohort (★).
3. Ascertainment of the exposure (BP): hypertension, SBP, or DBP at baseline or follow-up visit (★).
4. Confirmation that the outcome of interest was absent at the commencement of the study: yes (★).
1. Assessment of the outcome (PSCI or post-stroke dementia): objective and unbiased blind evaluation of PSCI or medical record linkage (★).
2. Was the follow-up duration sufficient to observe the occurrence of outcomes: most common—3 months from baseline to final cognitive assessment (★).
3. Adequacy of follow-up: either complete (with all subjects accounted for) or
subjects lost to follow-up deemed unlikely to introduce bias, or a small number
lost (
Overall quality assessment (maximum 9 stars):
BP, blood pressure; SBP, systolic blood pressure; DBP, diastolic blood pressure; PSCI, post-stroke cognitive impairment.
| Study | Selection | Comparability | Outcome | Total | |||||
| Sample representative | Sample size justified/satisfactory | Non-respondents | Exposure ascertainment | Controls for key confounder | Controls for additional confounders | Outcome assessment | Statistical testing appropriate | Overall quality | |
| Sarfo et al. 2017 [51] | ★ | - | - | ★ | - | ★ | ★ | ★ | Fair (5) |
Note: list of items and acceptable assessment (maximum stars per item):
1. Sample representative: truly (all subjects or random sampling) or somewhat (non-random sampling) reflective of the average in the target population (★).
2. Sample size: justified and satisfactory (★).
3. Non-respondents: equivalence in characteristics between respondents and non-respondents was confirmed, and the response rate is deemed satisfactory (★).
4. Ascertainment of the exposure (BP): hypertension, SBP, or DBP at baseline or follow-up visit (★).
1. Subjects in different outcome groups are comparable, and confounders are controlled: study controls for the most important factor—baseline cognitive function or NIHSS score (★) and any additional factor or secondary important factor (age, sex, antihypertensive treatment, or education) (★).
1. Assessment of the outcome (PSCI or post-stroke dementia): independent blind assessment of PSCI or medical record linkage (★).
2. Statistical test: test to describe the data clearly and appropriate measurement of the association is presented, including confidence intervals and p-value (★).
Overall quality assessment (maximum 8 stars):
BP, blood pressure; SBP, systolic blood pressure; DBP, diastolic blood pressure; PSCI, post-stroke cognitive impairment.
A total of six studies were incorporated into the meta-analysis in terms of
hypertension and PSCI. A forest plot (Fig. 2) showed that hypertension
significantly increased the odds of PSCI in patients following a stroke (OR 1.53,
95% CI, 1.18–1.99; p = 0.001). The statistical heterogeneity was
moderate (I
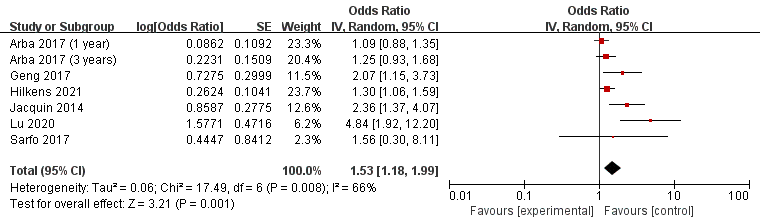 Fig. 2.
Forest plot of the association between hypertension and post-stroke cognitive impairment (PSCI). SE, standard error; CI, confidence interval; p-value of 0.05 or less indicated statistical significance.
The meta-analysis included 12 SBPs. Forest plot (Fig. 3) showed that SBP was
significantly associated with the incidence of PSCI (OR 1.13, 95% CI,
1.05–1.23; p = 0.002). Furthermore, people with an SBP
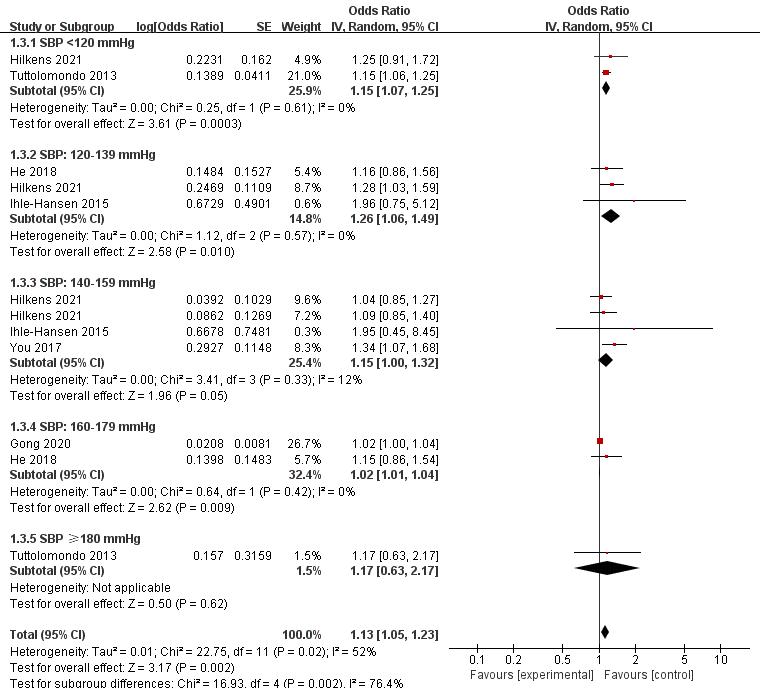 Fig. 3.
Forest plot of association between SBP and PSCI. SE, standard error; CI, confidence interval; p-value of 0.05 or less indicated statistical significance. SBP, systolic blood pressure; PSCI, post-stroke cognitive impairment.
The meta-analysis included nine DBPs. The forest plot (Fig. 4) showed that the
DBP could significantly predict the odds of PSCI (OR 1.38, 95% CI, 1.11–1.72;
p = 0.004). In the subgroup analysis, DBP
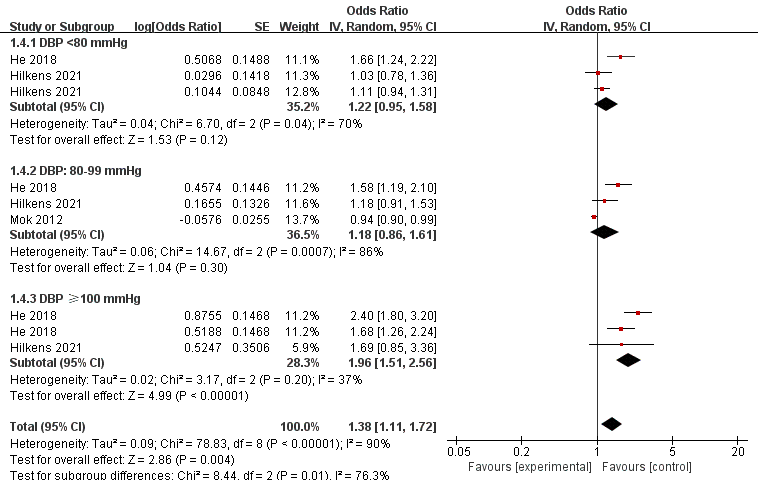 Fig. 4.
Forest plot of association between DBP and PSCI. SE, standard error; CI, confidence interval; p-value of 0.05 or less indicated statistical significance. DBP, diastolic blood pressure; PSCI, post-stroke cognitive impairment.
The sensitivity analysis did not affect the pooled effect estimates; the overall effect remained significant when we removed the studies one by one. Furthermore, when only studies on ischemic stroke were retained in this meta-analysis, the pooled effect estimates remained unaffected. Considering that only Hilkens et al. [46] measured BP at follow-ups, we removed this study from the meta-analysis to detect the robustness of pooled effect estimates, which remained significant, thereby indicating that the meta-analysis results were robust. Nevertheless, when we removed Gong’s study for the SBP and PSCI outcomes, the overall heterogeneity changed from 52% to 0%, meaning Gong’s study could be the main source of the moderate heterogeneity.
More than 10 studies were incorporated into the SBP and PSCI outcomes meta-analysis. The funnel plot (Fig. 5) showed the existing obvious publication bias, which may be due to some negative results in the unpublished studies.
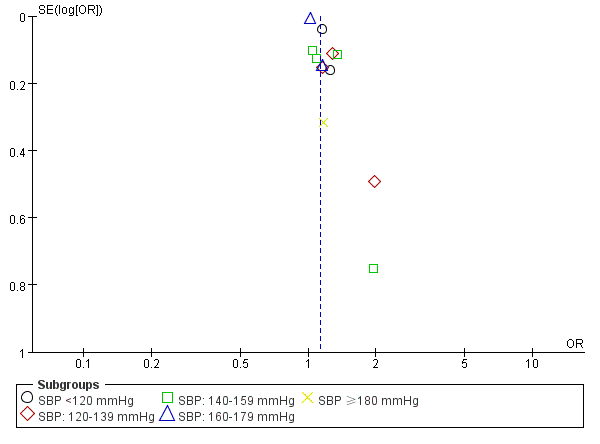 Fig. 5.
Funnel plot of publication bias by SBP for PSCI. OR, odds ratio; SE, standard error; SBP, systolic blood pressure; PSCI, post-stroke cognitive impairment..
This meta-analysis showed that for post-stroke patients (aged from 46 to 83
years), hypertension, SBP, and DBP measured at baseline or follow-ups are risk
factors for PSCI. This finding applies to common subtypes of stroke, such as
ischemic and hemorrhagic stroke. Additionally, during the 4-year period after a
stroke, the onset of cognitive impairment is closely related to BP, and this
effect begins as early as being discharged. Furthermore, SBP or DBP at different
intervals have different effects on the occurrence and progression of PSCI. The
incidence of cognitive impairment in stroke patients with SBP
A previous systematic review presented a qualitative analysis of the association between BP and cognitive impairment for non-stroke patients [55] and highlighted that people with hypertension tended to demonstrate a more pronounced decline in global cognitive functioning compared to normotensive individuals. This finding strengthens the evidence of our work. Hypertension has been shown to be a risk factor for cognitive decline in patients with or without stroke [55, 56]. For patients with stroke, a previous study published in 2009 performed a meta-analysis of predictors for pre- and post-stroke dementia, and an insignificant association was found between hypertension and PSCI [5], contradicting the findings of this meta-analysis. A recent meta-analysis published in 2022 supported that hypertension was a predictor of post-stroke dementia [57]. The main sources of discrepancy are methodological differences and heterogeneity of included studies. More rigorous designed studies are required to detect the predictive significance of hypertension in PSCI.
In addition, our work also found SBP or DBP was significantly associated with an
increase in PSCI, and this finding was similar to that of a previous
meta-analysis [18], which supported that mean SBP or DBP was a risk factor for
cognitive decline in patients without stroke. Furthermore, we found that both
SBP
The current meta-analysis exhibits various strengths and limitations that warrant acknowledgment. The strengths include the following: First, this was the first meta-analysis that provided evidence of hypertension, SBP, and DBP on PSCI, and a significant association was found between BP and PSCI. Second, we conducted subgroup analysis according to different cut-off values of BP and found that BP at different intervals had different predictive effects of PSCI. These findings provide more theoretical and practical significance for future research. Third, this meta-analysis was performed according to MOOSE report guidelines [16]. Systematic reviews of observational studies were considered to possess significant limitations and methodological intricacies attributed to the observational nature of the studies from which they are derived [59]. Therefore, the MOOSE checklist was selected for this meta-analysis to strengthen the evidence.
As a limitation: First of all, caution should be exercised in interpreting the results of this meta-analysis owing to the restricted number of studies included and its moderate to high statistical heterogeneity. This meta-analysis included different study designs, such as observational studies and secondary analyses from RCTs. Therefore, heterogeneity arising from different study designs tends to be unavoidable, which is similar to previous meta-analyses [56]. This meta-analysis used a random effect model to minimize potential heterogeneity. In addition, heterogeneity between studies (measurement methods and data reporting) is common in observational studies; precisely, if all original studies were from the same study without heterogeneity, the larger the overall estimated variance, the larger the sample size required. Generic inverse variance is a weighting method based on the variance of the effect, reflecting the estimated effect of a pooled sample. Therefore, according to previous studies [56, 60], we used a random-effects model with a generic inverse variance method of log (OR) to conduct a meta-analysis. Furthermore, different outcome measurement tools could explain measurement bias across studies, although these are global standardized tools to define PSCI [1]. Currently, there is no definite recommendation about the sensitivity of different tools measuring PSCI; thus, for future studies, we could include specific tools to measure PSCI to reduce measurement bias.
At first, we found a significant but not U-shaped relationship between BP and PSCI. Subsequent research is required to investigate the association between BP at different intervals and PSCI. Second, high BP impacts cerebral perfusion, inducing adaptive vascular alterations, and these changes render the brain susceptible, potentially predisposing it to the onset of cognitive impairment [61, 62]. However, the etiology of PSCI is complicated; more studies are needed to explore the mechanism of high BP on PSCI. Lastly, multiple co-variables take effect when performing a regression analysis of BP on PSCI, and previous studies reported that baseline cognitive function was also a significant predictor for PSCI [58]. However, few of the included studies adjusted baseline cognitive function; thus, future studies need to take more into account when exploring predictors of PSCI, and multi-level meta-regression analysis is needed in the future to present more important predictors of PSCI.
Through meta-analysis, a notable correlation was identified between hypertension, abnormal or normal BP, and PSCI. Therefore, in individuals who have previously experienced hypertension, the use of antihypertensive treatments can prevent PSCI. However, for non-hypertensive patients with abnormal or normal BP in the early stages post-stroke, the use of antihypertensive treatments may have little significance in preventing PSCI. Additionally, considering the predictive value of BP on PSCI, regular and long-term follow-ups for BP should be performed in patients following a stroke. Finally, the etiology of PSCI is individualized, meaning PSCI is not only affected by BP, therefore, clinicians should consider all important factors of patients in order to make correct decisions on treatment.
Hypertension, SBP, or DBP has predictive values for PSCI, and SBP
The datasets generated during and/or analyzed during the current study are available from the corresponding author on reasonable request.
HH and XC conceptualized and devised the research study. HH and YZ analyzed the data. LY and SL provided important intellectual contribution to the manuscript. All authors contributed to editorial changes in the manuscript. All authors read and approved the final manuscript. All authors have participated sufficiently in the work and agreed to be accountable for all aspects of the work.
Not applicable.
Not applicable.
This work was supported by the Key Science & Technologies R&D Program of Lishui City (No. 2022ZDYF22).
The authors declare no conflict of interest.
References
Publisher’s Note: IMR Press stays neutral with regard to jurisdictional claims in published maps and institutional affiliations.