


1 Department of Radiology, Fuwai Yunnan Cardiovascular Hospital, 650102 Kunming, Yunnan, China
2 Department of Cardiac Surgery, Fuwai Yunnan Cardiovascular Hospital, 650102 Kunming, Yunnan, China
3 Department of Vascular Surgery, Kunming Children’s Hospital, 650034 Kunming, Yunnan, China
4 Department of Ultrasound, Fuwai Yunnan Cardiovascular Hospital, 650102 Kunming, Yunnan, China
5 Department of Anesthesiology, Fuwai Yunnan Cardiovascular Hospital, 650102 Kunming, Yunnan, China
†These authors contributed equally.
Abstract
The relationship between cardiovascular outcomes and niacin consumption levels remains unclear. This study aimed to examine the correlation between niacin intake and the incidence of cardiovascular disease, as well as the mortality rates associated with cardiovascular disease and other causes.
From 2003 to 2018, we continually investigated updated information from the National Health and Nutrition Examination Survey. Based on the quartiles of niacin intake levels, four distinct categories of participants were established: Q1 (<14.646 mg), Q2 (14.646–21.302 mg), Q3 (21.302–30.401 mg), and Q4 (>30.401 mg). Baseline variable differences were assessed employing the Chi-Square and Student's t-tests. A weighted logistic regression with multiple variables was used to determine the association between niacin intake and cardiovascular disease prevalence. Hazard ratios (HRs) and 95% confidence intervals (CIs) for all-cause death and cardiovascular disease were determined utilising hazard regression models. Kaplan–Meier curves were used to compare survival probability between the high and low niacin intake groups, and dose-response linear relationships were evaluated with restricted cubic splines.
The cohort analysis included 80,312 participants for the assessment of niacin intake. Comparing the Q1 dataset to the Q4 dataset in the overall population, weighted Cox regression analysis showed a negative association with all-cause mortality (95% CI: 0.71–0.96, HR: 0.82) and mortality owing to cardiovascular disease (95% CI: 0.67–0.96, odds ratio (OR): 0.80). Sex-based subgroup analysis revealed a detrimental correlation between niacin use and overall mortality in females (Q4 cohort: 95% CI: 0.62–0.97, HR: 0.78) but not in males. Additionally, the Q3 (95% CI: 0.59–0.94, HR: 0.75) and Q4 (95% CI: 0.51–0.97, HR: 0.7) groups exhibited a negative association with female cardiovascular disease mortality compared to the Q1 group. Niacin intake was not significantly correlated with prevalence, all-cause mortality, or death from cardiovascular disease in males.
Higher niacin consumption was correlated with a decreased risk of cardiovascular disease and death from all causes across the entire study population. Nevertheless, only females, and not males, exhibited a beneficial effect on mortality.
Keywords
- niacin
- CVD
- all-cause
- prevalence
- mortality
- female
Niacin, or vitamin B3, is an essential nutrient obtained from dietary sources, such as meat, fish, cereals, and vegetables [1]. In gram quantities, niacin has been shown to positively affect lipid profiles, lowering triglycerides and low-density lipoprotein cholesterol (LDL-C) levels while raising high-density lipoprotein cholesterol (HDL-C) levels [2, 3, 4]. However, the change in HDL-C caused by niacin is logarithmic, whereas the change in LDL-C is linear [5]. Niacin lowers serum LDL-C through multiple mechanisms, such as inhibiting the peripheral mobilisation of free fatty acids [6], thereby reducing the substrates for the hepatic synthesis of triglycerides and very low-density lipoprotein (VLDL) particles [7], which, in turn, reduces the hepatic conversion of VLDL particles to LDL particles. Additionally, niacin directly interferes with the enzymatic processes that mediate the conversion of VLDL-C to LDL-C [7] and reduces triglyceride synthesis and hepatic lipoprotein secretion by inhibiting diacylglycerol acyltransferase 2 [8]. However, skin flushing is a typical adverse effect associated with niacin. The recommended daily dose for individuals is typically between 15 and 20 mg [9], with pharmacological dosages of up to 3000 mg/day being well-tolerated in treating dyslipidaemia [10].
Historically, the 1975 Coronary Drug Project first recognized niacin’s potential to reduce atherosclerotic cardiovascular events [11]. Next, several early investigations suggested that gram-level niacin therapy could impact cardiovascular risk in secondary prevention, particularly for individuals already affected by cardiovascular disease (CVD) [12]. However, the cardiovascular benefits of niacin therapy remain a subject of debate. The Framingham Heart Study also provided epidemiological support for niacin’s potential to influence CVD through lipid modification pathways, suggesting an inverse relationship between CVD incidence and HDL-C levels [13, 14]. However, the Heart Protection Investigation 2-Treatment of HDL for Reducing the Rate of Vascular Breaks (HPS2-Thrive) investigation, which involved 35,301 patients primarily in secondary prevention trials, was meta-analysed in 2014 and found that adding niacin to statin medication did not significantly alter the death rates from stroke, coronary heart disease, nonfatal myocardial infarct, or all causes [15, 16]. The inconsistent protective effects of niacin observed in existing studies may be attributed to the trial design. Furthermore, the extent to which niacin contributes to these benefits remains unclear. The Institute for Clinical Systems Improvement does not recommend the co-treatment of niacin and statins owing to an elevated risk of side effects without a corresponding decrease in cardiovascular outcomes [17]. However, in the United States, many patients continue to use niacin for other indications approved by the Food and Drug Administration [18].
However, data on the association between niacin levels and CVD mortality are limited. To address these research gaps, this study explored the potential relationship between niacin intake and the risk of all-cause and CVD mortality. This study aimed to provide dietary recommendations that may contribute to improved CVD management.
Participant information from the National Health and Nutrition Examination Survey (NHANES), a cross-sectional survey representing all non-institutionalised civilian populations in the United States, was used in this study. The National Centre for Health Statistics (NCHS), a branch of the Centre for Disease Control and Prevention branch, oversees the NHANES Life and Health Statistics Collection Project. A sophisticated multistage probability sampling strategy was used to ensure that the outcomes could be applied to other populations with an oversampling of older adults and members of underrepresented groups [19]. Fig. 1 illustrates the participant selection process followed in this study. NHANES data was collected from cycles 2003–2004 (n = 10,122), 2005–2006 (n = 10,348), 2007–2008 (n = 10,149), 2009–2010 (n = 10,537), 2011–2012 (n = 9756), 2013–2014 (n = 10,175), 2015–2016 (n = 9971), and 2017–2018 (n = 9254). After excluding records with missing niacin intake information, our primary analysis included 34,828 participants (Supplementary Table 1). The Ethics Review Board of NCHS granted ethical approval for including human subjects in NHANES. The subjects were informed about the study, and their consent was obtained.
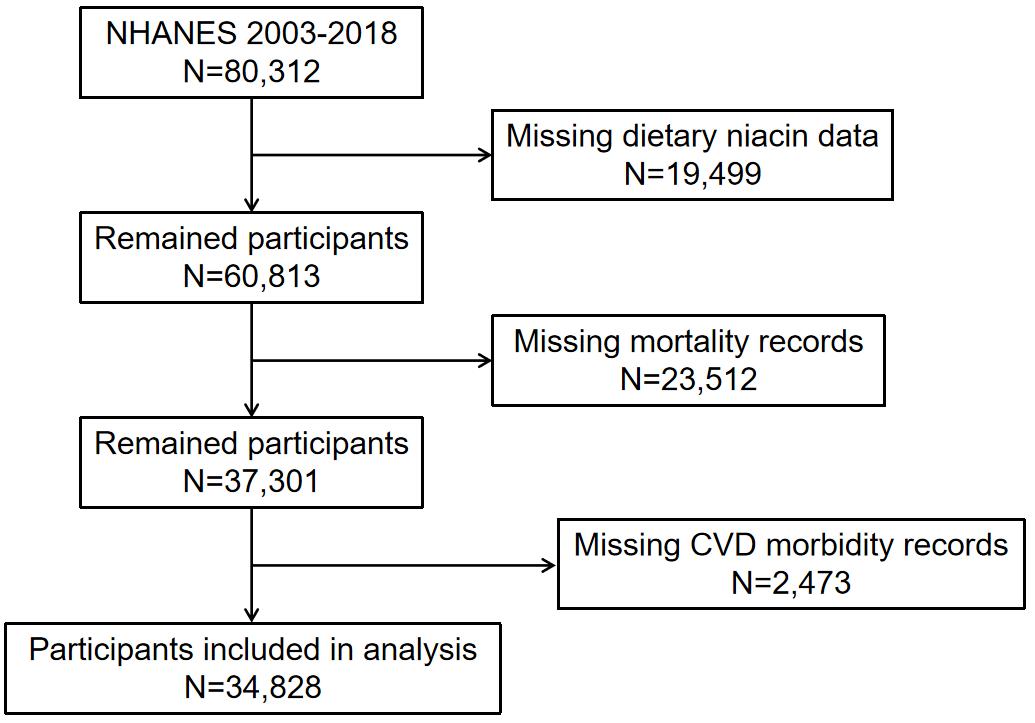 Fig. 1.
The flow chart of participant selection. NHANES, National Health and Nutrition Examination Survey; CVD, cardiovascular disease.
The What We Eat in America component of the NHANES study used 24-h food recall interviews to gauge individuals’ nutritional intake. A second phone interview was conducted 3–10 days after the first interview, which took place at the mobile examination centre. All participants were assessed for their ability to complete the dietary interviews. The Department of Agriculture clarified the intake of micronutrients, antioxidants, and total energy [20], while a questionnaire interview assessed dietary supplement intake in the past month, including frequency, dosage, and consumption duration. CVD was verified by self-reported clinician diagnoses obtained through individual interviews using an established medical condition questionnaire. This study focused on two significant outcomes: all-cause mortality, and CVD-related prevalence and mortality. NHANES data were probabilistically matched to National Death Index certificate records to evaluate mortality status, enabling the determination of participants’ vital status and analysis of mortality outcomes [21].
The NHANES collected data on several demographic and sociodemographic factors
using standardised questionnaires. These included age at participation, sex, race
(categorised as Non-Hispanic Black, Mexican American, Non-Hispanic White, Other
Hispanic, and Other Race), education level (defined as below the 9th grade,
grades 9th–11th, includes the 12th grade without a diploma, graduates of high
school, general educational development (GED) holders, or equivalent, associate degree, and bachelor’s degree or
higher), and marital status (divorced, never married, widowed, married,
separated, or surviving with a spouse). Body mass index (BMI), computed by
dividing weight (kg) by height squared (m2), is a health measure.
Hypertension was considered to be present if at least one of the following
conditions was met: diastolic blood pressure (DBP)
Statistical analyses followed NHANES guidelines [25], accounting for the complex
sampling design and sample size. Baseline and nutritional characteristics were
examined across quartiles of niacin intake level: Q1 (
The NHANES 2003–2018 sample initially included 80,312 participants. After
excluding participants with missing niacin data, the sample size was reduced to
60,813. Further exclusions of patients with missing mortality and CVD morbidity
records reduced the eligible sample size to 34,828 patients for analysis. Among
them, 16,557 were males, and 18,271 were females. Participants were stratified
into four categories based on the amount of niacin consumed each day: Q1
(
| Variable | Total (n = 34,828) | Q1 (n = 8666) | Q2 (n = 8824) | Q3 (n = 8704) | Q4 (n = 8634) | p-value | |
| Age (years) | 47.3 (46.9, 47.8) | 49.0 (48.4, 49.7) | 48.9 (48.3, 49.6) | 47.5 (46.9, 48.2) | 44.4 (43.8, 45.0) | ||
| Poverty income ratio | 3.0 (2.9, 3.1) | 2.7 (2.6, 2.8) | 3.0 (3.0, 3.1) | 3.1 (3.0, 3.1) | 3.2 (3.1, 3.3) | ||
| Body mass index (kg/m2) | 29.0 (28.8, 29.1) | 29.1 (28.9, 29.4) | 28.9 (28.6, 29.1) | 29.1 (28.8, 29.3) | 28.9 (28.6, 29.1) | 0.1738 | |
| Waist circumference (cm) | 99.0 (98.6, 99.4) | 98.4 (97.8, 99.0) | 98.4 (97.9, 99.0) | 99.4 (98.8, 100.0) | 99.6 (99.0, 100.2) | 0.005 | |
| Avg alcoholic drinks/day (12 Mos) | 3.3 (3.0, 3.6) | 3.8 (2.9, 4.8) | 3.1 (2.6, 3.6) | 3.1 (2.7, 3.5) | 3.3 (3.0, 3.5) | 0.5477 | |
| Gender | |||||||
| Female | 52.3 (51.6, 53.0) | 71.2 (69.8, 72.6) | 62.7 (61.3, 64.1) | 49.0 (47.5, 50.5) | 31.4 (30.2, 32.7) | ||
| Male | 47.7 (47.0, 48.4) | 28.8 (27.4, 30.2) | 37.3 (35.9, 38.7) | 51.0 (49.5, 52.5) | 68.6 (67.3, 69.8) | ||
| Race | |||||||
| Mexican American | 8.5 (7.3, 9.8) | 9.6 (8.1, 11.4) | 8.4 (7.2, 9.9) | 7.8 (6.6, 9.2) | 8.2 (7.0, 9.5) | ||
| Other Hispanic | 5.1 (4.3, 5.9) | 5.9 (4.9, 7.1) | 4.9 (4.1, 5.8) | 4.7 (4.0, 5.5) | 4.9 (4.1, 5.9) | ||
| Non-Hispanic White | 68.1 (65.6, 70.4) | 63.4 (60.4, 66.4) | 68.0 (65.2, 70.7) | 69.9 (67.2, 72.4) | 70.0 (67.6, 72.4) | ||
| Non-Hispanic Black | 11.3 (10.1, 12.7) | 14.4 (12.8, 16.2) | 11.1 (9.8, 12.6) | 10.6 (9.3, 12.1) | 9.8 (8.6, 11.2) | ||
| Other race | 7.1 (6.4, 7.8) | 6.6 (5.7, 7.6) | 7.6 (6.6, 8.7) | 7.0 (6.1, 8.1) | 7.1 (6.3, 8.0) | ||
| Education (years) | |||||||
| Less than 9th grade | 5.0 (4.5, 5.5) | 8.1 (7.2, 9.1) | 5.5 (4.8, 6.3) | 4.1 (3.6, 4.7) | 3.0 (2.6, 3.5) | ||
| 9–11th grade | 10.3 (9.6, 11.1) | 13.2 (12.1, 14.5) | 10.1 (9.0, 11.2) | 8.9 (7.9, 9.9) | 9.5 (8.7, 10.4) | ||
| High school grad/GED or equivalent | 23.6 (22.6, 24.5) | 24.8 (23.4, 26.4) | 23.2 (21.7, 24.7) | 24.4 (22.8, 26.0) | 22.2 (20.5, 23.9) | ||
| Some college or AA degree | 31.7 (30.7, 32.6) | 30.1 (28.5, 31.7) | 31.4 (29.7, 33.2) | 31.6 (30.0, 33.3) | 33.1 (31.8, 34.6) | ||
| College graduate or above | 29.4 (27.8, 31.1) | 23.7 (21.7, 25.9) | 29.8 (27.5, 32.2) | 31.0 (28.8, 33.2) | 32.2 (30.1, 34.3) | ||
| Missing | 0.0 (0.0, 0.1) | 0.0 (0.0, 0.1) | 0.0 (0.0, 0.1) | 0.1 (0.0, 0.2) | 0.0 (0.0, 0.1) | ||
| Marriage | |||||||
| Married | 55.5 (54.1, 56.8) | 50.3 (48.5, 52.1) | 57.9 (55.8, 59.9) | 57.4 (55.4, 59.4) | 55.6 (53.7, 57.5) | ||
| Widowed | 5.8 (5.4, 6.2) | 8.8 (8.1, 9.6) | 6.7 (6.1, 7.5) | 5.2 (4.6, 5.9) | 3.1 (2.7, 3.7) | ||
| Divorced | 10.2 (9.7, 10.7) | 11.6 (10.6, 12.7) | 9.6 (8.7, 10.6) | 9.9 (9.0, 10.9) | 9.8 (8.8, 10.9) | ||
| Separated | 2.3 (2.1, 2.5) | 2.9 (2.4, 3.4) | 2.3 (1.9, 2.7) | 2.0 (1.6, 2.4) | 2.1 (1.7, 2.6) | ||
| Never married | 18.4 (17.3, 19.6) | 18.5 (17.0, 20.1) | 16.2 (14.7, 17.9) | 17.7 (16.1, 19.4) | 20.9 (19.3, 22.6) | ||
| Living with partner | 7.8 (7.3, 8.4) | 7.8 (6.9, 8.8) | 7.3 (6.4, 8.3) | 7.7 (6.8, 8.7) | 8.3 (7.4, 9.3) | ||
| Missing | 0.0 (0.0, 0.1) | 0.0 (0.0, 0.1) | 0.0 (0.0, 0.0) | 0.0 (0.0, 0.1) | 0.1 (0.0, 0.2) | ||
| Smoking | |||||||
| Not at all | 24.9 (24.1, 25.8) | 22.9 (21.5, 24.4) | 24.1 (22.5, 25.8) | 25.5 (24.0, 27.1) | 26.6 (25.1, 28.2) | ||
| Some days | 3.7 (3.4, 4.0) | 3.5 (3.0, 4.1) | 2.9 (2.4, 3.5) | 3.5 (3.0, 4.1) | 4.7 (4.0, 5.4) | ||
| Every day | 16.4 (15.5, 17.3) | 19.8 (18.4, 21.4) | 15.3 (14.0, 16.7) | 15.2 (14.1, 16.5) | 15.7 (14.5, 17.0) | ||
| Missing | 55.0 (53.9, 56.1) | 53.7 (51.8, 55.6) | 57.7 (55.9, 59.4) | 55.8 (54.1, 57.4) | 53.0 (51.2, 54.8) | ||
| Hypertension | 0.0286 | ||||||
| No | 61.9 (60.9, 62.8) | 60.1 (58.3, 61.8) | 61.4 (59.8, 63.0) | 62.6 (60.9, 64.2) | 63.0 (61.4, 64.6) | ||
| Yes | 35.3 (34.4, 36.2) | 36.8 (35.1, 38.4) | 35.3 (33.8, 36.7) | 34.9 (33.3, 36.6) | 34.5 (33.0, 36.0) | ||
| Missing | 2.9 (2.5, 3.3) | 3.2 (2.7, 3.8) | 3.3 (2.6, 4.3) | 2.5 (2.1, 3.0) | 2.6 (2.1, 3.0) | ||
| Cardiovascular disease (CVD) | |||||||
| No | 91.2 (90.6, 91.7) | 89.1 (88.0, 90.1) | 90.6 (89.7, 91.3) | 90.9 (89.9, 91.7) | 93.6 (92.8, 94.3) | ||
| Yes | 8.8 (8.3, 9.4) | 10.9 (9.9, 12.0) | 9.4 (8.7, 10.3) | 9.1 (8.3, 10.1) | 6.4 (5.7, 7.2) | ||
| Diabetes | |||||||
| No | 88.8 (88.3, 89.4) | 87.2 (86.2, 88.2) | 87.8 (86.8, 88.7) | 89.3 (88.3, 90.2) | 90.6 (89.8, 91.4) | ||
| Yes | 9.3 (8.8, 9.8) | 10.6 (9.7, 11.6) | 10.2 (9.4, 11.2) | 9.1 (8.3, 10.0) | 7.5 (6.9, 8.2) | ||
| Borderline | 1.9 (1.7, 2.1) | 2.1 (1.7, 2.5) | 2.0 (1.5, 2.5) | 1.6 (1.3, 2.0) | 1.9 (1.5, 2.3) | ||
| Missing | 0.0 (0.0, 0.0) | 0.0 (0.0, 0.1) | 0.0 (0.0, 0.0) | 0.0 (0.0, 0.0) | 0.0 (0.0, 0.1) | ||
Data in the table: For continuous variables: survey-weighted mean (95% CI); For categorical variables: survey-weighted percentage (95% CI). Mos, months; GED, general educational development; AA, Associate of Arts; CI, confidence interval; Avg, average.
After adjusting for various factors, including race, socioeconomic status
(poverty-income ratio), education, marital status, diabetes, sex, smoking habits,
BMI, age, alcohol consumption, waist circumference, and hypertension, a
significant non-linear relationship emerged between niacin intake levels and the
prevalence of CVD in the entire population (p
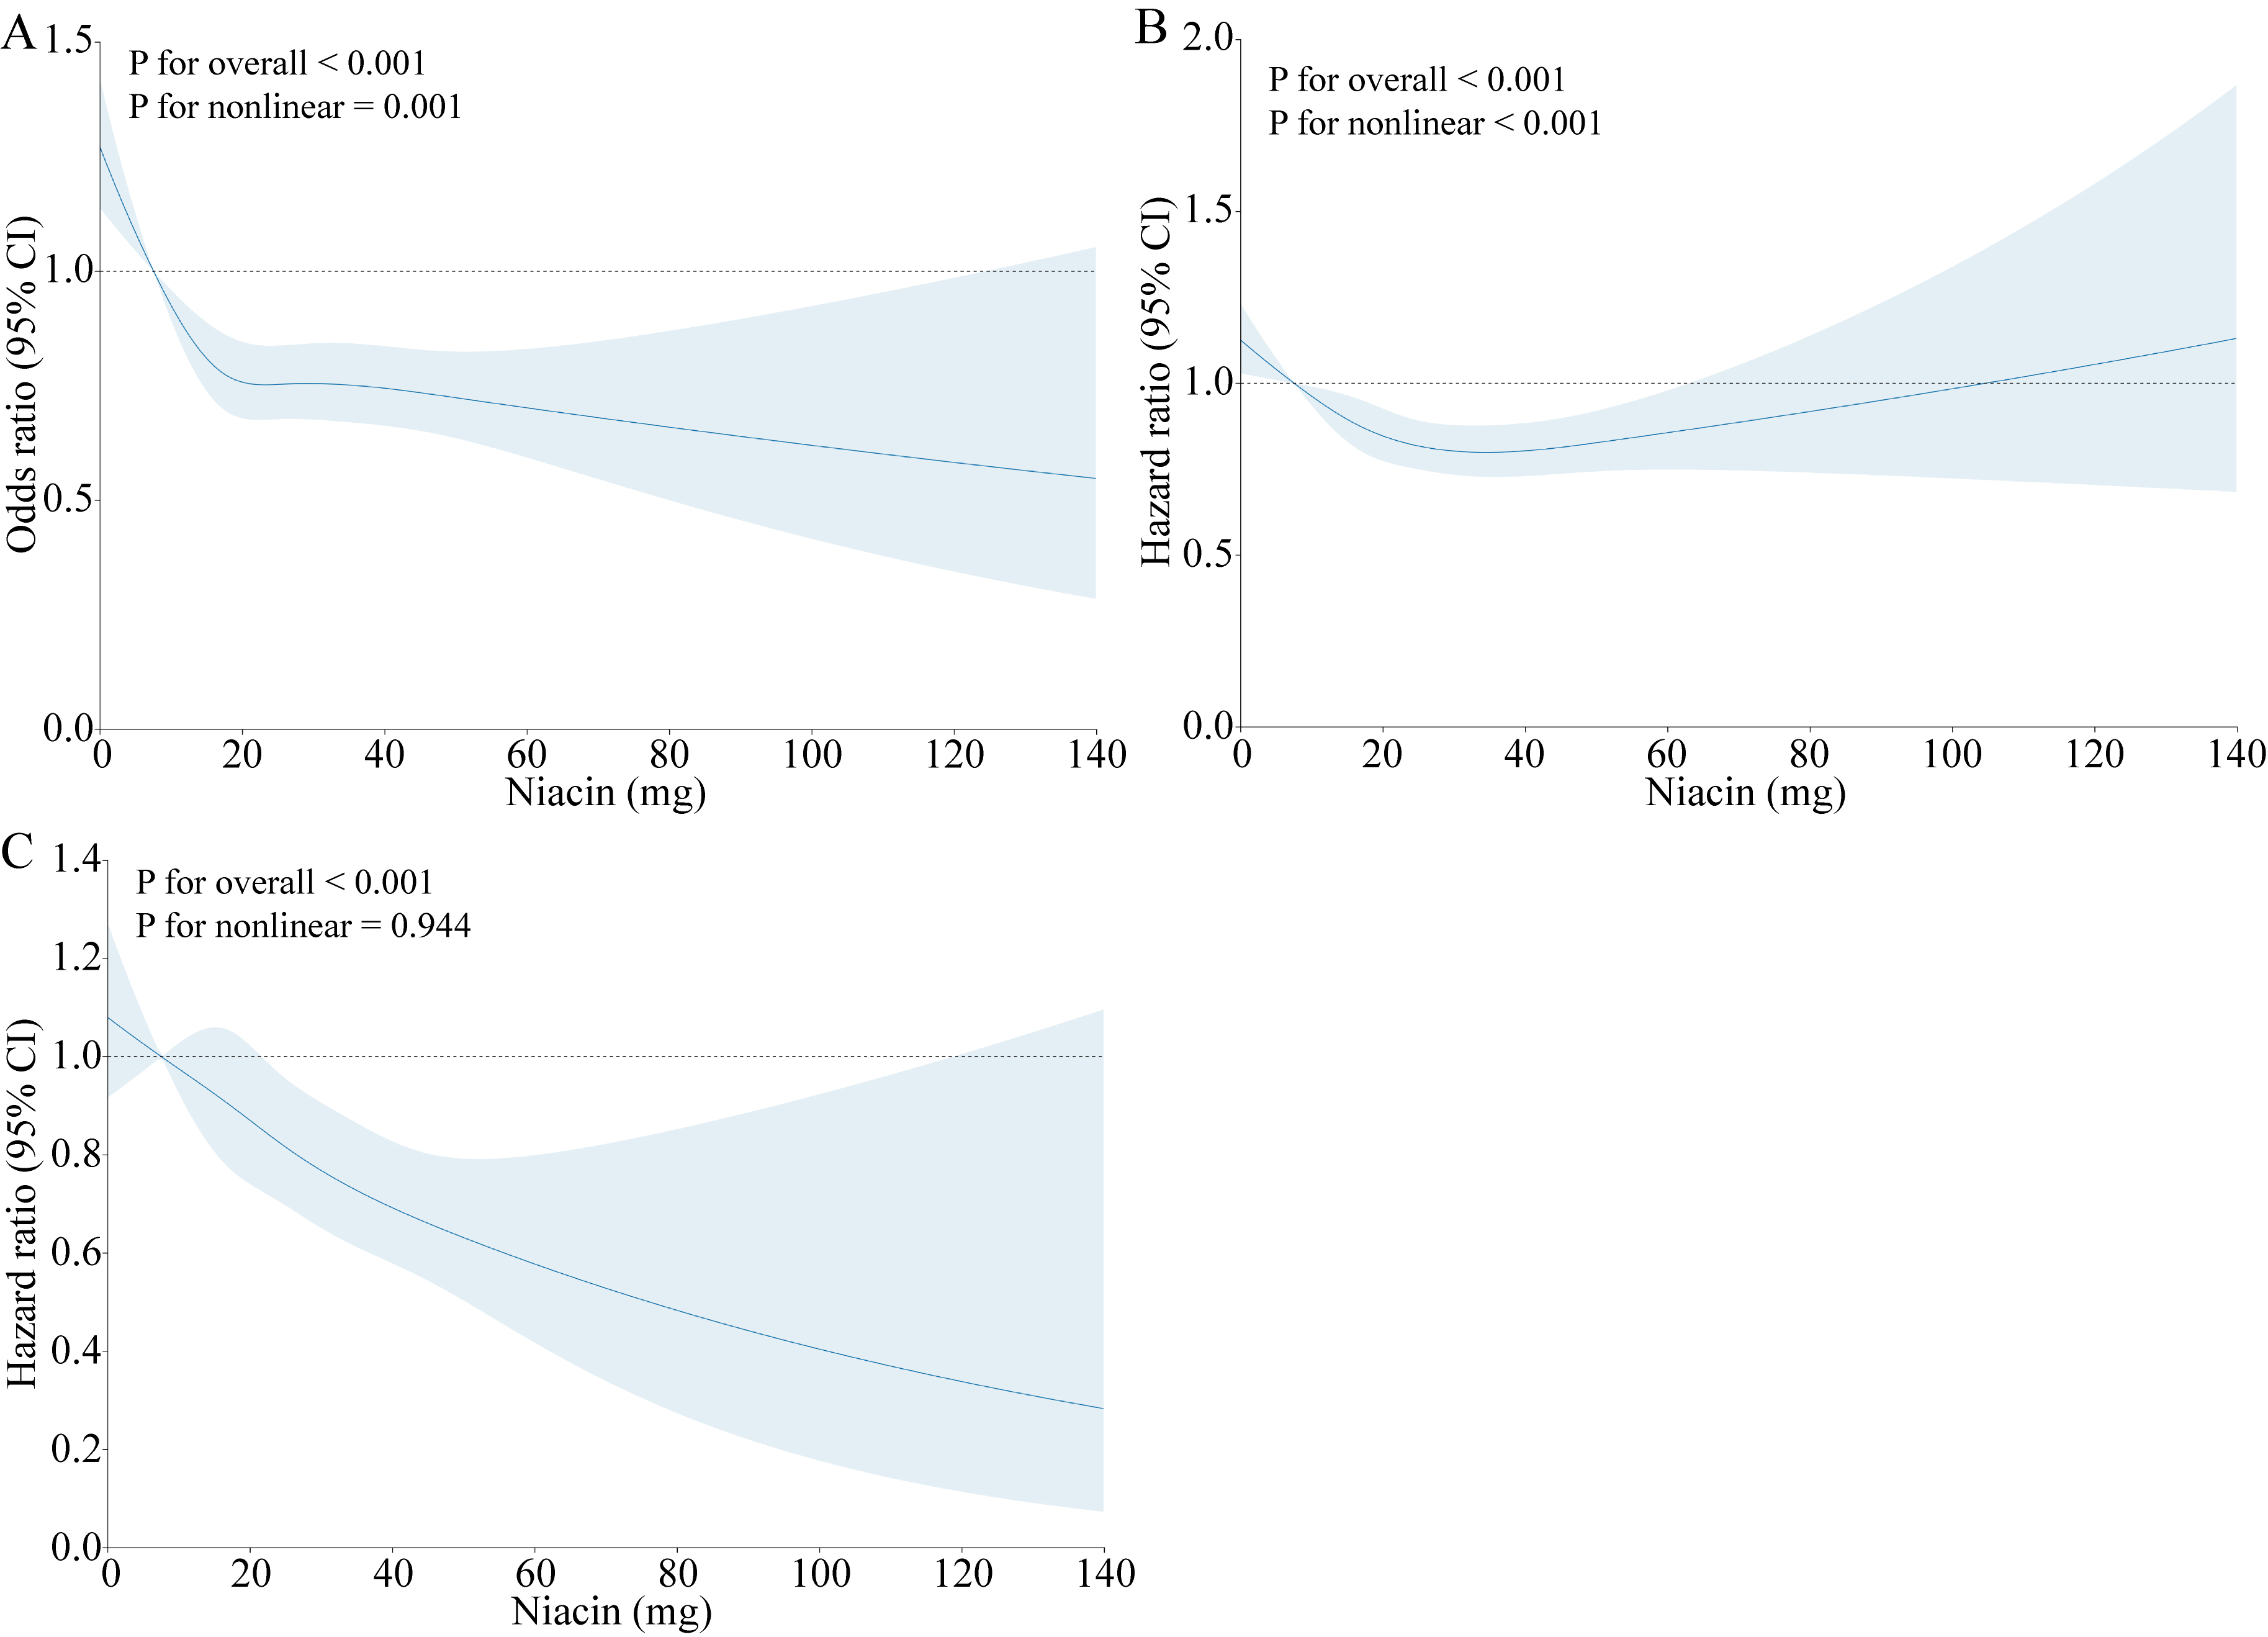 Fig. 2.
Dose–response relationship between the prevalence of CVD (A), all-cause mortality (B), CVD mortality (C), and dietary niacin intake. Adjusted for age, sex, race, education, poverty income ratio, marriage, diabetes, smoking, BMI, waist circumference, alcohol consumption, and hypertension. CVD, cardiovascular disease; BMI, body mass index; CI, confidence interval.
| Participates | Niacin classification | Model 1 | Model 2 | Model 3 | |||
| OR (95% CI) | p-value | OR (95% CI) | p-value | OR (95% CI) | p-value | ||
| Total | Q1 | 1 [Reference] | 1 [Reference] | 1 [Reference] | |||
| Q2 | 0.85 (0.75, 0.97) | 0.013 | 0.84 (0.73, 0.97) | 0.015 | 0.91 (0.80, 1.05) | 0.2 | |
| Q3 | 0.82 (0.72, 0.94) | 0.005 | 0.88 (0.76, 1.03) | 0.1 | 0.97 (0.82, 1.13) | 0.7 | |
| Q4 | 0.56 (0.48, 0.65) | 0.71 (0.59, 0.84) | 0.80 (0.67, 0.96) | 0.016 | |||
| Male | Q1 | 1 [Reference] | 1 [Reference] | 1 [Reference] | |||
| Q2 | 0.89 (0.73, 1.08) | 0.2 | 0.93 (0.74, 1.16) | 0.5 | 1 (0.81, 1.25) | ||
| Q3 | 0.74 (0.61, 0.91) | 0.003 | 0.92 (0.73, 1.16) | 0.5 | 1.01 (0.79, 1.28) | ||
| Q4 | 0.46 (0.38, 0.56) | 0.73 (0.58, 0.92) | 0.008 | 0.84 (0.67, 1.05) | 0.13 | ||
| Female | Q1 | 1 [Reference] | 1 [Reference] | 1 [Reference] | |||
| Q2 | 0.77 (0.65, 0.91) | 0.002 | 0.78 (0.66, 0.93) | 0.004 | 0.85 (0.73, 1.01) | 0.061 | |
| Q3 | 0.76 (0.63, 0.91) | 0.004 | 0.86 (0.70, 1.06) | 0.15 | 0.93 (0.76, 1.14) | 0.5 | |
| Q4 | 0.52 (0.40, 0.67) | 0.73 (0.55, 0.97) | 0.029 | 0.81 (0.61, 1.08) | 0.14 | ||
Model 1 was adjusted for none.
Model 2 was adjusted for age, sex, and race.
Model 3 was adjusted for age, sex, race, education, poverty-to-income ratio, marriage, diabetes, smoking, BMI, waist circumference, alcohol consumption, and hypertension.
OR, odds ratio; CI, confidence interval; BMI, body mass index.
For male and female, sex was not adjusted.
Significant differences in cardiovascular mortality were observed among the Q1,
Q2, Q3, and Q4 categories (Log-rank p
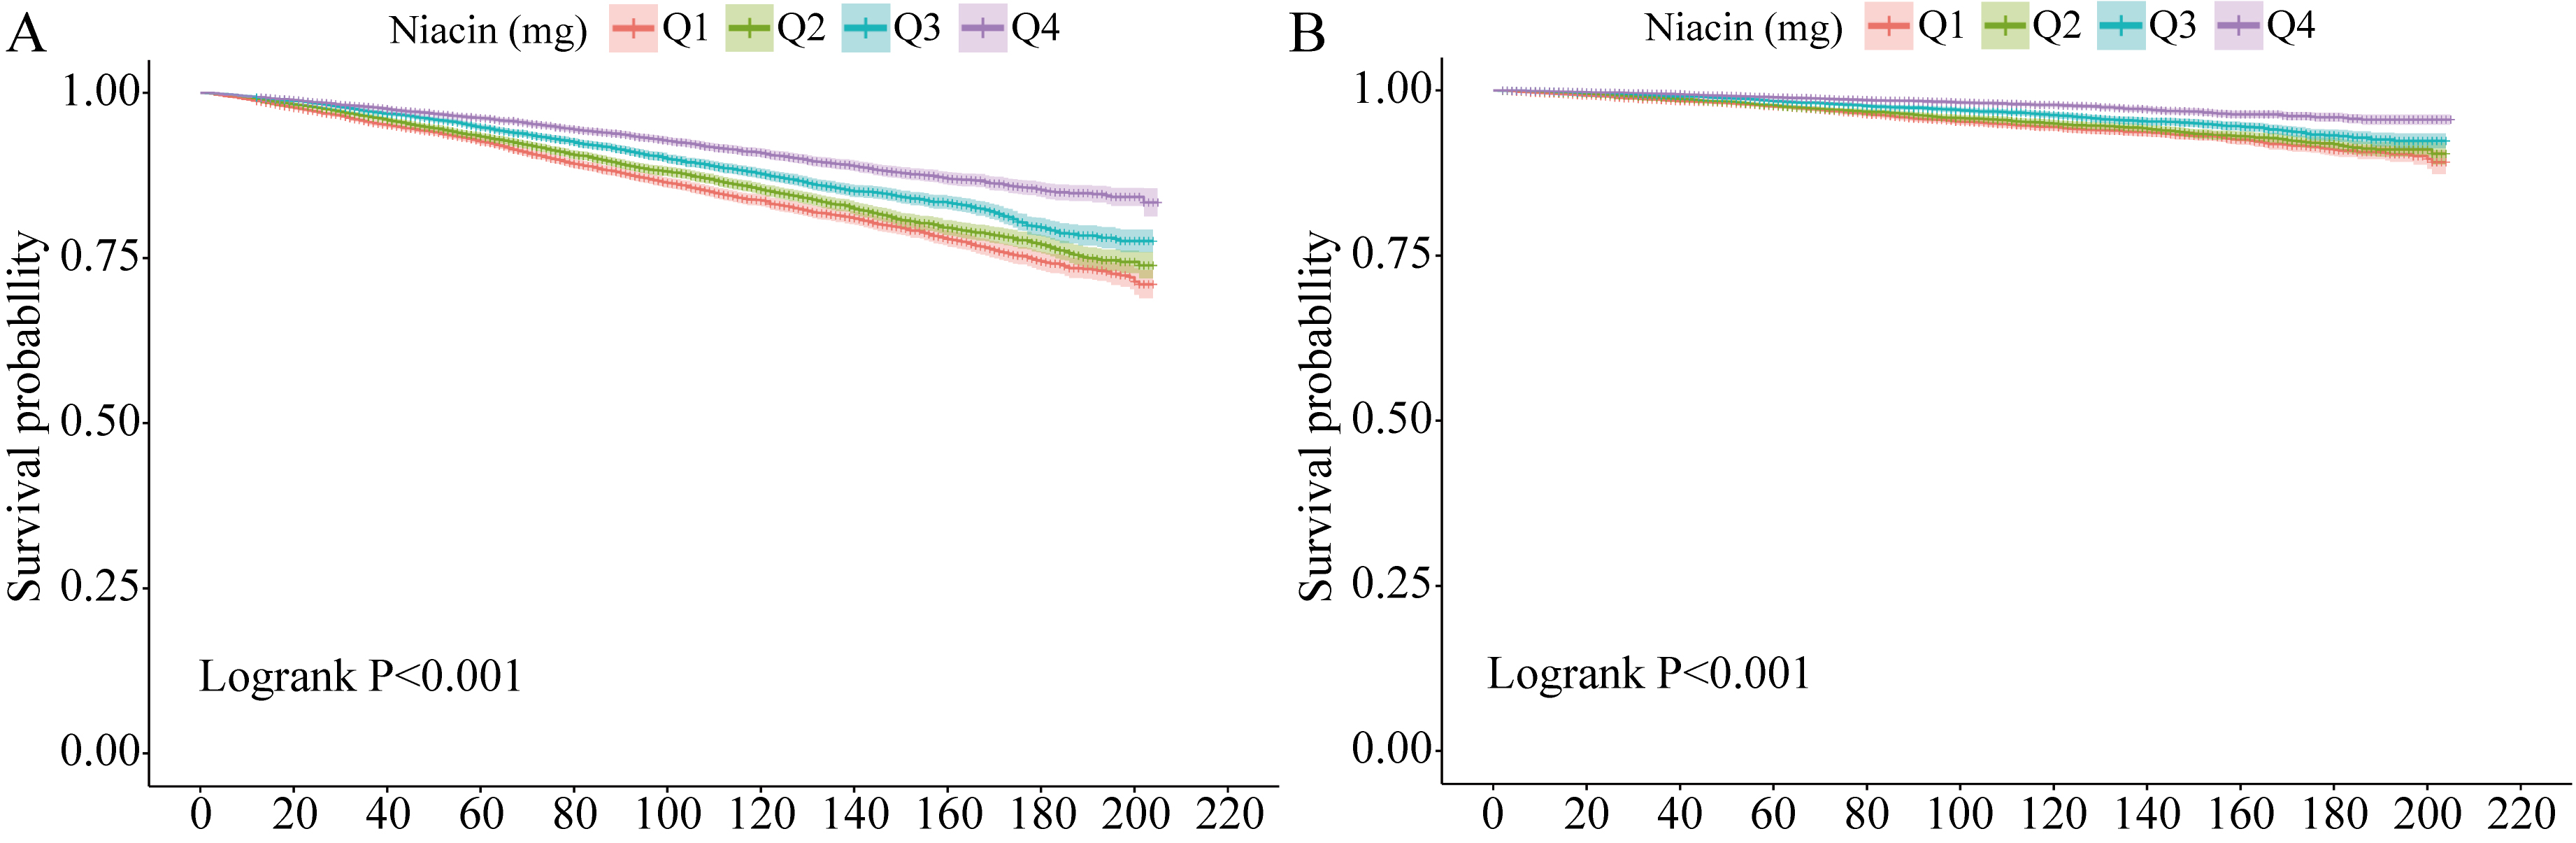 Fig. 3.
Kaplan–Meier survival curves for mortality outcomes. (A) for all-cause mortality, (B) for CVD mortality. CVD, cardiovascular disease.
| Participates | Niacin classification | Model 1 | Model 2 | Model 3 | |||
| HR (95% CI) | p-value | HR (95% CI) | p-value | HR (95% CI) | p-value | ||
| Total | Q1 | 1 [Reference] | 1 [Reference] | 1 [Reference] | |||
| Q2 | 0.85 (0.76, 0.96) | 0.01 | 0.83 (0.74, 0.93) | 0.002 | 0.91 (0.82, 1.02) | 0.12 | |
| Q3 | 0.8 (0.70, 0.92) | 0.002 | 0.85 (0.74, 0.98) | 0.023 | 0.96 (0.83, 1.10) | 0.5 | |
| Q4 | 0.52 (0.45, 0.60) | 0.71 (0.61, 0.83) | 0.82 (0.71, 0.96) | 0.012 | |||
| Male | Q1 | 1 [Reference] | 1 [Reference] | 1 [Reference] | |||
| Q2 | 0.78 (0.65, 0.94) | 0.008 | 0.83 (0.70, 0.99) | 0.039 | 0.92 (0.77, 1.10) | 0.4 | |
| Q3 | 0.68 (0.57, 0.82) | 0.86 (0.71, 1.04) | 0.12 | 0.99 (0.82, 1.21) | |||
| Q4 | 0.42 (0.34, 0.51) | 0.7 (0.57, 0.86) | 0.86 (0.69, 1.05) | 0.14 | |||
| Female | Q1 | 1 [Reference] | 1 [Reference] | 1 [Reference] | |||
| Q2 | 0.85 (0.71, 1.01) | 0.071 | 0.84 (0.72, 0.98) | 0.025 | 0.92 (0.78, 1.07) | 0.3 | |
| Q3 | 0.77 (0.64, 0.94) | 0.009 | 0.84 (0.70, 1.00) | 0.054 | 0.93 (0.78, 1.11) | 0.4 | |
| Q4 | 0.47 (0.37, 0.59) | 0.72 (0.57, 0.89) | 0.003 | 0.78 (0.62, 0.97) | 0.028 | ||
Model 1 was adjusted for none.
Model 2 was adjusted for age, sex, and race.
Model 3 was adjusted for age, sex, race, education, poverty-to-income ratio, marriage, diabetes, smoking, BMI, waist circumference, alcohol consumption, and hypertension.
HR, hazard ratio; CI, confidence interval; BMI, body mass index.
For male and female, sex was not adjusted.
Fig. 3B shows the Kaplan–Meier survival curve, revealing significant
differences in survival time among participants with varying niacin intake levels
(log-rank test, p
| Participates | Niacin classification | Model 1 | Model 2 | Model 3 | |||
| HR (95% CI) | p-value | HR (95% CI) | p-value | HR (95% CI) | p-value | ||
| Total | Q1 | 1 [Reference] | 1 [Reference] | 1 [Reference] | |||
| Q2 | 0.92 (0.74, 1.15) | 0.5 | 0.91 (0.74, 1.13) | 0.4 | 0.99 (0.79, 1.23) | ||
| Q3 | 0.78 (0.63, 0.96) | 0.022 | 0.87 (0.70, 1.07) | 0.2 | 0.97 (0.78, 1.20) | 0.7 | |
| Q4 | 0.48 (0.37, 0.63) | 0.74 (0.57, 0.97) | 0.029 | 0.87 (0.67, 1.13) | 0.3 | ||
| Male | Q1 | 1 [Reference] | 1 [Reference] | 1 [Reference] | |||
| Q2 | 0.91 (0.67, 1.24) | 0.6 | 0.97 (0.71, 1.33) | 0.9 | 1.09 (0.78, 1.52) | 0.6 | |
| Q3 | 0.76 (0.56, 1.02) | 0.063 | 0.99 (0.72, 1.36) | 1.16 (0.84, 1.61) | 0.4 | ||
| Q4 | 0.42 (0.31, 0.58) | 0.78 (0.56, 1.08) | 0.14 | 0.98 (0.69, 1.37) | 0.9 | ||
| Female | Q1 | 1 [Reference] | 1 [Reference] | 1 [Reference] | |||
| Q2 | 0.81 (0.68, 0.98) | 0.033 | 0.87 (0.72, 1.05) | 0.2 | 0.92 (0.76, 1.11) | 0.4 | |
| Q3 | 0.56 (0.45, 0.70) | 0.7 (0.56, 0.88) | 0.002 | 0.75 (0.59, 0.94) | 0.012 | ||
| Q4 | 0.35 (0.25, 0.48) | 0.67 (0.48, 0.92) | 0.013 | 0.70 (0.51, 0.97) | 0.032 | ||
Model 1 was adjusted for none.
Model 2 was adjusted for age, sex, and race.
Model 3 was adjusted for age, sex, race, education, poverty-to-income ratio, marriage, diabetes, smoking, BMI, waist circumference, alcohol consumption, and hypertension.
HR, hazard ratio; CI, confidence interval; CVD, cardiovascular disease; BMI, body mass index.
For male and female, sex was not adjusted.
Our study revealed favorable associations between niacin and cardiovascular
events using data from the NHANES 2003–2018. We identified a negative
correlation between the population’s prevalence of CVD and niacin levels, which
persisted after adjusting for covariates, suggesting niacin’s protective role
against CVD development. The cardiovascular protective effect may stem from
niacin’s ability to decrease LDL-C and triglycerides and improve lipoprotein
function [26]. A meta-analysis published in 2006, encompassing 23 studies,
indicated that for every 1% decrease in LDL-C, the incidence of CVD events
decreased by nearly 1%, and for every 1% increase in HDL-C, the incidence of
CVD events decreased by at least 1%, irrespective of LDL-C reduction [27].
Dose–response analysis revealed a statistically significant and nonlinear trend,
with a sharp decline in the ORs at lower doses and a plateau at higher doses.
While sex-based differences in CVD incidence were not substantial, a discernible,
though statistically non-significant, trend towards reduced CVD prevalence with
niacin therapy was observed. While research on the link between niacin and CVD is
ongoing, interest in using dietary niacin as an intervention is growing. The
Landmark Coronary Drug Project (1966–1975) explored the long-term reliability
and effectiveness of niacin and other lipid-altering drugs [28, 29]. Although it
showed modest benefits in reducing nonfatal heart attacks, the lack of impact on
overall mortality led to the trial being considered neutral and overlooked [28].
In a placebo-controlled study involving 1119 male patients administered 2000 mg
of niacin daily and 2789 taking a placebo, the niacin group showed a 26% lower
rate of nonfatal heart attacks and a 24% decrease in strokes (p
In a 2011 randomised controlled trial (RCT), 3414 patients diagnosed with coronary heart disease who underwent simvastatin treatment were randomly allocated to either the niacin or placebo group [33]. The participants received simvastatin at doses ranging from 40 to 80 mg, with or without ezetimibe at 10 mg/d, to attain LDL-C levels between 40 and 80 mg/dL. After a 3-year follow-up, no significant advantage was observed in the primary endpoint of composite CVD (95% CI: 0.87–1.21, HR: 1.02; p = 0.79). However, the niacin cohort exhibited a notable elevation in median HDL-C levels compared to those of the placebo group and reductions in triglyceride and LDL-C levels compared to those at baseline. Furthermore, a random-effects meta-analysis of 23 RCTs indicated that niacin did not significantly affect mortality but was associated with adverse outcomes. These included the frequency of nonfatal or fatal infarctions of the heart, cardiovascular or non-cardiovascular death, and the frequency of nonfatal or fatal strokes [26]. A recent study reported that niacin did not negatively affect cardiovascular outcomes during secondary prevention [34]. Moreover, in individuals not taking statin medication, niacin monotherapy was associated with a lower risk of cardiovascular events (relative risk: 0.51, 95% CI: 0.37–0.72; proportional risk: 0.74, 95% CI: 0.58–0.96; stroke: relative risk: 0.74, 95% CI: 0.59–0.94; acute coronary syndrome: and revascularization) [34]. This study did not demonstrate a link between niacin intake and a decreased risk of cardiovascular morbidity or death. However, the sex-stratified analysis revealed a positive association between niacin intake and both CVD and all-cause mortality. Interestingly, females appeared to benefit from higher niacin intake levels, as evidenced by a lack of marked variability in CVD and all-cause mortality compared to males. Further studies are necessary to understand the root cause of this disparity in the impact of niacin consumption based on sex.
Clinical trials have identified various adverse effects associated with niacin, ranging from common symptoms, such as skin flushing and itching, to more severe conditions, such as heart failure, musculoskeletal and gastrointestinal issues, diabetic complications, and new-onset diabetes [30]. Despite these side effects, niacin remains the most potent agent currently available for enhancing HDL levels, exhibiting the ability to increase HDL levels by as much as 30–35%, even in individuals with extremely low HDL levels [35]. Surjana et al. [36] demonstrated the role of niacin in inhibiting carcinogenesis and DNA damage in various cancers, including oral, colon, breast, and lung cancers. Recent clinical research has revealed a correlation between niacin consumption and a lower risk of developing squamous cell carcinoma [37]. These findings hold significance for clinicians for several reasons. Firstly, statin-treated patients often face a residual risk of CVD. Secondly, evidence suggests that improving prognosis beyond lowering LDL-C levels may be beneficial. Furthermore, niacin could be an appealing alternative for an estimated 10% of patients who cannot tolerate or have contraindications to statin therapy [38]. Thirdly, research suggests females may benefit more than males from higher niacin intake levels in reducing CVD mortality. The present study had several limitations. Firstly, potential errors and inaccuracies in diet assessments could introduce uncertainty. Secondly, the presence of residual confounding factors is inherent in observational studies. Although adjustments have been made to various covariates to minimise this issue, complete elimination remains challenging. Thirdly, the self-reported 24-h recalls used to collect dietary data might be susceptible to recall bias. While this method is widely employed by trained interviewers [39, 40], it is essential to acknowledge this limitation. Finally, the scarcity of comprehensive CVD data, particularly regarding mortality data, owing to the relatively small number of deaths is recognised. Large-scale investigations such as clinical studies can provide substantial evidence of the relationship under investigation.
Increased dietary niacin intake is associated with CVD incidence but does not show a substantial correlation with all-cause mortality in the overall population. However, it is noteworthy that an intake of 30.401 mg/d of niacin lowers the risk of all-cause death in females. In addition, a higher niacin intake of 21.302 mg/d or more appears to have a protective effect against CVD mortality, specifically in females, but with no such observed impact in males. Overall, increasing niacin supplementation may help reduce cardiovascular risk in high-risk female patients. However, further prospective studies are required to clarify whether increased niacin intake reduces the risk of CVD mortality in females.
All data generated or analyzed during this study are included in this published article.
Conceptualization, LS, YS and AZ; Analyzed the data, ML, SJ, JZ, KY, YZ, EY, XZ and LS; Statistical analysis and drafting of the manuscript, LS, YZ, JZ, KY and YC; Writing—review and editing, ML, SJ, EY, XZ, AZ and YS. All authors read and approved the final manuscript. All authors have participated sufficiently in the work and agreed to be accountable for all aspects of the work.
Not applicable.
Not applicable.
The current study was supported by the Yunnan Fundamental Research Projects (grant no. 202301AY070001-028).
The authors declare no conflict of interest.
Supplementary material associated with this article can be found, in the online version, at https://doi.org/10.31083/j.rcm2511410.
References
Publisher’s Note: IMR Press stays neutral with regard to jurisdictional claims in published maps and institutional affiliations.