


 , Selma Kenar Tiryakioğlu 2, Alparslan Ersoy 3,4, Nur Özer Şensoy 1, Ömer Furkan Demir 5, Mustafa Cagatay Buyukuysal 6
1 Department of Nephrology, University of Health Sciences, Bursa City Training and Research Hospital, 16140 Bursa, Turkey
2 Department of Cardiology, University of Health Sciences, Bursa City Training and Research Hospital, 16140 Bursa, Turkey
3 Department of Nephrology, Bursa Uludag University Faculty of Medicine, 16285 Bursa, Turkey
4 Department of Internal Medicine, Bursa Uludag University Faculty of Medicine, 16285 Bursa, Turkey
5 Department of Cardiology, Bursa Yuksek Ihtisas Training and Research Hospital, 16140 Bursa, Turkey
6 Department of Biostatistics, Zonguldak Bulent Ecevit University School of Medicine, 67100 Zonguldak, Turkey
Abstract
Hemodialysis (HD) and continuous ambulatory peritoneal dialysis (CAPD) affect left ventricular hemodynamics. This study compared the effect of two treatment modalities, CAPD and HD, on left ventricular systolic and diastolic functions in maintenance dialysis patients.
A total of 47 patients (24 CAPD and 23 HD) undergoing long-term dialysis were included in the study. Left ventricular functions, left ventricular hypertrophy, and left ventricular geometry were evaluated using echocardiography.
The mean age of the patients was 58.6 ± 11.2 years. The mean dialysis time was 125.1 ± 35.2 months. When echocardiographic parameters were examined, left ventricular muscle mass, mass index, E/e’ ratios, and global longitudinal strain were significantly higher in the CAPD group. The rates of diastolic dysfunction (66.7% vs. 26.1%) and left ventricular hypertrophy (91.7% vs. 60.9%) were higher in the CAPD group than in the HD group. Dialysis modality CAPD, abnormal global longitudinal strain (GLS), and increased serum calcium were associated with an increased risk of diastolic dysfunction.
The study results demonstrated that left ventricle (LV) diastolic dysfunction and deterioration in left ventricular geometry were significantly higher in patients receiving long-term CAPD treatment than for long-term HD treatment.
Keywords
- chronic kidney failure
- hemodialysis
- peritoneal dialysis
- left ventricular hypertrophy
- diastolic dysfunction
- echocardiography
Deaths resulting from cardiovascular diseases (CVDs) are considered a significant issue among patients with end-stage kidney disease (ESKD) [1]. Patients with ESKD experience cerebrovascular disease mortality rates that are 20 times greater than those in the general population. Additionally, data from a U.S. database of individuals with kidney failure revealed that cardiovascular diseases account for roughly 39% of deaths among dialysis patients [1, 2]. Left ventricular hypertrophy (LVH), which is not uncommon in patients with chronic kidney disease (CKD), is noted as one of the risk factors for cardiovascular disease and death [2]. Along with LVH, there are also changes in cardiac structure and function, which are shown to be prognostic factors in ESKD patients receiving hemodialysis (HD) treatment [3]. Cardiac abnormalities in these patients may develop secondary to multiple factors, including chronic volume and pressure overload, anemia, uremia, high-flow arteriovenous shunts, abnormal calcium and phosphate metabolism, and hyperparathyroidism [4].
LVH is the most common cardiovascular abnormality in patients with CKD [5]. The prevalence of LVH in non-dialysis-dependent CKD patients is around 47%. In comparison, the prevalence of LVH among patients treated with HD or continuous ambulatory peritoneal dialysis (CAPD) is reported to be approximately 75% [6]. When patients who developed LVH were examined, continuing dialysis treatment or the type of dialysis continued did not cause LVH to regress significantly [7].
Although adverse effects of chronic dialysis treatments on left ventricular geometry had be shown, the results of short- and multiple-year cross-sectional studies comparing HD and CAPD treatments on the left ventricle functions were controversial [8]. Hence, we sought to compare the association of dialysis treatment on left ventricular systolic and diastolic functions and left ventricular geometry in HD and CAPD patients.
This prospective, observational, and cohort study included patients receiving dialysis treatment for at least 7 years in a tertiary care center between June 2020 and January 2023. Exclusion criteria for this study included: (i) a dialysis duration less than 7 years, (ii) previously diagnosed coronary artery disease, (iii) rhythm and conduction abnormalities, (iv) heart valve diseases, (v) thyroid dysfunction, (vi) chronic obstructive pulmonary disease, (vii) rheumatic diseases, (viii) previously diagnosed heart failure, (ix) active malignancy or active infection, (x) switching between dialysis methods, (xi) patients with missing data, and (xii) patients lost during the follow-up. The inclusion criteria for this study were defined as (i) having received dialysis treatment for more than 7 years and (ii) being suitable for detailed examination of echocardiographic images.
After patients were excluded according to the existing criteria, the study continued with 47 patients. In total, 23 of these patients received HD, and 24 received CAPD treatment. A flowchart of the patients included in the study is shown in Fig. 1. Patients were followed for an average of 6 months after echocardiographic evaluation. The secondary aim of this study was to determine the frequency of deaths and hospitalization during the 6-month follow-up period.
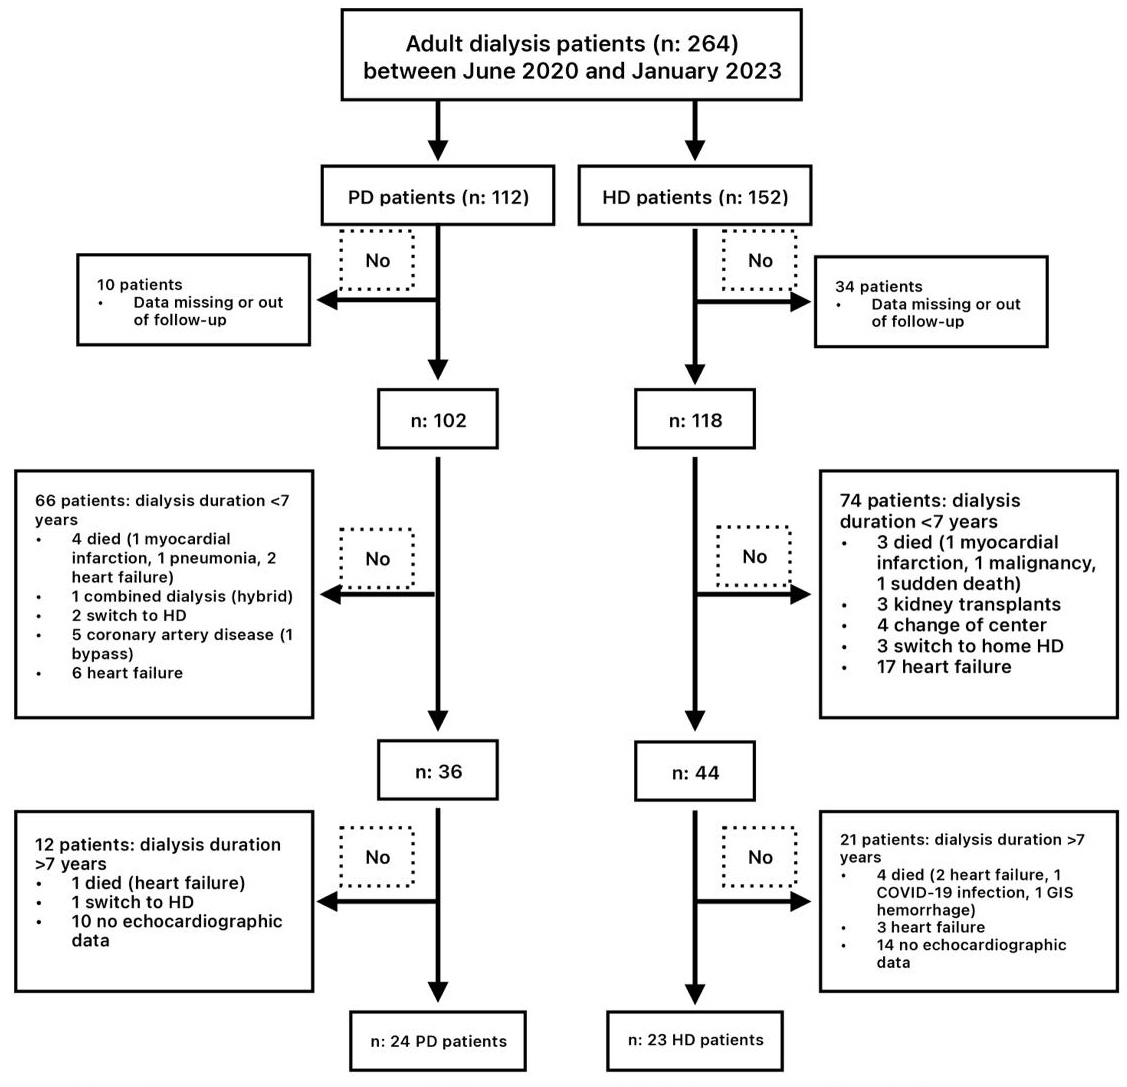 Fig. 1.
Flowchart of the study. Abbrevations: COVID-19, corona virus disease 2019; GIS, gastrointestinal system; HD hemodialysis; PD, peritoneal dialysis.
Patients included in the study were questioned clinically for heart failure symptoms. The clinical condition, medical history, physical examinations, and imaging tests (electrocardiyography, chest X-ray) of each patient were examined for signs of heart failure. According to the universal heart failure definition, heart failure is a clinical syndrome characterized by symptoms and/or signs arising from structural or functional cardiac abnormalities and/or objective evidence of pulmonary or systemic congestion [9].
Body mass index (BMI (kg/m2) = body weight (kg)/height (m2)) and
body surface area (BSA (m2) =
Dialysis vascular access was with a permanent dialysis catheter in 1 patient and
an arteriovenous fistula (AVF) in 22 patients. Only 1 of the 22 HD patients had
the AVF in a brachiocephalic location. All HD patients received standard
bicarbonate (in mmol/L; bicarbonate: 32, acetate: 3, Na+: 140, K+: 2, ionized
Ca++: 1.5, Mg++: 0.5, chloride: 111) dialysis treatment was performed thrice
weekly using high-flux dialyzers (FX 80, ultrafiltration coefficient 59 mL/h
Except for the two patients who underwent automated peritoneal dialysis (APD), all CAPD patients received manual exchanges four times daily. Seven patients used Dianeal® (Baxter, Baxter,Unterschleißheim, Germany) peritoneal dialysis solution, and 16 used Stay-Safe Balance® (Fresenius, Fresenius, Bad Homburg v.d. Höhe, Germany) solution. A standard peritoneal equilibration test was used to evaluate the transport characteristics of the peritoneal membrane. Standard fluid and dietary restrictions (1.2 g/kg/day protein, 50 mmol sodium, restricted potassium, and phosphate) were applied to all patients.
Anuria was defined by a urine output of under 100 mL per day. Residual renal function was not estimated if the 24-hour urine output was below 100 mL. Dialysis adequacy was traditionally assessed using the urea reduction ratio (URR) and Kt/Vurea, where K represents urea clearance, t signifies dialysis duration, and V denotes the volume of distribution in patients, based on pre- and post-dialysis concentrations. The following formulas were used to measure Kt/V and URR [11]:
- Daugirdas formula: Kt/Vsp = –ln (R – 0.008 - URR: pre-dialysis urea – post-dialysis urea/pre-dialysis urea
Kt/Vurea in CAPD was calculated using the following equation [12]:
- Kt = (Durea/Purea)
‘V’ represents the volume of distribution of urea, equivalent to total body
water (TBW). Watson’s equation was used to calculate ‘V’ when determining
Kt/Vurea for adults whose weight was at or near their dry weight. The equation
for males was TBW = 2.447 – (0.09156
Two experienced cardiologists, blinded to the clinical characteristics of the patients, performed the echocardiographic measurements (resting two-dimensional (2D), M-mode, Doppler, and tissue Doppler imaging (TDI)) using the Phillips EpiQ7 device (Andover, MA, USA) and a variable-frequency phased array transducer (2.5–3.5–4.0 MHz). To exclude cardiac effects due to volume load, parasternal long-axis, short-axis, four-chamber, two-chamber, and three-chamber apical images were obtained in the left lateral decubitus position while the dialysis patients were at their dry weight (2 hours after the HD session or CAPD change), and stored digitally (in DICOM format) for offline analysis. All recordings and measurements were averaged over three cardiac cycles, following the echocardiography practice standards. All patients presented a sinus rhythm, and those with atrial fibrillation were excluded from the study.
Left atrium (LA) diameter, end-diastolic interventricular septum (IVSd), end-diastolic posterior wall (PWd), and left ventricle end-diastolic (LVDd) and end-systolic (LVDs) diameters were recorded. Left ventricular mass and left ventricular mass index (LVMI) were calculated using the formulas recommended by the American Society of Echocardiography and indexed to BSA as follows [13]:
- left ventricular mass = 0.8 - LVMI = left ventricular mass/BSA
LVH was defined as an increased LVMI greater than 95 g/m2 in women and an
increased LVMI greater than 115 g/m2 in men. LVH categories were divided
into four for male and female patients, respectively, according to sex-specific
cutoffs, as recommended: no LVH (
The left ventricular ejection fraction (LVEF) was calculated using the modified Simpson’s rule method [17]. Echocardiographic maximum left atrial volume was measured using the biplane area–length method from the apical four-chamber and two-chamber views at end-systole and was indexed to BSA (left atrial volume index, LAVI) [18]. Pulsed-wave Doppler was used to record the blood flow velocities at the transmitral inflow. The peak early (E) and late (A) filling velocities were recorded below the basal mitral annulus from the apical four-chamber views. The e’ and a’ waves were calculated using the basal septal and lateral segments in the left ventricle. Tissue Doppler velocities were measured from the apical four-chamber view at the mitral annulus septal and lateral basal segments. Signals were acquired over three end-expiratory cycles, and the average values were calculated for the early diastolic e’ velocities and systolic velocities. The E/e’ ratio was determined using the average e’ value from both sides of the mitral valve. Speckle tracking analyses were conducted using the device’s software program. Apical four-chamber, two-chamber, and three-chamber views were obtained. The left ventricle border was drawn automatically with the software program on the device; a manual correction was performed if required. Segments with unsatisfactory images were excluded from the evaluation. The global longitudinal strain (GLS) was determined by averaging the peak systolic strain values from 18 segments. As a result of processing the apical images, a 17-segment bull’s eye image was created. The device automatically measured left ventricular GLS values [19]. The longitudinal strain was found by dividing the shortening of the marked interval in systole by its original length, which was expressed as a percentage. The negative values indicated the shortening percentage (normal ranges: –15.9% to –22.1%) (Fig. 2) [19].
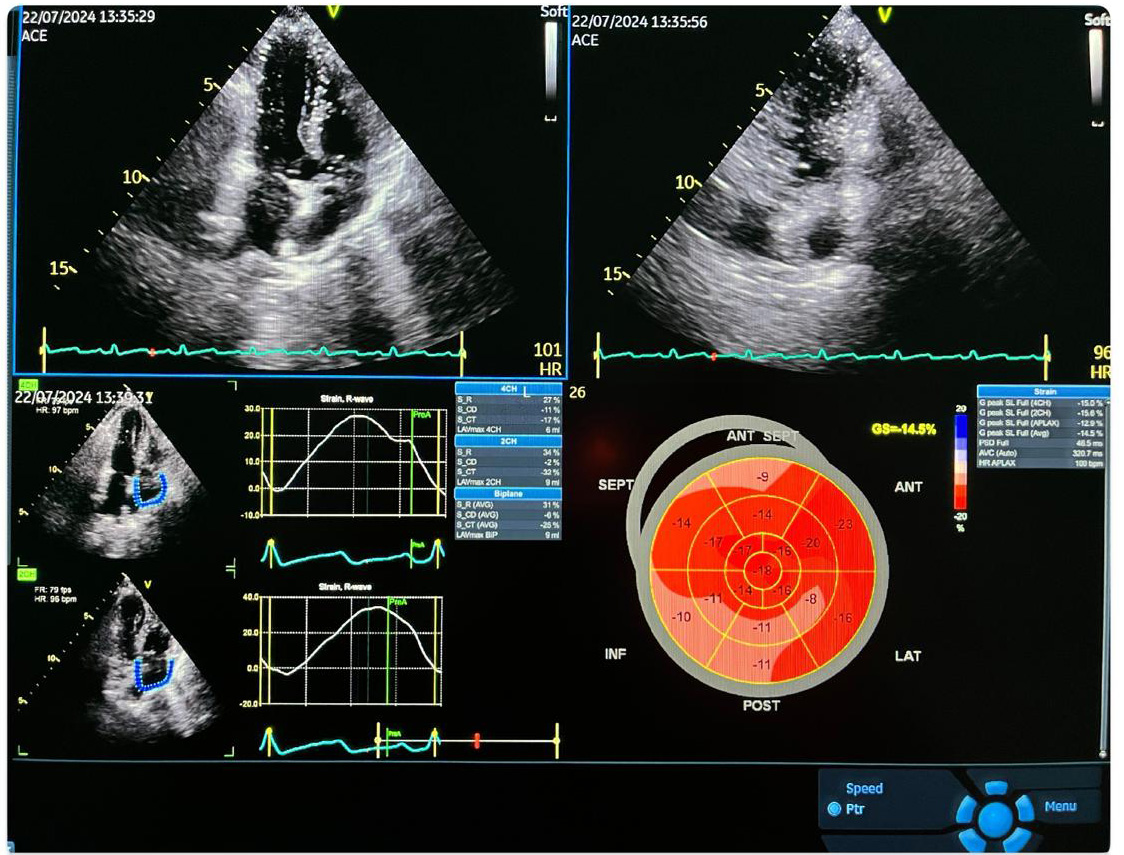 Fig. 2.
A typical echocardiographic and global longitudinal strain measurement image. ACE, angiotensin-converting enzyme; FR, frame rate; HR, heart rate; SEPT, septum; INF, inferior; ANT, anterior; LAT, lateral; POST, posterior; APLAX, apical long axis longitudinal strain; CH, chamber; AVG, average; LAV, left atrial volume; PSD, peak strain dispersion; AVC, aortic yalve clossure; S_R, strain reservoir (systole); S_CD, strain conduit early diastole; S_CT, strain contractile late diastole.
Left ventricular diastolic function was evaluated using four parameters: annular
e’ velocity (septal e’
Data were stored and analyzed using IBM-SPSS (IBM SPSS Statistics for Windows,
Version 28.0.0, Armonk, NY, USA: IBM Corp.) statistical software. Levene’s test
was used to examine the equality of variance (homogeneity). Continuous variables
are presented as the median (minimum: maximum or interquartile range) or mean
A total of 47 patients who had been receiving dialysis treatment for an extended
period were included in this study. In total, 23 of these patients received HD,
and 24 received CAPD treatment. The characteristics of the HD and CAPD patient
groups were compared. The mean age of the patients was 58.6
Table 1 compares HD and CAPD patient groups regarding baseline characteristics
and dialysis parameters. When the baseline characteristics of patients receiving
HD and CAPD were examined, it was found that the average age (p: 0.016)
and BMI (p: 0.038) were significantly higher in the group receiving CAPD
treatment. No significant difference was found between the groups when the
patient’s comorbidities and the underlying primary cause of renal failure were
considered. When the medication use of the patients was examined, it was observed
that paricalcitol use was significantly higher in the HD group (p:
0.050). No significant difference was observed between the use of other drugs.
When patients were evaluated according to dialysis parameters, residual urine was
significantly higher in the group receiving CAPD (p: 0.049).
Additionally, the calculated Kt/V ratio was significantly higher in the CAPD
group (1.92
| CAPD (n = 24) | HD (N = 23) | p-value | |||
| Demographic characteristics | |||||
| Age, y, mean |
58.6 |
49.4 |
0.016 | ||
| Male sex, n (%) | 10 (41.7) | 16 (69.6) | 0.080 | ||
| Weight, kg, mean |
64.8 |
64.1 |
0.799 | ||
| Body mass index, kg/m2, mean |
24.9 |
22.9 |
0.038 | ||
| Primary disease | |||||
| Unknown, n (%) | 16 (66.7) | 12 (52.2) | 0.625 | ||
| Diabetic nephropathy, n (%) | 3 (12.5) | 5 (21.7) | |||
| Hypertensive nephropathy, n (%) | 1 (4.2) | 3 (13) | |||
| ADPKD, n (%) | 2 (8.3) | 2 (8.7) | |||
| Glomerulonephritis, n (%) | 1 (4.2) | 1 (4.3) | |||
| Pyelonephritis, n (%) | 1 (4.2) | 0 | |||
| Comorbidites | |||||
| Hypertension, n (%) | 15 (62.5) | 16 (69.6) | 0.609 | ||
| Diabetes mellitus, n (%) | 2 (8.3) | 3 (13) | 0.666 | ||
| Hyperlipidemia, n (%) | 11 (45.8) | 6 (26.1) | 0.159 | ||
| Obesity, n (%) | 2 (8.3) | 1 (4.3) | 1.000 | ||
| Hepatitis B virüs, n (%) | 1 (4.2) | 1 (4.3) | 1.000 | ||
| Medications | |||||
| Calcium channel blocker, n (%) | 12 (50) | 10 (43.5) | 0.654 | ||
| B-blocker use, n (%) | 9 (37.5) | 5 (21.7) | 0.341 | ||
| ACE inhibitor use, n (%) | 15 (62.5) | 12 (52.2) | 0.474 | ||
| Cinacalcet, n (%) | 4 (16.7) | 8 (34.8) | 0.193 | ||
| Paricalcitol, n (%) | 0 | 4 (17.4) | 0.050 | ||
| Sevelamer, n (%) | 7 (29.2) | 11 (47.8) | 0.238 | ||
| Erythropoietin, n (%) | 15 (62.5) | 18 (78.3) | 0.238 | ||
| Dialysis parameters | |||||
| Dialysis time, hours/month, mean |
128.6 |
121.5 |
0.493 | ||
| Residuel urine, n (%) | 10 (41.7) | 3 (13) | 0.049 | ||
| Daily urine amount, cc | 275 (55–1500) | 166 (100–200) | 0.304 | ||
| Kt/V*, mean |
1.92 |
1.63 |
0.005 | ||
| Dialysis access site, n (%) | Arteriovenous fistula | 0 | 22 (95.7) | - | |
| Permanent dialysis catheter | 0 | 1 (4.3) | |||
| Peritoneal transport rates, n (%) | High | 3 (12.5) | 0 | - | |
| High average | 12 (50) | 0 | |||
| Low average | 8 (33.3) | 0 | |||
| Low | 1 (4.2) | 0 | |||
Data are presented as median (interquartile range [IQR]), number (percentage),
and mean
*Kt/V: K is the urea clearance, t is the time of dialysis, and V is the volume of distribution of patients.
Table 2 compares the CAPD and HD patient groups according to laboratory
parameters. Albumin value was significantly lower in the CAPD group (33.9
| CAPD (n = 24) | HD (N = 23) | p-value | |
| Laboratory parameters | |||
| Urea, mg/dL, mean |
96.3 |
113.6 |
0.053 |
| Creatinine, mg/dL, mean |
7.89 |
8.01 |
0.848 |
| Albumin, g/L, mean |
33.9 |
39.8 |
|
| Hemoglobin, g/dL, mean |
10.8 |
10.9 |
0.965 |
| Lymphocyte, /mm3, mean |
1.63 |
1.32 |
0.079 |
| Platelet, /mm3, mean |
237.4 |
191.7 |
0.018 |
| hs-CRP (g/L), mean |
37.8 |
20.3 |
0.566 |
| Transferrin saturation, %, mean |
29 |
31.8 |
0.496 |
| Ferritin, mcg/L, mean |
723 |
923 |
0.320 |
| Calcium, mg/dL, mean |
9.44 |
8.91 |
0.036 |
| Phosporus, mg/dL, mean |
4.75 |
4.78 |
0.927 |
| Parathormone, pg/dL, mean |
547.3 |
677.1 |
0.448 |
| Glucose, mg/dL, mean |
101 |
126.5 |
0.038 |
| Total cholesterol, mg/dL, mean |
173.3 |
159.6 |
0.173 |
| LDL cholesterol, mg/dL, mean |
144 |
92.8 |
0.005 |
| Trygliceride, mg/dL, mean |
140 |
182.6 |
0.169 |
Data are presented as mean
Table 3 compares the CAPD and HD treatment groups according to echocardiographic
parameters. When 2D echocardiographic parameters were examined,
it was observed that LV mass value (260.7
| CAPD (n = 24) | HD (N = 23) | p-value | |||
| Two-dimensional echocardiographic parameters | |||||
| LVDd, mm, mean |
46.82 |
45.03 |
0.170 | ||
| LVDs, mm, mean |
31.97 |
30.89 |
0.506 | ||
| IVSd, mm, mean |
14.69 |
13.70 |
0.238 | ||
| PWd, mm, mean |
12.82 |
12.22 |
0.244 | ||
| LV mass, g, mean |
260.7 |
224 |
0.047 | ||
| LVMI, g/m2, mean |
153.3 |
130.8 |
0.040 | ||
| RWT, mm, mean |
0.550 |
0.553 |
0.921 | ||
| LA diameter, mm, mean |
43.25 |
44.56 |
0.316 | ||
| LAVI, mL/m2, mean |
32.2 |
30.6 |
0.222 | ||
| LVEF, % | 55 (41.9–64.4) | 51.2 (40–69) | 0.296 | ||
| Tissue Doppler parameters | |||||
| LV transmitral E, cm/s, mean |
84.77 |
77.67 |
0.424 | ||
| LV transmitral A (cm/s), mean |
78.71 |
72.82 |
0.409 | ||
| E/A ratio, mean |
1.19 |
1.19 |
0.932 | ||
| LV TDI septal S (cm/s), mean |
7.49 |
6.63 |
0.083 | ||
| LV TDI septal E (cm/s), mean |
5.94 |
6.57 |
0.259 | ||
| LV TDI septal A (cm/s), mean |
9.59 |
8.43 |
0.077 | ||
| E/e’ ratio, mean |
14.19 |
12.38 |
0.049 | ||
| GLS (%), mean |
–15.55 |
–17.51 |
0.033 | ||
| Left ventricular index and RWT values | |||||
| Diastolic dysfunction, % | 16 (66.7) | 6 (26.1) | 0.005 | ||
| LVH, % | 22 (91.7) | 14 (60.9) | 0.002 | ||
| Left ventricular hypertrophy severity, % | Normal | 2 (8.3) | 9 (39.1) | 0.002 | |
| Mild | 2 (8.3) | 6 (26.8) | |||
| Moderate | 2 (8.3) | 3 (13) | |||
| Severe | 18 (75) | 5 (21.7) | |||
| Left ventricular geometry classification, % | Normal | 0 | 2 (8.7) | 0.025 | |
| Concentric remodelling | 2 (8.3) | 7 (30.4) | |||
| Concentric hypertrophy | 22 (91.7) | 14 (60.9) | |||
| Eccentric hypertrophy | 0 | 0 | |||
Data are presented as number (percentage) and mean
The patients were categorized into two groups: those with diastolic dysfunction (22 patients) and those without (25 patients); the parameters that influenced diastolic dysfunction were evaluated. When the effects of age and BMI on the presence of diastolic dysfunction were assessed using univariate regression analysis, no significant effect was found (OR = 1.01, 95% CI: 0.96–1.07; p: 0.59 and OR = 1.04, 95% CI: 0.86–1.27 p: 0.67, respectively). Multivariate analysis showed that receiving CAPD treatment (OR = 90.48, 95% CI: 3.75–2180.57; p: 0.006), history of dyslipidemia (OR = 0.01, 95% CI: 0–0.33; p: 0.008), worse GLS (OR = 16.06, 95% CI: 1.30–198.64; p: 0.031), and calcium value (OR = 7.77, 95% CI: 1.37–44.12; p: 0.021) were independently associated with diastolic dysfunction.
In the average 6-month follow-up of the patient groups receiving CAPD and HD, no statistically significant difference was observed in the number of hospitalizations for various reasons (p: 0.341). During this follow-up period, seven patients in the CAPD group and five patients in the HD group died for multiple reasons, with no significant difference found in the number of deaths (p: 0.740).
The results of this study demonstrated that LV diastolic dysfunction and deteriorations in left ventricular geometry were significantly higher in patients receiving long-term CAPD treatment than in patients receiving long-term HD treatment. CAPD treatment has advantages over HD, such as preserving residual kidney function, providing hemodynamic stability, and improving quality of life. To our knowledge, this is the first study in the literature to compare the association between left ventricular functions in patients undergoing long-term CAPD and HD treatments.
Although previous studies have described the development of LVH and diastolic dysfunction in patients with CKD and receiving HD treatment, this study examined the effects of HD and CAPD treatments on the development of LVH and diastolic dysfunction [8, 21]. The rate of diastolic dysfunction in the CAPD treatment group was significantly higher than in the HD treatment group (66.7% vs. 26.1%, p: 0.005). Additionally, the incidence of LVH was significantly higher in the CAPD treatment group compared to the HD treatment group (91.7% vs. 60.9%, p: 0.002). Based on these results, we can assert that cardiac dysfunctions, particularly LVH and diastolic dysfunction, occur significantly in patients undergoing long-term CAPD treatment.
LVH was present in 76.6% of the patients in our study. This rate was compatible
with previous studies in the literature, which observed that the rate of LVH in
CKD patients is between 70% and 85% [6, 22]. In our study, the rate of LVH was
found to be high (91.7%), especially in the group receiving CAPD treatment.
Subsequently, the analysis of previous study on this subject indicates that the
incidence of LVH in patients receiving CAPD was approximately 75% [23]. This
difference in LVH rate is because the average age of the patients included in
this study was higher than that in other studies; moreover, the patients in this
study had been receiving CAPD treatment for an extended period.
Echocardiographically calculated LVMI values in the patient group receiving CAPD
were significantly higher than in the HD group (p: 0.040). We can
associate this result with the higher rate of LVH in the patient group receiving
CAPD in our study. In the patient population in our study, the E/e’ ratio, one of
the diastolic filling parameters, was found to be significantly higher in the
CAPD group than in the HD group (p: 0.049). Consistent with our
observation, another study found a higher E/e’ ratio in the CAPD group than in
the HD group. However, the frequency of diastolic dysfunction was not specified
in this cohort [24]. The GLS values of both groups in our study were below normal
levels; the literature defines normal GLS values as
When the dialysis parameters of the patients included in our study were
examined, the number of patients with residual urine was significantly higher in
the patient group receiving CAPD (p: 0.049). Recently it was shown that
CAPD treatment protects residual renal functions better than HD treatment.
Research has indicated that the residual urine volume in patients undergoing CAPD
treatment is greater than in those receiving HD treatment [29]. The data we
obtained in our study were observed to be compatible with the data in the
literature. When evaluating the Kt/V ratio, one of the methods of measuring
dialysis adequacy in the patient population in our study, we observed that this
ratio is significantly higher in the CAPD group (1.92 vs. 1.63,
p: 0.005). Although there are articles in the literature arguing that
this Kt/V ratio used to measure dialysis adequacy should be
When we examined the laboratory parameters of the patients included in our
study, we found that albumin levels in the CAPD group were significantly lower
than those in the HD group (p
When the lipid profiles of our patients were examined, LDL cholesterol levels were significantly higher in the patients receiving CAPD (p: 0.005). High LDL cholesterol levels in the CAPD group were suggested to be due to the glycotoxic effects resulting from the glucose-based solutions used, which may indicate an increased risk of atherosclerosis [36]. Although improved survival rates have been observed in the first 3 years of patients receiving CAPD treatment, the benefits of long-term CAPD treatment remain controversial. Huang et al. [37] demonstrated that LDL cholesterol and apolipoprotein B levels were elevated in peritoneal dialysis patients and concluded that atherosclerosis may be more prevalent in this patient group [38].
The chief limitations of our single-center observational study were the modest patient sample size and the omission of some high-risk patient groups. Due to the small sample size, it is hard to generalize these results to all dialysis patients. While determining the patient population, patients who switched between dialysis methods were excluded from the study. Although this situation reduced the sample size, it can be shown as a factor that increased the power of the study since no switch between dialysis methods occurred. Peritoneal dialysis patients had a greater proportion of residual diuresis with higher Kt/V compared to hemodialysis patients. This contrasts with data in the literature, which show that better dialysis efficiency with residual diuresis has a lower impact on cardiac kinetics. Hemodialysis has been suggested to have a lower effect on cardiac kinetic functions than peritoneal dialysis; meanwhile, peritoneal dialysis has shown positive effects on cardiac ventricular capacity and heart failure management. Contrarily, peritoneal dialysis modality did not improve renal functions [39]. While interdialytic fluid retention was independently associated with mortality in hemodialysis patients, long-term HD and PD were not significantly different in terms of survival in end stage renal disease (ESRD) patients [40]. By including patients who were stable on dialysis modality in the long-term follow-up, we believe we have minimized the possibility of the dialysis method not being on optimal management, such as any fluid overload or blood pressure instability due to treatment inadequacy, toxicity, or suboptimal concentration of dialysis fluids. Therefore, the observed difference can be related to the dialysis method. Due to the lack of baseline and follow-up echocardiographic evaluations in our HD and CAPD patients, different confounding factors may have affected the echocardiographic findings at the end of such an extended period. The short follow-up period was a significant limitation in terms of prognosis.
The results of this study demonstrated that LV diastolic dysfunction and deteriorations in left ventricular geometry were significantly higher in patients receiving long-term CAPD treatment than in patients receiving long-term HD treatment. Despite adequate dialysis, more cardiovascular pathological changes were detected in patients receiving CAPD than for HD treatment. It would be advantageous to perform additional studies investigating the impact of these cardiovascular changes on prognosis and mortality over extended follow-up periods in larger patient cohorts, including those receiving CAPD treatment.
CVD, cardiovascular disease; ESKD, end-stage kidney disease; LVH, left ventricular hypertrophy; CKD, chronic kidney disease; HD, hemodialysis; CAPD, continuous ambulatory peritoneal dialysis; BMI, body mass index; AVF, arteriovenous fistula; URR, urea reduction ratio; TBW, total body water; TDI, tissue doppler imaging; LA, left atrium; IVSd, end-diastolic interventricular septum; PWd, end-diastolic posterior wall; LVDd, left ventricle end-diastolic diameter; LVDs, left ventricle end-systolic diameter; LVMI, left ventricular mass index; BSA, body surface area; RWT, relative wall thickness; LVEF, left ventricular ejection fraction; LAVI, left atrial volume index; GLS, global longitudinal strain.
The datasets used and/or analyzed during the current study are available from the corresponding author on reasonable request.
All authors contributed to the study conception and design. Conceptualization, writing, review, editing and methodology were performed by MU. Resources, material preparation and data collection were performed by ST, NÖŞ, ÖFD and AE. Formal analysis was performed by MCB. The first draft of the manuscript was written by MU and all authors commented on previous versions of the manuscript. All authors contributed to editorial changes in the manuscript. All authors read and approved the final manuscript. All authors have participated sufficiently in the work and agreed to be accountable for all aspects of the work.
All the procedures in this study including human participants were applied in compliance with the ethical standards of the institutional research committee and the 1964 Helsinki Declaration and subsequent revisions or comparable ethical standards. No animals were used in this study. Patient consent information was received. Approval for the study was granted by the Local Ethics Committee (University of Health Sciences, Bursa City Training and Research Hospital, Clinical Research Ethics Committee, Approval no: 2023-6/12).
Not applicable.
This research received no external funding.
The authors declare no conflict of interest.
References
Publisher’s Note: IMR Press stays neutral with regard to jurisdictional claims in published maps and institutional affiliations.