


 , Jian Zhang 1,2,*
1 Heart Failure Center, State Key Laboratory of Cardiovascular Disease, Fuwai Hospital, National Center for Cardiovascular Diseases, Chinese Academy of Medical Sciences & Peking Union Medical College (CAMS & PUMC), 100037 Beijing, China
2 Key Laboratory of Clinical Research for Cardiovascular Medications, National Health Committee, 100037 Beijing, China
Abstract
Background: To assess the link between serum potassium (K
Keywords
- serum potassium
- heart failure
- outcome
- hypokalemia
- hyperkalemia
Heart failure (HF) is becoming more common, and the associated mortality and
morbidity rates remain high [1, 2]. Guidelines recommend diuretics, angiotensin II
receptor blockers (ARBs) or angiotensin-converting enzyme inhibitors (ACEIs), and
mineralocorticoid receptor antagonists (MRAs) for HF patients, but these drug
treatments may contribute to dyskalemia [3, 4, 5]. The comorbidities and
pathophysiology of HF further increase the risk for dyskalemia [6, 7]. Hypokalemia
and hyperkalemia are usually defined as serum potassium (K
This retrospective analysis of the prospective cohort study was performed at the
HF Center of Fuwai Hospital between December 2006 and December 2017. The
patients, including chronic decompensated HF and new-onset HF patients, were
continuously enrolled. The diagnosis and assessment of hospitalized HF patients
were based on symptoms/signs of fluid overload or hypoperfusion and relevant
laboratory, functional, and imaging tests (such as measurements of N-terminal
pro-B-type natriuretic peptide (NT-proBNP), echocardiography, electrocardiogram,
and chest X-ray). The inclusion criteria were as follows: at least one of the
signs and symptoms of HF; New York Heart Association (NYHA) class Ⅱ–Ⅳ; and
NT-proBNP levels
We did not include patients with missing serum K
The patients in the study were categorized based on quartiles of serum K
Clinical details regarding demographics, comorbidities, blood biochemistry
results, echocardiograms, and medication data were recorded before discharge. The
use of ACEIs or ARBs,
Patients regularly attended followed-up appointments at the outpatient clinic and by telephone after discharge until January 2020, at least once every 3 months within the first year, and every 6 months thereafter. Patients were followed up until cardiovascular or all-cause death occurred. The medical records of patients who were followed up in the Fuwai hospital system provided information on occurrences of adverse events. For patients who were not followed up in our hospital, if necessary, the patient’s relatives and local medical personnel were contacted by telephone to obtain detailed information. Two blinded cardiologists examined and analyzed adverse event data. At 90-days, 2-years, and the maximal follow-up, the primary outcome was all-cause death. The survival duration was computed from the discharge date to the death or final follow-up date.
This study included four K
This analysis enrolled 3114 hospitalized HF patients in total, with a mean
follow-up of 4.14 years. The majority of HF patients (93.3%) had normal K
| Parameters | Total | K |
3.96 |
4.22 |
K |
p value | |
| (n = 3114) | (Q1, n = 780) | (Q2, n = 791) | (Q3, n = 770) | (Q4, n = 773) | |||
| Age (years) | 56.93 |
53.81 |
55.57 |
57.89 |
60.51 |
||
| Male, n (%) | 2208 (70.9) | 570 (73.1) | 582 (73.6) | 521 (67.7) | 535 (69.2) | 0.023 | |
| Body mass index (kg/m |
24.45 |
24.84 |
24.82 |
24.05 |
24.07 |
||
| Heart rate (bpm) | 81.13 |
81.41 |
81.18 |
81.58 |
80.34 |
0.556 | |
| Coronary artery disease, n (%) | 1218 (39.1) | 287 (36.8) | 283 (35.8) | 294 (38.2) | 354 (45.8) | ||
| Hypertension, n (%) | 1496 (48.0) | 356 (45.6) | 372 (47.0) | 338 (43.9) | 430 (55.6) | ||
| Diabetes, n (%) | 1038 (33.3) | 237 (30.4) | 262 (33.1) | 259 (33.6) | 280 (36.2) | 0.111 | |
| Systolic blood pressure (mmHg) | 118.45 |
117.36 |
118.44 |
118.30 |
119.70 |
0.154 | |
| Diastolic blood pressure (mmHg) | 71.67 |
71.63 |
71.96 |
71.59 |
71.48 |
0.901 | |
| NYHA class, n (%) | |||||||
| II | 721 (23.2) | 211 (27.1) | 205 (25.9) | 139 (18.1) | 166 (21.5) | ||
| III | 1532 (49.2) | 380 (48.7) | 370 (46.8) | 423 (54.9) | 359 (46.4) | ||
| IV | 861 (27.6) | 189 (24.2) | 216 (27.3) | 208 (27.0) | 248 (32.1) | ||
| Hemoglobin (g/L) | 136.84 |
138.59 |
138.85 |
136.18 |
133.68 |
||
| Total protein (g/L) | 68.25 |
67.90 |
68.45 |
68.59 |
68.06 |
0.203 | |
| Albumin (g/L) | 39.49 |
39.89 |
40.07 |
39.60 |
38.39 |
||
| ALT (IU/L) | 22.00 [14.00, 37.00] | 24.00 [16.00, 37.00] | 23.00 [15.00, 38.00] | 21.00 [14.25, 36.00] | 20.00 [13.00, 36.00] | 0.004 | |
| AST (IU/L) | 24.00 [19.00, 33.00] | 23.00 [18.00, 32.00] | 24.00 [18.00, 33.00] | 24.00 [19.00, 33.00] | 24.00 [19.00, 33.00] | 0.478 | |
| Total bilirubin (μmol/L) | 20.70 [14.50, 31.60] | 19.75 [14.50, 29.30] | 21.30 [14.80, 32.65] | 21.45 [14.60, 32.00] | 20.60 [14.30, 32.20] | 0.073 | |
| Direct bilirubin (μmol/L) | 4.20 [2.70, 7.30] | 3.90 [2.60, 6.53] | 4.30 [2.70, 7.40] | 4.40 [2.80, 7.40] | 4.50 [2.80, 8.40] | 0.004 | |
| Na (mmol/L) | 137.07 |
137.44 |
137.35 |
136.86 |
136.60 |
||
| eGFR (mL/min/1.73 m |
70.81 |
76.80 |
76.21 |
70.37 |
59.67 |
||
| Triglyceride (mmol/L) | 1.32 [0.98, 1.82] | 1.38 [1.01, 1.87] | 1.32 [0.99, 1.83] | 1.32 [0.98, 1.79] | 1.28 [0.96, 1.79] | 0.065 | |
| Total cholesterol (mmol/L) | 4.17 |
4.23 |
4.12 |
4.22 |
4.09 |
0.050 | |
| High-density lipoprotein (mmol/L) | 0.99 |
1.00 |
0.98 |
0.99 |
0.99 |
0.428 | |
| Low-density lipoprotein (mmol/L) | 2.56 |
2.61 |
2.53 |
2.59 |
2.49 |
0.054 | |
| C-reactive protein (mg/L) | 4.83 [2.55, 11.10] | 4.18 [2.14, 8.56] | 4.36 [2.43, 9.93] | 5.19 [2.76, 12.20] | 5.68 [3.01, 14.40] | ||
| BUN (mmol/L) | 8.78 |
8.32 |
8.15 |
8.90 |
9.77 |
||
| Uric acid (μmol/L) | 466.67 |
462.67 |
462.71 |
465.25 |
476.17 |
0.298 | |
| HSCRP (mg/L) | 3.72 [1.68, 10.43] | 3.02 [1.33, 8.46] | 3.37 [1.54, 9.54] | 4.27 [1.80, 10.98] | 4.80 [2.20, 11.48] | ||
| NT-proBNP (pg/mL) | 2207.5 [1023.3,4781.8] | 1774.5 [923.8, 4060.8] | 2086.0 [914.0, 4167.0] | 2235.5 [1097.3, 4934.5] | 2796.0 [1197.0, 5861.0] | ||
| LVEF, n (%) | 0.133 | ||||||
| 1733 (55.7) | 408 (52.3) | 459 (58.0) | 429 (55.7) | 437 (56.5) | |||
| 1381 (44.3) | 372 (47.7) | 332 (42.0) | 341 (44.3) | 336 (43.5) | |||
| Pharmacotherapy | |||||||
| Digoxin, n (%) | 1749 (56.2) | 425 (54.5) | 465 (58.8) | 445 (57.8) | 414 (53.6) | 0.109 | |
| ACEIs/ARBs, n (%) | 2335 (75.0) | 576 (73.8) | 579 (73.2) | 598 (77.7) | 582 (75.3) | 0.182 | |
| Beta-blocker, n (%) | 2657 (85.3) | 677 (86.8) | 656 (82.9) | 656 (85.2) | 668 (86.4) | 0.127 | |
| MRAs, n (%) | 2111 (67.8) | 541 (69.4) | 519 (65.6) | 510 (66.2) | 541 (70.0) | 0.161 | |
| Thiazides, n (%) | 154 (4.3) | 44 (4.8) | 36 (3.9) | 38 (4.5) | 36 (4.0) | 0.791 | |
| Loop diuretics, n (%) | 2452 (78.7) | 602 (77.2) | 611 (77.2) | 618 (80.3) | 621 (80.3) | 0.218 | |
| Diuretic, n (%) | 3001 (96.4) | 743 (95.3) | 758 (95.8) | 748 (97.1) | 752 (97.3) | 0.086 | |
ACEIs, angiotensin-converting enzyme inhibitors; AST, aspartate aminotransferase; BUN, blood urea nitrogen; NYHA, New York Heart Association; ALT, alanine transaminase; LVEF, left ventricular ejection fraction; eGFR, estimated glomerular filtration rate; NT-proBNP, N-terminal pro-B-type natriuretic peptide; ARBs, angiotensin II receptor blockers; MRAs, mineralocorticoid receptor antagonists; HSCRP, high-sensitivity C-reactive protein.
Patients in the Q4 group had a higher proportion of coronary heart disease, hypertension, diabetes, and NYHA class IV than patients in the Q2 group. Patients in the Q4 group had lower levels of hemoglobin, albumin, and eGFR but higher NT-proBNP and high-sensitivity C-reactive protein and a higher age than patients in all other groups.
A total of 1300 deaths (41.7%) occurred during follow-up. The 2-year mortality
rates in the quartiles of the serum K
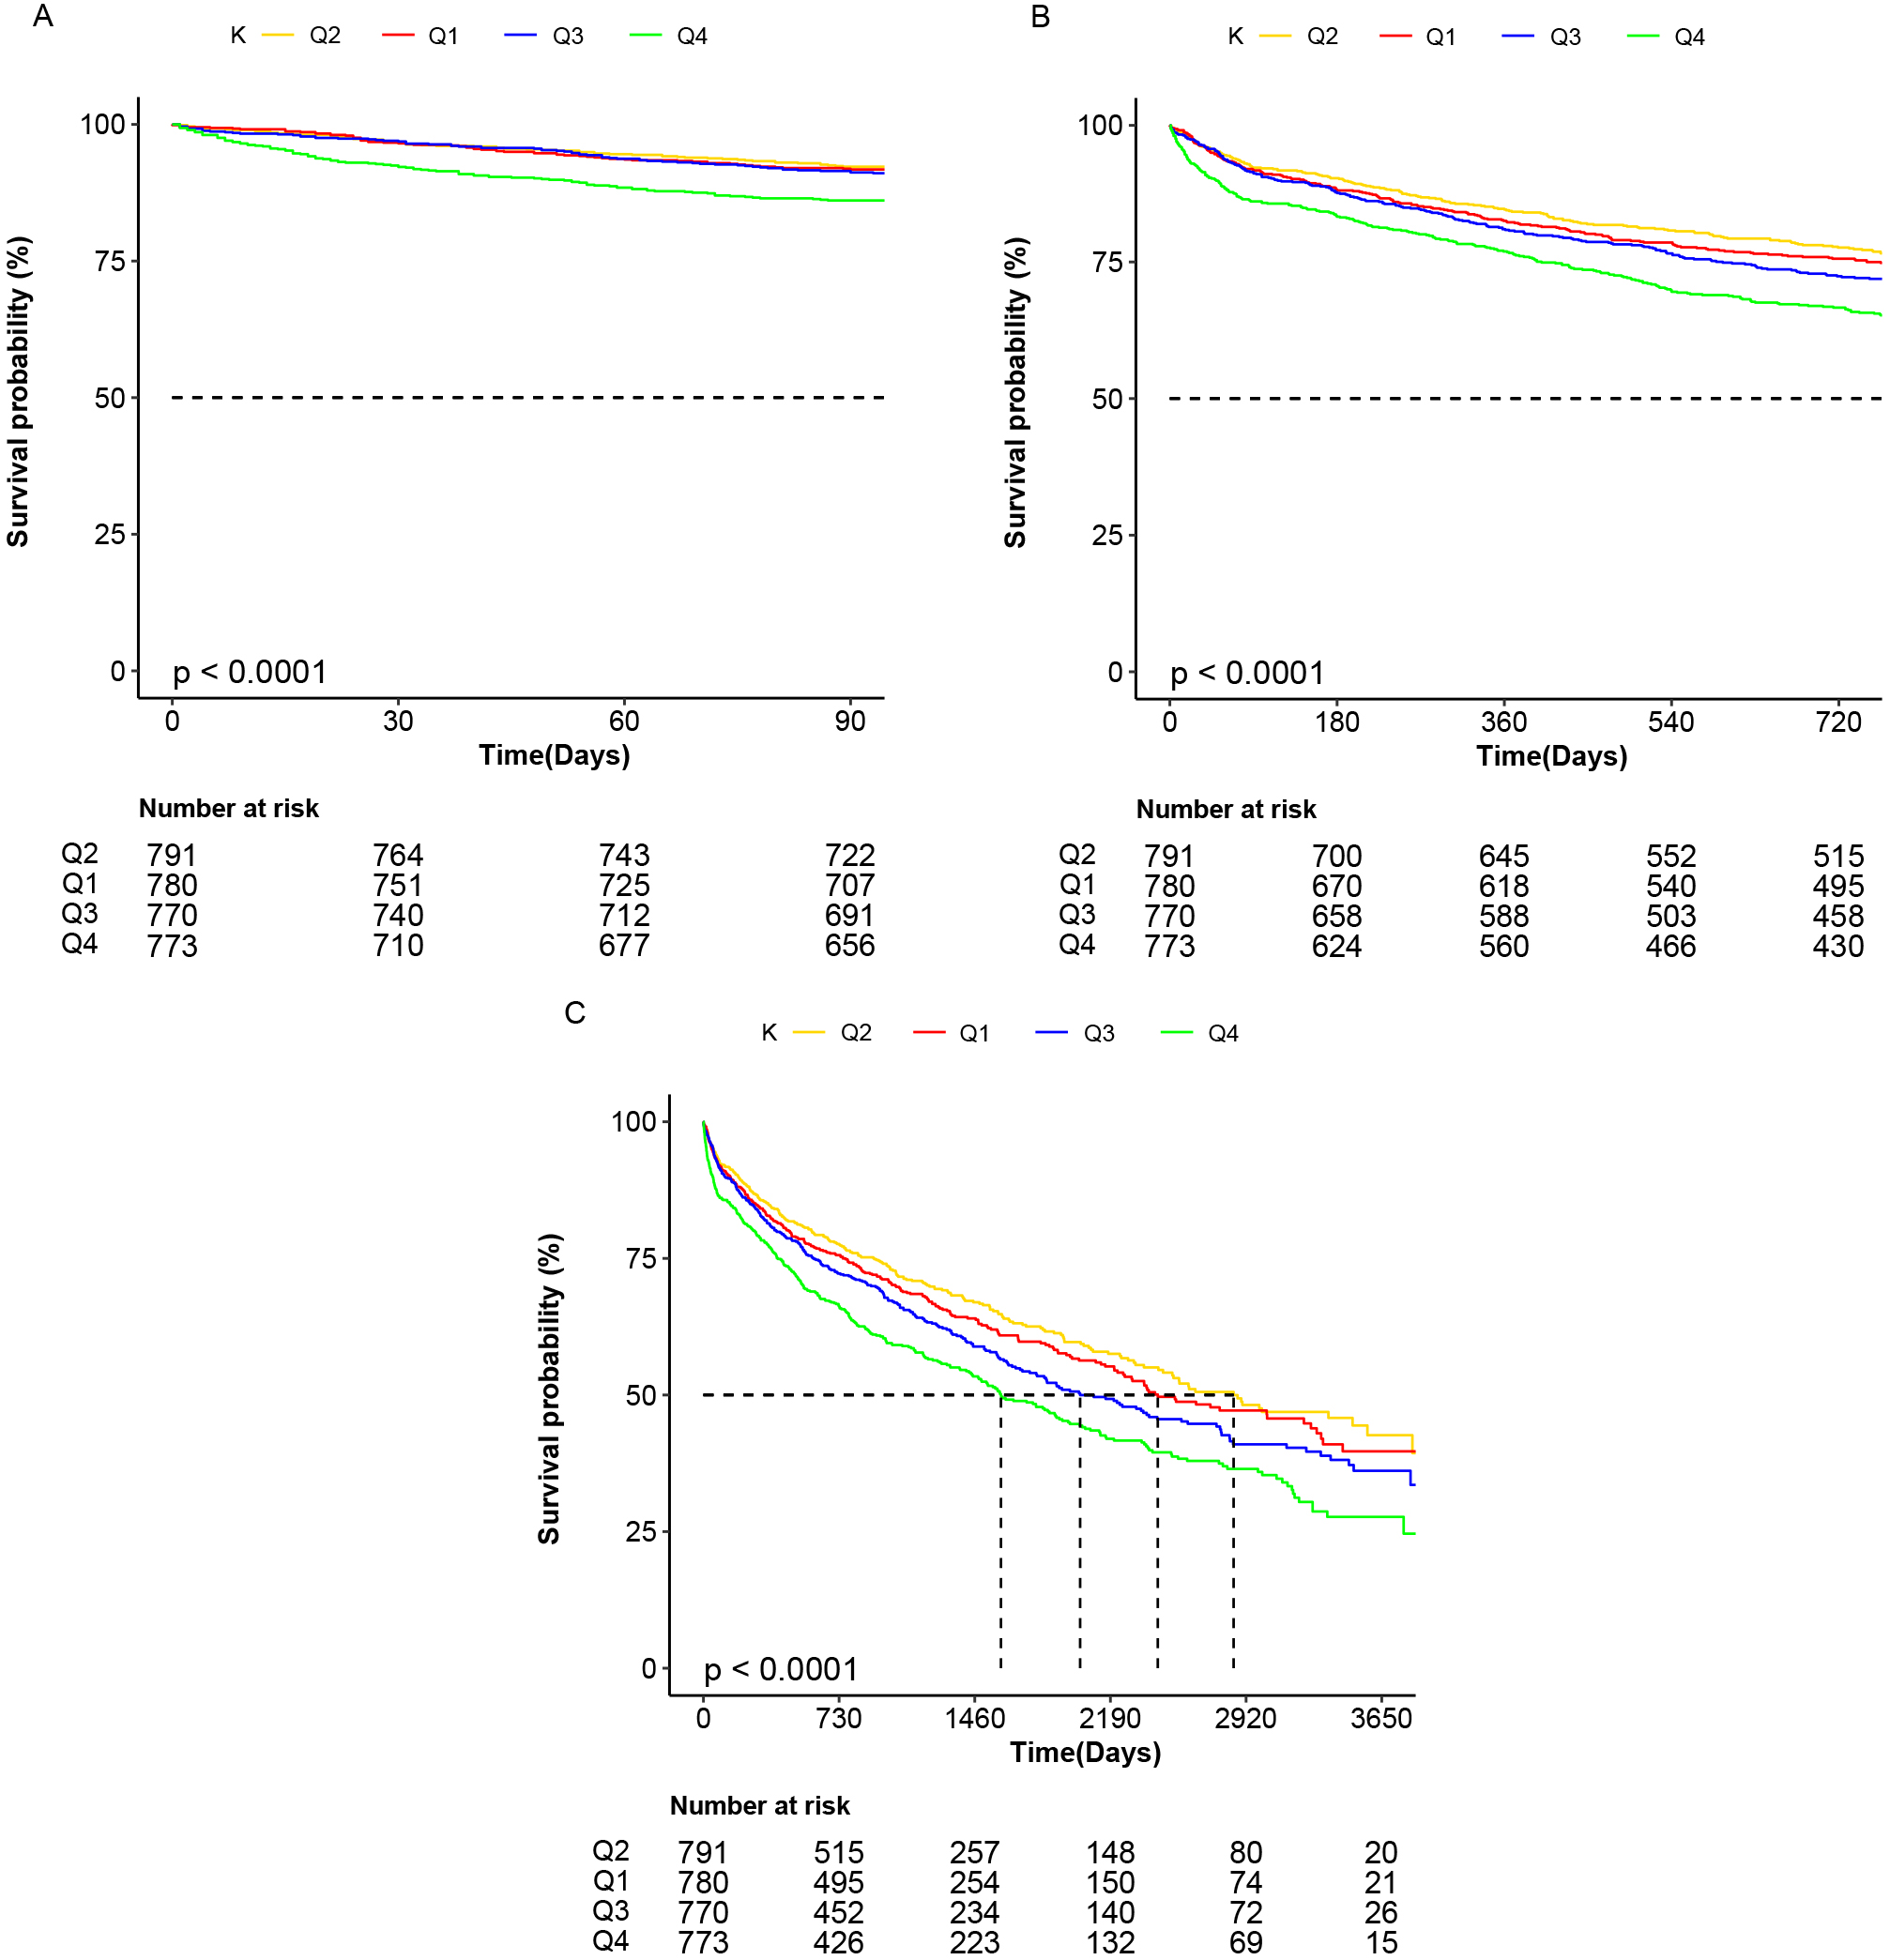 Fig. 1.
Kaplan-Meier curve of survival probability of patients based on
serum potassium quartiles. Ninety-day (A), 2-year (B), and maximal (C) follow-up
survival by four groups: red, K
Those with hypokalemia (K
A univariate Cox regression model was utilized to identify significant variables
that influence all-cause mortality. To evaluate the utility of serum K
| Parameters | Model 1 | Model 2 | Model 3 | |||
| HR (95% CI) | p value | HR (95% CI) | p value | HR (95% CI) | p value | |
| K |
1.13 (0.96, 1.33) | 0.150 | 1.15 (0.98, 1.36) | 0.085 | 1.12 (0.95, 1.32) | 0.180 |
| 3.96 |
1 (Reference) | - | 1 (Reference) | - | 1 (Reference) | - |
| 4.22 |
1.21 (1.03, 1.42) | 0.019 | 1.21 (1.03, 1.41) | 0.022 | 1.12 (0.95, 1.31) | 0.178 |
| K |
1.47 (1.26, 1.72) | 1.50 (1.29, 1.75) | 1.28 (1.09, 1.49) | 0.002 | ||
Model 1 was adjusted for sex and age; Model 2 was adjusted for Model 1 and hypertension, diabetes, coronary artery disease, digoxin, diuretics, angiotensin-converting enzyme inhibitors, beta-blockers, angiotensin II receptor blockers, and mineralocorticoid receptor antagonists; and Model 3 was adjusted for Model 2 and heart rate, body mass index, estimated glomerular filtration rate, N-terminal pro-B-type natriuretic peptide, systolic blood pressure, and New York Heart Association class. HR, hazard ratio; CI, confidence interval.
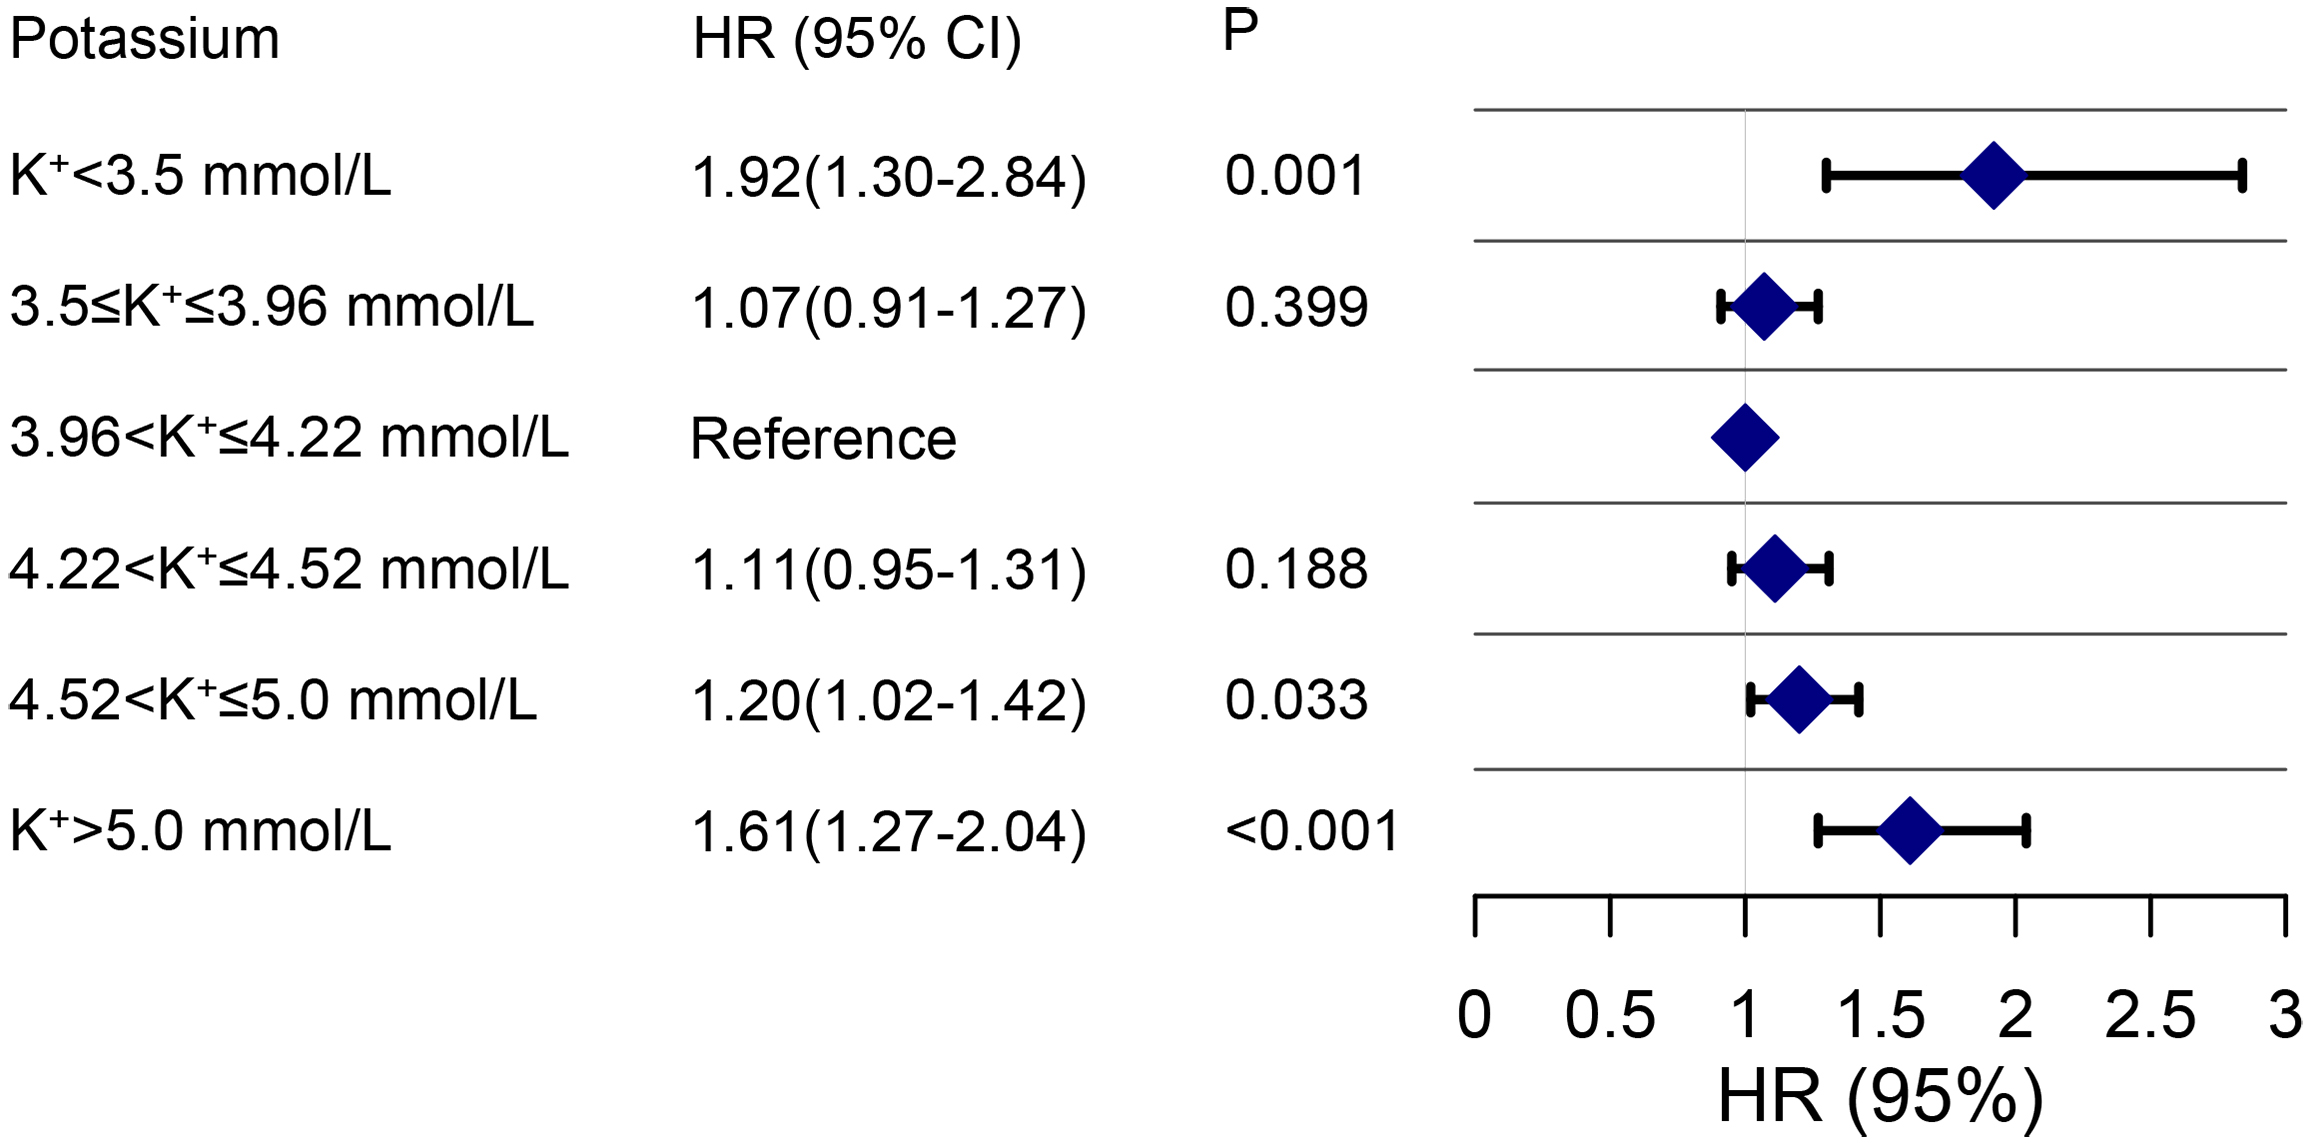 Fig. 2.
Hazard ratios for maximal survival associated with serum
potassium levels in heart failure patients. The reference interval is the
K
The model was adjusted for demographic and clinical comorbidities and the use of
relevant medications. The spline curve indicates that individuals with
hypokalemia and those with hyperkalemia have an elevated risk of all-cause
mortality. The spline curve also revealed that the lowest mortality risk was
related to a serum K
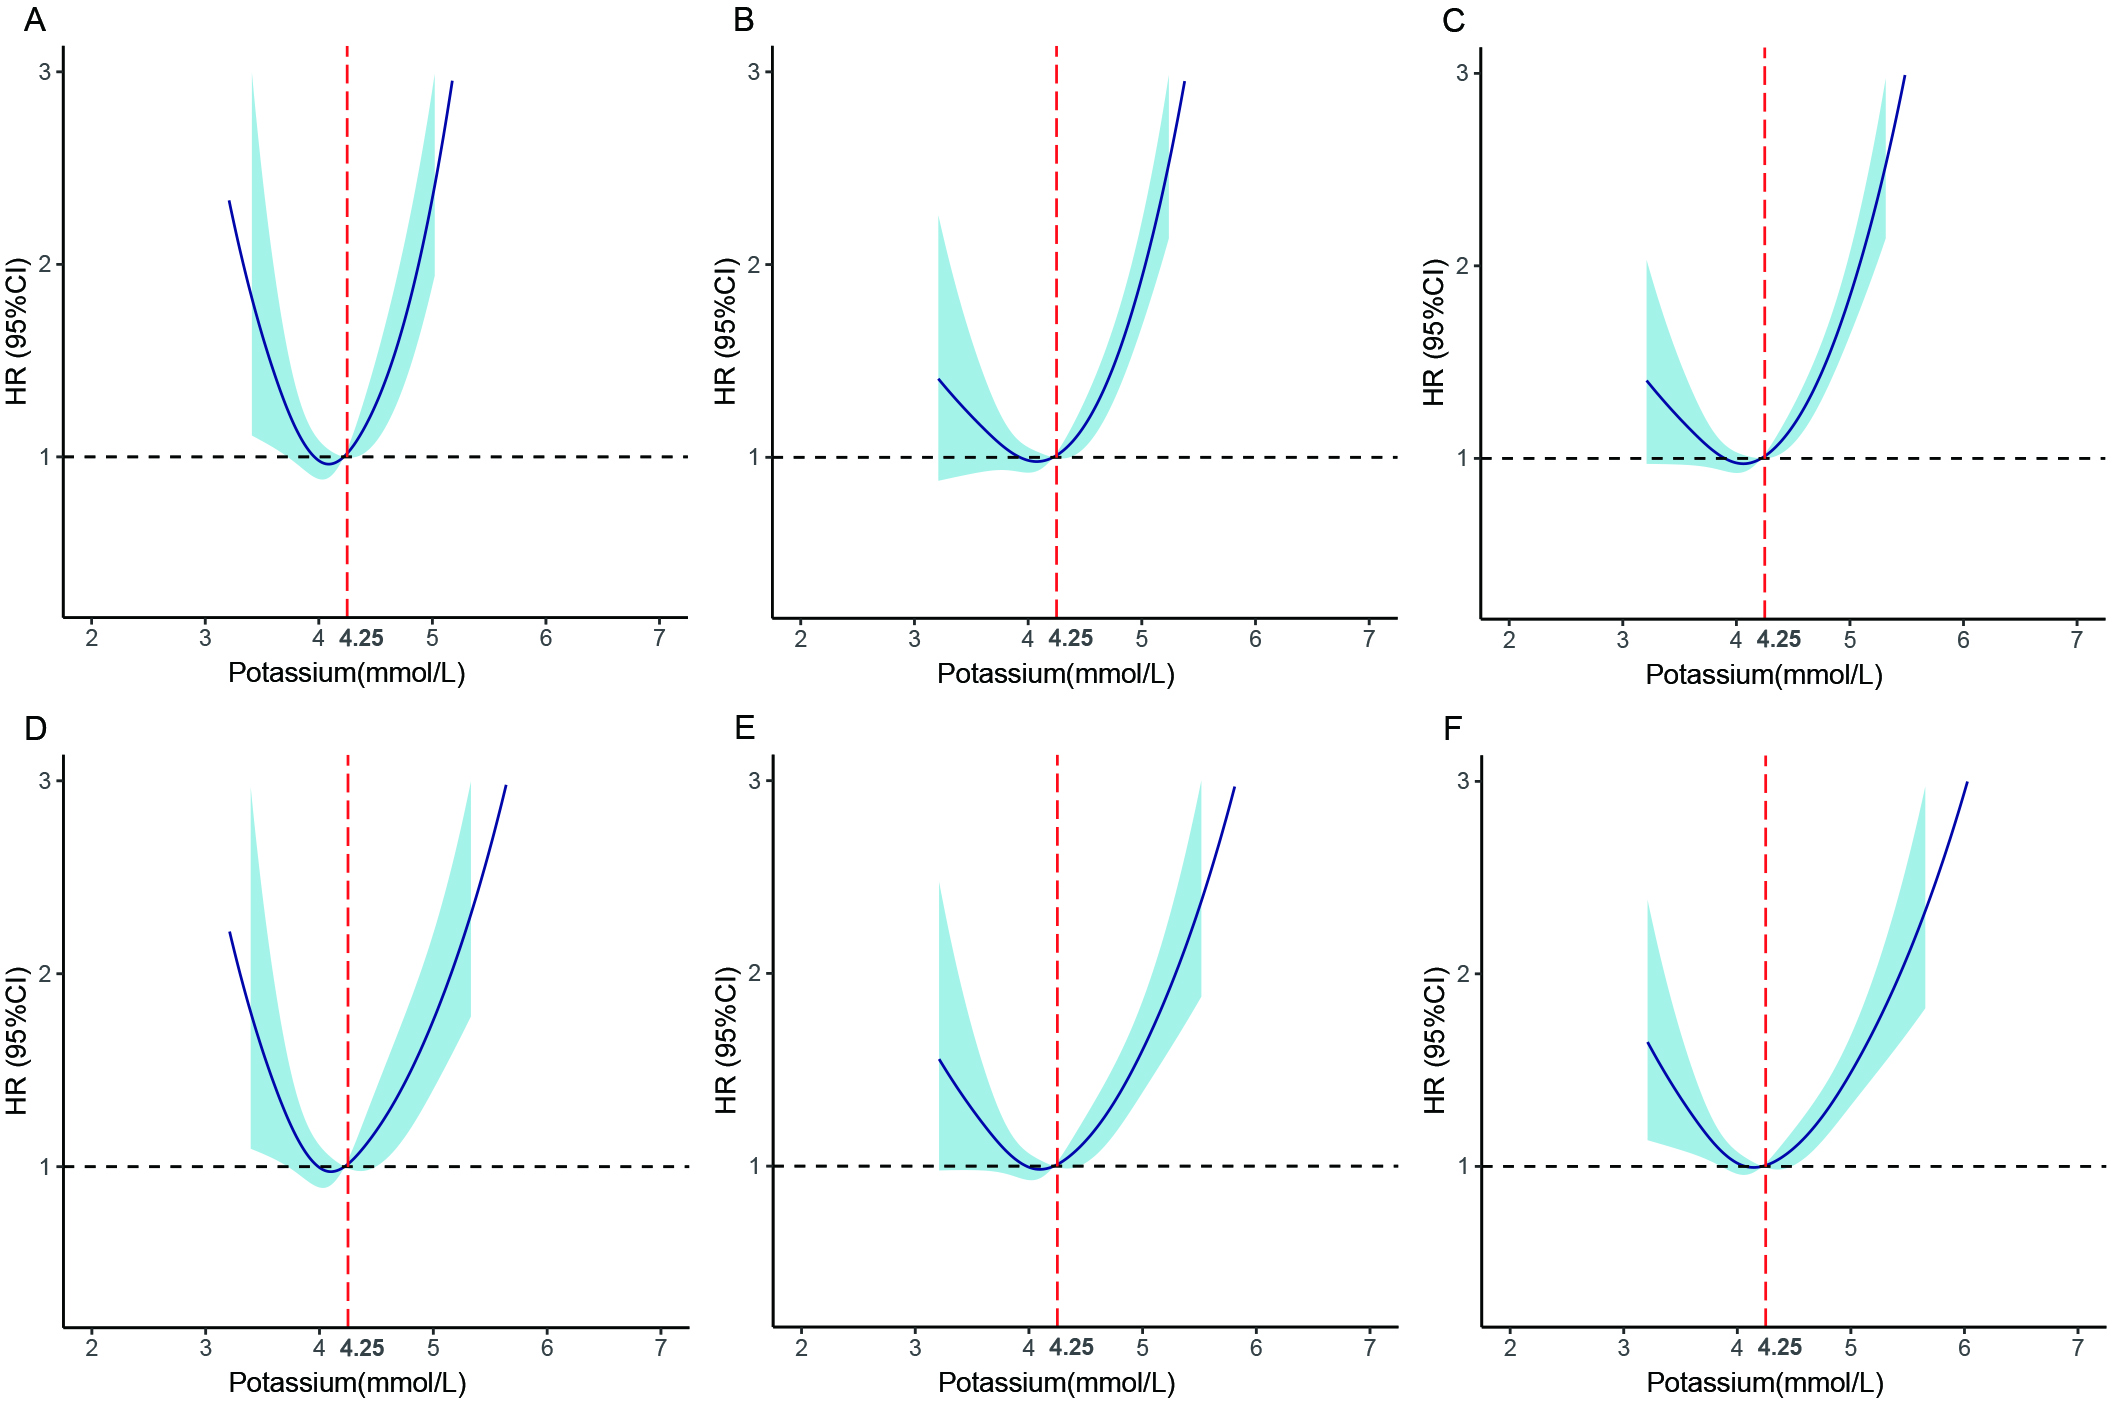 Fig. 3.
Restricted cubic splines of the hazard ratios for all-cause mortality. Unadjusted risk of mortality at 90-day (A), 2-year (B), and maximal (C) follow-up. The adjusted risk of mortality at 90-day (D), 2-year (E), and maximal (F) follow-up. Adjusted variables are the same as in Fig. 2. HR, hazard ratio.
Using normal K
In this study, we observed that most hospitalized HF patients had K
Hypokalemia among hospitalized HF patients was linked to a higher mortality risk
at the 90-day, 2-year, and maximal follow-up. In previous studies, hypokalemia
was not associated with mortality at 3 months or 6 months after multivariate
adjustment [15, 16]. After controlling for confounding factors, our research
demonstrates that hypokalemia is an independent factor related to adverse
outcomes in hospitalized HF patients. Various studies have indicated that
hypokalemia is related to increased mortality risk in chronic HF patients
[10, 17, 18, 19]. In HF and chronic kidney disease patients, a serum K
In hospitalized HF patients, hyperkalemia was linked to increased short- and
long-term mortality. After adjusting all potentially confounding variables
(including demographic and clinical features and medications), the relationship
between K
Our research has several limitations. First, because the study was
observational, we could not entirely rule out the effect of residual confounding
factors. The cause and duration of HF were not considered. The research cohort
was recruited from a single center, and the findings may not be generalizable to
other populations; thus, a multicenter study is required. Second, as we did not
investigate the dynamics of serum K
This research revealed a J-shaped connection between K
Data supporting the findings of this study are available from the corresponding author upon reasonable request within 1 year of publication of this article.
BPH, LZ—Design, Data collection, Analysis, Writing - original draft, and Writing - review & editing. XMZ, MZ, YH, QZ—Design, Data analysis, Interpretation, Writing - review & editing. PCT, LL, LYH, JYF—Review, Data curation, Interpretation, Writing - review & editing. YHZ, JZ—Design, Interpretation, Project administration, Resources, Supervision, Funding acquisition, Writing - review & editing. All authors read and approved the final manuscript.
All patients signed consent forms, and this study was approved by the Ethics Committee of Fuwai Hospital (Approval NO.2018-1041).
Thanks to the statisticians, cardiologists, and sleep specialists for their valuable advice and help, and to all HFCU staff and patients who participated in the study.
This work was supported by the Key Projects in the National Science and Technology Pillar Program of the 13th Five-Year Plan Period (grant number 2017YFC1308300), Beijing, People’s Republic of China; the Key Projects in the National Science and Technology Pillar Program of the 12th Five-Year Plan Period (grant number 2011BAI11B08), Beijing, People’s Republic of China; and CAMS Innovation Fund for Medical Science (grant number 2020-I2M-1-002).
The authors declare no conflict of interest.
References
Publisher’s Note: IMR Press stays neutral with regard to jurisdictional claims in published maps and institutional affiliations.