


1 Department of Cardiology, University Hospital, 38000 Grenoble Alpes, France
2 Univ. Grenoble Alpes, INSERM, CHU Grenoble Alpes, LRB, 38000 Grenoble, France
3 French Alliance Clinical Trial, French Clinical Research Infrastructure Network, 75018 Paris, France
Academic Editors: Marco Zimarino and Nick Curzen
Abstract
Coronary physiological assessment is now widely used to assess epicardial coronary lesions in cath lab. Based on clinical evidence, fractional flow reserve (FFR) is the gold standard method to select whether epicardial coronary lesions need revascularization. While additional epicardial indexes, such as instantaneous wave-free ratio (iFR), are also used for revascularization decision-making, several indexes are now also available to explore the coronary microcirculation. Therefore, coronary physiological assessment now allows to explore the entire coronary tree and offer the potential of precision medicine for patients affected by coronary artery disease (CAD). This paper will provide review of the epicardial and microvascular indexes available for the assessment of coronary physiology. More specifically, the already demonstrated contributions of these indexes in the management of CAD and the role they could play in precision medicine will be reviewed with special emphasis on chronic coronary syndrome.
Keywords
- coronary physiology assessment
- coronary microcirculation dysfunction
- precise medicine
Coronary physiological assessment is usually used to assess epicardial coronary lesions in cath lab. Based on clinical evidence, fractional flow reserve (FFR) is the gold standard method to select whether epicardial coronary lesions need revascularization. While additional epicardial indexes, such as instantaneous wave-free ratio (iFR), are also used for revascularization decision-making, several indexes are now also available to explore the coronary microcirculation. Therefore, coronary physiological assessment now allows to explore the entire coronary tree and offer the potential of precision medicine for patients affected by coronary artery disease (CAD).
This paper will provide a review of the epicardial and microvascular indexes available for the assessment of coronary physiology. More specifically, the already demonstrated contributions of these indexes in the management of CAD and the role they could play in precision medicine will be reviewed with special emphasis on chronic coronary syndromes.
The relevance of the invasive coronary angiography (ICA) assessment of CAD
severity is limited. Indeed, ICA predicts the hemodynamic significance of
40–70% coronary stenoses in less than 50% of cases [1]. This can be explained
by the fact that ICA does not allow the functionality of the entire coronary tree
to be explored. The coronary vasculature may be divided into two components [2].
First, the macroscopic compartment assessed by ICA constitutes less than 10% of
the coronary vasculature and is formed by the epicardial arteries (
Recently published data indicate that inaccurate diagnosis of CAD leads to inappropriate treatment and is associated with major adverse cardiovascular events (MACE), persistent symptoms with reduced quality of life, repeated hospitalizations and unnecessary diagnostic procedures [4]. The key to a precise diagnosis is to explore the whole coronary tree with coronary physiological indexes, which cannot be performed by non-invasive methods [4]. Positron emission tomography (PET), transthoracic echocardiography, and cardiac magnetic resonance can detect CMVD by measure of coronary flow reserve (CFR). However, these techniques do not allow assessment of the relative participation of epicardial and microvascular diseases in the reduction of myocardial blood flow. Consequently, the etiology of ischemia as due to obstructive CAD or CMVD may not be systematically identified [5].
FFR represents the ratio of maximal myocardial blood flow in the territory
supplied by the coronary stenosis being interrogated to maximal myocardial blood
flow in the same territory if the considered coronary artery was normal (no
stenosis). Accordingly, FFR is derived from the ratio between mean coronary blood
pressure distal to a stenosed segment (Pd) and mean proximal coronary pressure
(Pa) during maximum CBF and a state of minimum microvascular resistance.
Essentially, FFR is computed as Pd/Pa during hyperemia induced by intravenous
infusion of adenosine for 3 minutes (140
NHPRs obviate the necessity of adenosine administration. iFr (Philips/Volcano) is the first NHPR that have been proposed [8]. The study of the relationship between coronary pressure and coronary flow leads to the determination of a wave-free period which allowed the measurement of the Pd/Pa ratio during an interval in which microcirculatory resistance is constant but not necessarily minimal [9]. This mimics the constant microcirculatory resistance during the hyperaemic state whereby measured pressure is proportional to flow. Several other NHPRs have been developed with variations in the timepoint at which the Pd/Pa ratio is measured such as the resting full-cycle ratio (RFR) (Abbott), the diastolic hyperemia-free ratio (Boston Scientific), and the diastolic pressure ratio (Opsens Medical). It should be noted that NHPRs can be used only with vendor proprietary software. However, all these indexes appear comparable [10].
Even though the severity of the epicardial and microcirculatory damage are not
related [11], the status of the microcirculation will influence the FFR
measurement [12]. The HSR index is calculated using the formula (Pa - Pd)/average
peak velocity (APV) during maximal hyperaemia, and is defined as the resistance
provided by the assessed coronary lesion [13]. Although HSR uses flow velocity
measurement that depends on epicardial vasculature and microcirculation, it is an
index only of epicardial lesions. A HSR value
Advances in computational power have allowed the development of
angiography-derived FFR obviating the need for hyperemia and for a pressure wire.
Angiography-derived FFR combines two projections to provide a 3D quantitative
coronary angiography, which allows the reconstruction of the specific coronary
geometry. An analysis using computational fluid dynamic (CFD) techniques or
mathematical formulas then provides a rapid estimation of the pressure drop
across a lesion. Angiography-derived FFR demonstrated excellent performances for
the diagnosis of hemodynamically significant stenoses defined by FFR
As for the angiography-Derived FFR several steps will be necessary to obtain the
FFT CT from the Coronary computed tomography angiography (CCTA) imaging. First
step, with CCTA image data set an anatomic model of coronary arteries is
performed. Then a physiologic model of coronary circulation is produced. Resting
coronary flow is modelled on the basis of myocardial mass, and maximal hyperemia
is modelled in agreement with the expected reduction in resistance if adenosine
injection would be achieved. Finally, supercomputers use computational fluid dynamics methods to measure FFR CT. The
HeartFlow FFR CT software (FFR
Acetylcholine provides an endothelium-dependent stimulation. In normal
individuals, acetylcholine causes the vasodilatation of epicardial and micro
vessels. Paradoxical vasoconstriction occurs in patients with endothelial
dysfunction or vasospastic angina. Acetylcholine challenges endothelium-dependent
microvascular function. Acetylcholine is usually administered by sequential
manual infusion at progressive concentrations of 2
Using Doppler data. It is possible to use the bolus thermodilution
technique to diagnose endothelial-dependent microvascular dysfunction through the
assessment of endothelial coronary flow reserve with acetylcholine (eCFR)
Progressive concentrations of acetylcholine may induce epicardial or microcirculatory spasm. VSA and microvascular spasm (MVS) are defined as follows:
VSA: angina symptoms, ischemic ECG modification and
MVS: angina symptoms, ischemic ECG modification (
It should be noted that acetylcholine test patients with microvascular spasm or a history of myocardial infarction with nonobstructive coronary arteries (MINOCA) have a higher risk of myocardial infarction and recurrent chest pain requiring hospitalization at follow-up despite appropriate post-test therapy [23].
CFR provides information on both the epicardial and microvascular compartments
by quantifying the ratio of hyperemic to resting CBF. Maximal hyperemia is
induced by the intravenous infusion of 140
The vasodilatory capacity of whole coronary tree is therefore measured using two distinct methods, i.e., acetylcholine testing in order to monitor changes in CBF or eCFR, and adenosine testing in order to quantify CFR. The potentially complementary nature of both remains to be determined.
The principles of CBF measurement must be known in order to understand how to obtain the coronary microcirculation indexes. The microcirculation is invisible to all imaging techniques, which explains that functional tests are the only methods of analysis. The determination of CBF can be performed according to two methods.
Based on bolus thermodilution modelling, flow can be calculated from the mean time it takes a fixed vascular volume to travel from an injector to a sensor (Tmn). De Bruyne et al. [27] and Pijls et al. [28] conducted the bolus thermodilution technique in animal model and human and found a strong correlation between 1/Tmn and absolute CBF. Absolute CBF assessment is possible using the continuous thermodilution method. It requires a dedicated monorail infusion (RayFlow, Hexacath, Paris, France), an infusion pump, a pressure/temperature wire (PressureWire, Abbott Vascular, Santa Clara, California) and a dedicated software (CoroFlow, Cardiovascular System, Coroventis Research, Uppsala, Sweden). Absolute CBF in mL/min is then given by the equation:
1.08
Qi is the infusion rate of saline at room temperature (20 mL/min). T is the
temperature of blood (in
Hyperemic APV measured using Doppler is used as a surrogate of absolute CBF.
Because the Doppler signal provides only flow velocity, quantification of
volumetric flow requires exact knowledge of the vessel lumen size, which can be
obtained by quantitative coronary angiography (QCA) or intravascular ultrasound
(IVUS). The simultaneous measurement of the vessel cross-sectional area and mean
velocity (Vmean) allows to CBF in mL/min. Doppler-based wireline systems measure
APV. To calculate the mean Vm, a constant coefficient of 0.5 is used, i.e., mean
Vm = 0.5
The index of microcirculatory resistance (IMR) is based also on the bolus
thermodilution principle. IMR is calculated by: Pd
HMR is measured using a Doppler-equipped guidewire (ComboWire
XT; Philips Volcano, San. Diego, CA, USA). It is determined by:
Pd/Hyperemic APV. There is no clear cut-off for the diagnosis of CMVD.
HMR
RRR represents the vasodilatory capacity of microvasculature during hyperemia.
It is calculated using the following validated equation [36]: RRR =
BRI/IMR. The baseline resistance index (BRI) is a measure of the coronary
microcirculatory resting tone and is calculated using the formula: Pd
Baseline
The simultaneous acquisition of phasic pressure and flow velocity signals is
required to measure IHDVPS. However, this approach is rather complicated in terms
of instrumentation. IHDVPS correlates significantly with arteriolar obliteration,
capillary density, or arteriolar density [39]. IHDVPS is defined as the slope
(
Pzf is extrapolated from the regression line of the relationship between hyperaemic intracoronary pressure and flow in mid- to end diastole and is defined as the intercept of the regression line with the pressure axis. Pzf represents the distal coronary pressure in the theoretical situation of coronary flow cessation. Pzf measured after percutaneous coronary intervention (PCI) is a better predictor of the extent of myocardial infarction than HMR or IMR [40] but no normal range has been established. In addition, the methodology required for Pzf assessment is complex with important offline postprocessing.
A wave is a change in pressure and flow that propagates along a blood vessel.
There are four wave types: forward compression waves (FCW), forward decompression
wave (FDW), backward compression wave (BCW), and backward decompression wave
(BDW). The units of wave intensity (Watts/m
The main common problem with the above-described techniques (HMR, IHDVPS, Pzf, WIA) using the Doppler method is that an optimal Doppler signal is obtained in only 69% of the patients [42]. Repositioning and the use of an intracoronary microcatheter to stabilize the position can improve signal quality.
Once again, Ohm’s law with ratio of pressure and flow provides absolute resistance expressed in Wood units. The following parameters may then be computed:
total coronary resistance = Pa/absolute CBF
epicardial resistance = Pa-Pd/absolute CBF
microvascular resistance = Pd/absolute CBF
Absolute CBF and resistance as assessed using continuous thermodilution display
high reproducibility and low intraobserver variability [43]. A strong agreement
has been observed with [
Microvascular resistance reserve (MRR) is a novel index which presents several advantages. Because it uses the continued thermodilution method and since it relies on baseline and hyperemic measurements in the same epicardial territory, MRR is independent of myocardial mass, and operator independent. MRR is obtained as follows:
MRR = Absolute resistance at rest/absolute resistance at hyperemia
Absolute resistance at rest = Pa rest/absolute CBF rest
Absolute resistance at hyperemia = Pd Hyperemia/absolute CBF hyperemia
MRR = (absolute CBF hyperemia/absolute CBF rest)
MRR = CFR
If MRR is expressed in terms of CFR and FFR the equation is:
MRR = CFR/FFR
By continue thermodilution method: Pa rest = Pa hyper and final equation is:
MRR = CFR/FFR
MRR represents a very promising index since it is specific for the microcirculation, and independent of autoregulation and epicardial resistance [31].
An elegant use of the QFR in hyperemia has allowed to obtain an angiography-derived IMR [48], which is obtained as follows:
IMR = Pd hyperaemia
IMR = Pa hyperaemia
Pd hyperemia/Pa hyperemia ~ QFR
Tmean hyperemia can be expressed as the ratio between the number of frames (Nframes) that the contrast agent travels from the guiding catheter to a distal marker of the pressure wire to the acquisition rate (fps).
Angiography-Derived IMR = Pa hyperemia
Data post-processing allows to obtain an angiography-derived IMR value without the need for hyperemia. The initial steps are similar to those used for QFR, a 3D reconstruction of the coronary artery and estimation of QFR was performed using CFD. The estimated hyperemic Pa is calculated according to the mean arterial pressure (MAP) with the following weighting:
MAP
Finally, angiography-derived IMR is computed using the equation:
Angiography-Derived IMR = Pa hyperemia
Vdiastole is the resting flow velocity during diastole and is derived of the TIMI frame count method multiplied by K which is the constant to adjust the difference between resting and hyperemic flow velocity. Vessel length is determined by the length of vessel opacified by the contrast from the ostium to the distal part [49]. These data are currently monocentric and additional data are needed.
Several techniques are needed to explore the whole coronary tree. The analysis of endothelial function and the detection of spasm by the acetylcholine test must be used more and more systematically. For the other indexes, each index explores a part of the coronary tree. At this time, it is not possible to say which technique is the best. However, the interventional cardiologist must know the strengths and weaknesses of each technique and choose and implement a strategy exploring the whole coronary tree through coronary physiology for all his patients. So, each method has strengths and weaknesses that are summarized in Table 1.
| Advantages | Limitations | |
| FFR | - Best evidences | - Guidewire: cost, complication |
| - Prognostic studies available | - Hyperemia: cost and side effect of adenosine | |
| - Increase time of the procedure | ||
| iFR | - Validated by non-inferiority studies vs. FFR | - Guidewire: cost, complication |
| - Hyperemia independent | - Increase time of the procedure | |
| - Quicker than FFR | - Specific software required | |
| Other NHPR | - Hyperemia independent | - Guidewire: cost, complication |
| - Quicker than FFR | - Increase time of the procedure | |
| - Specific software required | ||
| - No evidence regarding outcome prediction | ||
| HSR | - Stenosis resistance based on a combination of intracoronary pressure and flow velocity | - Guidewire: cost, complication |
| - Increase time of the procedure | ||
| - Specific software required | ||
| QFR, CAAS | - Hyperemia independent | - No evidence for outcomes |
| vFFR, FFRangio system | - No pressure wire | - Specific software required |
| - Quicker than FFR if high expertise in post treatment software | - Precise acquisition of angiography | |
| - Manual correction by expert | ||
| FFR CT | - Non invasive | - Cost |
| - Increase performance of CCTA | - Off line analysis | |
| CFR | - Study all coronary tree | - Overall assessment (macro and microcirculation) |
| - Prognostic performance | - Variability: intrinsic + variable resting condition | |
| - Guidewire: cost, complication | ||
| - Hyperemia: cost and side effect of adenosine | ||
| - Increase time of the procedure | ||
| IMR | - Microcirculation study | - Guidewire: cost, complication |
| - Hyperemia: cost and side effect of adenosine | ||
| - Increase time of the procedure | ||
| HMR | - Microcirculation study | - Guidewire: cost, complication |
| - Hyperemia: cost and side effect of adenosine | ||
| - Increase time of the procedure | ||
| - Doppler: additional cost, Doppler signal not analyzable (30% of patients) | ||
| - No cutoff value | ||
| RRR | - Microcirculation study | - Guidewire: cost, complication |
| - Hyperemia: cost and side effect of adenosine | ||
| - Increase time of the procedure | ||
| - No evidence regarding outcome prediction | ||
| - No cutoff values | ||
| - Long-lasting procedure | ||
| Absolute CBF and resistance | - Operator-independent | - Dependent upon myocardial mass |
| - Additional cost | ||
| - Increase time of the procedure | ||
| MRR | - Operator-independent | - Additional cost |
| - Independent from autoregulation and myocardial mass | - Increase time of the procedure | |
| IHDVPS | - More targeted (theoretically) of Microcirculation study | - Doppler: additional cost, Doppler signal not analyzable (30 % of patients) |
| Pzf | - Specific equipment required | |
| WIA | ||
| CAAS vFFR, Cardiovascular Angiographic Analysis Systems for vessel Fractional Flow Reserve; CBF, Coronary blood flow; CFR, Coronary flow reserve; CT, computed tomography; FFR, fractional flow reserve; HMR, Hyperaemic Microvascular Resistance; HSR, Hyperaemic Stenosis Resistance; iFR, instantaneous wave-free ratio; IHDVPS, Instantaneous Hyperemic Diastolic Velocity Pressure Slope; IMR, Index of Microcirculatory Resistance; MRR, Microvascular Resistance Reserve; Pzf, Zero-Flow Pressure; QFR, Quantitative Flow Ratio; RRR, Resistive reserve ratio; WIA, Wave Intensity Analysis. | ||
Coronary physiological assessment now plays a major role in the decision for PCI
revascularization. According to the recommendations, a physiological assessment
must be performed before revascularization, when the location of ischemia is not
documented for 50% and 90% stenosis by visual estimation or in patients with
multivessel CAD [50]. FFR and IFR have been shown to be useful in large
randomized studies and should be used as a priority. Accordingly, FFR is
currently considered the gold standard because its use has been validated in
several large randomized studies. The results of the FAME-1 [1] and FAME-2 trials
[51, 52] have demonstrated a clinical benefit in using FFR with a cut off
The two largest randomized trials showed that iFR-guided PCI was noninferior to
FFR-guided PCI in rates of MACE at 12 months [55, 56]. These results prompted the
appearance of iFR in the recommendations using a cut off
Discordance between FFR and iFR appears in an average of 20% of cases. This discordance results from interactions between clinical characteristics, severity or shape of the stenosis [57, 58], variability in coronary physiological responses to rest and hyperemia [59], and location of the stenosis [60]. Indeed, for the localization some studies have shown that lesion of left main (LM) might be associated with a higher discordance between iFR and FFR values (iFR-/FFR+) questioning the use of iFR in this setting. The DEFINE-LM registry shows that deferral or perform revascularization of LM stenosis based on iFR appears to be secure [61].
Finally, because the discordance between FFR and iFR does not lead to differences in outcomes [59], it is more interesting to discuss of practical use on specific clinical setting. For example, iFR could be an attractive alternative to FFR in patients with multivessel CAD to perform multiple measurements without inducing hyperemia. There may also be a reluctance by many operators to use vasodilators in patients with bradycardia or hypotension. iFR could be an alternative. The value of iFR in cases of abnormal coronary microcirculation is suggested especially in acute coronary syndrome (ACS) and in patients with severe aortic stenosis. However, the evaluation of non-infarct-related arteries in the early phase of ACS creates diagnostic problems for the FFR but also for the IFR. The first is explained to a blunted hyperemia associated to ACS and the second by increased coronary resting flow on territory of remote myocardial infarction with compensatory hyperkinesia [62]. Recently, FLOWER MI trial failed to prove that a complete revascularization that is guided by FFR is superior to an angiography-guided procedure in STEMI patients [63]. If we can evoke the problem of the use of the FFR at the time of primary PCI due to blunted hyperemia associated to ACS [62], these results were more explained to a lack of statistical power due to lower-than-expected incidence of events. Probably future studies will precise the optimal time to use FFR or iFR to evaluate non-infarct-related arteries. In the setting of patient with severe aortic stenosis, conflicting data of evolution of FFR after TAVR implantation create debate with either a decrease in FFR after TAVR implantation [64] or stability [65]. So, further studies are needed in this area to clarified use of iFR and FFR.
To complete, several recent studies on the FFR appear with negative results in patients with multivessel CAD. However, negative results are probably due to reasons other than a questioning of the FFR performance.
The FUTURE trial compared an FFR-guided strategy with a traditional non-FFR strategy in the treatment of multivessel CAD. The trial was stopped prematurely by data safety and monitoring board due to higher all-cause mortality associated with FFR-guided strategy. This observation was not confirmed by the intention-to treat analysis at 1-year follow-up. At follow up, there was no significant difference between both strategies [66]. It is really difficult to conclude given the limited statistical power of the study. The higher all-cause mortality initial was probably due to chance.
The results of the FAME 3 trial are more instructive [67]. FAME 3 was a multicenter, international, noninferiority trial, patients with multivessel CAD were randomly assigned to undergo CABG or FFR-guided PCI with zotarolimus-eluting stents. The composite primary end point was death from any cause, myocardial infarction, stroke, or repeat revascularization at 1 year. FFR-guided PCI was not found to be noninferior to CABG. Probably it is not the performance of FFR that can be questioned. FAME 3 confirms that CABG is the best treatment for multivessel CAD [50]. Indeed, previous randomized clinical trials that assessed use of FFR were performed in patients eligible for PCI. Patients with multivessel CAD presented often long and severe diffuse lesions and PCI tends to be more appropriate for focal disease where the FFR is known to be more efficient [57, 58].
QFR has an advantage over alternative angiography-derived FFR indexes since the
publication of the FAVOR III China study results. This prospective study included
3825 patients from China in which the QFR-guided PCI was used with a cut off
The number of randomized studies is still limited. The PLATFORM trial, which evaluated FFR CT in patients with planned ICA for chronic coronary syndrome. FFR CT was a feasible and safe with a significantly lower rate of NOCAD at ICA. At 1-year follow-up, the FFR CT strategy appeared lower cost than the ICA strategy with an equivalent cardiac event rate and the same level of quality of life [69, 70]. The SYNTAX III trial, in patients with left main or 3-vessel coronary artery disease, showed that CCTA analysis made the same revascularization decision as ICA analysis, and that the use of FFR CT changed the decision in 7% of cases [71]. In FORECAST trial, use of FFR CT reduced ICA, and did not differ significantly from control group in cost or clinical outcomes [72]. However, control group had mainly CCTA (63%) as the initial test. Studies with adequate statistical power to compare the performance of FFR CT with other non-invasive tests in the management of chronic coronary syndrome are expected.
Up to 70% of patients with angina or myocardial ischemia will have a NOCAD at ICA [73]. The underlying cause of ANOCA (or INOCA) should be assessed systematically using invasive coronary physiology [25, 74]. The CorMicA randomized trial showed that the use of coronary physiological measures for the assessment of microvascular and/or vasospastic angina to introduce stratified medicine in patients with stable angina and NOCAD is superior to standard care. Coronary physiological assessment was found to be relevant to introduce a tailored treatment that improved symptoms, quality of life, and decreased unnecessary ICA [75, 76]. The use of coronary physiological measurements in INOCA, also called interventional diagnostic procedures, follows an expert consensus developing diagnostic and therapeutic strategies [77]. This expert consensus allows to choose the sequence of testing. Performing adenosine testing first without nitroglycerin is the most suitable choice due to the pharmacodynamics of vasoactive drugs [78]. The sequence consists in coronary angiography and FFR in order to exclude obstructive CAD, then the assessment of vasodilatation is performed first by adenosine and then followed by acetylcholine test. Then, patient can be classified according to endotypes. Endotype 1 is the microvascular angina (MVA) (abnormal vasodilatation and/or microvascular spasm (MVS)); Endotype 2 is VSA (epicardial spasm); endotype 3 is a mixed MVA and VSA (epicardial spasm + abnormal vasodilatation); and endotype 4, extra-cardiac chest pain. This classification follows different therapeutic recommendations.
The diagnostic criteria are:
• VSA: angina symptoms, ischemic ECG modification and
• MVA: angina, no obstructive CAD plus objective evidence of
coronary microvascular dysfunction (MVS and/or CFR
• MVS: angina, ischemic ECG modification (
• Mixed MVA and VSA: angina with no obstructive CAD plus both
evidence of invasive coronary microvascular dysfunction and epicardial vasospasm
to acetylcholine (
• Extracardiac chest pain: normal results of coronary physiology assessment.
• Endothelial dysfunction is defined by
The term “precision medicine” refers to a medical concept where diseases are managed according to the individual characteristics of each patient. Precise medicine is applicable for prevention, diagnostic and therapeutic strategies. Oncology is far ahead of cardiology in this field by using critical data sources ranging from genomics, transcriptomics, proteomics, and metabolomics. In cardiology, the use of coronary physiological assessment already allows the implementation of personalized medicine in several situations (Fig. 1).
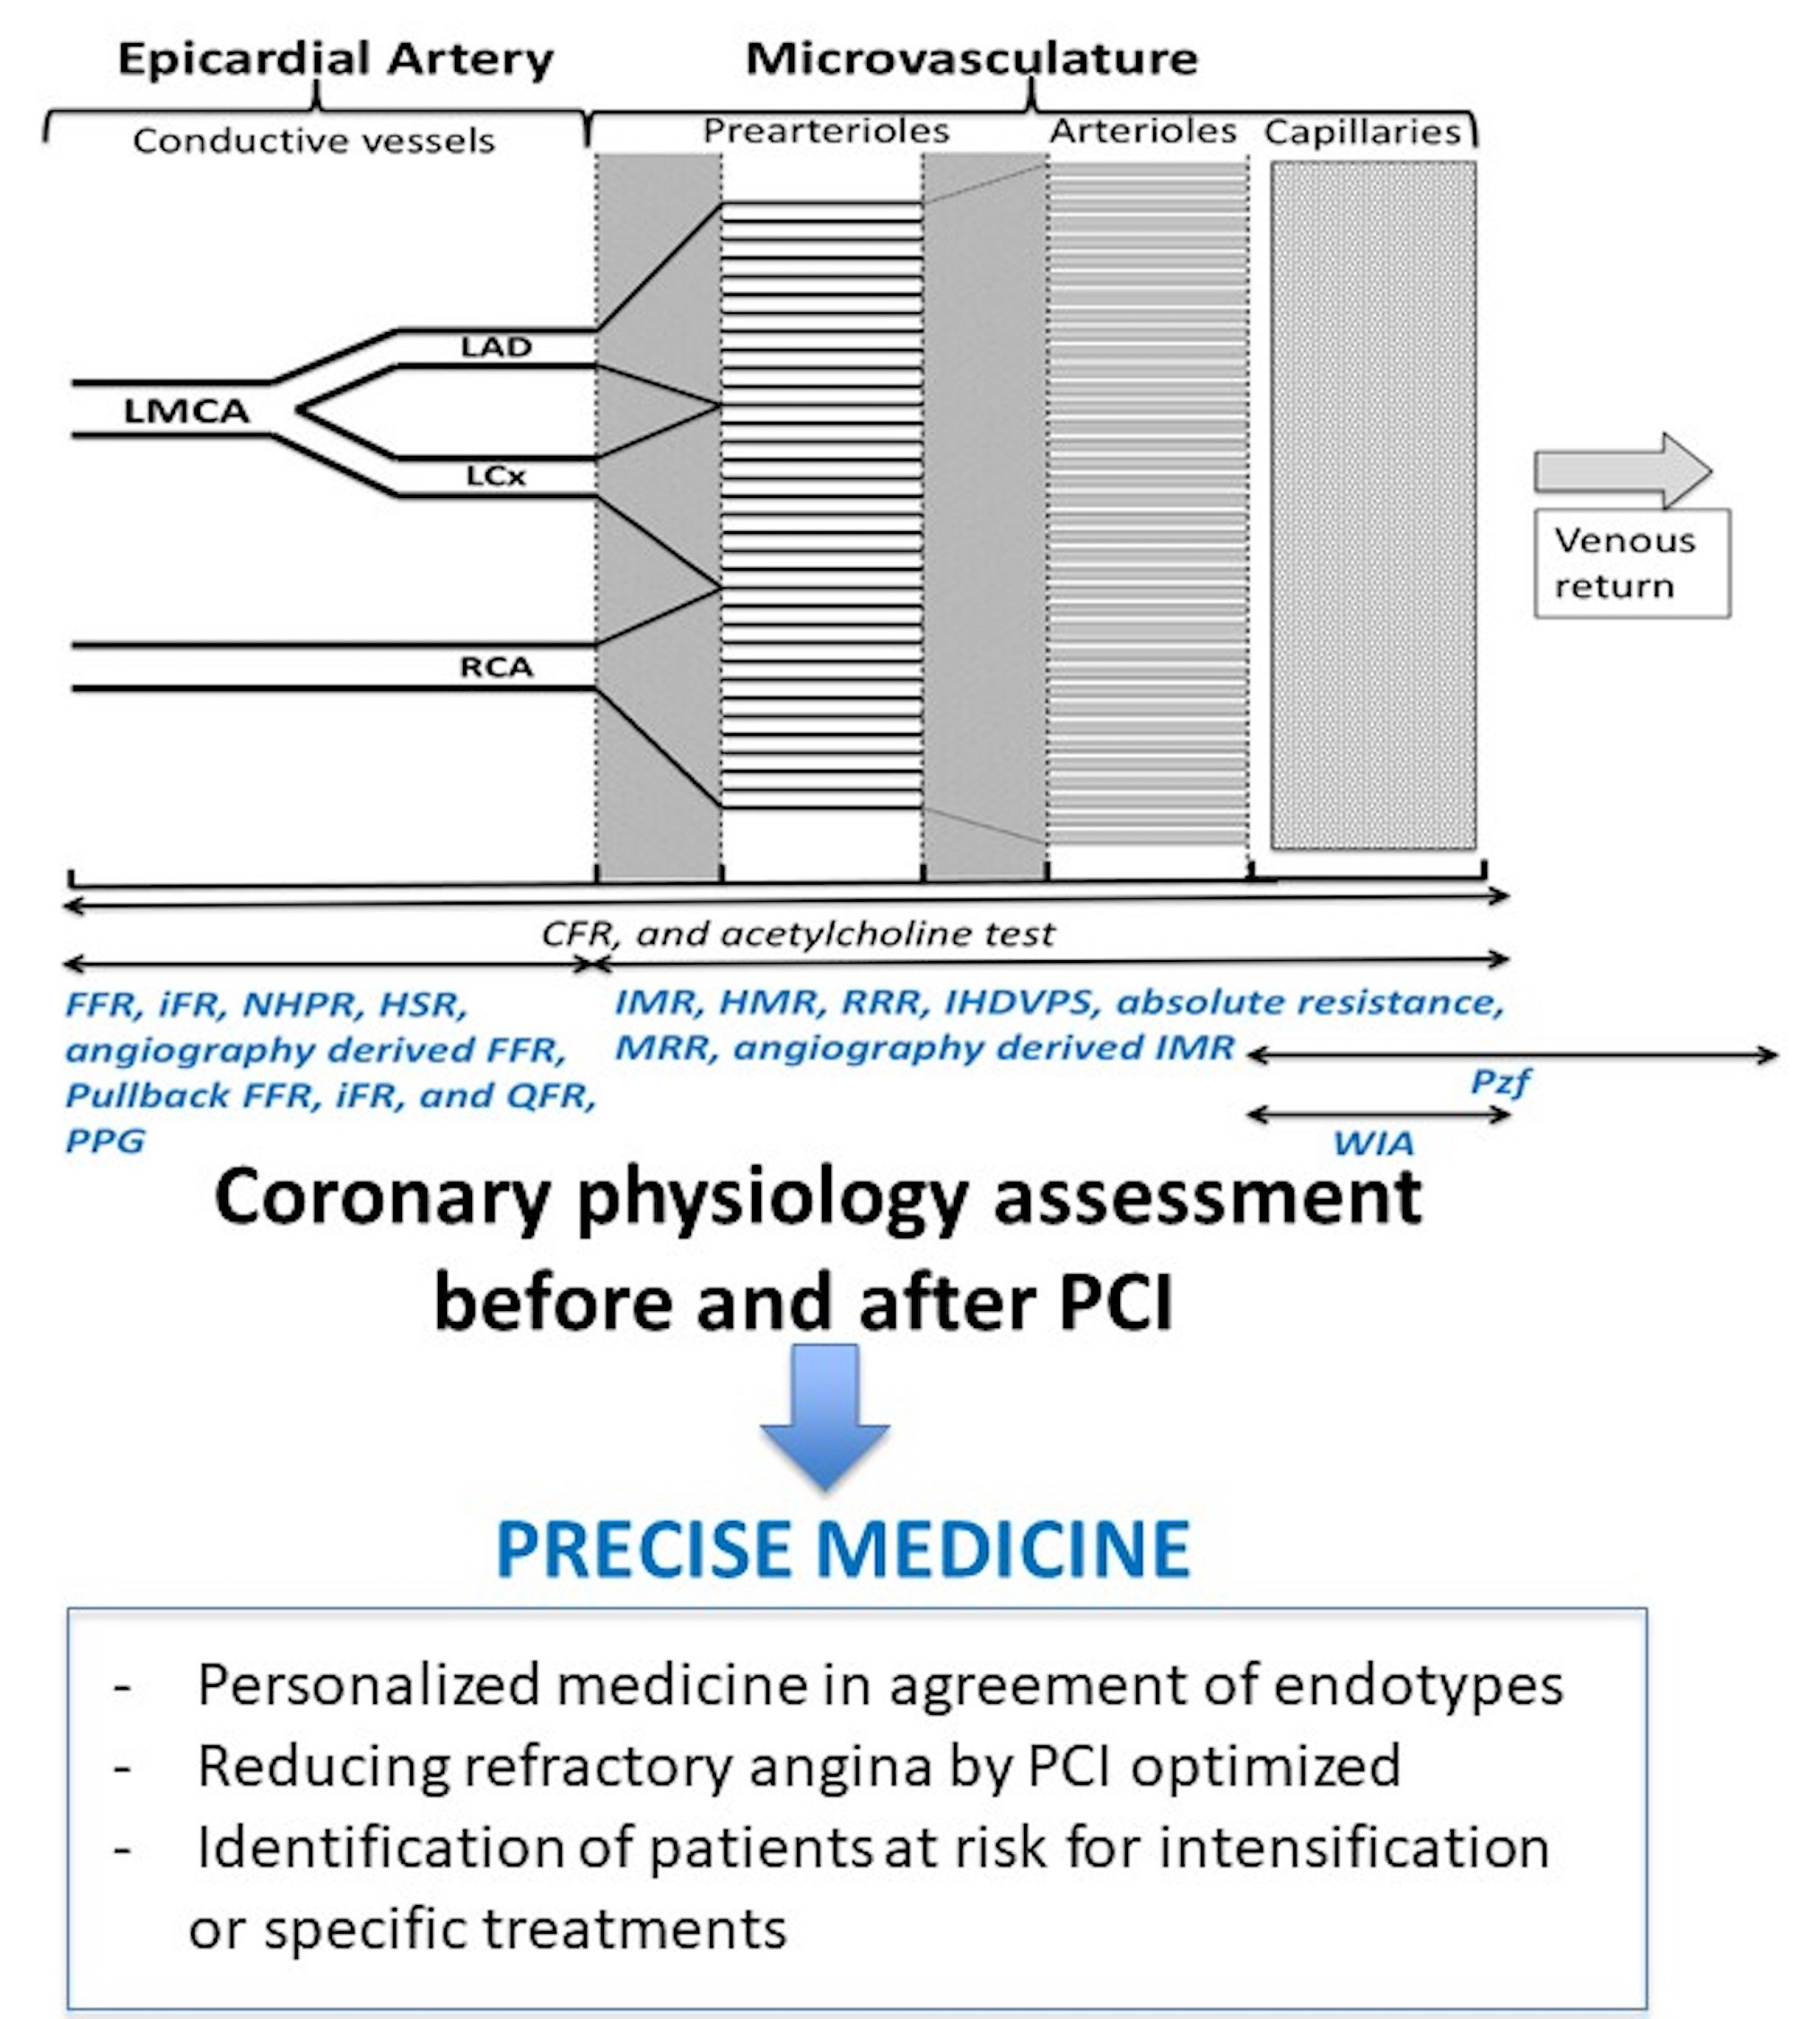 Fig. 1.
Proposition of utilization of coronary physiology assessment to precise medicine. CFR, Coronary flow reserve; FFR, fractional flow reserve; HMR, Hyperaemic Microvascular Resistance; HSR, Hyperaemic Stenosis Resistance; iFR, instantaneous wave-free ratio; IHDVPS, Instantaneous Hyperemic Diastolic Velocity Pressure Slope; IMR, Index of Microcirculatory Resistance; MRR, Microvascular Resistance Reserve; PPG, Pullback pressure gradient; Pzf, Zero-Flow Pressure; QFR, Quantitative Flow Ratio; RRR, Resistive reserve ratio; WIA, Wave Intensity Analysis.
CorMicA trial has paved the way for precision medicine in patients with ANOCA or INOCA by identification of endotypes. For the CMVD, an even more specific distinction can be recognized, i.e., structural and functional CMVD. Functional CMVD is distinguished by elevated CBF at rest, due to increased nitric oxide synthase (NOS) activity, and by normal maximal CBF during exercise. Alternatively, patients with structural CMVD present an endothelial dysfunction, which results in decreased peak CBF during exercise and normal CBF at rest [79, 80]. Whether functional and structural CMVD may translate into distinct prognosis or require distinct treatments warrants further investigation.
Following PCI and despite adequate anti-ischemic therapy, 20% to 30% of
patients continue to present angina [81]. Assessing coronary physiology after
angioplasty will provide access to data useful for the improvement of patient
management. First, coronary physiological assessment can detect microvascular
and/or vasospastic angina which may be associated with epicardial stenosis and
which will require an adjusted treatment [82]. Second, physiological indexes can
be used to detect and understand mechanisms of suboptimal PCI results associated
with wrong prognosis. Thus, an FFR
{maxPPG 20 mm/
MaxPPG is the maximum pressure gradient over 20 mm.
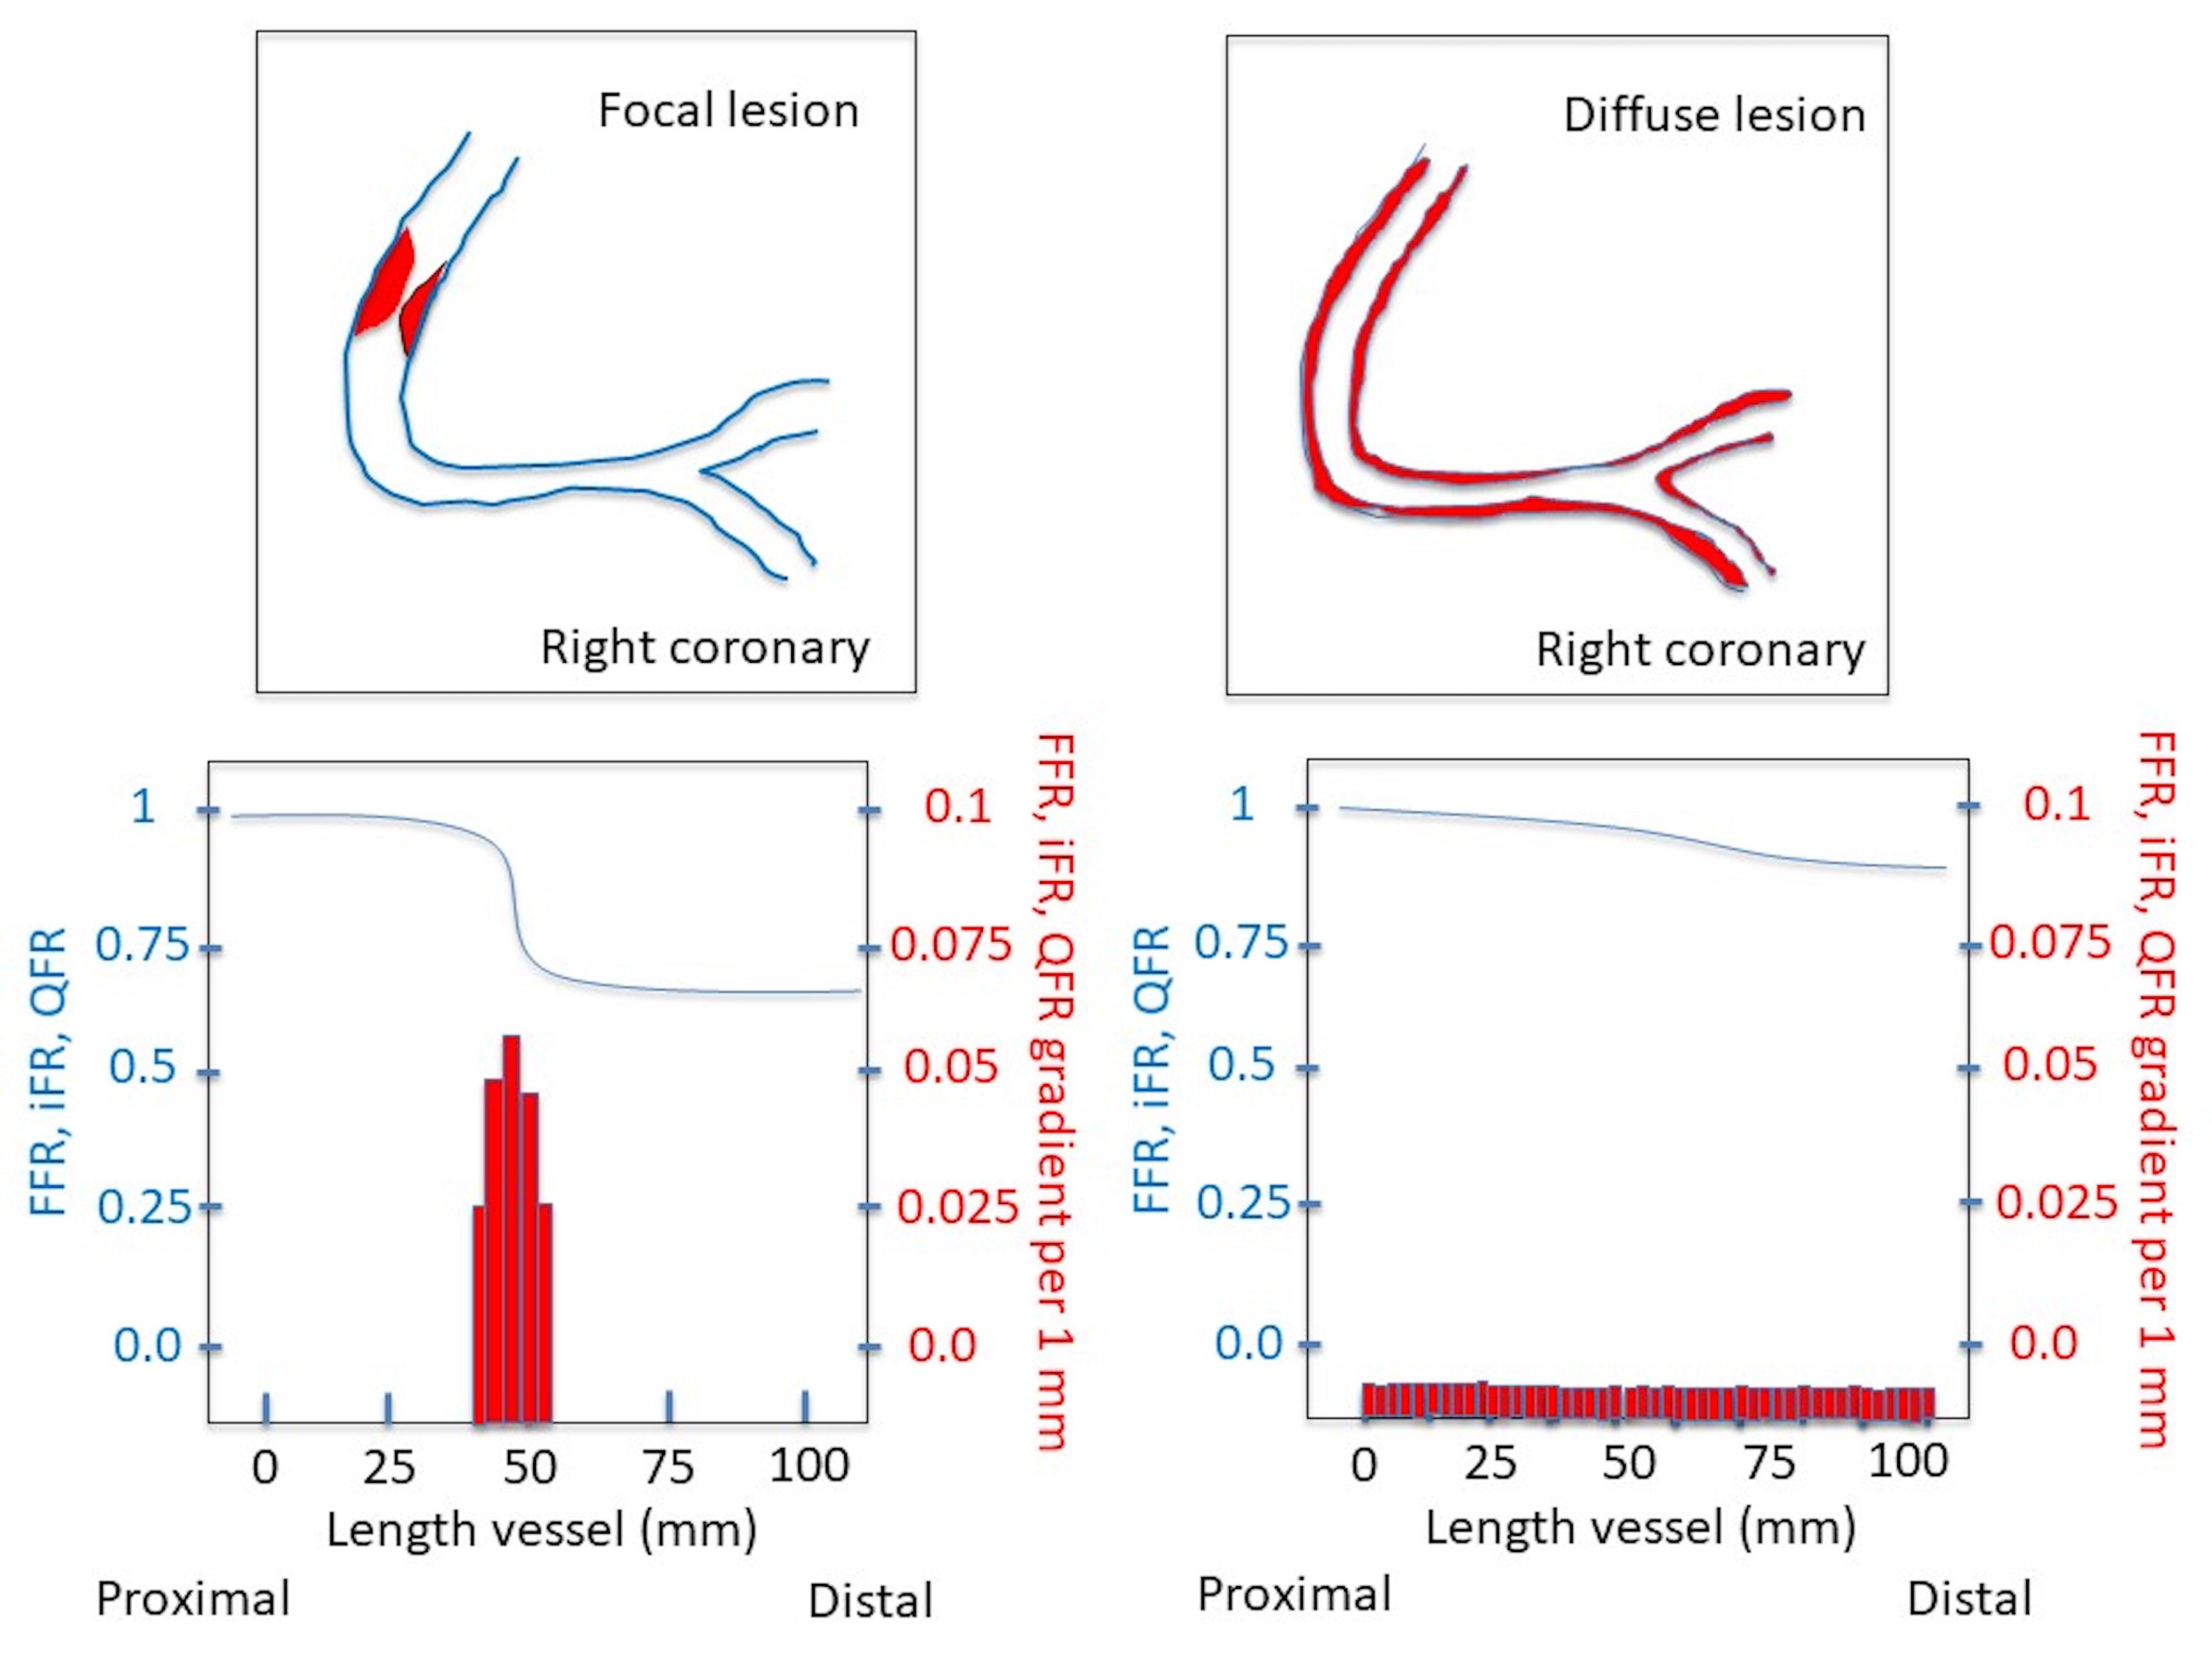 Fig. 2.
Schematic illustration of the use of pullback index by FFR, iFR and QFR to characterize a coronary lesion. FFR, fractional flow reserve; iFR, instantaneous wave-free ratio; QFR, Quantitative Flow Ratio.
However, the above mentioned pull back assessments are not yet supported by
prospective randomized studies and cut-offs for the prediction of clinical events
are not well defined. In this setting, the following sequence might reveal
useful. A Pd/Pa
In the perspective of stratified medicine, coronary physiological indexes may represent theragnostic biomarkers, i.e., metrics that predict the therapeutic response. IMR measured after PCI allows for the identification of a group of patients with adverse prognosis when using a categorical value of 25 [91].
All indexes have diagnostic cutoffs and some also have prognostic cutoffs (Table 2). Coronary physiological assessment could help identify patients at risk for adverse events. The identification of patients at higher risk of adverse events will provide the possibility to implement specific therapies aimed at microvascular recovery and will lead to closer follow-up. However, randomized clinical trials are needed to validate these strategies.
| Cut off | Meaning | |
| FFR | - Pre PCI |
- Significant stenosis |
| - Post PCI |
- Worse prognosis | |
| iFR | - Pre PCI |
- Significant stenosis |
| - Post PCI |
- Worse prognosis | |
| Other NHPR | - Pre PCI |
- Significant stenosis |
| HSR | - Pre PCI |
- Significant stenosis |
| QFR, CAAS vFFR, FFRangio system | - Pre PCI |
- Significant stenosis |
| - Post PCI |
- Worse prognosis | |
| FFR CT | - Pre PCI |
- Significant stenosis |
| CFR | - Thermodilution |
- Worse prognostic |
| - Doppler |
||
| IMR | - |
- Microvascular dysfunction |
| - Post PCI |
- Worse prognostic | |
| HMR | - |
- Microvascular dysfunction |
| - Predictor of recurrent chest pain | ||
| RRR | - No clear cut off |
- CMVD diagnosis |
| - Lower is worse for prognosis | ||
| Absolute CBF and resistance | - NA | - NA |
| MRR | - NA | - NA |
| IHDVPS, Pzf, WIA | - NA | - NA |
| Same abbreviations in Table 1. | ||
The assessment of coronary physiology has become an indispensable technique for deciding on epicardial revascularization as well as for the exploration of the entire coronary tree and that of the coronary microcirculation in order to improve patient management. The range of available coronary physiological indexes has the potential to allow for individualized therapeutic strategies, therefore representing an additional step towards precision medicine.
Conceptualization—LMB and GBR; writing—original draft preparation—LMB, LR, GBR; writing—review and editing—SM, MC, EV, NP, OO, HB, CG, DF, GV, LD; visualization—LMB, LR, SM, MC, EV, NP, OO, HB, AB, CG, DF, GV, LD, and GBR; supervision—GBR. All authors have read and agreed to the published version of the manuscript.
Not applicable.
We would like to express our gratitude to all those who helped us during the writing of this manuscript. Thanks to all the peer reviewers for their opinions and suggestions.
This research received no external funding.
Gilles Barone-Rochette has received research grants from Merck Sharp and Dohme, and consulting fees from Bayer, Abbott vascular, Novo Nordisk, Sanofi, and AMGEN. The others authors declare no conflict of interest.