


1 Prevention of Metabolic Disorders Research Center, Research Institute for Endocrine Science, Shaheed Beheshti University of Medical Sciences, 1985717413 Tehran, Iran
2 Cellular and Molecular Endocrine Research Center, Research Institute for Endocrine Sciences, Shahid Beheshti University of Medical Sciences, 1985717413 Tehran, Iran
Academic Editor: Peter A. McCullough
Abstract
Given the high prevalence of cardiovascular disease, accurate identification of methods for assessing lipoprotein subclasses, mainly low-density lipoprotein (LDL) and high-density lipoprotein (HDL) subfractions, can play an essential role in predicting the incidence of cardiovascular disease such as heart attack. LDL and HDL subclasses differ in size, surface charge, lipid and protein compositions, and biological role. There is no “gold standard” method for measuring the LDL and HDL subclasses or standardizing the different methods used to measure their subfractions. Over the past decades, various techniques have been introduced to evaluate and measure subclasses of these two lipoproteins, each with its own advantages and disadvantages. Development of laboratory methods that accurately HDL and LDL function must be developed and validated to high-throughput for clinical usage. In this review study, we tried to examine different methods of evaluating various subclasses of LDL and HDL by mentioning the strengths and weaknesses of each.
Keywords
- laboratory assessment
- LDL
- HDL
- lipoprotein
- review
There is a substantial correlation between the prevalence of Cardiovascular disease (CVD) and serum concentration of LDL [1, 2]. The results of numerous reported studies have shown that more than 50% of patients with CVD have an abnormality in their lipid profile [3, 4, 5]. Also, it has been reported that there was a contra association between serum levels of HDL and CVD incidence.
On the other hand, treatment with some drugs such as statins, fibrates, bile
acid resins, and niacin reduces the concentration of LDL cholesterol and,
consequently, lessens cardiovascular disease incidence. Also, several
epidemiological studies and prospective randomized trials have repeatedly
demonstrated a strong inverse correlation between the magnitude of HDL
concentration and coronary heart disease (CHD) [3]. Each 10 mg/dL (0.26 mmol/L)
rise in HDL-C in the Framingham Heart Study reduced CHD mortality by 19% in
males and 28% in females [4]. A summary of the HDL cholesterol metabolism
process is shown in Fig. 1. As shown in Table 1 (Ref. [5, 6, 7, 8, 9, 10]), after synthesis in
the liver and intestine, apoA-I is induced pre-
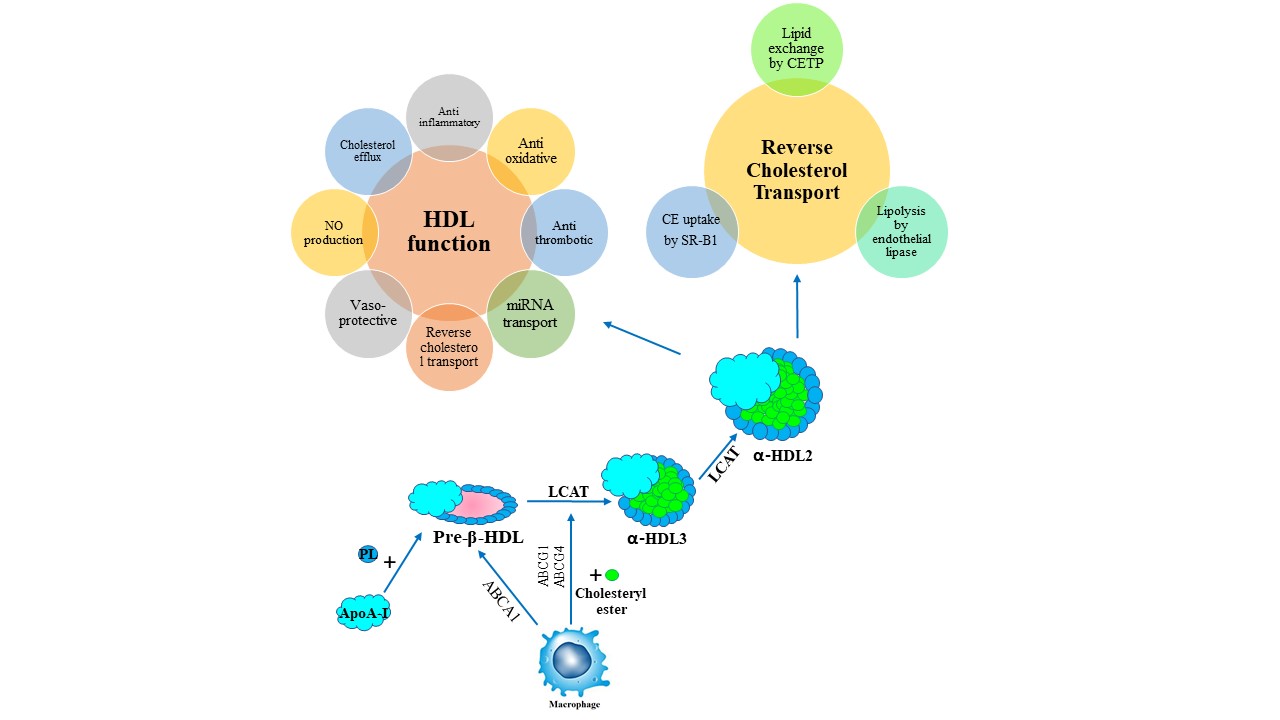 Fig. 1.
High-density lipoprotein metabolism and reverse cholesterol transport. ABCA1, ATP-binding cassette transporter A1; apoA-I, apolipoprotein A-I; CE, cholesteryl ester; CETP, cholesteryl ester transfer protein; Chol, cholesterol; HDL, high-density lipoprotein cholesterol; LCAT, lecitin-cholesterol acyltransferase; LDL, low-density lipoprotein cholesterol; LDLR, LDL-receptor; RCT, reverse cholesterol transfer; SR-BI, scavenger receptor class B type I; TG, triglyceride; VLDL, very low-density lipoprotein cholesterol.
| Techniques | Method strengths | Weaknesses of the method |
| Agarose gel electrophoresis [5] | Relative accuracy, ability to evaluate abnormal lipoproteins, ability to evaluate changed samples, ability to maintain the gel for the visual record | Dependence on the skill level of the operator, the relative automation of the method |
| Ultracentrifugation sequential [6] | Ability to assess the composition of lipoproteins | Tedious; large sample volume |
| LRC method [7] | Well standardized, relative accuracy in measuring subclasses of lipoproteins | Tedious; large sample volume |
| HPLC [8] | Ability to measure LDL subfractions based on particle size | Need to LDL isolation by ultracentrifugation before chromatography |
| LipoPrint [9] | Clinically available measurement technique, lesser extent charge | Access in a small number of medical laboratories |
| NMR [10] | High accuracy, high-performance speed | Access in a small number of medical laboratories, calibration, and validation issues |
| HPLC, high pressure liquid chromatography; NMR, nuclear magnetic resonance; LRC, lipid research clinics. | ||
In recent years, most medical guidelines and health-related associations have used traditional lipid profile biomarkers such as total cholesterol (TC), LDL, HDL, triglycerides (TG) to report risk factors associated with cardiovascular disease [12, 13].
However, in recent years, the evaluation of LDL and HDL subgroups has been introduced as a valid indicator of chronic diseases, especially CVD. The utility of non-traditional markers in risk assessment is best tested by combining them with a model that includes conventional risk factors [14, 15, 16].
The HDL family consists of different subclasses with a highly heterogeneous group of lipoproteins in a density range of 1.063 to 1.21 g/mL. Based on published ultracentrifuge analysis results, HDL includes different subfractions such as HDL1, HDL2, HDL3, and VHDL [17]. Different subfractions of HDL have been shown to have other physical-chemical and biochemical properties [18]. Researchers have reported that among different subgroups of LDL, smaller types are more easily absorbed by macrophages than larger types and are more susceptible to oxidative modification [19, 20]. On the other hand, the results of several studies have shown that oxidized LDL (Ox-LDL) is one of the main risk factors for cardiovascular disease and induces atherogenesis by promoting an inflammatory environment and lipid deposition in the arterial wall [21, 22].
Over the last few decades, the analytical chemistry correlated to HDL and LDL subclass evaluation has undergone considerable development [23, 24]. There is an increasing imperative to determine other HDL and LDL-related subclasses and functions in the context of current advances and identify biomarkers that better anticipate cardiovascular risk and can be used to determine the clinical favors of novel HDL LDL-targeted therapies [2, 25]. This need poses an opportunity for all scientists to take the lead in developing and validating such biomarkers. This review study focuses on laboratory assessment of HDL and LDL subclasses determination methods, which can play an important role in evaluating CVD and other chronic diseases.
It has been reported that the LDL family includes a wide range of subclass from
the very TG-enriched VLDL (density
Given that elevated levels of LDL and some of its subclasses are among the important risk factors involved in predicting cardiovascular disease, in recent years, several methods for evaluating LDL subclasses have been evaluated. Some of them are mentioned below.
Classification of LDL subfractions by ultracentrifugation methods requires either equilibrium or rate approaches. In this method, preparative fractionations can be performed by presenting serum or plasma to ultracentrifugation at the density of native non-protein solute, approximately 1.006 kg/L, to float TG-rich VLDL and chylomicrons retrieved by tube slicing or by aspirating with a syringe or pipette [27, 28]. The 1.006 kg/L lowest portion, the infranate consisting of LDL, HDL, IDL, and Lp(a), can be changed to 1.063 kg/L by adding a salt specially KBr and re-insert into the ultracentrifuge to float LDL, the amount of cholesterol, which is considered as an indicator of LDL. Due to the fact that performing the steps mentioned in the ultracentrifuge method for the separation of LDL subclasses is time consuming and technically tedious, simpler precipitation replaced it. In some research work, researchers routinely use a combination of sedimentation and ultracentrifugation methods to evaluate LDL subclasses [29]. As mentioned, one of the main impediments of the ultracentrifugation method is that it is time consuming and tedious, however, it is important to note that this method is very useful for the separation of highly labile lipoproteins and they can be changed with high salt concentrations and centrifugal forces. Another disadvantage of this method, as shown in Table 1, is that it requires many tubes and other laboratory equipment. Its accuracy varies from laboratory to laboratory and depends on the accuracy of the operator. In addition, the fractions obtained by this method may be very heterogeneous [30].
Different studies have shown that the evaluation of a lipoproteins subclass, especially LDL, provides an accurate estimate of lipoprotein metabolism and the risk of cardiovascular disease. Another method of evaluating lipoprotein subclasses is to separate them based on particle size using electrophoresis. Heterogeneity was first identified in subclasses of LDL using ultracentrifuge [31] and subsequently developed using density gradient ultracentrifugation (DGUC) [32] and gradient gel electrophoresis (GGE) [33]. Using this method, the researchers showed that plasma insulin is present in different subclasses based on density and size in three major fractions designated LDL-I to -III peak density intervals: 1.022–1.032 kg/L for LDL-I, 1.032–1.038 kg/L for LDL-II, and 1.038–1.050 kg/L for LDL-III) and a relatively minor fraction, LDL-IV (1.050–1.063 kg/L) [34]. Also, using this technique, the distribution pattern of LDL subclasses in a plasma sample was predicted. Various factors affect the pattern of insulin phenotype, including LDL size cutoffs, subfraction distributions, or algorithms such as electrophoretic mobility values [35] as this pattern includes either mostly large, buoyant LDL-I and II (pattern A), sdLDL-III (pattern B; LDL-III), or an intermediate pattern of LDL-II and III (pattern I; 40–50% LDL-III). HDL and LDL subfractions are usually separated on gradient polyacrylamide gel electrophoresis.
In the gel electrophoresis method, LDL subclasses move to the opposite pole in
an electric field, and special fat-staining is used to identify them. Although
this method was initially more of a qualitative evaluation technique, it was
converted to a highly efficient quantitative method by depositing electrophoresis
strips with chemical compounds such as phosphutangestate. A more convenient
alternative to the modified agarose gel for LDL subclass separation is the
addition of a magnesium-like cation that reduces the migration of
Several studies have compared these two techniques in evaluating LDL subgroups. Blake et al. [40] found a significant correlation between LDL particle sizes assessed by NMR and bench GE in healthy participants. Similar findings were found between NMR with bench GE-assessed LDL patterns in the other two studies [41, 42]. Witte et al. [43] found that in 324 males and females with and without type 1 diabetes, the mean difference (or mean bias by B-A LOA analysis) among evaluated LDL size on NMR and peak LDL size on GE was 53.8Å (with NMR yielding smaller measurements). In another study conducted on the 131 healthy participants, it has been reported that the accuracy of the NMR in classifying participants according to LDL subfractions pattern, especially sdLDL was higher than the GE. On the other hand, one of the disadvantages of electrophoresis compared to newer methods is that it is somewhat labor-intensive and technique-sensitive [44].
One of the alternative techniques for assessment of the LDL subfractions is
HPLC. The HPLC techniques are highly reproducible, accurate, and ideal for
studying a large series of samples. Limited studies have compared the two methods
and their accuracy in evaluating LDL subclasses. Scheffer PG. in a comparative
study evaluated the particle size of LDL obtained by HPLC and GE methods in
patients with type 2 diabetes. The results of this study showed that, LDL
particle determinations were highly correlated between the two methods (r = 0.88,
p
Atherosclerotic cardiovascular disease, particularly coronary artery disease (CAD), is closely associated with plasma concentrations of HDL. These observations have been reported in various cohort studies with high sample sizes [1]. It has also been shown that even in patients with low LDL-C levels, HDL-C is still a valid predictor of heart disease [46]. Different subclasses of HDL vary in size (from 7 to 17 nm) and shape (unfolded protein, discoidal and spherical) and finally lipidome or proteome [47, 48]. HDL calculation has been standardized, and existing precipitation methods reach a high degree of precision for clinical purposes. However, so far, a “gold standard” technique for evaluating HDL subclasses has not been introduced, and different techniques have their advantages and disadvantages. In the following, we will evaluate some of the measurement techniques of HDL subclasses [49].
Techniques used to isolate and measure HDL-C subclasses is shown in Table 2 (Ref. [50, 51, 52, 53, 54, 55, 56, 57, 58, 59]). Techniques such as ultracentrifugation (UTC) [60], electrophoresis [61], HPLC, precipitation-based methods [62], direct measuring methods, and NMR have been routinely used in recent years in research work to evaluate different subclasses of insulin. However, one of the standard methods for HDL subfraction evaluation is the cholesterol content in HDL particles after precipitation of apoB containing lipoproteins [50].
| Techniques | Advantages | Limitations |
| UC [51] | The first widely used method to separate the large buoyant HDL2 and the smaller, less buoyant HDL3 in plasma | The high salt concentration and the extreme g-force have been shown to significantly alter the composition and physicochemical properties of HDL that might influence some of the functional properties of the separated HDL fractions [59] |
| Single-step UTC: VAP assay [52] | Fast and use from whole plasma just one single predefined, narrow density ranges | Some HDL individual subpopulations cannot be isolated |
| Precipitation [53] | Separation based on ApoB depleted serum, cost, adequate access to this method in small laboratories | Proteins and apoE fraction confounders in HDL supernatant |
| Density gradient UTC [54] | Separation based on particle density, the standard method for lipoprotein method | High ionic strength and centrifugal force, High salt content that may affect the accuracy of the results |
| Gradient gel ND-PAGGE [55] | Separation by particle size, a sensitive method for evaluating insulin subclasses | Unable to separate pre |
| HPLC [50] | Separation based on the HDL particle size, rapid and accurate method | Access only in specialized laboratories, Albumin coelution with HDL fractions |
| NMR spectroscopy [56] | Separation based on the NMR signal of purified HDL, one of the convenient methods for measuring high volume samples, no prior sample manipulation | Lack of information on the composition of HDL subclasses, Inability to measure HDL subclasses with equal accuracy, Lack of detection of pre |
| LCAT assay [57] | Separation based on the Fractional esterification rate, less cost, faster performance | May not measure the initial esterification rate and may not reflect the turnover of cholesterol |
| LipoPrint [58] | Clinically available measurement technique, lesser extent charge | Access in a small number of medical laboratories |
| LCAT, lecithin cholesterol acyltransferase; ND-PAGGE, non-denaturant polyacrylamide gradient gel electrophoresis; HPLC, high-performance liquid chromatography; NMR, nuclear magnetic resonance; VAP, vertical auto profile; UC, density-gradient ultracentrifugation; UTC, ultracentrifugation. | ||
In this method, HDL-C is first separated by precipitating apoB containing lipoproteins from the serum samples, and in this process, researchers were used from a combination of polyanions, especially heparin–MnCl2, dextran sulfate–MgCl2 or phosphotungstate–MgCl2 and a divalent cation, such as magnesium, heparin–manganese, or calcium [63]. One of the advantages of this method is that it does not depend much on the operator’s skill and it is somewhat easy and fast to do, and it can evaluate HDL subgroups in both serum and plasma samples [64]. One of the drawbacks of this method by some researchers is the incomplete deposition of apo-B [65]. Also, some environmental factors (such as pH, ionic strength, temperature, and cryopreservation) and disease conditions such as hypertriglyceridemia, inflammation maybe affect the accuracy of the results obtained by this method [66].
One of the oldest methods for evaluating HDL-C subclasses is analytical UTC with
density gradient flotation. The UTC density gradient process is based on density
gradients. This technique is layered on the surface of a NaCl-KBr gradient using
a swinging-rotor, plasma, or serum, developed by the sequential layering of 4
separate densities of salt solution at +15
This technique can directly evaluate the four main lipoproteins as well as
lipoprotein (a) [Lp(a)] [69, 70]. This method is an inverted rate zonal, single
vertical spin, density gradient ultra-centrifugation technique that separates all
lipoproteins in
In this technique, plasma lipoproteins are isolated based on their
electrophoretic charge. In this method, lipoproteins are specifically stained
with fluorescent lipophilic dye before separation [73]. Using this method,
insulin lipoproteins are isolated in three major subclasses based on their
electrophoretic motion pattern, including fast (f): only
However, one of the main drawbacks of this method is the limited potential of quantification since the amount and fluorescence yield of the dye incorporated into lipoproteins is likely to vary with in-between lipoprotein subpopulations due to interindividual variations in their lipid content [78, 79].
This method is one of the very fast techniques for evaluating HDL subclasses. In this method, the separation of different subclasses of HDL through the emitted NMR and the amplitude of oscillation of this NMR, which is specific to each subgroup and can be measured. Also, in this method, using proton spectroscopy, the particle size of each subgroup is accurately measured. With the help of this method, HDL subgroups are classified into three small, medium, and large groups, with a size range of 7 to 14 nm [80].
Although there are different methods for evaluating LDL and HDL subfractions and they have been evaluated in some studies [59, 81], most of these methods are expensive and in some areas, especially in developing countries and low-income countries are not available. Various studies have evaluated the value of using different subclasses of LDL and HDL in predicting different diseases. Zeljkovic et al. [82] in a cross-sectional study on 200 hospitalised patient with acute ischemic stroke (AIS) were evaluated the association between HDL and LDL subclasses with AIS prediction. The results of this study showed that AIS patients had significantly more LDL III and IVb, but less LDL I and II particles. They also had significantly smaller HDL size, more HDL 3a, 3b and 3c and less HDL 2b subclasses. In this study, LDL and HDL particles were separated by gradient gel electrophoresisand serum lipid parameters were measured by standard laboratory methods. In another study, Oravec et al. [83] were assessed the association between HDL subfractions, which analysed by electrophoresis method, in patients with CVD and they found that In the patient group with the diagnosis of arterial hypertension and coronary heart disease, the large HDL subclass was significantly decreased and the small HDL subclass was increased. A number of other studies have pointed to the protective role of some HDL subgroups such as HDL-3 against the CVD [84]. In addition to CVD, some studies have even evaluated the association of LDL and HDL subfractions with other chronic diseases. Stevanovic et al. [85] in a case-control study included 84 patients with newly diagnosed colorectal cancer and 92 controls were evaluated LDL and HDL subclasses by gradient gel electrophoresis and found that patients had significantly smaller LDL and HDL diameters and greater proportion of small, dense LDL particles than controls. They concluded that decreased LDL and HDL diameters were independent predictors of colorectal cancer .
Generally, according to the recommendations of some scientific panels, there is no strong evidence for the use of HDL and LDL subtractions for initial clinical assessment or on-treatment management decisions in patients with low or intermediate risk for CVD [86]. On the other hand, some clinical conditions, such as Cholesteryl ester transfer protein (CETP) or CETP inhibitors, have been associated with striking changes in lipoprotein profile and composition. It also indicates that HDL-C concentration alone may not be adequate to assess the effect of this lipoprotein category on cardiovascular risk, as evidenced by the use of CETP inhibitors or the absence of a rise in carotid intima-media thickness in carriers of the apo A-I mutation despite very low HDL-C levels, implying that HDL quality, such as HDL subtype distribution and/or subtype features, maybe more helpful than HDL concentration [11, 87].
However, it seems that in areas where laboratory facilities are not available to assess LDL and HDL subclasses, clinicians can still use HDL and LDL concentrations to initial assess chronic disease. If facilities are available, it is recommended to use newer more accurate methods.
Given the importance of LDL and HDL in the pathogenesis of various diseases, especially cardiovascular disease, in this review study, we tried to explain the latest laboratory techniques used to evaluate these two lipoproteins by mentioning their strengths and weaknesses. To date, there is no “gold standard” method for measuring LDL and HDL subclasses, and all methods used have their strengths and weaknesses. It is necessary to develop newer methods to accurately measure the subtypes of these two lipoproteins and accurately identify their roles.
CVD, Cardiovascular disorders; DGUC, density gradient ultracentrifugation; CHD, coronary heart disease; IDL, Intermediate-Density Lipoprotein; CAD, Coronary Heart Disease; HDL-C, HDL cholesterol; GGE, gradient gel electrophoresis; NMR, Nuclear Magnetic Resonance; HPLC, High-performance Liquid Chromatography; VLDL, very-low-density lipoprotein; sdLDL, subfractions pattern especially; PAGE, polyacrylamide gel electrophoresis; VAP, Vertical auto profile.
The authors’ responsibilities were as follows: AC and MH—study design, data collection; AC—manuscript production and MH—editing of the manuscript.
Not applicable.
Not applicable.
This research received no external funding.
The authors declare no conflict of interest.