

 , Crischentian Brinza 1,2,†, Adrian Brezulianu 4,5,*, Adrian Covic 1,3,6
1 ‘Grigore T. Popa’ University of Medicine and Pharmacy, 700115 Iasi, Romania
2 Department of Interventional Cardiology - Cardiovascular Diseases Institute, 700503 Iasi, Romania
3 Academy of Medical Sciences, 030167 Bucharest, Romania
4 Tehnical University of Iasi ‘Gheorghe Asachi’, 700050 Iasi, Romania
5 GreenSoft Ltd, 700137 Iasi, Romania
6 Nephrology Clinic, Dialysis, and Renal Transplant Center—‘C.I. Parhon’ University Hospital, 700503 Iasi, Romania
† These authors contributed equally.
Academic Editor: Grigorios Korosoglou
Abstract
Sleepiness, fatigue, and stress in drivers are the leading causes of car crashes. In the late two decades, there is an endeavor to monitor vital signs, stress levels, and fatigue using adapted sensors supported by technological advances. To the best of our knowledge, this systematic review is the first to investigate the role of HRV measurement for sleepiness, fatigue, and stress level monitoring in car drivers. A search was performed in PubMed, Embase, and Cochrane databases using prespecified keywords. Studies were considered for inclusion if they reported original data regarding the association between different HRV measurements and drivers’ sleepiness, fatigue, or stress levels. Of the retrieved 749 citations, 19 studies were finally included. The sensibility and specificity of HRV significantly varied across studies, respectively 47.1%–95% and 74.6%–98%. Accuracy was also different, ranging from 56.6% to 95%. Nevertheless, in real-world conditions, confounding factors could affect sympathovagal tone and HRV. Multiple HRV parameters measurement rather than one parameter approach seems to be the optimal strategy for evaluating the vigilance state in drivers that it would be possible to achieve a good performance. As all studies were observational, data should be confirmed in randomized controlled trials. In conclusion, HRV represents a potentially valuable marker for sleepiness, fatigue, and stress monitoring in car drivers. HRV measurements could be implemented in future clinical models and sensors to detect early sleepiness and fatigue and prevent car crashes. More studies with larger populations are needed to support this evidence.
Keywords
- Heart rate variability
- Drivers
- Fatigue
- Sleepiness
- Stress detection
- Systematic review
Heart rate variability (HRV) defines the changes in the time interval of cardiac sinus node depolarization, thus reflecting a balance between sympathetic and parasympathetic nervous systems activity [1]. It seems that HRV is impacted by stress, current neurobiological evidence supporting its use for the objective assessment of psychological health, stress, and fatigue [2].
Neglected since the last guidelines published in 1996 by The Task Force of The European Society of Cardiology (ESC) and The North American Society of Pacing and Electrophysiology, HRV represents a reliable marker of cardiac function [3]. In the last decade, researchers revisited the idea of HRV measurement, as it could help to monitor vital signs, stress levels, and fatigue using adapted sensors, which are supported by technological progress. Moreover, it seems that HRV could have important clinical implications in various pathological conditions involving the heart, the brain, or the kidney [4, 5].
Although HRV measurement was adopted for sinus rhythm, there is increasing evidence of its usefulness in patients with atrial fibrillation for both detection and risk stratifying. The authors developed an algorithm for atrial fibrillation detection based on HRV measurements and atrial activity in one study. The results were impressive, as the proposed model had 98% sensitivity and 97.4% specificity [6]. Moreover, the HRV index was associated with a greater risk of cardiovascular death (p = 0.01) and all-cause death (p = 0.01) [7]. Besides cardiovascular implications, some HRV parameters could also be associated with mortality in patients with chronic kidney disease [8].
HRV could be measured using different parameters derived from time-domain methods, frequency-domain methods, and non-linear methods analysis. Time-domain methods represent the easiest way to assess HRV, expressed as fluctuations in heart rate and cycle length. Most parameters acquired from the time-domain analysis are based on normal-to-normal (NN) intervals, representing the intervals between consecutive QRS complexes [3, 9]. From the available time-derived parameters, four were recommended for evaluation by the Guidelines: standard deviation of all NN intervals (SDNN), the standard deviation of the average NN interval over short time divisions (SDANN), the square root of the mean squared differences of consecutive NN intervals (RMSSD) and HRV triangular index.
Usually, SDNN and HRV triangular index are used to appraise overall HRV [3]. Frequency-domain measurements imply an analysis of individual spectral components of HRV, ultra-low frequency (ULF), very low frequency (VLF), low frequency (LF), high frequency (HF). Subsequently, the power of each frequency band is calculated. Importantly, HRV using frequency-domain methods could be analyzed over short- or long-time intervals (2 minutes–24 hours) [3, 9]. However, variations in HRV are not linear, highlighting the complexity of modulation systems. The most used non-linear parameters for HRV assessment are represented by approximate entropy, sample entropy, S, SD1, SD2, and detrended fluctuation analysis [9].
Available data suggest that increased parasympathetic nervous system activity is associated with increased HRV. However, a plateau level could exist, beyond which a further increase in parasympathetic activity did not induce a higher HRV [10]. HF is associated with vagal activity regarding frequency-domain parameters, while LF is considered a marker of sympathetic activity. However, few studies suggested that LF might be reflecting both components of the autonomic nervous system. In addition, HRV response to autonomic nervous system modulation could be susceptible to high inter-individual variations [3]. Besides the physiological modulation of heart rate and, subsequently, of HRV, the correlation between HRV and heart rate could be described as a mathematical model of a non-linear inverse relationship [11].
Clinical studies consistently documented that HRV parameters are used in psychomotor vigilance evaluation, sleepiness, and fatigue detection [12, 13, 14]. Notably, HRV assessment, especially as frequency-domain, could detect sleepiness early, within minutes before falling asleep [15]. Thus, a practical application of HRV measurements could consist of activity state evaluation in drivers since sleepiness, fatigue, and drivers’ stress are the leading causes of car crashes [16, 17]. Some reviews in the literature investigated different approaches for sleepiness and fatigue detection in drivers; however, the authors focused on a variety of physiological signs, and the importance of HRV monitoring was only partly explored [18, 19, 20].
We aimed to systematically review the literature to investigate the importance of HRV assessment (expressed as time-domain measures, frequency-domain measures, or non-linear analysis) for sleepiness, fatigue, and stress level monitoring in drivers.
We conducted the present systematic review according to the updated Preferred Reporting Items for Systematic Review and Meta-Analysis (PRISMA) [21].
A literature search was performed from inception to June 15, 2021, in the following databases: MEDLINE (PubMed), Embase, and Cochrane. No time interval filter was applied. We also screened the cited articles and Google Scholar references, and a database of clinical trials (ClinicalTrials.gov) to find additional studies. According to the PRISMA search checklist, we included full search strategies for prespecified databases in Supplementary Table 1. In addition, we restricted the search to studies involving humans. In the search process, the following MeSH terms and keywords were used: “heart rate variability”, “sleepiness”, “drivers”, “accidents”, “mental fatigue” and “stress”.
Several inclusion criteria were prespecified: (1) studies involving adult humans
aged
In line with PRISMA recommendations, two independent investigators extracted the following data from each included study in the present systematic review: first author, year of publication, number of participants enrolled, age, investigated HRV parameters, setting, and reported results. We presented data as numbers, percentages, ranges of variation, median or mean values, confidence intervals, and p-values when available. If disagreements appeared, they were solved by consensus.
We appraised the quality of included observational studies using a National Institutes of Health (NIH) tool designed for studies without a control arm [22]. Briefly, this tool encompasses 14 signaling questions which help in evaluating the overall study quality.
Our endeavor in the prespecified databases retrieved 749 citations. After excluding duplicate references and citations based on title or abstract evaluation, 62 studies were left for eligibility assessment. Of the screened studies, 19 met the inclusion criteria and were included in our systematic review. The search and screening process were reported in Fig. 1.
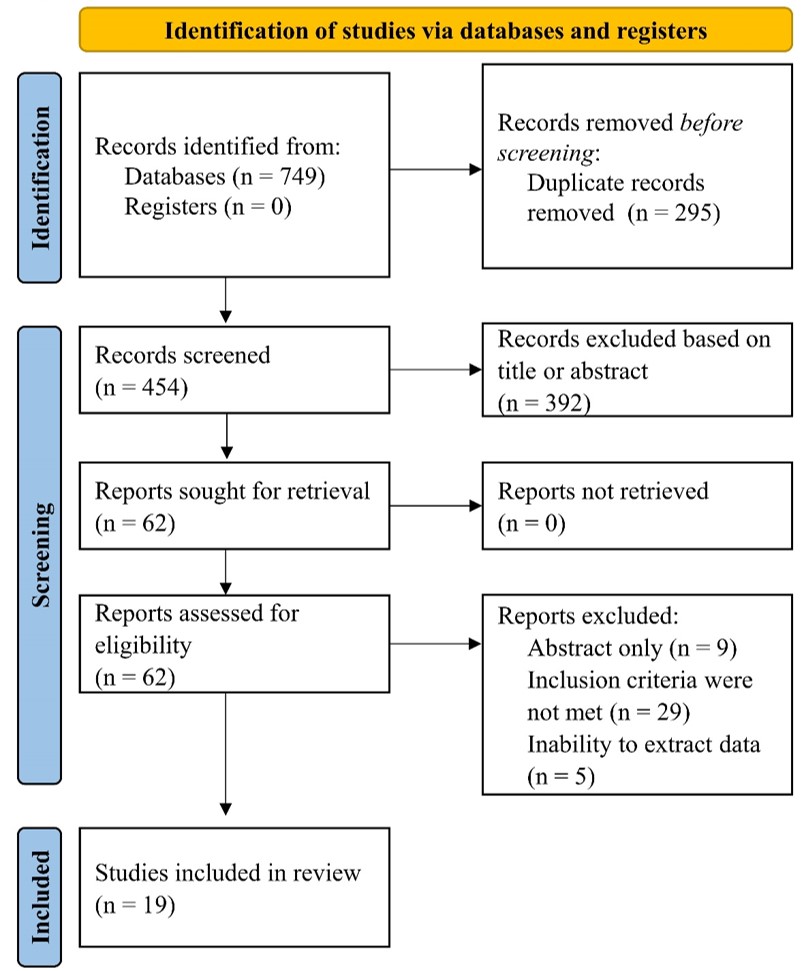 Fig. 1.
Flow diagram of selected studies in present systematic review. Our search in MEDLINE, Embase and Cochrane databases retrieved 749 references, from which 19 studies were included in this review after exclusion of citations based on title and abstract, duplicate references and those which did not meet the inclusion criteria.
All included studies had an observational, non-randomized design [15, 23, 24, 25, 26, 27, 28, 29, 30, 31, 32, 33, 34, 35, 36, 37, 38, 39, 40]. Data regarding participants enrolled in each study, investigated HRV parameters, clinical setting, and major findings were reported in Table 1 (Ref. [15, 23, 24, 25, 26, 27, 28, 29, 30, 31, 32, 33, 34, 35, 36, 37, 38, 39, 40]). The most of studies investigated the value of HRV measurements for sleepiness or drowsiness detection in drivers [15, 23, 24, 25, 26, 27, 29, 30, 31, 33, 34, 37, 39, 40], followed by stress [28, 35, 38] and fatigue [32, 36] detection. In addition, seven studies included drivers on real-roads [23, 24, 28, 33, 34, 35, 40], while the rest performed experiments on driving simulators. The quality of included studies in the present systematic review was low, given that all studies were observational and non-randomized, with a small number of participants included (Supplementary Table 2).
| Study, year | Patients, No | Age, median/mean |
Investigated parameters | Clinical setting | Findings |
| Abtahi, 2017 [24] | 10 | 38 |
Time-domain measures and frequency-domain measures | Drivers’ sleepiness on real roads (Karolinska Sleepiness Scale) | HRV measures could have potential use in sleepiness detection (individualized approach) |
| Statistically significant for severe sleepiness at 0.05 level: | |||||
| - SDNN 53.2 | |||||
| - SDANN 37.4 | |||||
| - SDNNi 377.8 | |||||
| - NN50 52.8 | |||||
| - LF 449.5 | |||||
| - HF 241.2 | |||||
| - TP 741.4 | |||||
| Buendia et al., 2019 [25] | 76 | 44.8 |
Time-domain measures and frequency-domain measures | Drivers’ sleepiness on a public motorway (Karolinska Sleepiness Scale) | HRV measures were associated with perceived sleepiness, irrespective of pre-processing methods |
| 45 |
Most HRV indices could distinguish between sleepy and alert drivers | ||||
| 35.4 |
|||||
| Fujiwara et al., 2019 [26] | 34 | 22.7 | Time-domain measures and frequency-domain measures | Drivers’ drowsiness in comparison with electroencephalography data for sleep scoring (simulator—virtual vehicle) | The developed algorithm based on HRV indices identified 12 of 13 pre-N1 episodes (electroencephalography data), with a false positive rate of 1.7 times per hour |
| Li et al., 2013 [27] | 4 | 26–33 | LF/HF ratio vs wavelet transform method | Drivers’ drowsiness detection (Karolinska Sleepiness Scale) | The wavelet method performed better than conventional LF/HF ratio: 95% accuracy (vs 68.8%), 95% sensitivity (vs 62.5%), 95% specificity (vs 75%) |
| Hendra et al., 2019 [28] | 4 | 22 | Time-domain measures and frequency-domain measures (LF and HF) | Drivers’ drowsiness detection based on HRV measures and radial basis functional neural network (driving simulator) | The developed model showed a 79.26% accuracy in drowsiness detection (30 s segmentation in RR interval) |
| Lee et al., 2007 [29] | 1 | 24 | Time-domain measures | Drivers’ stress detection in a laboratory and on real roads | Heart rate was increased in a stressful driving situation, but SDNN, RMSSD, and pNN50 parameters were decreased |
| At night driving, heart rate was lower, but SDNN, RMSSD, and pNN50 were higher | |||||
| Mahachandra et al., 2012 [30] | 16 | 42.5 |
Time-domain measures, frequency-domain and non-linear measures | Drivers’ sleepiness detection using a driving simulator (Karolinska Sleepiness Scale) | RMSSD performed better than other parameters in drivers’ sleepiness detection |
| A 28% decline of RMSSD is a valid and sensitive parameter for sleepiness detection | |||||
| Michail et al., 2008 [31] | 21 | 26.5 | Time-domain measures and frequency-domain measures | Drivers’ sleepiness and loss of control detection using a driving simulator | Lower values of LF and a lower LF/HF ratio were associated with sleepiness, hypovigilance state, and occurrence of driving errors |
| Murata et al., 2008 [32] | 5 | 21–26 | Time-domain measures | Drivers’ drowsiness detection based on HRV measures and electroencephalography data (in a laboratory) | HRV measures (RRV3) increased in the case of drowsy participants in concordance with electroencephalography data |
| Patel et al., 2011 [33] | 12 | 47 |
Time-domain measures and frequency-domain measures | Early detection of drivers’ fatigue based on HRV measures and neural network | The neural network based on HRV measures showed 90% accuracy in fatigue detection |
| analysis (driving simulator) | A lower LF/HF ratio was reported (1.2 | ||||
| Persson et al., | 18 (first experiment) | 41 (first experiment) | Time-domain measures and frequency- | Drivers’ sleepiness in real road driving | Mean accuracy 56.0 |
| 2019 [34] | 24 (second experiment) | 35 (second experiment) | domain measures | conditions (Karolinska Sleepiness Scale) | Mean sensitivity 47.1 |
| 44 (third experiment) | 44 (third experiment) | Mean specificity 74.6 | |||
| Confounding factors in the real world could modulate HRV measures | |||||
| Vicente et al., 2016 [35] | 30 | 25–60 | Time-domain measures and frequency-domain measures | Drivers’ drowsiness detection on a driving simulator and real roads | Drowsiness detection based on HRV measures: positive predictive value 0.96, sensitivity 0.59, specificity 0.98 |
| Sleep-deprivation state based on HRV measures: positive predictive value 0.80, sensitivity 0.62, specificity 0.88 | |||||
| HRV could improve car safety mechanisms | |||||
| Yu et al., 2016 [36] | 10 | 20–65 | Time-domain measures and frequency-domain measures | Drivers’ stress evaluation on-road driving experiments | HRV based on three parameters: mean RR, SDNN, and HRV triangular index were associated with drivers’ stress level |
| Frequency-domain measures were not associated with stress levels | |||||
| Zhao et al., 2012 [37] | 13 | Time-domain measures and frequency-domain measures | Drivers’ mental fatigue on a driving simulator | At the end of the driving task, LF increased (from 732.7 to 1057.5, p = 0.009), but HF decreased (from 859.03 to 626.18, p = 0.039), suggesting that sympathetic activity is predominant after the task | |
| Abe et al., 2016 [38] | 27 | 20–49 | Time-domain measures and frequency-domain measures | Drivers’ drowsiness detection on a driving simulator | The developed model showed a 68% average sensitivity in drowsiness detection |
| Drowsiness was detected in 7 out of 8 participants based on HRV measurements and multivariate statistical process control | |||||
| Li et al., 2002 [39] | 8 | 24.87 | Frequency-domain measures (TP, LF, HF, LF/HF). | Drivers’ mental stress and workload (experimental vigilance task) on a driving simulator | After performing the vigilance task, LF increased (p |
| Awais et al., 2017 [40] | 22 | 18–35 | Frequency-domain measures (VLF, LF, HF, LF/HF) | Drivers’ drowsiness detection on a driving simulator | VLF, LF, HF, and LF/HF were different between alert and drowsy drivers (p |
| HRV parameters accuracy = 70% | |||||
| EEG combined with HRV accuracy = 80.9% | |||||
| Rodriguez- | 10 | 41 |
Time-domain measures and frequency- | Professional drivers’ drowsiness detec- | Alert vs drowsy states: |
| Ibanez et al, | domain measures | tion on real highway roads | - SDNN 63.6 | ||
| 2012 [41] | - LF/HF 3.18 | ||||
| Furman et al.,2008 [16] | 10 | 22–40 | Time-domain and frequency-domain measures (VLF, LF, HF, LF/HF) | Early sleepiness detection on a driving simulator | VLF decreased consistently within 5 minutes before falling asleep |
| HF increased within seconds before falling asleep | |||||
| LF/HF decreased within minutes before falling asleep | |||||
| HF, power in high-frequency range; LF, power in low-frequency range; NN50, number of pairs of adjacent NN intervals differing by more than 50 ms in the entire recording; pNN50, NN50 count divided by the total number of all NN intervals; RMSSD, the square root of the mean of the sum of the squares of differences between adjacent NN intervals; SDANN, standard deviation of the averages of NN intervals in all 5 min segments of the entire recording; SDNN, standard deviation of all NN intervals; SDNNi, mean of the standard deviations of all NN intervals for all 5 min segments of the entire recording; TP, total power; VLF, power in a very-low-frequency range. | |||||
Sensitivity and specificity of HRV for sleepiness and fatigue detection varied across studies, respectively from 47.1% [33] to 95% [26] and from 74.6% [33] to 98% [34]. Accuracy reported in studies was also different, ranging from 56.6% [33] to 95% [26]. Potential confounding factors could partly explain these discrepancies in real-road driving situations, which might influence the balance between parasympathetic and sympathetic activities and, subsequently, HRV measurements.
Overall, results reported in studies included in the present systematic review
were consistent across studies. Sleepiness and drowsiness were associated with
higher HRV, while drivers in alert states exhibited lower HRV but increased heart
rate. Regarding frequency-domain measurements, drowsy drivers had higher HF power
and reduced LF/HF ratio, reflecting an increased parasympathetic activity.
However, in one study, the authors observed somewhat different results [40]. HRV
time-domain parameter, SDNN, was increased in drowsy drivers (p
One study evaluated the importance of HRV for drowsiness detection and compared it with electroencephalography (EEG) data [25]. The developed HRV-based algorithm detected 12 out of 13 pre-N1 episodes (transitional sleep), suggesting that HRV could be a valuable parameter for drowsy state monitoring in drivers. Similar and concordant results between HRV and EEG recordings were reported in another study [31]. Moreover, to achieve better accuracy for sleepiness detection, HRV measurements could be combined with EEG data recorded using an additional electrode. In one study, authors proposed a model which included EEG and HRV data, with 80.9% accuracy [39].
Notably, the authors from one study [32] developed HRV based model using
artificial intelligence (neural network analysis) and observed an excellent
accuracy for fatigue detection (90%). Also, LF/HF ratio decreased to 1.2
HRV parameters appeared to help fall asleep detection within several minutes before the event occurrence [15]. Power decrease in VLF band preceded falling asleep event in drivers with 5 minutes. LF/HF ratio also showed a decreased value within minutes previous to falling asleep. Although this evidence suggests that HRV could represent an early and valuable marker of sleepiness detection, results are limited by the small number of drivers enrolled (n = 10) and should be confirmed in more extensive trials.
Concerning stress evaluation in drivers, three studies [28, 35, 38] revealed that HRV measured by time methods was lower in stressful driving situations. However, data on frequency-domain measures were discrepant. One study concluded that frequency-domain parameters were not associated with stress levels in drivers [35], while another study observed an increased LF and a higher LF/HF ratio [38].
To the best of our knowledge, this systematic review is the first to investigate the role of HRV measurement for sleepiness, fatigue, and stress level monitoring in car drivers. Currently, fatigue detection systems for drivers are based on algorithms that involve monitoring steering movements patterns (e.g., Bosch [41]) or detecting eye/pupil movements [42, 43].
Recently, HRV monitoring gained interest, as it appears to be a reliable marker of worse outcomes in various pathological conditions. One meta-analysis which involved patients without cardiovascular disease revealed that a reduced HRV was associated with a greater risk of first adverse cardiovascular events, up to 45% [44]. Also, HRV measured as both time- and frequency-domains was associated with cardiovascular risk in another study [45]. Moreover, patients with heart failure or myocardial infarction and a decreased HRV exhibited a higher mortality risk [46].
As HRV parameters were linked to psychomotor vigilance in clinical studies [12, 13], drivers seem to be an appropriate population to benefit from HRV monitoring. Newly developed wireless sensors supported this for vital signs assessment which allows remote control data collection and interpretation. One study proposed a device that used a photoplethysmographic signal with a good performance reported in measuring both time- and frequency-domain parameters [47]. A complex system was recently described, which used artificial intelligence to achieve a reasonable measure performance and integrate most parameters, including time- and frequency methods and non-linear data. Moreover, feedback data are collected in order to achieve optimal function [48]. These data support integrating HRV parameters in future car devices based on artificial intelligence to improve traffic safety.
Notably, there are different wearable devices capable of HRV monitoring, like Bitt Faros, Bodyguard 2, Actiheart, and others [49]. These hardware and software features could represent the first steps for integrating HRV monitoring in cars, as it is required a device with reduced dimensions but with optimal performance, which would not affect the driving process. In this regard, a system was described for HRV measurement from the steering wheel, which displayed similar results with electrocardiography data [50].
Multiple HRV parameters measurement rather than one parameter approach seems to be the optimal strategy for evaluating the vigilance state in drivers that it would be possible to achieve a good performance. Using also frequency-domain parameters could help to create patterns of sleepy or stressed drivers. As reported in the studies included in the present systematic review, sleepiness was usually associated with high HF power and decreased LF power, while stress driving situations were associated with increased LF power and reduced and low HF power [23, 26]. However, HRV could be susceptible to variations due to external factors related to real-roads driving, like social stress, noise, and CO levels [51]. In this case, non-linear parameters, in addition to the others, might help to distinguish between different clinical states and to create specific patterns.
Moreover, HRV parameters could be combined with EEG data to increase sleepiness and stress detection [39]. In addition to vigilance detection in drivers, HRV could also be used to predict epileptic seizures, thus improving traffic safety [52].
Nonetheless, careful and standardized interpretation of HRV measurements is required, as many factors could influence it. First of all, time-domain and frequency-domain parameters could vary according to the length of the analyzed segment. Thus, variables measured from different length recordings should be compared cautiously. In addition, advanced age could be associated with lower HRV values [9]. In one study, women exhibited lower time-domain parameters and higher HF, reflecting the parasympathetic activity [53]. Moreover, HRV could fluctuate with heart rate, as slower heart rates are associated with higher HRV [9]. For this reason, HRV parameters should be measured according to the existing guidelines [3], so that reported results would be comparable between studies.
All studies included in our systematic review were observational, with a small number of participants, thus limiting the results. That is why more and more extensive clinical trials are required to confirm these data.
HRV represents a potentially valuable marker for sleepiness, fatigue, and stress monitoring in drivers. HRV measurements could be implemented in future clinical models and sensors to detect early sleepiness and fatigue and prevent car crashes. More studies with larger populations are needed to support this evidence.
AB and AC conceived and designed the study; CB, and AB performed the data aquisition; CB and ABr analyzed the data; CB and AB wrote the paper; ABr and AC revised the paper.
Not applicable.
Thanks to all the peer reviewers for their opinions and suggestions.
Romanian Academy of Medical Sciences and European Regional Development Fund, MySMIS 107124: Funding Contract 2/Axa 1/31.07.2017/ 107124 SMIS.
The authors declare no conflict of interest.
Supplementary material associated with this article can be found, in the online version, at https://rcm.imrpress.com/EN/10.31083/j.rcm2203090.