


1 Monash Cardiovascular Research Centre, MonashHeart and Department of Medicine (School of Clinical Sciences at Monash Health), Monash University and Monash Health, Clayton, 3168 Victoria, Australia
Academic Editor: Zhonghua Sun
Abstract
There are cross-sectional and longitudinal imaging studies using echocardiography and cardiac magnetic resonance in healthy adult subjects which have demonstrated associations of left ventricular (LV) structure and pump function with age. There are also cross-sectional data regarding the relationships of age with invasively measured left heart chamber pressures. Increasing age is associated with decreases in LV end-diastolic volume (LVEDV), end-systolic volume (LVESV), end-diastolic length (LVEDL), stroke volume (SV) and cardiac output (CO), and increases in relative wall thickness (RWT), LV mass/LVEDV ratio (LVMVR) and ejection fraction (LVEF). Older age is not accompanied by a change in mean left atrial (LA) pressure, but there is both direct and indirect evidence which suggests that LV end-diastolic pressure (LVEDP) increases with age. LVEDV remains lower in older than younger subjects during fluid infusion and the resulting increases in LA pressure. The combination of an increase in LVEF with reductions of both SV and CO demonstrates an age-related increase in divergence between LVEF and LV pump function. A lower LVEDV in older compared to younger subjects can be characterized as an aging-related decrease in LV capacity, with the higher LVEDP in older subjects also indicating a reduction of preload reserve.
Keywords
- Age
- Aging
- Left atrial pressure
- Left ventricle
- Left ventricular end-diastolic pressure
- Left ventricular mass
- Left ventricular volume
- Ejection fraction
- Stroke volume
- Cardiac output
It has now been recognized for more than three decades that a substantial proportion, and possibly as many as 50%, of subjects with heart failure not due to valvular heart disease have a normal or near-normal (“preserved”) left ventricular (LV) ejection fraction (EF) [2, 3, 4, 5]. The cause of the symptoms and signs in heart failure with preserved EF (HFpEF) has generally been assumed to be diastolic dysfunction, but the nature of the changes in LV structure and function associated with the development of heart failure has been the source of considerable interest and debate [6, 7, 8, 9]. Furthermore, the disappointing results from randomized trials of drug therapy in HFpEF [10, 11, 12, 13] provides a compelling rationale for ongoing investigation into the pathophysiology of this condition.
Of the predictors of HFpEF, there is strong evidence that age is of fundamental importance as HFpEF is most frequently seen in the elderly and is rarely seen before middle age [5, 14, 15]. It can thus be argued that LV structural and/or functional changes which occur during aging but in the absence of heart failure are likely to be an essential facet of any attempt to improve our understanding of HFpEF. There are well-described, but possibly under-appreciated, effects of aging on the left ventricle and the aim of this review is to provide a summary of: (1) the data from cross-sectional and longitudinal echocardiographic and cardiac magnetic resonance (CMR) studies which have measured aspects of LV structure and pump function in healthy adult subjects of varying ages, and of (2) the data from invasive studies which have investigated aging effects on left atrial (LA) pressure and LV end-diastolic pressure (LVEDP), and (3) to consider some of the pathophysiological implications of these findings. The term pump function has been used in this review to refer to stroke volume (SV) and cardiac output (CO), with the understanding that LVEF has no direct relation to either of these variables. Although aging effects on LV long-axis function and strain are likely to also be important in the pathophysiology of HFpEF they have been considered to be outside the scope of this article.
Echocardiographic studies in which age was considered as a determinant of LV wall thickness, diameter and/or volumes in healthy subjects, and which included data from at least 100 individuals, are listed in Table 1 (Ref. [16, 17, 18, 19, 20, 21, 22, 23, 24, 25, 26, 27, 28, 29, 30, 31, 32, 33, 34]), along with information regarding the age and sex of the cohorts. The statistically significant correlations of age with LV variables which were reported in these studies are also shown in Table 1 (Ref. [16, 17, 18, 19, 20, 21, 22, 23, 24, 25, 26, 27, 28, 29, 30, 31, 32, 33, 34]). LV mass (LVM) and LVM index (LVMi) data from the echocardiographic studies using M-mode have not been presented, in part because of evidence of the unreliability of echocardiographic assessment of LVM compared to CMR studies [35], but also because of doubts about the accuracy of echocardiography methods during aging. Thus, most published data on LVM has been based on a M-mode based formula which does not take into account the change in LV shape which occurs during the aging process (see evidence for this in sections 2.3 and 3.2).
| n | Males | Age range (years) | Echo techniques | Negative correlations with age | Positive correlations with age | |
| Gerstenblith et al., 1977 [16] | 105 | 100% | 25–84 | M-mode | PWT, PWTi | |
| Marchomichelakis et al., 1983 [17] | 100 | 100% | 20–70 | M-mode | SWT, PWT | |
| Knutsen et al., 1989 [18] | 190 | 50% | 21–69 | M-mode | SWT, PWT (both in females only) | |
| Shub et al., 1994 [19] | 111 | 42% | 21–82 | M-mode | SWT, PWT (both in females only) | |
| Ganau et al., 1995 [24] | 430 | 74% | 16–85 | M-mode | LVEDD | RWT |
| Slotwiner et al., 1998 [25] | 464 | 63% | 16–88 | M-mode | SWT, PWT, RWT | |
| de Simone et al., 2005 [26] | 393 | 58% | 18–85 | M-mode | RWT | |
| Daimon et al., 2008 [20] | 700 | 55% | 20–79 | M-mode & 2D | LVEDVi, LVESVi | SWT, PWT, EF (males only) |
| Gutenberg Heart Study, Wild et al., 2010 [21] | 1042 | 40% | 35–74 | M-mode | SWTi, PWTi, RWT | |
| Pfaffenberger et al., 2013 [22] | 622 | 47% | 17–91 | M-mode & 2D | LVEDD, LVEDV | SWT, SWTi |
| NORRE Study, Kou et al., 2014 [28] | 734 | 56% | 20–78 | M-mode & 2D | LVEDV, LVESV, LVEDVi, LVESVi, | EF |
| Vriz et al., 2019 [27] | 778 | 58% | 18–100 | M-mode & 2D | RWT | |
| Chahal et al., 2012 [30] | 978 | 63% | 54 |
3D | LVEDVi, LVESVi, | |
| Fukuda et al., 2012 [31] | 410 | 62% | 20–69 | 3D | LVEDV, LVESV, LVEDVi, LVESVi | LVMVR |
| Kaku et al., 2011 [32] | 280 | 49% | 1–88 | 3D | LVEDV, LVESV, SV, LVEDVi, LVESVi, SVi, LVEDD, LVEDL | LVMVR |
| Muraru et al., 2013 [29] | 226 | 45% | 18–76 | 3D | LVEDV, LVESV, LVEDVi, LVESVi, | LVMVR |
| NORRE substudy, Bernard et al., 2017 [33] | 444 | 42% | 19–75 | 3D | LVEDV, LVESV, SV, LVEDVi, LVESVi, SVi | EF (males only) |
| HUNT study, Stoylen et al., 2013 [23] | 1266 | 52% | 51 |
2D, M-mode & LVEDL | LVEDL | SWT, PWT, LVEDED, RWT |
| Framingham Heart longitudinal Study, Cheng et al., 2010 [34] | 4062 | 46% | 45 |
M-mode | LVEDD, LVESD, | SWT, PWT |
| Abbreviations: EF, ejection fraction; FS, fractional shortening; LVEDD, left ventricular end-diastolic diameter; LVEDDi, left ventricular end-diastolic diameter index; LVEDED, left ventricular end-diastolic external diameter; LVEDL, left ventricular end-diastolic length; LVEDV, left ventricular end-diastolic volume; LVEDVi, left ventricular end-diastolic volume index; LVESD, left ventricular end-systolic diameter; LVESDi, left ventricular end-systolic diameter index; LVM, left ventricular mass; LVMi, left ventricular mass index; LVMVR, left ventricular mass volume ratio; PWT, posterior wall thickness; PWTi, posterior wall thickness index; RWT, relative wall thickness; SV, stroke volume; SVi, stroke volume index; SWT, septal wall thickness; SWTi, septal wall thickness index. | ||||||
From as early as 1977, evidence was becoming available from cross-sectional M-mode studies that aging was associated with changes in LV structure. Gerstenblith et al. [16] reported positive correlations of age with posterior wall thickness (PWT) and PWT indexed (PWTi) for body surface area (BSA) in males of age 25–84 years. Marcomichelakis et al. [17] reported positive correlations of age with septal wall thickness (SWT) and PWT in healthy male subjects without hypertension of age 20–70 years. In contrast, in a study of 190 healthy subjects of age 21–69 years (50% men), Knutsen et al. [18] reported that age was positively correlated with SWT and PWT in women only, and similarly, in 111 healthy subjects of age range 21–82 years (58% women), increases in SWT and PWT with age were reported in women, but not in men [19].
Correlations of age with LV wall thickness have been more consistent in the
larger studies. Daimon et al. [20] enrolled 700 healthy Japanese
volunteers of age range 20–79 years (45% women) who were free of cardiac
disease, hypertension and diabetes. SWT and PWT were positively correlated with
age in both men and women in this study. In a population-based echocardiographic
study (Gutenberg Heart Study) in individuals aged 35–74 years from Germany, 1042
male and female subjects were identified as being both free of, and low risk of,
cardiovascular disease [21]. With indexation to height, there were increases with
age seen in SWTi and PWTi in both men and women. Pfaffenberger et al.
[22] identified 622 male and female individuals of age range 17–91 years,
including subjects with obesity, who had echocardiographic studies requested for
clinical indications but who were found to be free of cardiac disease and
hypertension. Age was found to be a positive correlate of SWT independent of
height, weight and sex. The HUNT study of 1266 adult subjects (mean age 51
An inverse correlation of age with LV end-diastolic diameter (LVEDD) has been reported in some studies, but has been an inconsistent finding, particularly after indexation. Pfaffenberger et al. [22] reported age to be an inverse correlate of LVEDD, independent of height, weight and sex, whereas Gerstenblith et al. [16] reported no correlation of age with LVEDD in men and Knutsen et al. [18] found no correlations of age with LVEDD in men or women. Ganau et al. [24] studied 430 normotensive subjects of age range 16–85 years (26% women) and found age to be inversely correlated with LVEDD, but not with LVEDDi. In the HUNT study there was also an age-related decrease in LVEDD, but not in LVEDDi (with indexation to BSA) [23] and in the Gutenberg Heart study there was also no correlation of age with LVEDDi [21].
When relative wall thickness (RWT) has been calculated, aging-related increases in RWT have been consistently found in both men and women. Ganau et al. [24] reported a positive correlation of age with RWT, and the correlation of age with RWT remained significant after adjusting for sex, body mass index (BMI) and systolic blood pressure (BP). A study similar in both size and design, with 464 subjects without hypertension or cardiac disease of age range 16–88 years (27% women), found a positive correlation of age with RWT which was independent of sex [25]. Similarly, the Gutenberg Heart study and the Hunt Study both reported increases with age in RWT in both men and women [21, 23]. RWT was quantified in a study of 393 normotensive, non-obese adults of age range 18–85 years (42% women), RWT increased by 0.015 per 10 years, and this increase was seen in both males and females [27]. Vriz et al. [27] performed 2D echocardiography on 778 healthy volunteers of age range 18–100 years (58% male) and also found an age-related increase in RWT.
Reductions of LV end-diastolic volume (LVEDV), indexed LVEDV (LVEDVi), LV end-systolic volume (LVESV) and indexed LVESV (LVESVi) with age have been commonly reported in studies performing two-dimensional (2D) echocardiography measurements of the left ventricle in healthy adults of varying ages. Daimon et al. [20] reported inverse correlations of LVEDVi and LVESVi with age in men and women and Pfaffenberger et al. [22] reported age to be an inverse correlate of LVEDV independent of height, weight and sex. In the Normal Reference Range for Echocardiography (NORRE) study, there were 734 healthy volunteers of age range 20–78 years (56% male) who were not obese and indexation of chamber volumes was performed using BSA [28]. LVEDV, LVEDVi, LVESV and LVESVi all decreased with age in both sexes.
There are five three-dimensional (3D) echocardiographic studies in which the
relation between age and LV structure has been examined. Muraru et al.
[29] recruited 226 healthy adults (45% males) of age range 18–76 years and
measured LV volumes and mass using 3D techniques, with indexation to BSA. LVEDV,
LVEDVi, LVESV and LVESVi all decreased with age and the LVM/LVEDV ratio (LVMVR)
increased with age in both men and women. In a population-based study from
London, Chahal et al. [30] identified 3D echocardiographic studies with
satisfactory imaging quality in 978 individuals of Caucasian or Indian Asian
background of age 54
Kaku et al. [32] performed 3D echocardiography in 280 healthy subjects of age range 1–88 years (53% women). BSA increased during adult life to the 4th decade and then progressively decreased in subsequent decades. LVEDV, LVEDVi, LVESV, LVESVi, SV and indexed SV (SVi) all reached their peaks during the 3rd or 4th decades and then decreased during the remaining decades. LVEF was higher in women than men, but did not change with age. The LVMVR remained constant till the 6th decade of life but then increased, with a greater increase seen in women. An inverse correlation between LVMVR and SVi was evident. In a substudy of the NORRE study, comprising subjects who had images suitable for 3D measurements and representing 444 subjects out of the original cohort of 734, the age range of the subjects was 19–75 years and 42% were men [33]. There were inverse correlations of age with LVEDV and LVESV as well as with LVEDVi and LVESVi (with indexation to BSA).
In echocardiographic studies with 2D or 3D imaging, not all of which reported SV and SVi, there has been some variability in the findings of negative correlations of age with SV and SVi. In a combined group of males and females Kaku et al. [32] demonstrated decreases in SV and SVi after the 5th decade, Bernard et al. [33] reported decreases in SV and SVi with age in separate analyses of males and females, whereas Muraru et al. [29] only found a decrease in SVi with age in females. There has also been variability in findings from 2D and 3D studies with respect to the effect of age on EF. In the NORRE study, EF increased with age in both males and females [29], Daimon et al. [20] reported an increase in EF with age in males only, and Muraru et al. [29] reported an increase in EF with age in females only. In contrast, Kaku found no change in EF with age [33], and Chahal et al. [30] found no independent correlation of age with EF after adjustment for sex, blood pressure and ethnicity.
There have been two echocardiographic studies which have specifically addressed
the effect of aging on LV shape. In the 3D echocardiographic study of Kaku
et al. [32], LV end-diastolic length (LVEDL) was measured from the
mid-point of the mitral annulus to the apex using an end-diastolic cast of the
left ventricle based on semi-automatic recognition of the of the LV endocardial
border. Sphericity index was defined as the ratio between the measured LV volume
divided by the spherical LV volume, calculated as 4/3
The HUNT study was the first large population-based echocardiographic study to investigate the effects of age, sex and body size on LV end-diastolic external diameter (LVEDED) and it provided additional data on the relationship of age with LVEDL [23]. LVEDED was calculated by adding SWT to PWT and LVEDD, and LVEDL was calculated as an average of measurements from the apex to the mitral annulus at end-diastole for each of the 6 LV walls. In this study there was no change in BSA with age, but there was a trend to lower height and weight in the oldest group. There was an age-related increase in LVEDED and an age-related decrease in LVEDL and indexed LVEDL. The LVEDL/LVEDED ratio was calculated as a measure of LV sphericity and this was not related to sex or BSA, but it was inversely correlated with age, indicating an aging-related increase in LV sphericity.
As the findings from cross-sectional studies of healthy aging could be
confounded because analysis is limited to healthy survivors recruited at the time
of the study, it is of importance that there is one longitudinal study which
evaluated serial echocardiographic data regarding LV remodeling during aging.
Cheng et al. [34] analyzed up to 4 serial echocardiographic observations
obtained over a 16-year period in 4062 Framingham Heart Study participants of
mean age 45
| n | Males | Age range or mean |
Negative correlations with age | Positive correlations with age | |
| Hees et al., 2002 [52] | 336 | 40% | 21–96 | LVEDL, LVM (males only)LVEDL/LVEDD ratio | LV wall thickness, RWT (both in females only) |
| Alfakih et al., 2003 [48] | 60 | 50% | 20–65 | ||
| Hudsmith et al., 2005 [49] | 108 | 58% | 21–68 | LVEDVi, LVESVi, SVi, LVMi | EF |
| MESA substudy, Natori et al., 2006. [37] | 800 | 50% | 45–84 | LVEDV, LVESV, LVEDVi, LVESVi | LVM (males only) |
| Maceira et al., 2006 [50] | 120 | 50% | 20–80 | LVEDV, LVESV LVEDVi, LVESVi | EF |
| Nikitin et al., 2006 [47] | 95 | 41% | 22–91 | LVEDVi, LVESVi | LVMVR, EF |
| MESA study, Cheng et al., 2009 [36] | 5004 | 47% | 45–84 | LVM, LVMVR, LVEDV, LVESV, SV, EF | LVMVR |
| Chang et al., 2012 [51] | 124 | 52% | 20–70 | LVEDV, LVESV, LVEDVi, LVESVi (all in males only) | EF (males only) |
| Framingham Offspring Study, | 685 | 38% | 60.7 |
LVEDV, LVESV, SV, LVEDVi, | EF, LVMVR |
| Chuang et al., 2014 [39] | 61.7 |
LVESVi, SVi | |||
| Framingham Offspring Study, | 852 | 40% | 61 |
LVEDV, LVESV, SV, CO, LVMi, | EF, LVMVR |
| Yeon et al., 2015 [40] | 62 |
LVEDVi, LVESVi, SVi, Ci | |||
| Le Ven et al., 2016 [41] | 434 | 45% | 18–35 | LVEDV, LVESV (males only) | |
| TASCFORCE Study, Gandy et al., 2916 [43] | 1515 | 38% | LVEDVi, LVESVi, SVi, Ci | LVMVR, EF (females only) | |
| Parikh et al., 2106 [44] | 96 | 43% | 20–79 | LVEDVi, LVESVi, SVi, Ci | LVMVR |
| Li et al., 2016 [45] | 90 | 50% | 40–65 | LVEDV, LVEDVi, LVESV, LVESVi, SV, SVi | |
| UK Biobank Study, Petersen et al., 2017 [38] | 804 | 46% | 45–74 | LVEDV, LVEDVi, SV, SVi | LVMVR (females only) |
| Lei et al., 2017 [46] | 120 | 50% | 23–83 | LVEDVi, LVESVi (females only for both) | LV wall thickness |
| SHIP, Bulow et al., 2018 [42] | 634 | 47% | 20–80 | LVEDVi, LVESVi, SVi, LVMi (males only) | EF |
| MESA Longitudinal Study, Eng et al., 2016 [53] | 2935 | 47% | 54–94 | LVEDV, LVESV, SV LVEDVi, SVi | LVMi (males only), LVMVR |
| Abbreviations: Ci, cardiac index; CO, cardiac output; EF, ejection fraction; LVEDD, left ventricular end-diastolic diameter; LVEDL, left ventricular end-diastolic length; LVEDV, left ventricular end-diastolic volume; LVEDVi, left ventricular end-diastolic volume index; LVM, left ventricular mass; LVMi, left ventricular mass index; LVMVR, left ventricular mass volume ratio; RWT, relative wall thickness; SV, stroke volume; SVi, stroke volume index. | |||||
There are mostly consistent data from cross-sectional M-mode studies showing aging-related increases in LV wall thicknesses (with and without indexation) and increases in RWT, in both men and women. In contrast, the cross-sectional data regarding an age effect on LVEDD are not consistent, particularly when there has been indexing of LVEDD. Cross sectional studies using 2-D or 3-D volume measurements have in most cases demonstrated aging-related reductions in LVEDV, LVESV and SV, with and without indexation, and in both men and women. The two cross-sectional studies which studied LV shape have shown an aging-related reduction of LVEDL. There has only been one longitudinal echocardiography study and this reported increases in wall thickness and RWT, and decreases in both LVEDD and LVESD which were independent of body size.
CMR studies in which age was considered as a possible determinant of LVM and volumes and which specifically recruited healthy subjects, or alternatively, were a population study in which healthy subjects were identified, and which included at least 50 individuals, are listed in Table 2 (Ref. [36, 37, 38, 39, 40, 41, 42, 43, 44, 45, 46, 47, 48, 49, 50, 51, 52, 53]). Age range and sex, as well as any significant correlations of CMR variables with age are summarized in Table 2 (Ref. [36, 37, 38, 39, 40, 41, 42, 43, 44, 45, 46, 47, 48, 49, 50, 51, 52, 53]). In most of the CMR studies the scanner was 1.5 T but there were 4 studies which utilized a 3.0 T scanner. There was overlap of some of the publications, with subgroups included from the same cohorts, and the nature of any overlap has been explained in the text.
The Multi-Ethnic Study of Atherosclerosis (MESA) study was the largest CMR study
to examine age-related differences in LV structure and function and included 5004
subjects of age 45–84 years (47% males) who underwent CMR imaging and were free
of overt cardiovascular disease at the time of enrolment [36]. LVM decreased with
age (–0.3 g per year), but the LVMVR increased (+5 mg/mL per year, P
In a sub-study of the main MESA study, age-related differences in LV structure and function were examined in 400 men and 400 women between 45 and 84 years of age, randomly chosen after exclusion of subjects with traditional risk factors [37]. LVEDV, LVESV, SV, LVM and CO were all greater in men than women and LVEDVi, LVESVi and LVMi were also higher in men despite adjustment for height, weight or BSA. LVEF was higher in women. In men LVEDV, LVESV, LVEDVi and LVESVi were all inversely associated with age. In women LVEDV, LVESV and LVEDVi were inversely associated with age, whereas the correlation of LVESVi with age was only borderline significant (P = 0.08). In men there was an inverse correlation of age with LVM but not with LVMi, whereas in women there was no correlation of age with either LVM or LVMi.
In the UK Biobank study there were 804 subjects of age range 45–74 years (46%
males) who were selected on the basis that they had satisfactory imaging, were
Caucasian, were not known to have cardiovascular disease, hypertension or
diabetes, were non-smokers, and had a BMI
Chuang et al. [39] identified a healthy reference group from within the
Framingham Heart Study Offspring cohort of 685 adults of age 61
Yeon et al. [40] investigated LV volumes, mass, concentricity and LVEF
in a similar but slightly large cohort than Chuang et al. [40] from the
Framingham Heart Offspring Study, comprising 852 adults of 61
The effects of aging on LV volumes and mass by CMR in young adults was
investigated in a Quebec study of 434 Caucasian subjects of age 18–35 years
(45% male) [41]. There were a number of exclusion criteria to enable selection
of healthy subjects, and these included heart disease, hypertension, diabetes,
smoking, BMI
Bülow et al. [42] reported on findings from a reference population of 634 subjects aged 20–80 years (47% male) who were free of cardiovascular disease, hypertension and the presence of LV late gadolinium enhancement, this group identified from subjects who underwent CMR as part of the Study of Health in Pomerania (SHIP). Indexation was with BSA and all the indexed volumes and LVMi were larger in males, whereas LVEF was larger in females. LVEDVi, LVESVi and SVi all decreased with age and LVEF increased with age in both males and females, whereas LVMi decreased with age in males only.
As part of the Tayside screening for the prevention of cardiac events
(TASCFORCE) population study, Gandy et al. [43] performed a 3.0 T CMR
study on 1515 subjects of age
The effects of age on LV volumes and mass using CMR have also been examined in
smaller studies (50–150 subjects). Nikitin et al. [47] performed a CMR
study of 95 healthy subjects without cardiovascular disease, hypertension,
diabetes or obesity of age range 22–91 years (41% male). LVEDVi and LVESVi both
decreased with age, LVEF and LVMVR both increased with age, whereas there was no
age-related change in LVMi. Alfakih et al. [48] studied 60 subjects of
age range 20–65 years (50% male) who underwent CMR and were selected to be free
of cardiovascular disease, hypertension and diabetes. The LVEDVi was lower in
those 40 years and over, but this was not statistically significant. Hudsmith
et al. [49] performed CMR on 108 subjects of age range 21–68 years
(58% male) who were free of cardiovascular disease, hypertension and cardiac
risk factors. LVEDVi, LVESVi, SVi and LVMi were all lower in those subjects
A cross-sectional 1.5 T CMR study from 2002 provided information regarding sex-specific LV shape changes with age. Hees et al. [52] used CMR to measure LVM, LV wall thickness, LVEDD and LVEDL in a cross-sectional study of 336 healthy, normotensive adults of age 21–96 years (40% men). In women, LV wall thickness increased by 14% with age, LVEDD was unchanged, whereas LVEDL decreased by 9%. LVM did not vary with age in women but the LVEDL/LVEDD ratio decreased. In men, LV wall thickness and LVEDD were unrelated to age, but there was an 11% decrease in LVEDL, an 11% decrease in LVM, and similar to women, there was a decrease in the LVEDL/LVEDD ratio. In this study an increase in RWT with age was evident in women but not in men. While LV volumes were not reported, the age-related reduction of LVEDL, in the absence of any increase in LVEDD, implied a reduction in LVEDV with age. An important implication of the LV shape change (selective reduction of LV length and thus an increase in sphericity) with age observed in this study, and also reported in the HUNT study, was that previous calculations of LVM based on echocardiographic measures of LVEDD and wall thickness will have overestimated LVM in older individuals.
In a follow-up study from the MESA group, longitudinal changes in LV structure
and function were evaluated in 2935 subjects from the original cohort who
underwent repeat CMR imaging and had not experienced an incident coronary heart
disease event in the interim [53]. The subjects in the follow-up study were aged
54–94 years at follow-up, and 47% were men. The median time between baseline
and follow-up CMR imaging was 9.4 years. Over this period, LVM increased in men
and decreased slightly in women (8.0 and –1.6 g per decade, respectively;
P
There are mostly consistent data from many large cross-sectional CMR studies showing aging-related decreases in LVEDV and LVESV, with and without indexation, and in both males and females. LVMi has not shown a consistent relationship with age in cross-sectional studies, but similar to RWT, LVMVR increases with age in both males and females. SV and CO decrease with age, with and without indexation, whereas LVEF increases with age. The one available cross-sectional CMR study which measured LVEDL showed an aging-related reduction of LVEDL and increase in LV sphericity. The one available longitudinal CMR study showed decreases over time in LVEDVi and SVi, and increases over time in LVMVR, in both men and women. There was an increase in LVMi over time, but in men only.
There is data pertaining to the effects of aging on left heart pressures from a number of invasive studies, however, only a few of these studies were specifically designed to address this question, all the studies have been small, and there are no population-based studies. There are consistent results from small studies which show no effect of aging on left atrial (LA) pressure, but some inconsistency in the data regarding the effects of age on LV end-diastolic pressure (LVEDP). The absolute levels of pressures may not be comparable between the studies as the zero reference level method has not always been the same and indeed, has not always even been described. In some of these studies, there has also been LV volume data provided.
Higginbotham et al. [54, 55] performed right heart catheterization and
radionucleide angiography on 24 relatively sedentary male subjects of age range
20–50 years who were free of cardiac disease. The reference zero point was the
mid axillary line. The pulmonary artery wedge pressure (PAWP) was within the
normal range (
Prasad et al. [56] compared healthy but sedentary elderly (70
Carrick-Ranson et al. [57] evaluated the effect of age on LVEDV and SV
and the relationships of LVEDV and SV with PAWP. Seventy individuals were
enrolled who were not taking any cardiovascular medications, had a 24 hour blood
pressure
In the most recent study, Wolsk et al. [58] enrolled 62 subjects who were evenly distributed with respect to age and sex and were deemed healthy on the basis of history, echocardiography and exercise testing. The zero reference point method was not described. The mean (95% confidence limits of the mean) were reported and PAWP was similar in the age groups 20–39 years, 40–59 years and 60–80 years at 9 (8–9), 9 (8–10) and 8 (7–9), respectively. LVEDV was not statistically different between the 3 groups although it did appear to be lower in the older age groups at 94 (84–105) mL and 93 (83–104) mL, compared to the younger group 107 (90–123) mL. LVESV was significantly lower with increasing age at 42 (34–50) mL, 38 (32–43) mL and 33 (28–37) mL, respectively. None of LVMi, LVEF or SV were statistically different between the different age groups.
Esfandiari et al. [59] performed a systematic review of studies in
which PAWP was measured at right heart catheterization at rest and during
exercise in healthy individuals. There were 32 studies and 424 subjects, of whom
56% were untrained, 19% were women, and 31% were over the age of 40 years. The
resting PAWP in the supine position was similar for those of age
There has been no study of the effects of age on LVEDP in healthy volunteers,
but there are three studies which have reported LVEDP in subjects investigated
for possible cardiac disease who were found to be free of coronary disease, LV
systolic dysfunction and hypertension. Yamakado et al. [60] identified
55 subjects of age range 20–77 years who had undergone high fidelity measurement
of LV pressure, were free of hypertension and coronary disease and had a normal
LVEF, and found no correlation between age and LVEDP. On the other hand, LVEDP
was 10
In contrast to the report of Yamakado et al. [60], there are two
studies which have reported an increase in LVEDP with age. From patients who
underwent coronary angiography for evaluation of either chest pain or a cardiac
murmur, Merillon et al. [61] identified subjects without hypertension,
coronary artery disease or significant valvular disease and who had a normal LVEF
(63
In a subsequent study in which LVEDP was measured in patients who underwent
coronary angiography for evaluation of chest pain, Downes et al. [62]
also identified subjects with no obstructive coronary artery disease, no history
of hypertension and a normal LVEF. These subjects of age range 62–78 years were
compared with a group of 15 subjects of age range 29
In view of the inconsistent data from the above invasive studies, it cannot be said that the effect of healthy aging on the LVEDP is resolved, however, there is also indirect information which takes into account the mechanism for a divergence between the values of mean LA pressure and LVEDP which is relevant to this question. Thus, although mean LA pressure and LVEDP are recognized to be of similar magnitude in normal children and young adults [63], it has been shown in a number of studies that an increased LA contribution to LV filling will result in a LVEDP which is higher than the mean LA pressure [64, 65, 66]. Furthermore, the larger the LA contribution to ventricular filling, the higher the LVEDP can be relative to the mean LA pressure [66]. It is thus important that it has been demonstrated in nuclear [67, 68], echocardiographic [69] and CMR studies [70], that the percentage of LV filling for which atrial contraction is responsible increases substantially with aging. Therefore, in the setting of an age-related increase in the transmitral Doppler A to E wave ratio, the LVEDP might be expected to be higher than the mean LA pressure proportional to the increase in the LA contribution to filling. With this in mind, further examination of the results of the transmitral E/A ratio in the studies of Prasad et al. [56], Carrick-Ranson et al. [57] and Wolsk et al. [58], in all of which both PAWP was measured and Doppler echocardiography was performed, is of considerable interest. In all of these studies, the E/A ratio decreased substantially with age, whereas there was no relationship of age with PAWP. The LA pressure was likely to have been similar to the LVEDP in the younger adult groups in these studies based on invasive data relevant to this age group [63], in combination with the E/A ratio indicating a relatively small atrial contribution to LV filling. On the other hand, the higher A relative to E, reflecting both a lower E and a higher A in the older groups, indicates an increased atrial contribution to filling, suggests a higher LVEDP than LA pressure in the older groups and thus, is consistent with there being an increase in LVEDP with aging.
Several studies have investigated the effects of increases and decreases in
cardiac filling on LA pressure, LV volumes and Ci and found diminished responses
to these interventions with aging. Arbab-Zadeh et al. [71] studied 12
healthy sedentary seniors (70
Wolsk et al. [58] examined the effect of passive leg raising on healthy individuals of age range 20–80 years, grouped into age groups of 20–39 years, 40–59 years and 60–80 years. Although PAWP was similar in all the groups at baseline, leg raising resulted in a larger increase in PAWP in the oldest group. As mentioned above, there was a non-significant trend to a lower LVEDV in the oldest group, whereas LVESV was lowest in the oldest group. No LV volume data was acquired during leg raising. Neither was there any direct information regarding LVEDP acquired in this study or indeed, in any of the studies in which the effects of changes in intravascular volume on LV volumes have been investigated.
Not only does the LVEDV appear to be lower in older patients irrespective of the
PAWP, but there is also evidence suggesting that the range of possible volumes is
less. Thus, although it was not compared statistically in the study of
Arbab-Zadeh et al. [71], the range of mean LVEDV achieved during the
interventions and shown in the graphs (with PAWP levels varying between
~3 to 22 mmHg) appeared to be less in the healthy seniors
(~65–90 mL) than in the young subjects (~80–125
mL). Similarly, the range in mean LVEDVi for the groups obtained during the
interventions in the study of Carrick-Ranson et al. [57] was not
compared statistically, but also appeared to be greater in the youngest
(~58–73 mL/m
There is consistent evidence from echocardiography and CMR studies that healthy aging is associated with reductions in LVEDV, LVESV and SV independent of body size (Sections 2 and 3). There is also evidence from smaller studies that LVEDP increases with age, whereas the mean LA pressure does not change (Section 4). The mechanisms and implications of this combination of changes merits exploration, but has received relatively little attention in the literature. A conceptual framework which assists in this process is that a left ventricle can be thought of as having an intrinsic range of possible end-diastolic volumes, corresponding to LVEDPs varying from low to high (4–25 mmHg) (Fig. 1, Ref. [57]) [72]. Within this range, and assuming the absence of ischemia, the LVEDV at any point of time will be determined by the extent of LV stretch at end-diastole due to the amount of filling, with variations in filling affected by the intravascular volume, CO/venous return, heart rate and LA contraction, as well as effects of the pericardium and right heart pressure effects on the pericardial (and therefore the LV transmural) pressure. However, information that allows comparison of LV sizes between groups based on ranges of LVEDV has only occasionally been available [57, 73]. Instead, comparison has usually been based on volumes at a single point in time, in which case the LVEDV is limited to being within the possible range of volumes for that particular ventricle. The LVEDV will also be influenced by factors affecting the extent of LV filling at that point in time, and correspond with a specific LVEDP on the LV end-diastolic pressure volume curve. The studies in which ranges of volumes are available have used decreases and increases in LV filling and monitored change in PAWP, and have thus facilitated the comparison of LV volumes at different LA pressures [57, 73]. While these studies have provided useful information, an important limitation is that LVEDP was not measured, and it could be inappropriately assumed that PAWP and LVEDP are providing the same information (see Section 4 on LVEDP). In most studies when LVEDVs have been compared, this has occurred not only without knowledge of the LVEDP, but also in circumstances where the LVEDPs were not likely to be the same.
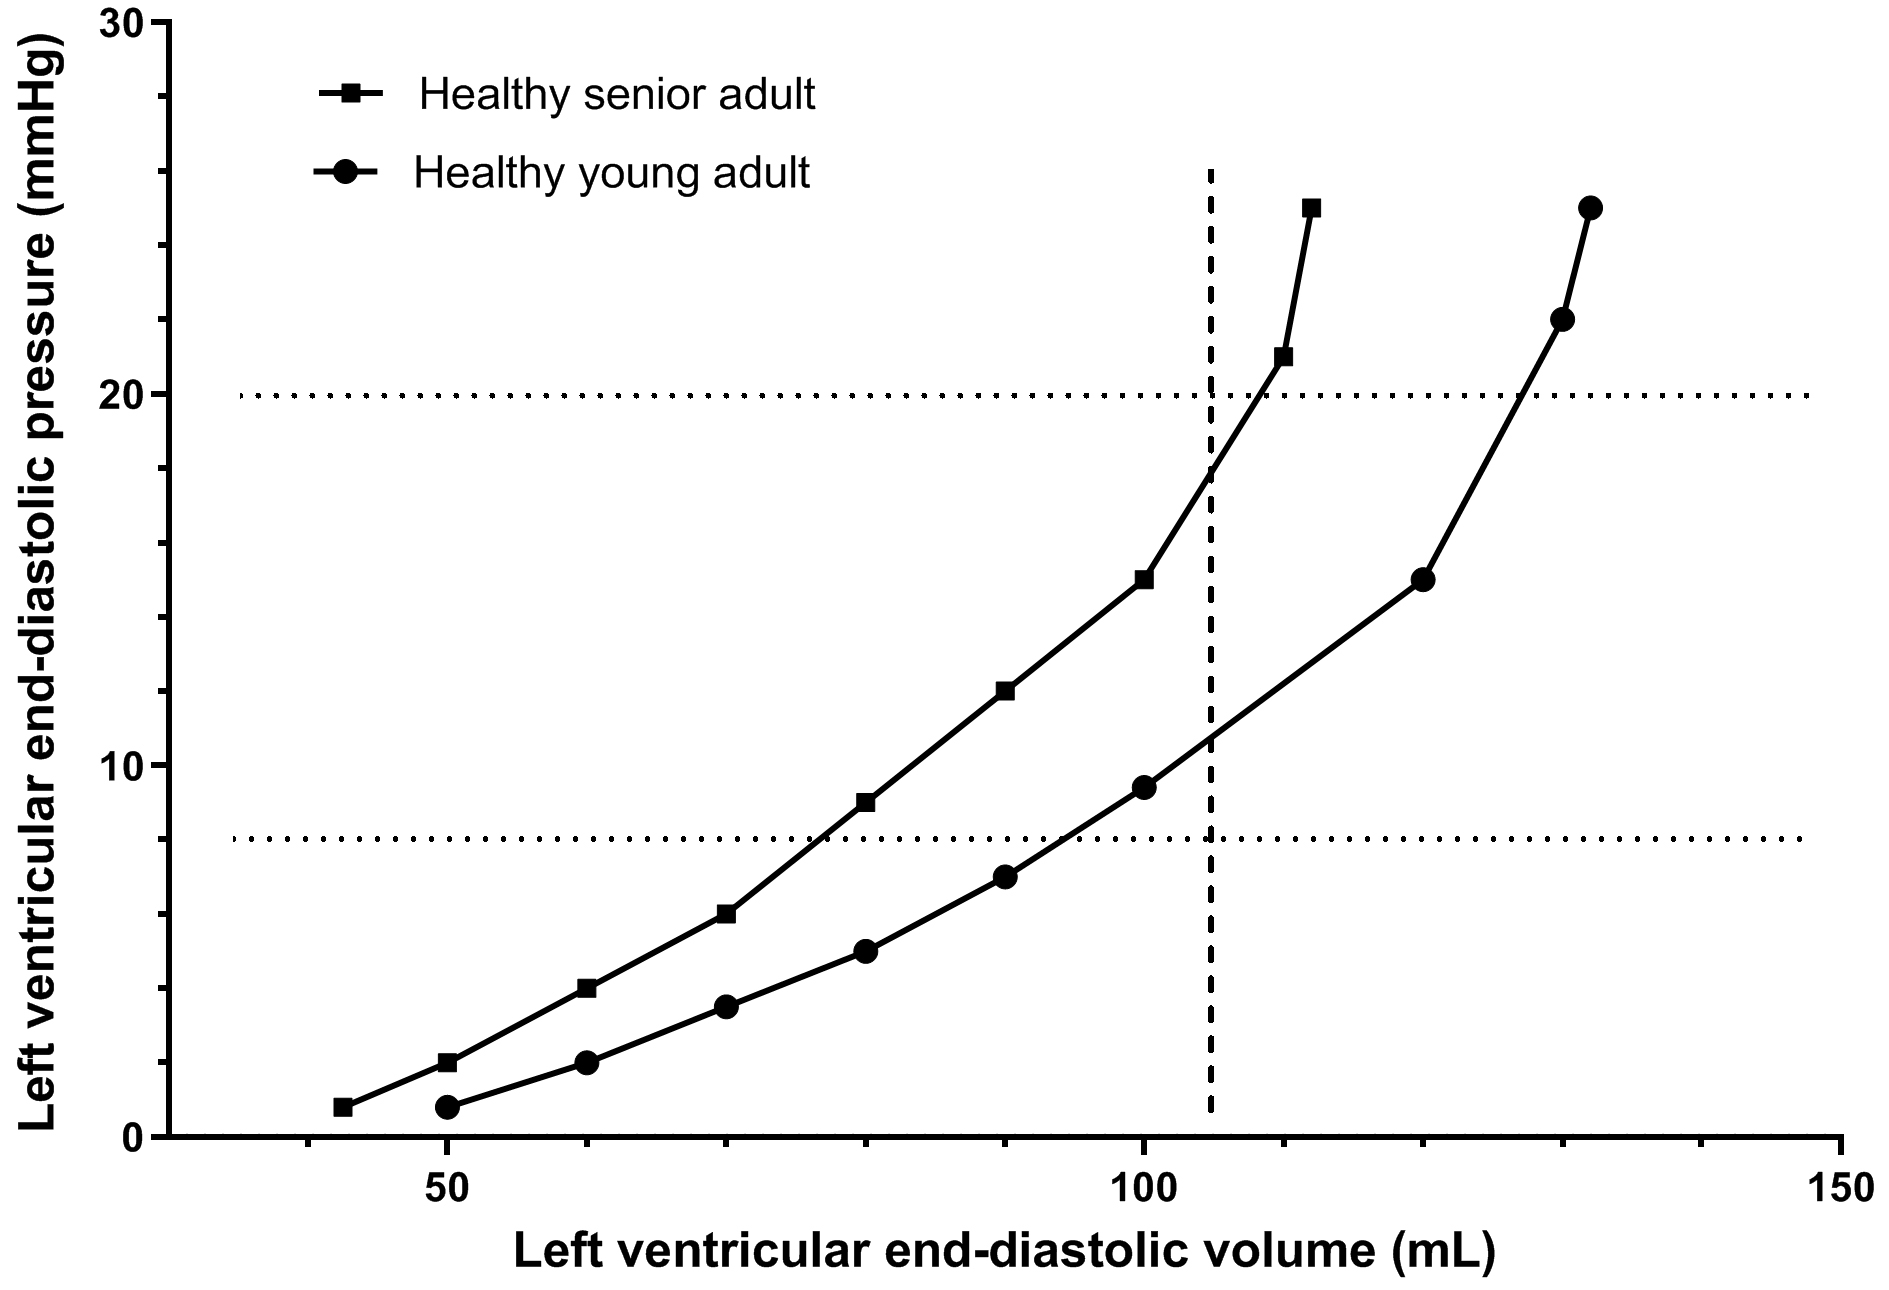 Fig. 1.
The curvilinear relationship between LVEDV and LVEDP during variations in the extent of LV filling which might be expected in an individual at different ages (young adult and senior adult). A translation to the left of the LVEDV/LVEDP curve occurs with aging. The curves shown are based in part on data collected in subjects of varying ages where PAWP was varied between ~7 mmHg and 15–17 mmHg using lower negative body pressure and saline infusion [57]. A limitation of this data is that direct measurement of LVEDP was not available. Points above the measured range are extrapolations based on knowledge that the LVEDV/LVEDP pressure curve is curvilinear and approaches a vertical tangent. There is a dotted horizontal line at a LVEDP of 8 mmHg representing the middle of the normal range for LVEDP and demonstrating a lower LVEDV in the senior adult. There is a dotted horizontal line at a LVEDP of 20 mmHg, representing a LVEDP above the normal range, and also demonstrating a lower LVEDV in the senior adult. There is a dashed vertical line at a LVEDV of 105 mL showing that this corresponds to a higher LVEDP in the senior adult, and therefore a lesser preload reserve.
The simplest explanation for aging leading to a smaller LVEDV is that aging results in an intrinsically smaller left ventricle due to structural remodeling. The term intrinsically smaller implies both a smaller minimal and maximal LVEDV, and also a smaller LVEDV at any given LVEDP. The LVEDV might then be at least partly preserved compared to its size in a younger individual, this depending on the venous return per beat, but occurring at the expense of elevation in the LVEDP. Structural remodeling could therefore account for both a smaller LVEDV and a higher LVEDP, and would be consistent with the evidence that the LVEDV remains lower in older versus younger subjects independent of the effects of fluid infusion and the level of mean LA pressure [57, 73]. While LVEDP was not measured in these studies, it is likely to have been higher in the older than the younger subjects, also supporting that the maximal or near maximal LVEDV would have been smaller in the older group.
In considering whether LV volume reductions with aging are predominantly due to a structural or functional cause, other important considerations are the relationships between wall thickness and LVEDD, LVM and LVEDV, and between LVEDL and LVEDD. Thus, there is an aging-related increase in RWT and the LVMVR seen in most of the cross-sectional studies, this demonstrating a progressive LV structural remodeling beginning early in the adult years. There is cross-sectional echocardiographic and CMR data showing reductions in LV length relative to short-axis dimension with aging [24, 52], and thus a spherical alteration of LV shape with aging, also suggesting a structural rather than a functional change.
Aging is accompanied by progressive increases in the incidence of HFpEF, and is also accompanied by changes in LV size, the ratio of wall thickness to chamber size, shape, pump function (as reflected in SV and CO) and LVEDP, but not of LA pressure. There are aging-related increases in wall thickness, RWT, the LVMVR and LVEF, which occur in association with reductions in LVEDL, LVEDV, LVESV, SV and CO. An effect of age on LVMi has not been a consistent finding and LVM changes with age may differ between men and women. There is consistent evidence from small studies that mean LA pressure does not change with healthy aging, whereas a combination of direct and indirect evidence suggests that healthy aging is accompanied by an increase in LVEDP. There is also evidence from studies using intravenous volume infusion demonstrating a reduction in the maximum LVEDV in older subjects, findings which are also consistent with an aging-related increase in LVEDP, and a decrease in preload reserve. While aging-related LV changes do not inevitably result in cardiac symptoms, the above changes could be contributors to diminished exercise tolerance and are also likely to reduce the threshold by which other factors such as hypertension and obesity might lead to HFpEF.
RP conceived and designed the paper, wrote and revised the paper, and approved the final version of the manuscript.
Not applicable.
Thanks to the peer reviewers for their suggestions.
This research received no external funding.
The author declares no conflict of interest.