


 , Xinran Guo 1,3,4, Qiuwei Ren 1, Zhijian Zhang 1,3,4,5,*
1 School of Information Management, Wuhan University, 400072 Wuhan, Hubei, China
2 Department of Information Systems, City University of Hongkong, Hongkong, China
3 Center for the Studies of Information Resources, Wuhan University, 400072 Wuhan, Hubei, China
4 Big Data Institute, Wuhan University, 400072 Wuhan, Hubei, China
5 Cultural Heritage Intelligent Computing Laboratory, Wuhan University, 400072 Wuhan, Hubei, China
Abstract
The rapid growth of digital social information service platforms has fundamentally transformed information diffusion in financial markets, creating an urgent need for knowledge organization systems that can integrate structured financial knowledge with dynamic social interactions. Traditional approaches, which rely on either ontological precision or social network analysis alone, face significant limitations in capturing the complex, multimodal associations that drive modern market behavior. This study proposes a novel Social-Knowledge Big Graph (SKBG) framework to address this gap. The SKBG is designed from a knowledge association perspective and systematically models five core patterns through a three-layer fusion model. The framework semantically grounds social entities in ontologies, enables consistent reasoning and knowledge discovery, and captures temporal dynamics and influence propagation. A case study of China’s A-share market and associated investor communities demonstrates the SKBG’s practical value. It identifies latent “cross-modal influencer” archetypes, traces semantically enriched misinformation propagation paths that reveal coordination mechanisms, and uncovers socially mediated stock price comovement that traditional models miss. These findings validate the SKBG as a knowledge organization system that bridges the divide between discrete social interactions and complex financial dynamics. This study contributes a robust methodological framework for constructing large-scale socio-financial knowledge organization systems, with important implications for intelligent financial services, risk surveillance, and market regulation in the digital age.
Keywords
- Social-Knowledge Big Graph
- knowledge association
- ontology
- social network
- knowledge graph
- financial knowledge organization
The financial market, as a complex socio-technical system, is not only a barometer of economic health but also a rich repository of dynamic and interconnected knowledge (Cheng et al., 2009). The complex relationships formed between market participants through objective existence or subjective interaction involve the expression, transmission, evolution and value-added processes of knowledge. The “knowledge associations (Xia et al., 2024)” existing within this system include the process of gradually condensing knowledge information with increasing density from sparse big data, and bring about a qualitative change in the utility of knowledge (Liu et al., 2024). The proliferation of social media has further complicated this landscape, giving rise to intricate online communities where retail investors exchange information, shape market sentiment, and influence trading behaviors (Chen et al., 2024; Zhan et al., 2025). This phenomenon underscores a critical challenge in Knowledge Organization (KO) that traditional methods struggle to represent and reason over the fusion of structured financial knowledge and the fluid, human-centric dynamics of social networks (Liu et al., 2022).
Knowledge organization, as a core discipline within information science, is fundamentally concerned with the systematic representation, storage, retrieval, and utilization of knowledge (Hjørland, 2008; Hjørland, 2013). Traditional KO methodologies construct structured knowledge systems by establishing semantic relationships among concepts (Gruber, 1993; Liu et al., 2010). However, the proliferation of digital social platforms has engendered knowledge production and dissemination characterized by unprecedented dynamism, sociality, and interactivity, posing novel challenges to these traditional methods (Knights et al., 1993). This is particularly salient in financial markets, where knowledge organization must contend not only with structured factual knowledge but also with behavioral, affective, and implicit patterns emergent from social interactions (Deboeck, 1999). This demand for a “socio-knowledge” fusion necessitates a re-examination of foundational KO principles to explore novel representational frameworks capable of accommodating both semantic rigor and social dynamics (Ennis, 1992). On one hand, social networks excel at modeling behavioral interactions and relational ties between investors but often lack the semantic precision to represent the content and meaning of the information being exchanged. On the other hand, knowledge graphs, particularly those grounded in ontologies, provide robust frameworks for representing semantic relationships and factual knowledge with high precision (Ji et al., 2022), yet they often fall short in capturing the transient, interactive, and behavioral nature of social phenomena (Dörpinghaus et al., 2022). This representational gap hinders our ability to build holistic knowledge models that can fully support advanced financial services, such as intelligent risk assessment and explainable decision support. The emerging paradigm of the Social Knowledge Graph (SKG) offers a promising direction by aiming to integrate these two perspectives (Shen et al., 2023; Yang et al., 2016). However, current instantiations of SKG often lack a formal ontological foundation, limiting their capacity for sophisticated semantic reasoning and consistency maintenance. They also frequently fail to synthesize diverse associations and address the scalability required for “big knowledge” environments characterized by massive (James, 2015; Lu et al., 2019), rapidly evolving associated data (Liu et al., 2022). In addition, the current state-of-the-art lacks a systematic, ontologically-grounded, and scalable framework for fusing the precise semantics of a financial knowledge base with the dynamic, behavioral data of an investor social network.
To address these limitations, this study proposes a novel Social-Knowledge Big Graph (SKBG) framework that systematically fuses a formal ontology with a graph-based social network on the perspective of “knowledge association”. Drawing inspiration from the Ontology and Property Graph Fusion Framework (OPGFF) (Tang et al., 2021), our approach extends the knowledge fusion paradigm into the social realm. We posit that the complexity of the financial social ecosystem can be decoded through five typical patterns of associations: categorical, statistical, spatiotemporal, event-centric, and behavioral. The core innovation lies in a structured fusion process across the content layer (integrating ontological concepts with social entities), the constraint layer (enabling consistent reasoning over social and semantic rules), and a novel social dynamics layer (capturing temporal and influential interactions). Therefore, the SKBG framework is architected not just as a technical fusion of models, but as a systematic endeavor to construct a knowledge organization system capable of representing, discovering, and reasoning over these multifaceted associations in a unified manner.
We demonstrate the viability of this framework through a case study centered on China’s online investment communities (OICs). By constructing a financial ownership ontology and integrating it with a social network of investors extracted from platforms like Eastmoney and Xueqiu, we build a practical SKBG. This integrated model allows us to not only represent static knowledge about companies and investors but also to perform consistency reasoning and analyze how information and influence propagate through social ties, thereby uncovering previously hidden associated patterns of market risk and investor behavior.
This research contributes to the field of knowledge organization by proposing a formalized methodology, underpinned by the knowledge association perspective, for representing and organizing complex, socio-technical knowledge systems. The proposed SKBG framework offers a new perspective on constructing large-scale knowledge bases that are both semantically precise and behaviorally rich, with potential applications extending beyond finance to other domains where human knowledge and social interaction are inextricably linked.
Knowledge organization is fundamentally concerned with the systematic representation of domain concepts and their relationships (Hjørland, 2008). The concept of “knowledge association” serves as a foundational principle within knowledge organization, addressing the core imperative of establishing meaningful connections between discrete units of knowledge to enable structure, discovery, and reasoning. Traditional KO systems have long operationalized this principle through formalized semantic relationships such as equivalence, hierarchy, and associative relations in thesauri and classification schemes, which provide a stable, conceptual scaffolding for domain knowledge (Zeng, 2008). The advent of ontology engineering further formalized these associations, using logical axioms to define precise relationships between concepts (TBox) and their instances (ABox), thereby enabling automated consistency checking and inference (Gruber, 1993). This makes ontology particularly suitable for representing stable, well-defined domain knowledge, such as ownership structures (Tang et al., 2021) or the taxonomy of financial fraud (Tang et al., 2018) in financial fields. More recently, the rise of knowledge graphs has pragmatically scaled this associative paradigm, leveraging graph structures to integrate massive, heterogeneous datasets while preserving relational semantics for more complex knowledge-driven tasks like recommendation systems (Elnagar and Weistroffer, 2019) and domain knowledge Q&A (Farzana et al., 2023).
However, the advent of the big data era exposed the limitations of traditional KO methods in terms of scalability and flexibility when dealing with massive, heterogeneous, and rapidly evolving knowledge (Pareja et al., 2019). Faceted classification theory (Ranganathan, 1933) offers a multidimensional approach to KO but traditionally focuses on entity attributes, often overlooking social behaviors and interactive processes. Social epistemology emphasizes the socially constructed nature of knowledge, positing that knowledge is formed and evolves through social interaction (Goldman, 1999), providing a theoretical basis for incorporating social networks into knowledge organization systems. For dynamic, socially-constructed systems like financial markets, there is a need to extend these relation types to encompass knowledge associations arising from social interactions, such as the patterns of knowledge state evolution over time, latent patterns discovered through computational analysis, and knowledge associations triggered by specific occurrences.
Knowledge association in big data highlights the connections between knowledge units based on semantic, logical, statistical, or social relations (Liu et al., 2024; Sun et al., 2020). In KO system, conceptual relations are typically categorized into three primary types: equivalence, hierarchical, and associative relations. Associations are not merely data links but fundamental elements constituting the cognitive structure of a knowledge system (Sun et al., 2020). While traditional KO primarily focuses on explicit associations based on classification and semantics, the modern digital environment necessitates an expansion to include socially-constructed associations, behaviorally-derived associations, computationally-discovered associations, spatiotemporal-evolutionary associations, etc. These extended association types reflect three fundamental characteristics of knowledge: sociality (generated in social interaction), dynamism (evolving over time), and implicitness (patterns requiring computational discovery). They excel at modeling what is known in a formal sense but struggle to capture how knowledge emerges, circulates, and evolves within dynamic, socially-embedded contexts like financial markets. This represents a significant theoretical and practical gap: while associations based on taxonomy, logic, or statistical co-occurrence are well-established, associations derived from social interaction, temporal behavior, and event-driven discourse remain underexplored in canonical KO frameworks. Consequently, there is a pressing need to expand the theoretical construct of “knowledge association” beyond its traditional boundaries to encompass the multi-modal, socio-dynamic linkages that characterize modern information ecosystems, thus aligning KO methodologies with the complexities of real-world knowledge formation and flow.
Parallel to developments in knowledge organization and representation, social network analysis (SNA) has proven to be a powerful tool for understanding the structure and dynamics of human interactions. In financial markets, SNA has moved beyond the study of formal institutional ties to analyze the vast digital footprints of retail investors. A growing body of behavioral finance literature leverages data from online stock forums, social media platforms, and news portals to investigate how information and sentiment propagate through investor networks. Studies have shown that these social interactions can lead to herding behavior (Hsieh et al., 2020), amplify risk contagion (Jin et al., 2024), and ultimately impact stock returns and volatility (Xia et al., 2023). These works effectively model the topology of investor relationships and the dynamics of information flow, capturing the “wisdom of the crowd” (Almaatouq et al., 2020) and its irrationality (Shen et al., 2025).
Despite their strengths, these purely SNA-based approaches often treat information as a homogeneous commodity and investors as nodes devoid of rich semantic attributes. They can identify that influence spreads but are less capable of modeling what knowledge is being transmitted or why certain information triggers specific investor behaviors based on their profile and historical preferences. This constitutes a significant semantic gap in structural analyses.
Recognizing the complementary strengths and limitations of formal knowledge structures and social network analysis, researchers have begun exploring their integration. This endeavor aims to transcend the “semantic gap” of pure SNA and the “social dynamics gap” of pure KO models (Dörpinghaus et al., 2022). The concept of the Social Knowledge Graph (SKG) was pioneeringly proposed by Yang et al. (2016) to bridge the social and knowledge domains. This line of research aims to create a unified graph that contains both social relationships and knowledge relationships.
Subsequent studies have demonstrated the value of this integration in various scenarios. For instance, Alonso et al. (2019) utilized SKG for job recommendation by modeling both a user’s professional skills (knowledge) and their social connections. Cao et al. (2022) applied a similar approach for suicidal ideation detection, combining users’ social interactions with their posted content’s semantic meaning. Shen et al. (2023) further provided a formal definition of SKG, emphasizing its “human-centered” characteristic and outlining its broad application prospects.
However, a critical analysis of the current SKG research reveals several methodological shortcomings, particularly from a knowledge organization perspective. First, it is lack of formal ontological foundation. Many SKG implementations are built directly on property graphs without a rigorous underlying ontology. This limits their machine-interpretability, semantic reasoning capability, and ability to maintain logical consistency across the entire graph. The relationship between ontology and property graph is not one of replacement but of potential synergy. Tang et al. (2021) argued that the ontology model and the property graph model are incompatible, creating a schism in knowledge representation research. Their proposed framework demonstrates how the semantic rigor of ontology can be fused with the scalability and rich attribute expression of property graphs to create a “Knowledge Big Graph”. This fusion allows for domain-agnostic consistency reasoning on a massive scale, a capability upon which our study builds. In addition, there is a paucity of research addressing how the semantic reasoning power of ontologies can be efficiently scaled and integrated with dynamic social network analytics in a “big knowledge” context, as tackled by Tang et al. (2021) in a non-social setting. The interaction between the relatively stable knowledge schema and the highly dynamic social network layer is often oversimplified, so the systematic framework for the continuous fusion and co-evolution of these two layers is still needed.
To address the research gap identified in the previous section, this section aims to propose the SKBG framework that not only semantically precise and consistent but also dynamically responsive to the realities of investor behavior and information diffusion in the digital age. SKBG is designed as a comprehensive knowledge organization system that systematically integrates the semantic precision of a financial ontology with the dynamic, behavioral data of an investor social network, thereby enabling complex reasoning and analysis at scale. The framework’s theoretical fundamental and design principles, architecture and fusion process are detailed below.
The construction of a knowledge organization system must be guided by a profound understanding of the inherent knowledge associations within the data to model. With a specific focus on the information interaction characteristics of investors, this study propose that the knowledge in the stock market ecosystem can be structured through five core association patterns: categorical, statistical, spatiotemporal, event-centric, and behavioral associations.
1. Categorical Associations: As the most fundamental and “explicit” pattern, this describes the taxonomic and hierarchical structures among conceptual entities in the stock market. It embodies the “multi-perspective” and “multi-layered” logic within big data. In the SKBG, this pattern is primarily realized through the financial ontology construction at the content layer, which defines classes and their subClassOf relationships, establishing a structured, multi-dimensional schema for understanding investors and their interactions.
2. Statistical Associations: Within the Data-Information-Knowledge-Wisdom (DIKW) hierarchy (McDowell, 2021), raw social posts and price ticks constitute “data” and processed metrics like sentiment scores or correlation coefficients are “information”. The SKBG framework advances this transformation by systematically contextualizing information within a rich semantic and relational fabric. However, when the correlation coefficient is interpreted within the context of financial theory or market behavior (e.g., interpreted as linkage due to the attention of common investors) and can be used to support prediction or decision-making, it is transformed into “knowledge”. Thus, this “implicit” pattern reveals correlations between knowledge units through computational analysis, highlighting the “computable” nature of knowledge associations. Examples include stock price co-movement and investor similarity. The SKBG supports this pattern through its constraint layer, where graph algorithms and Cypher queries are used to calculate correlation strength, structural patterns, and temporal changes, thereby discovering new knowledge that is not directly observable.
3. Spatiotemporal Associations: This pattern captures the “evolvable” characteristic of knowledge, describing how the states and relationships of entities change over time and across spaces (geographical or institutional). The SKBG’s novel social dynamics layer is specifically designed to manage this. It handles temporal relationships to describe evolutionary patterns and spatial influences on information migration, generating “new knowledge” about market dynamics.
4. Event-Centric Associations: As fundamental components of finance, events can trigger a series of market reactions and propagate through investor sentiment. This pattern is a domain-specific semantic association mode. The SKBG captures it by integrating Event as a core class in the ontology and modeling its connections to involved entities. The analysis of how events drive information diffusion is then enabled by combining the social network’s propagation paths with the ontological event semantics.
5. Behavioral Associations: This pattern encompasses all information interaction behaviors like commenting/following and emotional interactions among investors, which are driven by information needs. Behavior both relies on prior knowledge and generates new knowledge, exhibiting dynamic and spiraling evolutionary features. The SKBG integrates this directly by fusing the extracted social network into the content layer. These behavioral links are treated as first-class knowledge associations, allowing the study of how interactive behaviors are intertwined with static knowledge in a continuous process of knowledge accumulation and value discovery.
The five association patterns outlined above provide the theoretical typology for structuring knowledge in the stock market ecosystem. The categorical associations are embedded in our ontological framework, providing a static schema for organizing entities. Statistical associations are the core analytical lens, through which we apply network analysis and computational algorithms to uncover implicit correlations from the behavioral data, while spatiotemporal associations are considered in our longitudinal data collection. The event-centric and behavioral associations are global, derived patterns that enable the leap from “big data” to “big knowledge”, revealing the operational mechanics of the stock market complex system from the perspectives of information itself and the investors. Event-centric associations provide a semantic contextual layer, where we interpret observed statistical and behavioral anomalies within the context of market events. Behavioral associations serve as the primary data foundation, directly represented by the investor-investor and investor-stock attention/following networks we construct.
The design of SKBG framework is fundamentally guided by three interlocking principles derived from the core tenets of KO, each corresponding to a critical dimension of the five knowledge association patterns.
First, the principle of representational completeness demands that the framework extend beyond the taxonomic and hierarchical relations that have traditionally dominated KO systems. This expansion is necessary to incorporate the full spectrum of knowledge associations present in socio-technical systems, including not only categorical associations but also statistical correlations, spatiotemporal evolutions, event-centric linkages, and behavioral interactions. By ensuring that the model captures both the static semantics of what is known and the dynamic processes of how knowledge evolves and circulates, this principle directly operationalizes the multi-modal nature of knowledge in domains such as financial markets.
Second, to maintain logical coherence across this expanded representational scope, the principle of semantic consistency governs the integration of formally defined ontological structures with the fluid, often informal data generated through social interaction. This is achieved by grounding all social entities and relations within a unified financial-social ontology, whether a transient reply in a forum or a long-term investment holding. Through this ontological anchoring, along with a layer of constraint-based reasoning that enforces logical rules and temporal validity, the framework bridges the persistent divide between the stable semantics of knowledge graphs and the dynamic, often unstructured nature of social networks. This ensures that the resulting knowledge structure remains machine-interpretable and logically sound, even as it accommodates the real-time flow of social data.
Finally, the principle of associative reasoning ensures that the system functions not merely as a passive repository but as an active engine for knowledge discovery. This principle enables multi-modal inference pathways that traverse and interconnect the different association types. For instance, a reasoning process might begin with a behavioral association, cross-reference it with categorical associations, situate it within a spatiotemporal context, and link it to an event-centric trigger, ultimately materializing a new statistical association. By supporting this kind of synthetic, cross-pattern reasoning, the SKBG framework embodies the ultimate objective of advanced knowledge organization: to transform a complex, interconnected dataset into an intelligible and actionable epistemic structure that reveals patterns, supports explanation, and generates new insight.
These three principles (representational completeness, semantic consistency, and associative reasoning) form a cohesive theoretical foundation that translates the abstract taxonomy of knowledge associations into a robust, functional architecture. They ensure that the SKBG operates as a genuine knowledge organization system, capable of representing, querying, and reasoning about the intricate socio-epistemic phenomena that define modern information ecosystems.
Guided by the above perspective, the SKBG framework is built upon a three-layer fusion model to incorporate the characteristics of social networks. The overall architecture depicted in Fig. 1 consists of the following layers.
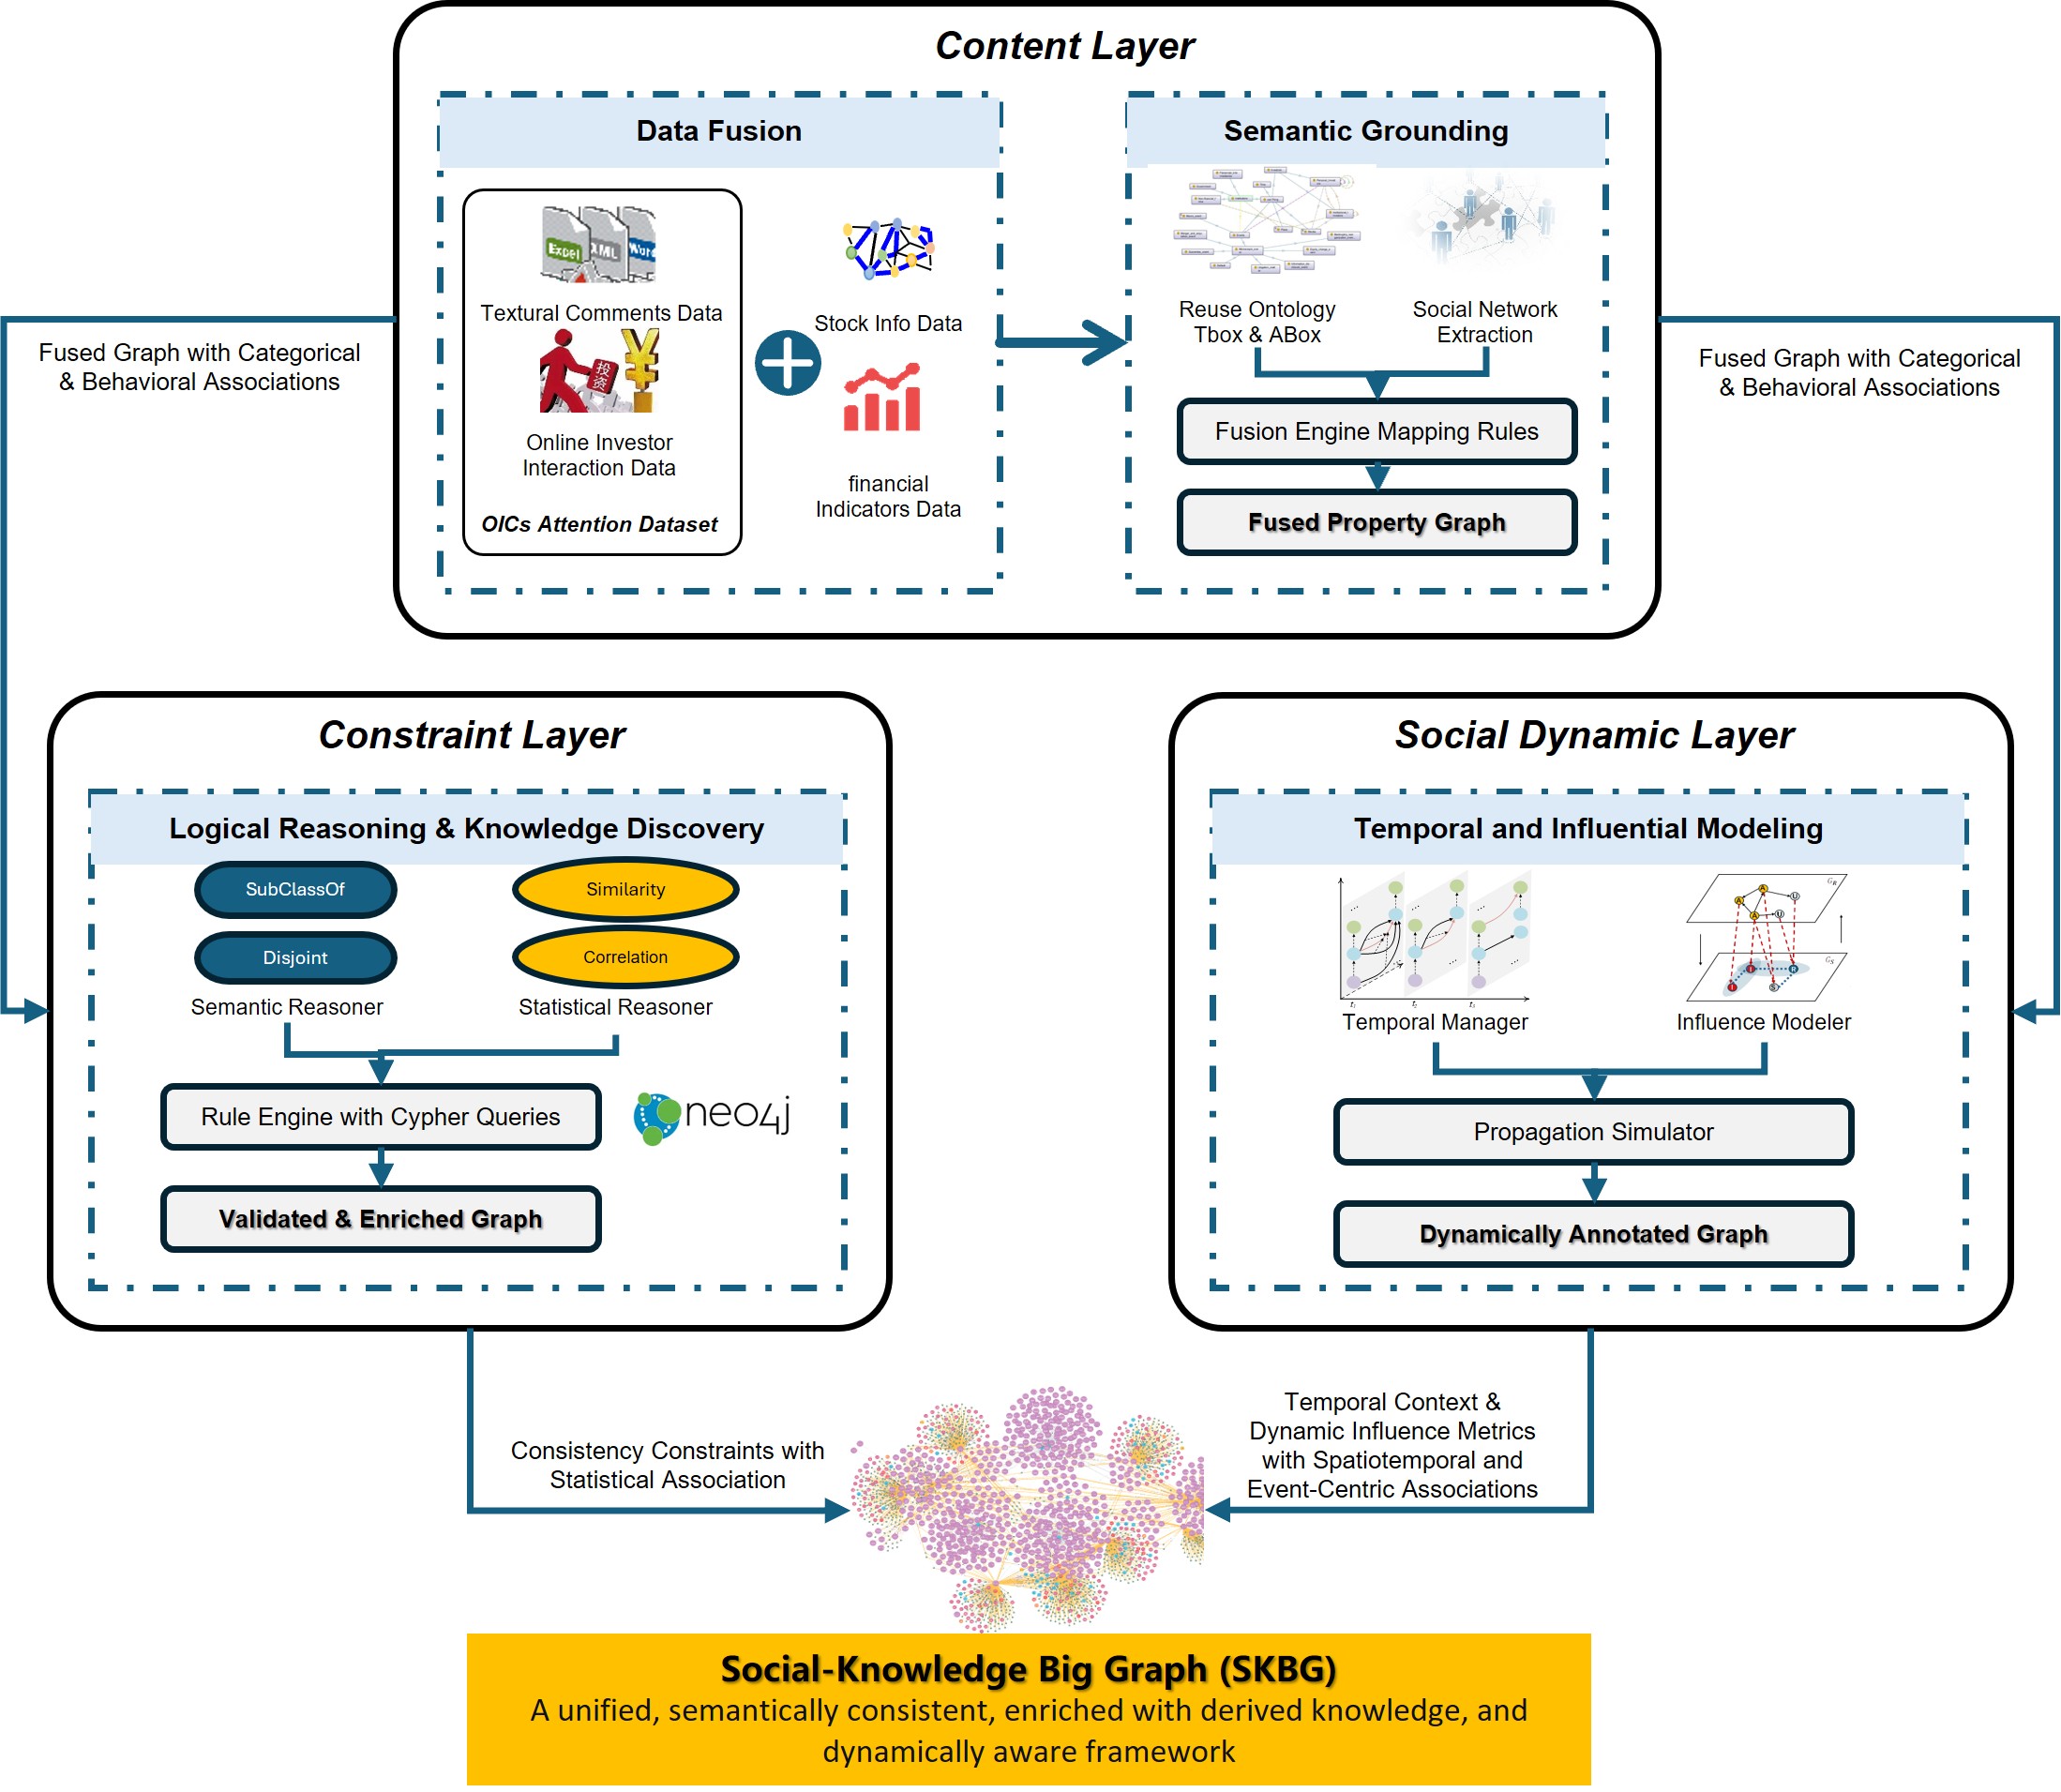 Fig. 1.
The multi-layer architecture of the Social-Knowledge Big Graph (SKBG).
Content layer establishes the structural schema and instance population of the SKBG. It involves the simultaneous definition of a formal financial ontology (TBox and ABox) and the extraction of a social network graph, which are then mapped and fused into a unified property graph model. Building upon the content layer, constraint layer imbues the SKBG with semantic reasoning capabilities. It translates ontological axioms and social logic rules into executable graph queries and constraints, ensuring the logical consistency of the entire knowledge structure and enabling the derivation of new knowledge. Social dynamics layer aims to capture the temporal and influential aspects inherent in social networks. It manages the evolution of social relationships over time and models information propagation pathways, allowing the SKBG to represent not just a static snapshot but a dynamically evolving ecosystem.
The content layer is the process of redefining the structured knowledge from the ontology and the unstructured relationships from the social network within a unified property graph model. This process is the technical realization of the foundational categorical associations and the direct integration of behavioral associations. Its primary function is to resolve the structural and semantic heterogeneity between the formal ontology and the informal social network. This is achieved through a process of semantic lifting, where social entities are mapped to ontological classes and social interactions are either directly represented as edges or reified into node-centric behavioral constructs. The output of this layer is a coherent property graph where all entities have well-defined types and relationships, ready for further reasoning and analysis.
The constraint layer imbues the SKBG with machine-interpretable intelligence. It operates by defining and executing a set of rules over the fused graph, and operationalizes reasoning over statistical associations and enforces the consistency of categorical associations. These rules serve consistency preservation and knowledge discovery.
We implement Cypher-based algorithms to check for inconsistencies in the categorical associations and introduce new rules to discover and validate statistical associations and other implicit patterns, the methodological details will be described in Chapter 4.
The social dynamics layer ensures the SKBG is not a static snapshot but a living representation of the market. This novel layer is specifically designed to capture the “evolvable” nature of knowledge, directly addressing spatiotemporal associations and the dynamics of event-centric associations. It introduces the concepts of Time and Space as first-class entities, allowing every behavior and event to be temporally anchored. This enables historical querying and trend analysis. Furthermore, this layer hosts dynamic computation processes, such as recalculating the influenceScore of an Investor node based on the evolving network structure. This functionality is crucial for modeling the propagation of information during specific events, effectively linking behavioral associations with event-centric and spatiotemporal associations.
In summary, the SKBG framework presented in this chapter provides a theoretically grounded and architecturally sound blueprint for constructing a next-generation knowledge organization system. The Content Layer defines what is known, the Constraint Layer defines what is logically consistent and derivable, and the Social Dynamics Layer defines how knowledge evolves.This layered approach ensures that the SKBG is not merely a concatenation of two graphs, but a logically self-consistent and semantically rich knowledge representation suitable for complex analytical tasks.
This section delineates the detailed methodology for constructing SKBG. We present a novel ontology design that strategically incorporates both static and dynamic aspects to fully capture the five knowledge association patterns. This ontology is then fused with a social network and empowered with consistency reasoning algorithms, forming a comprehensive and robust knowledge organization system.
The proposed Financial Social Ontology (FSO) serves as the semantic backbone of the SKBG, formally defining the categorical associations and providing a schema for event-centric associations. Its development followed a structured process.
To ensure interoperability and build upon established work, we first reuse and extend the Financial Industry Business Ontology (FIBO) as our upper-level ontology. FIBO provides robust, standardized definitions for core financial concepts like LegalEntity, FinancialInstrument, and Ownership. This aligns with the categorical association pattern by providing a multi-perspective, hierarchical foundation. The static ontology encapsulates the relatively stable, persistent knowledge in the domain. Its core classes and properties are designed to materialize categorical associations and provide the schema for statistical associations. Fig. 2 shows the corresponding concepts and their associations in the static ontology.
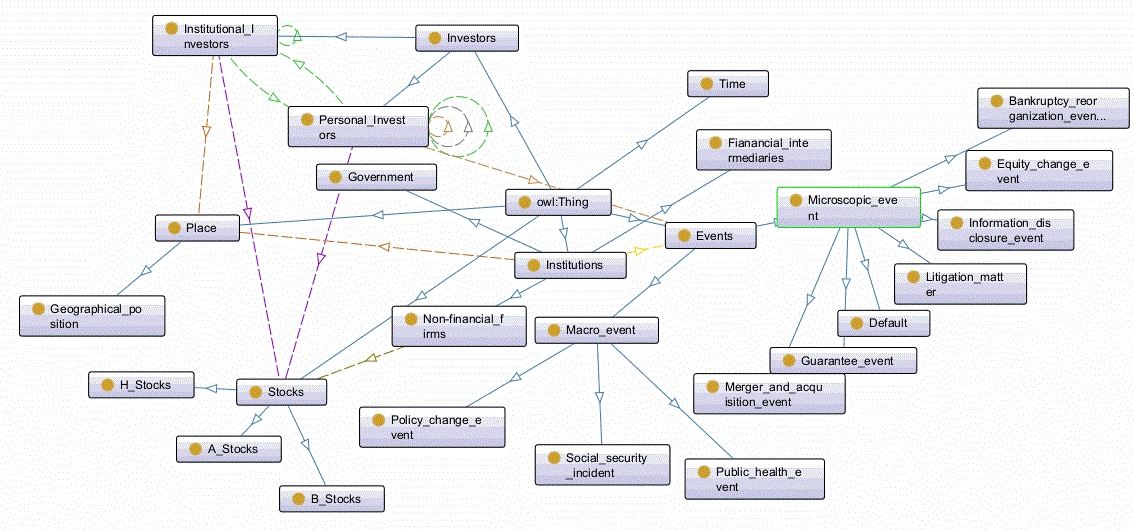 Fig. 2.
Static ontology model.
To capture the fluid and interactive nature of the stock market, we then introduce a dynamic ontology by reusing social and web ontologies like Friend of a Friend (FOAF) (Amith et al., 2020) and Semantically-Interlinked Online Communities (SIOC) (Breslin et al., 2005). Dynamic ontologies exhibit characteristics of continuous evolution and can be iteratively modified multiple times. While the static ontology defines what things are, the dynamic ontology defines what happens and how things change. This flexibility allows for various representations of the same or similar concepts within the ontology, enhancing modeling adaptability. Specifically, the dynamic ontology described serves as a knowledge organization model tailored to capture the dynamic interactions and state transitions of entities within the stock market. It focuses on characterizing the temporal and spatial dynamics of related entities, emphasizing changes over time and across different spatial dimensions. The fundamental concepts of this dynamic ontology encompass Events, Behaviors, Time, and Space, allowing us to attach rich metadata and relationships to these concepts themselves. Table 1 details the core elements of the dynamic ontology, explicitly outlining its classes, properties, and—crucially—their intrinsic connections to the static ontology.
| Element type | Core concept/Relation | Description & Examples | Datatype/Range | Constraints & Axioms | Link to static ontology |
| Core Classes | Event | Represents a significant occurrence that changes the market state. | OWL Class | Must be linked to a Time instance via occursAt. | Is defined in the Dynamic Ontology but is often participatesIn by entities from the Static Ontology. |
| Behavior | Represents an observable action, reified as a node. | OWL Class | Must be linked to a SocialSubject via performs. | The primary link to the Static Ontology. A Behavior is always performed by a SocialSubject. | |
| Time | Represents a point or period in time. | OWL Class | —— | Qualifies the dynamics of entities and relations defined in the Static Ontology. | |
| Space | Represents a geographical or conceptual space. | OWL Class | —— | Qualifies the context for entities and relations defined in the Static Ontology. | |
| Core Object Properties | performs | Links an Object to a Behavior it executes. | Domain: Object Range: Behavior |
Mandatory. A Behavior must have exactly one performer. | Primary Link. Connects the dynamic Behavior class directly to the static SocialSubject class (and its subclasses like Investor). |
| ParticipatesIn | Links an Object to an Event it is involved in. | Domain: Object Range: Event |
Optional. An entity can participate in multiple events. | Primary Link. Connects the dynamic Event class directly to the static SocialSubject class. | |
| ProvidesContextFor | Links an Event to a Behavior that it triggers or is related to. | Domain: Event Range: Behavior |
Optional. A behavior can be contextualized by multiple events. | A dynamic-dynamic link that enriches the connection between static entities. | |
| hasTopic | Links a Behavior to an Object it discusses. | Domain: Behavior Range: Object |
Optional. A behavior can have multiple topics. | Primary Link. Connects the dynamic Behavior class directly to the static FinancialInstrument class (and its subclasses like Stock). | |
| occursAt | Links an Event or Behavior to a Time instance. | Domain: Event, Behavior Range: Time |
Mandatory. | Anchors the dynamics of static entities (via their participation/actions) in time. | |
| occursIn | Links an Event or Behavior to a Space instance. | Domain: Event, Behavior Range: Space |
Recommended. | Anchors the dynamics of static entities (via their participation/actions) in space. | |
| Datatype Properties | HasTimestamp | Provides a machine-readable timestamp for a Behavior or Event. | xsd:dateTime | Non-null. | A scalar property that qualifies dynamic elements, which are themselves linked to static entities. |
| hasSentimentScore | Describes the emotional polarity of a PostingBehavior. | xsd:float | Value should be in a predefined range. | An enriched, computable attribute of a dynamic entity (Behavior) that is performed by a static entity (SocialSubject). | |
| hasTextContent | Stores the raw text of a PostingBehavior | xsd:string | —— | The raw data source for a dynamic entity (Behavior) linked to static entities. | |
| Other Axioms | subClassOf | Used to build the dynamic class hierarchy. e.g., RetweetBehavior subClassOf InteractionBehavior subClassOf Behavior |
OWL Built-in | —— | The dynamic class hierarchy parallels and complements the static SocialSubject hierarchy. |
| SocialSubject | The core class from the Static Ontology that acts in the dynamic context. | OWL Class (from Static Ontology) | —— | The Fundamental Bridge. This static class (and its subclasses Investor, Enterprise) is the “actor” that participates in dynamic relations like performs and participatesIn. | |
| FinancialInstrument | A core class from the Static Ontology that is the object of dynamic discussions. | OWL Class (from Static Ontology) | —— | The Fundamental Bridge. This static class (and its subclasses like Stock) is the “topic” of dynamic relations like hasTopic. |
Note: OWL, Web Ontology Language; xsd, XML Schema Definition.
The concepts form the foundational pillars for representing and understanding the dynamic nature of entities within the stock market, illustrating how events unfold, how objects interact, how behaviors manifest, and how these phenomena evolve over time and in different spatial contexts. This structured approach provides a comprehensive framework for modeling and analyzing the dynamic aspects of the stock market entities, enabling a more nuanced understanding of the market dynamics and facilitating informed decision-making processes (shown in Fig. 3).
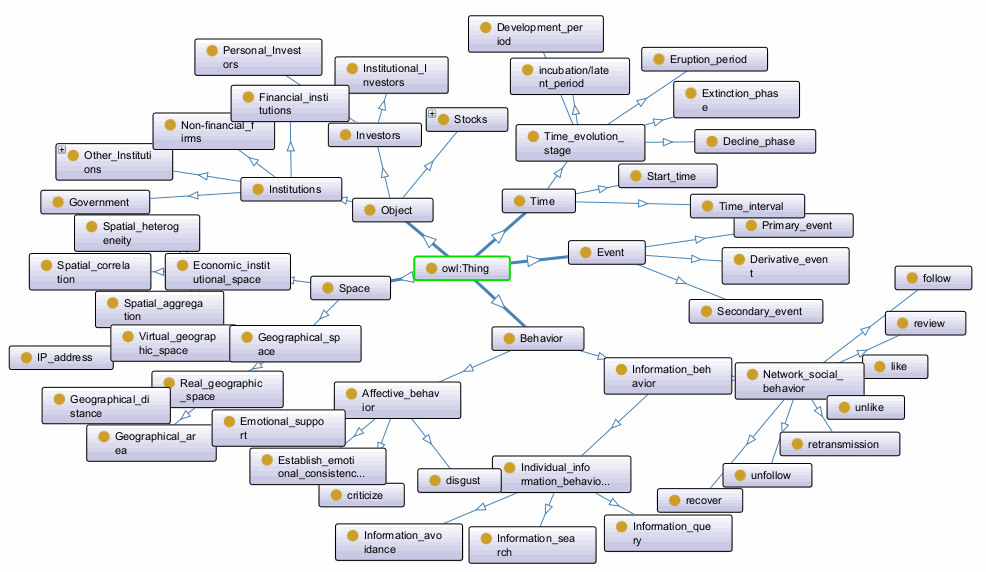 Fig. 3.
Dynamic ontology model.
This design directly and powerfully enables the capture of three key dynamic association patterns. Table 2 illustrates how the integrated static-dynamic ontology is explicitly designed to support all five patterns.
| Knowledge association pattern | Supported by ontology elements | Examples |
| Categorical Knowledge Association | Static Classes & Hierarchy Investor, Enterprise, subClassOf; | :Investor_X rdf:type |
| :InstitutionalInvestor. | ||
| Static Properties: holdsShareOf | :Investor_X :holdsShareOf | |
| :Company_A rdf:type | ||
| Statistical Knowledge Association | Datatype Properties (both Static & Dynamic) serving as computable features | Calculating correlation between hasRevenue of companies; |
| Using hasSentimentScore to find correlated investor groups | ||
| Spatiotemporal Knowledge Association | Dynamic Classes: Time, Space; | Tracking the evolution of a discussion (Behavior) about a stock occursAt different time points |
| Dynamic Properties: occursAt, occursIn | ||
| Event-Centric Knowledge Association | Dynamic Class: Event; | Modeling an EarningsAnnouncement event and linking all SocialSubjects who participatesIn it |
| Properties: participatesIn | ||
| Behavioral Knowledge Association | Dynamic Class Behavior; | Representing that Investor_A performs PostingBehavior_B which replies a post from Investor_C |
| Property performs; | ||
| Social Relations |
The fusion of the loosely-structured social network with the rigorously defined ontology is the core process that instantiates the SKBG. This study elaborates on the methodological framework designed to achieve this fusion, ensuring that the resulting graph is both semantically consistent and structurally capable of supporting complex, multi-modal queries and reasoning across the five knowledge association patterns. The fusion is conceptualized as a multi-layered mapping process, governed by a set of formal rules, which process maps both the static and dynamic ontological constructs into the property graph, alongside the social network data. It does not merely co-locate two graphs but deeply interweaves them by mapping social elements into the ontological framework.
The process begins with Entity-Level Mapping, which addresses the fundamental task of grounding every social entity within the formal ontological taxonomy. Here, social media user accounts are classified and mapped to ontological classes: each account is identified as sioc:UserAccount and foaf:Person, which is in turn declared equivalent to the ontological Investor class. This mapping is achieved via a combination of rule-based heuristics and linkage to structured financial registries to resolve ambiguity. Thus, every social user becomes a first-class citizen in the graph with a well-defined semantic type, thereby solidifying the categorical associations for all entities.
Building upon this foundation, the Relation-Level Mapping transforms social interactions into semantically rich relations within the ontological framework. A key distinction is made between persistent social ties, such as foaf:follows, which are mapped directly as relationship types like [:FOLLOWS] to define the social topology, and ephemeral social acts, like sioc:reply. These transient interactions are not represented as simple edges but are instead reified, used as triggers to instantiate nodes from the dynamic ontology, such as ReplyBehavior node. The node serves as a central narrative entity, connecting the actor, content, target, and temporal context. This step profoundly enriches the graph semantics, enabling deeper analysis of behavioral associations and their evolution over time, underpinning spatiotemporal associations.
The process of Contextual Enrichment focuses on integrating these dynamically modeled behaviors with the broader market knowledge. This involves creating specific semantic relationships from the dynamic ontology to contextualize social acts. For example, the hasTopic property links a PostingBehavior node to Stock or Company nodes mentioned in its content; the providesContextFor property connects an Event node to clusters of related Behavior nodes, forging event-centric associations; and the occursAt and occursIn properties anchor behaviors and events to Time and Space nodes, firmly establishing their spatiotemporal associations. The final outcome of this layered fusion is the emergence of the SKBG as a truly integrated knowledge organization system—a densely connected network where a social action is not an isolated event but is semantically positioned within the financial ecosystem, enabling social dynamics and formal financial knowledge to co-exist and inform each other within a single, semantically rigorous framework.
To ensure the logical consistency and quality of the SKBG and to enable the discovery of implicit knowledge, a suite of consistency reasoning algorithms is implemented. These algorithms operationalize the constraint layer fusion, marrying the semantic reasoning capabilities of the ontology with the path traversal and computational power of the property graph. The reasoning algorithms are enhanced to leverage the rich semantics of the fused static-dynamic SKBG. Their function is twofold: to act as a mechanism for knowledge validation and to serve as an engine for knowledge discovery. This is achieved by implementing automated checks and inferences that operate across the different knowledge association patterns, transforming the SKBG from a static data repository into a dynamic and logically sound knowledge base.
The first category focuses on semantic consistency reasoning, enforcing the integrity of categorical associations defined in the static ontology. This includes checks for hierarchical cycles, domain-range conformance of relationships, and disjointness constraints between classes (e.g., ensuring an investor cannot be simultaneously classified as both InstitutionalInvestor and RetailInvestor).
Beyond static validation, the framework employs social-behavioral and statistical reasoning to handle the complexities introduced by the dynamic ontology and the social network. This category of algorithms addresses the nuances of behavioral, spatiotemporal, and event-centric associations. A cornerstone of dynamic validation is influence propagation consistency. In a social network, influence should flow through acyclic paths to be semantically meaningful; a cycle can lead to logical fallacies where an entity indirectly influences itself, inflating its own score unnaturally. Thus, we implement a graph traversal algorithmthat checks for cycles in paths formed by FOLLOWS or REPLIES edges, which are the substrate for influence flow. Another critical reasoning is social role consistency, which performs cross-modal validation between categorical and behavioral associations. It detects anomalies where an investor’s observed behavior significantly deviates from the expected pattern of their ontological class. For instance, a RetailInvestor with an influence score and posting volume an order of magnitude higher than the norm is a statistical outlier that may represent a “finfluencer” or a fake account. This is identified by calculating Z-scores or using percentile-based thresholds for behavioral metrics within each investor category.
The detailed pseudocode and implementation specifics for these algorithms are provided in Appendix Table 10. Additionally, the reasoning framework enables the discovery and materialization of statistical associations. This process is central to transforming implicit, computable patterns into explicit knowledge within the graph. Graph algorithms and statistical computations are executed to quantify relationships. For example, Jaccard similarity calculation can identify investors with highly correlated posting behaviors, and the result is materialized as a new :SIMILAR_TO edge between Investor nodes, complete with a score property. Similarly, executing algorithms like PageRank calculates a dynamic influenceScore for each investor, making their implicit network status an explicit, queryable node attribute. This materialization of statistical associations enriches the graph’s structure and provides the foundational metrics for advanced analyses, such as modeling information propagation during market events.
The construction of SKBG was an iterative and meticulous process that translated the theoretical fusion framework into a practical, large-scale knowledge graph. To empirically validate the feasibility and practical utility of the proposed SKBG framework, this section presents a comprehensive case study centered on China’s A-share market and its associated online investor communities.
We collected data on A-shared stocks associated with the China Securities Index (CSI) 300 Index from the China Stock Market & Accounting Research (CSMAR) database, including information such as industry classification, concepts, shareholding ratios, and basic trading data for the year 2023. The CSI 300 index is a standard benchmark representing large-cap, liquid stocks, making it a pertinent universe for studying market-wide phenomena. The Eastmoney forum is the largest online investment community in China, providing a rich and ecologically valid source of retail investor interactions. Consequently, the findings are most generalizable to the social dynamics surrounding large-cap stocks within China’s dominant retail investor ecosystem.
This research adhered to strict ethical guidelines and legal standards. All data from the Eastmoney forum were collected from publicly accessible web pages. To protect user privacy, all raw user IDs and IP addresses were immediately hashed into irreversible anonymized identifiers upon collection. No attempt was made to link these online identities to real-world personal information. All analyses presented are based on aggregated network patterns or anonymized individual behaviors, aligning with the provisions for scientific research under China’s Personal Information Protection Law (PIPL).
After filtering out stocks that were suspended or had missing data during trading, a total of 288 stocks remained for analysis. Subsequently, the paper crawled investor comment text data, user attention (focused stocks and other investors), and other information interaction data from the stock forums of the 288 stocks on the Eastmoney.com Stock Forum website (https://guba.eastmoney.com/). We capture details of 2,584,057 online investor IDs and their corresponding pseudonyms, stock forum seniority, IP addresses, and more. Further insights include attention data for 1,441,579 investors towards specific stocks, as well as details on the followers of 1,627,370 investors.
The stock market public opinion text contains a large number of short investor comment texts and a small amount of news public opinion information. Among them, due to the poor language standardization of investor comment texts, low information content, and obvious value sparsity, it is difficult to directly extract knowledge from these texts. For these short texts, the study adopts the method of identifying the topics of investor comments as the “key knowledge” of comment information, that is, investors posting a comment can be converted into investors paying attention to a topic; for news events, element extraction is performed, and the entity relationships and theme events obtained are used as the “complementary knowledge” of the social knowledge graph.
We take the “Kweichow Moutai” stock bar as an example to identify the hot topics that investors pay attention to every month to describe the characteristics of investor comment texts. The study uses the BERTopic topic model to identify hot topics (Grootendorst, 2022). BERTopic performs topic modeling based on BERT word vectors. It uses Transformer and c-TF-IDF to create dense clusters and achieves better results than the LDA model in short texts. In the process of training the model, we use open-source pre-trained Chinese word vectors in the financial field to further enhance the effect of BERTopic, and obtains the theme of each month in 2022 through topic merging and screening. The study limits the number of topics to less than 20 and obtains the topic distribution for 12 months after parameter tuning. After eliminating topics that have no practical significance or only express investor emotions, they are summarized and summarized to form the hot topics of investor comments shown in Table 3.
| Month | Total comments | Num of best topics | Name of hot topics |
| 1 | 4051 | 10 | Market Fluctuations, Adding Positions, Spring Festival Sentiment, New Concept Stocks, Epidemic Impact, Annual Report Preview, Technical Analysis, Northbound Capital Flow, Sector Rotation, Holiday Consumption |
| 2 | 4426 | 5 | Short Selling, Buying And Holdings Increase, New Tech Stocks, Trading Ban, Judicial Case Impact |
| 3 | 4304 | 3 | Bull Market Surge, Interest Rate Hikes, Investment Dividends |
| 4 | 4926 | 2 | Market Cap Growth, Management Reshuffle |
| 5 | 6401 | 5 | Market Decline, Shareholders Meeting, Food Sector, Operations Update, Aerospace Concept |
| 6 | 8205 | 6 | Investment Dividends, Moutai Coffee, Sector Decline, Shareholder Proposals, Livelihood Topics, Mid-Year Capital Strain |
| 7 | 5720 | 4 | H1 Market Review, Moutai Ice Cream, Tech Stock Rally, Food Safety Debate |
| 8 | 4968 | 6 | Stock Market Slump, Liquor Stocks, H1 Earnings Report, Pharmaceutical Sector, Limit-Down Panic, White-Horse Stock Sell-off |
| 9 | 5165 | 7 | Moutai Coffee, STAR Market, Trademark Registration, Holiday Demand, Block Trades, New Product Launch, Institutional Research |
| 10 | 7899 | 7 | Buy And Increase Holdings, Tech Policy Impact, Market Cap Evaporation, Moutai Coffee, Personnel Changes, Q3 Earnings Preview, Foreign Capital Outflow |
| 11 | 8550 | 4 | Bull Market Limit Up, Dividend Payouts, ‘Junk’ Alcohol Debate, Share Buybacks |
| 12 | 6305 | 5 | Liquor Index, Annual Dividend, Oriental Selection, Market Volatility, Bottom Fishing Strategy |
Event element extraction is the core task of event extraction, which aims to
extract corresponding event arguments, roles, etc. from the text according to the
event representation framework. This paper regards event element extraction as a
sequence labeling task, that is, given a sequence to be labeled
| Precision | Recall | F1-score | |
| PER-1 | 0.8012 | 0.7806 | 0.7908 |
| COM-1 | 0.9414 | 0.8041 | 0.8674 |
| ORG-1 | 0.8848 | 0.7698 | 0.8233 |
| TIME | 0.8387 | 0.8273 | 0.8330 |
| PER-2 | 0.7561 | 0.5569 | 0.6414 |
| COM-2 | 0.8571 | 0.6286 | 0.7376 |
| ORG-2 | 0.5439 | 0.4850 | 0.5092 |
| Trigger | 0.7573 | 0.6671 | 0.7093 |
| Micro avg | 0.8482 | 0.6158 | 0.7036 |
| Macro avg | 0.7823 | 0.7261 | 0.7482 |
Note: RER, Person; COM, Company; ORG, Organization.
With prepared data, we proceeded to instantiate the ontology and populate the graph, following the layered mapping methodology. The static ontology was first brought to life by creating nodes for all resolved entities, while the core of the fusion occurred with the dynamic ontology instantiation and behavioral reification. Here, each social media post was not modeled as a simple edge but was reified into a rich node. This node was then linked to its author via [:PERFORMS] and to the discussed listed companies via [:HAS_TOPIC] relationships, which were created in Section 5.1.2. This design elegantly captured behavioral associations and linked them to financial entities. Furthermore, corporate events like earnings announcements were instantiated as nodes and connected via [:PROVIDES_CONTEXT_FOR] to all relevant PostingBehavior nodes within a defined timeframe, explicitly forging event-centric associations. Finally, to anchor the graph in spatiotemporal associations, all Behavior and Event nodes were explicitly linked to Time nodes through [:OCCURS_AT] relationships.
Following the instantiation of the dynamic ontological framework, a critical step of refining and calculating dynamic associations was undertaken to imbue the graph with nuanced, computable relationship semantics. This involved three key advancements beyond simple relationship creation.
There are significant differences in the types of dynamic interactions between
institutional investors and individual investors. The interaction between the
former is mainly reflected in the shareholding (position) relationship, while the
interaction between individual investors (this article refers to online
investors) is mainly reflected in the information exchange process. social
relationships generated. In addition, according to the length of investor
interaction, interaction types can be divided into three types: long-term
steady-state interaction, short-term interaction and instantaneous interaction.
For long-term steady-state interaction relationships, they can be regarded as a
static relationship, so only the triplet
The emotional interaction relationship of investors is mainly reflected through the information they publish. If investors have a “co-attention” behavior for a certain stock, and the emotional scores of the comments published by the two investors in the same period are similar, it is considered that the two have a high degree of emotional consistency; if the emotional scores of the comments published by two investors who pay attention to a certain stock are quite different, it means that there is emotional difference between the two, otherwise it is considered that there is no emotional interaction relationship between the investors. The study calculated the emotional scores of all comments in the forum by calling Baidu API (the score range is [0,1]), and calculated the emotional interaction score (Sentimental Interaction Score, SIS) between investors, as shown in the calculation Eqn. 1. This score was materialized as a property on the [:SIMILAR_TO] edge between investors or used to create new [:SENTIMENT_ALLY]/[:SENTIMENT_OPPOSITE] relationships, thereby making implicit sentiment dynamics explicit and queryable.
The symbolic representation of multiple semantics is the process of uniformly representing the multi-modal knowledge associations between knowledge units with investors as the core as vector tuples. For example, there are both “follow” and “comment” relationships between investor A and stock A, and the comments have emotional attributes, so the result after symbolic representation is shown in Fig. 4. Symbolic representation simplifies the modeling complexity, and while ensuring the computability of large social knowledge graphs, it can also provide better interpretability for graph-based query and analysis tasks.
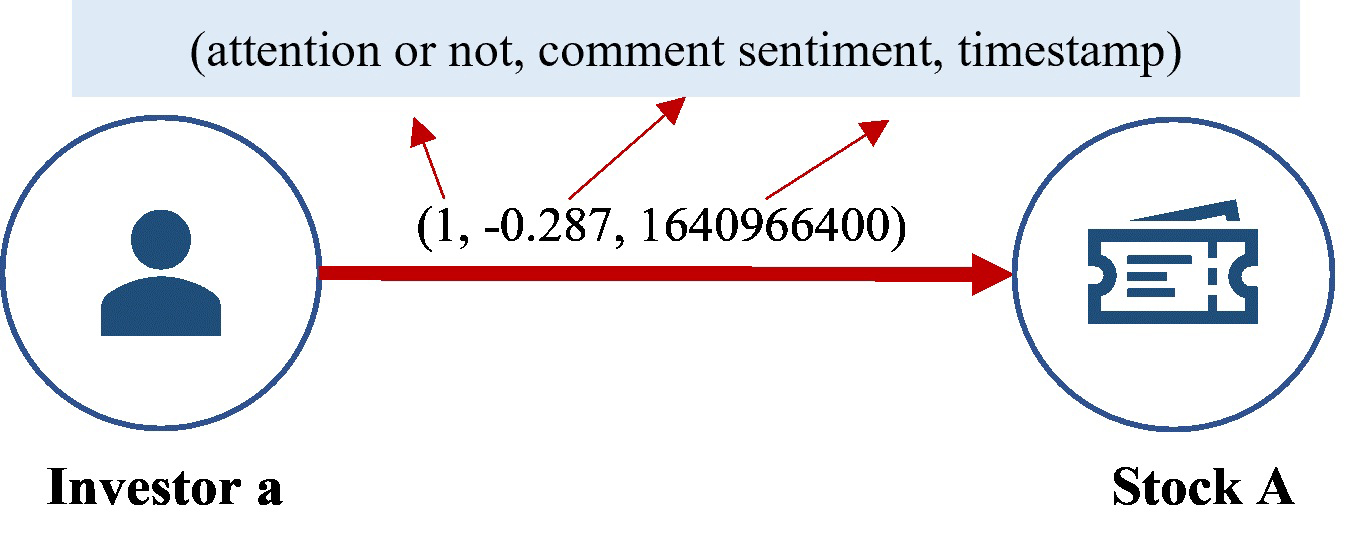 Fig. 4.
Example of multiple semantic symbolic representation results.
According to the scenario and service requirements, different weights are
assigned to each element of the symbolically represented multi-semantic
associated knowledge tuple. The resulting set of values that can reflect the
degree of knowledge association between each knowledge unit is the Knowledge
Association Degree (KAD), and its value range is [0,1]. At time T, KAD of
knowledge unit a to b shows in Eqn. 2, where
KAD indicates the similarity between knowledge units. Since the weight is defined as a hyperparameter, it can be flexibly calculated according to the actual application scenario. The core purpose of this study is to propose a unified data intelligence modeling framework. To ensure universality, the study was treated with equal weights.
The construction process culminated in the final graph generation and validation. The fully populated SKBG in Neo4j resulted in a substantial and richly connected knowledge base, comprising approximately 1.5 million nodes and 1.8 million relationships, including key types such as Investor, Stock, PostingBehavior, HOLDS_SHARE_OF, FOLLOWS, and HAS_TOPIC (shows in Fig. 5). To ensure the graph’s logical integrity, the consistency reasoning algorithms from the methodological framework were executed. Through the comprehensive and iterative process, a semantically consistent SKBG was generated, providing a powerful and verifiable substrate for the multi-faceted application scenarios that follow.
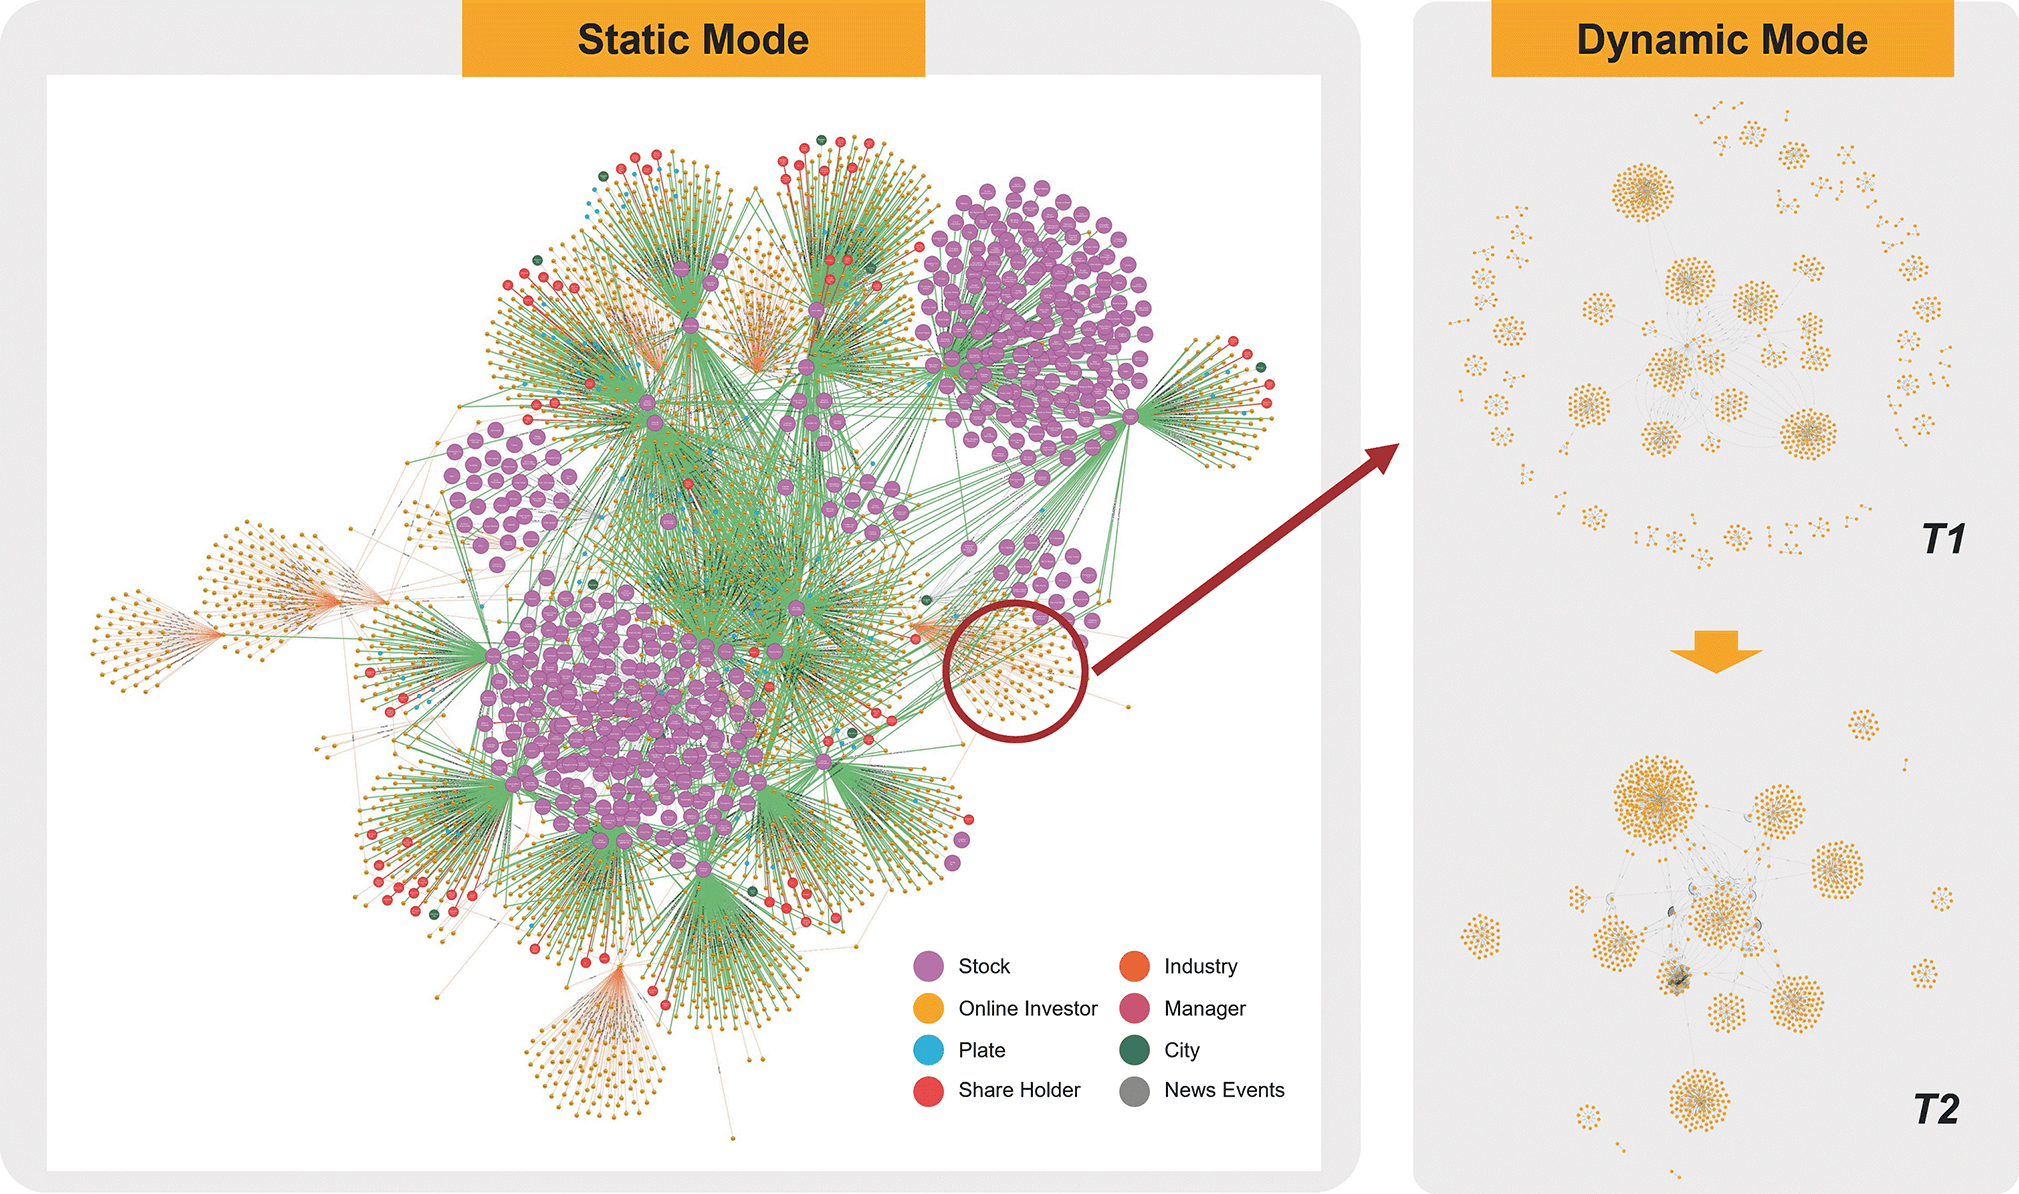 Fig. 5.
Financial SKBG visualization results stored in Neo4j.
To comprehensively evaluate the analytical power of the SKBG, we designed three interlocking case studies that probe its capabilities at different levels of granularity, from profiling individual investors, to tracing information pathologies, and finally to explaining macroscopic market dynamics.
We first focus on a micro-level analysis: generating nuanced, multi-dimensional portraits of investors. Traditional models often rely on a single data dimension, such as network structure or trading history, leading to a fragmented view. Our approach, powered by the SKBG, overcomes this by synthesizing categorical, behavioral, and statistical associations into a unified investor profile, enabling the identification of subtle yet influential investor archetypes that would otherwise remain hidden.
We programmatically query the SKBG to compile a comprehensive feature vector for each investor. From the categorical associations defined in the static ontology, we extract fundamental attributes like the investor’s type (RetailInvestor or InstitutionalInvestor) and their portfolio composition, calculated from holdsShareOf edges (e.g., number of holdings, concentration in specific sectors). From the behavioral and spatiotemporal associations instantiated in the dynamic ontology, we compute temporal dynamics including their posting_frequency, avg_sentiment_score across all their PostingBehavior nodes, and their activity_volatility (the standard deviation of their daily post count). From the statistical associations materialized through graph algorithms, we derive powerful network metrics such as a global influence_score computed using the PageRank algorithm, and community_centrality measure to quantify their role as a bridge between different investor groups. With the rich feature vectors for all investors assembled, we proceed to investor typology construction through unsupervised clustering. We employ the K-means algorithm on the standardized feature matrix to uncover natural groupings within the investor population without preconceived biases. The optimal number of clusters is determined using the silhouette score. This data-driven method reveals distinct archetypes based on the synthesized knowledge within the SKBG. This multi-modal feature extraction is formalized through a dedicated computational procedure (see Algorithm B.1 in Appendix Table 11) that systematically queries the fused graph.
The analysis results shown in Table 5 reveals several distinct investor typologies that validate the SKBG’s analytical value. Notably, we identify a “Cross-Modal Influencer” archetype, investors who exhibit categorical characteristics of retail participants but demonstrate behavioral and statistical patterns typically associated with institutional actors. These individuals maintain highly concentrated portfolios (low portfolio_diversity), exhibit strategic timing in their social interactions (high activity_consistency), and wield network influence (influence_centrality) disproportionate to their formal classification. The discovery of this archetype exemplifies the unique insight generated through multi-associational analysis, as it emerges precisely from the tension between different knowledge association patterns within SKBG. By identifying “Cross-Modal Influencers” through their characteristic fusion of retail categorization with institutional-grade behavioral patterns, financial regulators can prioritize monitoring efforts on actors who may disproportionately impact market sentiment. Similarly, investment services can leverage these nuanced portraits to develop targeted engagement strategies that account for both the formal classification and actual behavioral patterns of investor segments. This scenario thus validates the SKBG not merely as a data repository but as a sophisticated analytical framework that generates actionable intelligence by revealing the complex interrelationships between different dimensions of financial knowledge.
| Investor typology | Dominant knowledge association patterns | Key characteristics | Behavioral patterns & Network influence | Business significance & Regulatory concern |
| Cross-Modal Influencer | • Categorical (Retail label) | • Formally classified as retail investor | • Influence score comparable to institutions | [Label] High Regulatory Priority |
| • Behavioral (Strategic posting) | • Highly concentrated portfolio (2–3 stocks) | • Occupies bridge positions in network structure | • Potential market sentiment manipulation risk | |
| • Statistical (High network centrality) | • Strategic timing in posting behavior | • High behavioral consistency score | • Critical node in information diffusion | |
| • Sentiment analysis shows guiding tendency | • Priority target for continuous monitoring | |||
| Stable Retail Participant | • Categorical (Retail label) | • Moderately diversified portfolio (5–8 stocks) | • Limited network influence | [Label] Standard Service Target |
| • Spatiotemporal (Random activity) | • No specific temporal pattern in posting | • Primarily information receiver role | • Representative traditional retail investors | |
| • Sentiment expression aligns with market trends | • Low behavioral consistency score | • Suitable for basic investment education | ||
| • Normal risk monitoring level | ||||
| Analytical Institution | • Categorical (Institutional label) | • Highly diversified portfolio (15+ stocks) | • Stable medium-high influence | [Label] Quality Information Source |
| • Statistical (Stable influence) | • Professional, analytical post content | • Relatively independent network position | • Representative of rational market voice | |
| • Prudent and neutral sentiment expression | • High behavioral consistency | • Suitable as high-quality information source | ||
| • Generally good regulatory compliance | ||||
| Sentiment-Driven Trader | • Behavioral (High sentiment volatility) | • Frequently adjusted portfolio | • Medium but volatile influence | [Label] Sentiment Risk Indicator |
| • Spatiotemporal (Event-driven) | • Strong polarity and volatility in post sentiment | • Prone to form temporary clusters | • Amplifier of market sentiment | |
| • Activity highly correlated with market events | • Medium behavioral consistency | • Group requiring sentiment guidance | ||
| • Potential source of herding effect | ||||
| Hybrid Professional | • Categorical (Institutional/Professional) | • Thematically concentrated portfolio | • Stable and effective influence | [Label] Deep Cooperation Target |
| • Behavioral (Active participation) | • Active participation in social discussions | • Plays opinion leader role in network | • Important source of professional insights | |
| • Event-centric (Theme leadership) | • Frequently sets discussion agendas | • Clear behavioral strategy | • Potential cooperation and research partner | |
| • Requires professional-level communication |
We establish KMeans clustering on investor features without SKBG-based features as the baseline and quantify SKBG’s marginal gain, the cluster results shows in Fig. 6. Table 6 further represents the experimental results with a rigorous baseline comparison. SKBG improves silhouette score by 2.52% and prediction accuracy by 0.52%; Cluster separation remains stable with consistent classification (ARI (Adjusted Rand Index) = 0.5831), demonstrating SKBG’s incremental value for investor portrait generation. These results confirm that SKBG contributes meaningful marginal value to investor clustering and user portrait generation without compromising cluster separation, validating the effectiveness of integrating social knowledge graph features.
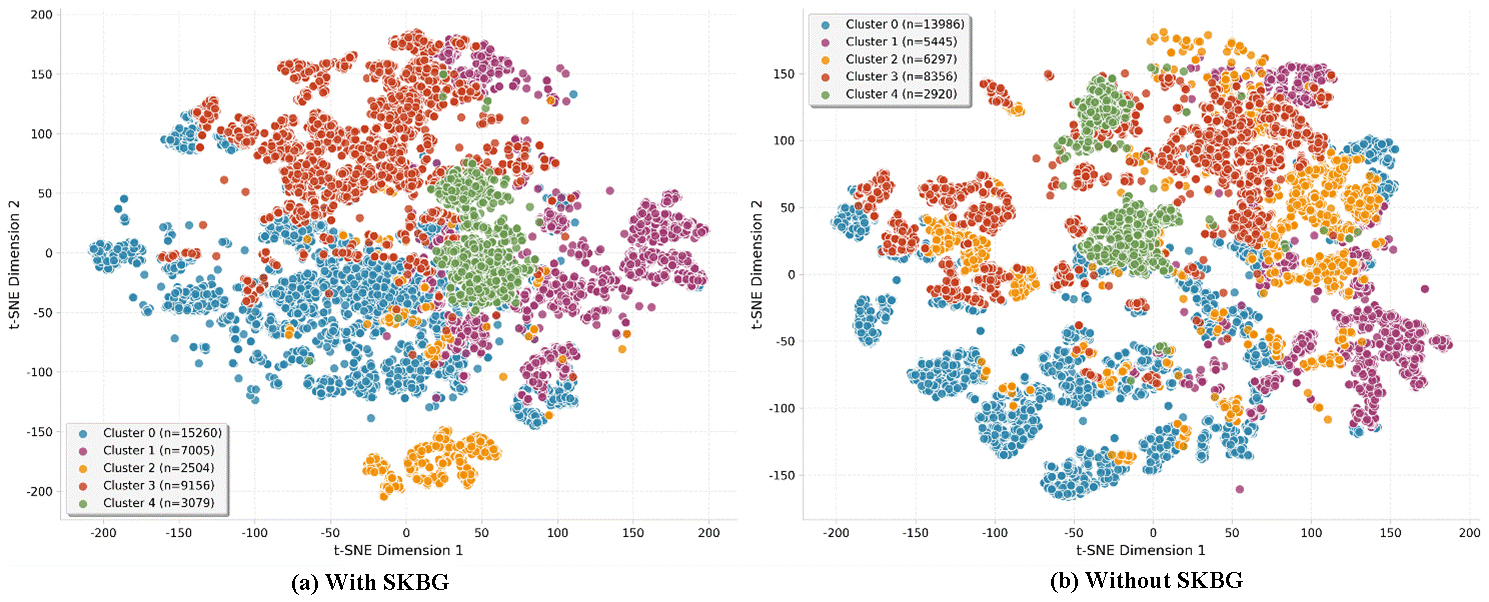 Fig. 6.
Investor clustering results comparison. SKBG, Social Knowledge Big Graph.
| Metric | With SKBG | Without SKBG | Marginal contribution (%) |
| Silhouette | 0.2291 | 0.2234 | +2.52 |
| Separation | 1.0000 | 1.0000 | +0.00 |
| Accuracy | 0.9832 | 0.9781 | +0.52 |
| Adjusted Rand Index (ARI) | 0.5831 | ||
Note: SKBG, Social Knowledge Big Graph.
From KO perspective, this scenario demonstrates how SKBG synthesizes knowledge associaction of categorical classification (investor type), behavioral traces (posting patterns), and statistical networks (influence scores) into a unified investor portrait. This moves beyond traditional siloed representations, offering a more holistic and semantically rich model for organizing investor knowledge.
This scenario moves beyond simple network diffusion analysis by leveraging the integrated knowledge associations to reconstruct not just how false information spreads, but why certain pathways are exploited and who benefits from the propagation dynamics. The approach transforms traditional rumor tracking into a sophisticated investigation of market manipulation patterns.
Specifically, we employ a multi-stage filtering algorithm that identifies suspicious content based on deviation from established patterns: posts with sentiment scores exceeding two standard deviations from the historical norm for a given stock, coordinated posting behaviors from known influencer clusters identified in Scenario 1, and information cascades that exhibit abnormal acceleration compared to typical diffusion patterns. The core innovation in this approach lies in the cross-modal validation that connects information propagation with trading behavior and portfolio positions. For each identified misinformation cascade, we execute additional queries to detect potential coordination patterns: we analyze whether amplifiers in the propagation network hold concentrated positions in the target stock (exploiting categorical associations from portfolio data), whether the timing of their amplification activity correlates with unusual trading volume (leveraging spatiotemporal associations), and whether the sentiment trajectory aligns with price manipulation strategies (utilizing behavioral associations). This multi-dimensional analysis transforms simple retweet chains into evidence of potentially coordinated activity, details shown as Algorithm B.2 in Appendix Table 11.
Table 7 shows the results validating the superiority of the SKBG-enhanced framework over the baseline model across three core evaluation metrics. For misinformation detection, the SKBG-enhanced model achieves an F1-score of 0.8159, representing a 12.77% marginal gain compared to the baseline’s 0.7235. This improvement stems from the model’s ability to integrate SKBG features like influencer identity, portfolio concentration, and propagation network structure rather than relying solely on surface-level content attributes such as sentiment deviation and posting frequency. By anchoring suspicious content to the behavioral and relational context of market participants, the framework reduces false positives caused by isolated abnormal posts and enhances the precision of identifying coordinated misinformation campaigns. In addition, the SKBG-enhanced approach delivers substantial gains in metrics directly tied to market manipulation investigation capabilities. In propagation path accuracy (evaluated on Top 20 amplifiers), the model achieves a score of 0.6890, marking a 52.43% improvement over the baseline’s 0.4520. This advancement is critical because traditional diffusion models often misidentify high-frequency posters as key amplifiers, whereas the SKBG framework prioritizes nodes with high PageRank influence and concentrated portfolio positions. For manipulation correlation, measured by the Adjusted Rand Index (ARI), the SKBG-enhanced model reaches 0.5870, a striking 86.94% marginal gain compared to the baseline’s 0.3140. This result underscores the framework’s unique strength in linking information propagation cascades to underlying trading coordination. The model effectively quantifies the association between information operations and market manipulation behaviors by cross-validating amplification timing with unusual trading volume and sentiment trajectories with price manipulation patterns.
| Metric | Baseline | SKBG-Enhanced | Marginal gain (%) |
| Misinformation Detection F1 | 0.7235 | 0.8159 | +12.77 |
| Propagation Path Accuracy (Top20) | 0.4520 | 0.6890 | +52.43 |
| Manipulation Correlation (ARI) | 0.3140 | 0.5870 | +86.94 |
Note: SKBG, Social Knowledge Big Graph; ARI, Adjusted Rand Index.
This scenario exemplifies how SKBG transforms misinformation analysis into a knowledge integrity verification task. By integrating behavioral (propagation acts), categorical (actor profiles), and event-centric (market context) associations within a single semantic model, the framework enables cross-modal consistency checking. This moves beyond structural network analysis to assess whether information flows align with the ontological attributes and temporal contexts of involved entities. The approach embodies the KO principle of associative reasoning, demonstrating that semantic integration across association types is essential for detecting coordinated epistemic manipulation in socio-technical systems.
The third scenario escalates the analytical scope to macroscopic market phenomena, demonstrating how the SKBG enables stock market price comovement effect analysis and risk early warning by uncovering the latent social mechanisms that drive correlated price movements beyond fundamental economic factors. While traditional financial models explain comovement through industry classification, geographic location, or fundamental similarities, our approach reveals how investor behavior and information diffusion patterns captured in the SKBG create artificial linkages between otherwise unrelated securities, providing a novel framework for systemic risk assessment.
The methodology employs a multi-layered association analysis that systematically investigates different dimensions of stock interconnectedness. We established a baseline through traditional price correlation analysis, calculating pairwise correlation coefficients between all stocks in our universe based on their daily returns. We compute social proximity based on investor interaction intensity, information proximity from the co-mention patterns in social discourse, and behavioral proximity from the sentiment spillover and attention synchronization between investor communities. This multi-dimensional proximity framework is implemented through follow procedure (see Algorithm B.3 in Appendix Table 11).
The analytical power emerges through temporal predictive validation that tests whether SKBG-derived proximity measures lead observable price correlations. We implement a Granger causality framework that examines whether changes in social and information proximity between stock pairs statistically precede the emergence of significant price comovement. In this context, we do not focus on the causal relationships between factors influencing risk contagion, but only on temporal sequence. Therefore, Granger causality tests between asset returns can achieve the research objective and serve as an effective alternative to describe the sequence of risk transmission. Consequently, Granger causality can be used to establish the transmission direction between individual stocks, and a directed risk transmission network can be constructed accordingly, as shown in Fig. 7. It can be observed that compared to undirected networks, this network has significantly sparser edges, but its modularity is further enhanced, and the overall connectivity of the network deteriorates. We argue that socially-driven comovement created vulnerability channels that manifested during a market stress event. When negative news affected one stock in the cluster, the sell-off rapidly propagated through the social linkage network, affecting all connected stocks despite their disparate fundamentals. Most fundamentally, this scenario demonstrates that the SKBG provides a unique window into the social fabric of markets, revealing how investor behavior and information diffusion create latent structures that fundamentally reshape asset price dynamics and systemic risk propagation.
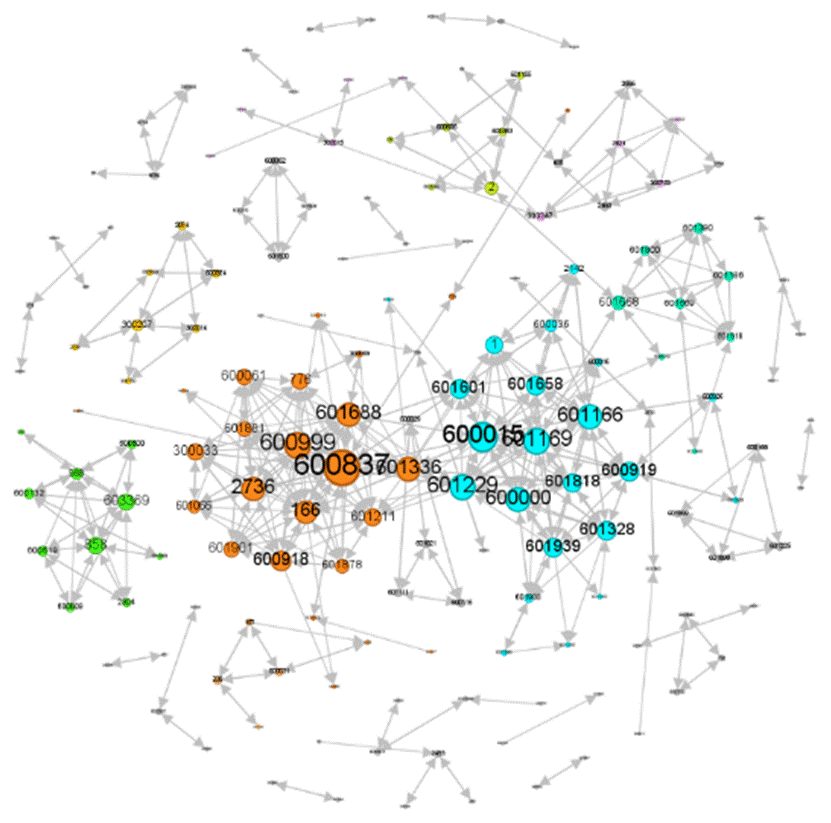 Fig. 7.
Directed risk transmission network generated based on Granger causality.
While the primary knowledge association patterns are derived from the Eastmoney forum data, a potential concern is whether findings based on a single online community are robust and reflect genuine market phenomena, rather than platform-specific artifacts. To verify the important role of social connections in identifying key transmission paths, this study establishes a Quadratic Assignment Procedure (QAP) regression model to confirm the impact of social connections on stock price linkages. QAP regression analysis considers that variables in social networks are usually not independent but interdependent, making it suitable for analyzing matrix data in relationship graphs. Its purpose is to assess the strength and significance of relationships between variables. Therefore, using QAP regression analysis to study the impact of stock price linkages arising from investor social interactions is feasible. This paper draws on the model construction approach of Chen et al. (2024), and the final model expression is as follows:
In this matrix, SC represents the social association matrix, IND represents the industry association matrix, CIT represents the regional association matrix, PLA represents the conceptual association matrix, MAN represents the personnel association matrix, SHA represents the equity association matrix, and SUP represents the supply chain relationship matrix. The elements of the IND, CIT, MAN, and SUP matrices take values of 1 or 0. The element values of the PLA matrix indicate the strength of the conceptual association, the element values of the SHA matrix indicate the shareholding ratio, and the DMV is the size difference matrix of the enterprises, which represents the degree of difference in size between enterprises.
If the social connections identified from the single forum source are merely noise or platform-specific, they should not systematically explain the co-movement of stock prices in the broader market. A statistically significant relationship, however, would provide strong evidence that the social patterns captured by our method transcend the specific data source and are linked to a fundamental market outcome. The regression results are shown in Table 8. It can be seen that at the 5% level, the social association matrix has a significant positive impact on the stock price correlation coefficient matrix, meaning that the social connections among investors can explain the correlation between stock prices.
| Unstandardized regression coefficients | Standardized regression coefficients | Significance probability | Probability A | Probability B | |
| Constant | 0.7589 | 0.0000 | —— | —— | —— |
| CoAtt(CoAttention) | 0.0020*** | 0.0471*** | 0.0450 | 0.0450 | 0.9560 |
| IND(Industry) | 0.0782*** | 0.0908*** | 0.0000 | 0.0000 | 1.0000 |
| CIT(City) | 0.0004** | 0.0280** | 0.0010 | 0.0010 | 0.9979 |
| PLA(Plate) | 0.0976*** | 0.5142*** | 0.0000 | 0.0000 | 1.0000 |
| MAN(Manager) | –0.0001 | –0.0044 | 0.2520 | 0.2520 | 0.7480 |
| SHA(Shareholder) | 0.0061*** | 0.0016*** | 0.0000 | 0.0000 | 1.0000 |
| SUP(Supply) | 0.0390** | 0.0601** | 0.0002 | 0.0002 | 1.0000 |
| DMV | –0.1022*** | –0.3375*** | 0.0000 | 1.0000 | 0.0000 |
| Adj·R2 | 0.3472 | —— | —— | —— | |
Note: *, **, and *** indicate that the coefficients are significant at the 10%, 5%, and 1% levels, respectively. DMV, Difference Matrix of Variability.
Furthermore, to address potential concerns regarding data source limitations and
to verify the stability of our primary finding that investor social associations
explain stock price co-movement, we conducted robustness checks, with results
summarized in Table 9. We performed 50 iterations of random sampling (70% of
stocks in each iteration) to assess the stability of our model estimates against
sample composition variations. We then conducted 100 permutations of the social
association matrix to generate empirical p-values, thereby testing
whether the observed relationships could arise by chance. The bootstrap analysis
reveals exceptional stability of our core finding. The social association
coefficient remained statistically significant (p
| Test type | Key metric | Result | Statistical significance |
| Booststrap Resampling | Mean SC Coefficient | 1.136 | p |
| 95% Confidence Interval | [1.208, 1.492] | —— | |
| Significant Proportion | 100% | —— | |
| Placebo Test | Emprical p-value | 0.000 | p |
| Placebo Coefficient Mean | 0.002 | —— |
This analysis demonstrates SKBG’s ability to organize and explain systemic market phenomena through socially-derived associations. Beyond traditional categorical linkages (industry sectors), SKBG incorporates behavioral (sentiment spillover), statistical (investor overlap), and spatiotemporal (temporal lead-lag) associations to construct a multidimensional proximity network. This reveals how social and informational structures create latent risk channels not captured by conventional financial ontologies. The framework thus advances KO from static entity classification to dynamic mechanism modeling, providing explanatory power for complex market behaviors through integrated association reasoning.
This research has presented the design, implementation, and validation of a novel SKBG framework that systematically addresses the critical challenge of organizing and analyzing the complex, multi-modal knowledge inherent in modern financial markets. Through the formal fusion of ontological precision and social network dynamics, our work makes three-fold contributions to the field of knowledge organization and financial informatics. First, at the theoretical level, we have established a comprehensive knowledge association perspective that categorizes financial-social phenomena into five distinct yet interconnected patterns (categorical, statistical, spatiotemporal, event-centric, and behavioral knowledge associations), providing a unified conceptual framework for understanding how different dimensions of market knowledge interact and co-evolve. It expands the typology of knowledge associations beyond the classical semantic relations to include social and behavioral types, offering a more comprehensive framework for modeling contemporary knowledge ecosystems. Second, methodologically, we have developed and implemented a multi-layered fusion architecture that technically realizes the integration of static financial ontologies with dynamic social networks through entity-level mapping, relation-level transformation, and contextual enrichment, creating a semantically consistent and computationally efficient knowledge representation. Third, through practical validation, we have demonstrated the SKBG’s transformative analytical capabilities across three escalating scenarios: from micro-level investor profiling that identifies influential “Cross-Modal Influencers”, to meso-level misinformation propagation tracing that reveals coordinated manipulation patterns, and finally to macro-level comovement analysis that uncovers socially-mediated risk channels, collectively proving the framework’s utility for both academic research and real-world financial applications. These findings collectively suggest that the integration of social dynamics with formal financial knowledge is not merely complementary but essential for understanding contemporary market behaviors, positioning the SKBG as a foundational infrastructure for next-generation financial analysis.
Despite these contributions, several limitations present opportunities for future research and development. Firstly, a primary challenge lies in data acquisition and quality, particularly from social media platforms, where API restrictions, noise, and the intentional obfuscation of user identities can impede the creation of a complete and accurate SKBG. Our analysis is based primarily on data from the Eastmoney forum represents a single platform. This may affect the direct transferability of specific numerical estimates or pattern magnitudes to other social trading platforms like Snowball that may exhibit distinct user demographics, interface designs, or communication norms. Besides, investor behaviors on other platforms may differ, future work should expand data sources to validate and extend these patterns. The second significant challenge is the computational complexity associated with large-scale graph reasoning. Performing path traversals, community detection, and consistency checks on a graph comprising millions of nodes and relationships demands substantial resources, presenting a barrier to real-time application. In addition, the semantic depth of dynamic associations could be substantially enriched through more sophisticated natural language processing techniques, including fine-grained financial sentiment analysis, argumentation mining to detect reasoning patterns in investor discussions, and cross-lingual analysis to capture global market influences beyond Chinese-language sources. In future, the integration of multimodal data sources would create an even more comprehensive knowledge base for financial analysis, while exploring federated learning approaches for cross-institutional SKBG construction could address data privacy concerns while enabling collaborative analysis of market-wide phenomena. Moreover, the application of the SKBG framework could be extended to adjacent domains such as corporate governance analysis, where the interplay between ownership structures, board networks, and shareholder communications creates similar challenges for knowledge organization and analysis.
All data reported in this paper will be shared by the corresponding author upon reasonable request.
ZL contributed to the conception and design of the study, acquisition and analysis of data, drafting the manuscript, and critically revising it for important intellectual content. XG contributed to the acquisition and analysis of data, and critically revising the manuscript for important intellectual content. QR and ZZ contributed to the analysis and interpretation of data, specifically performing the modelling and graph analysis. They also critically revised the manuscript for important intellectual content. All authors gave final approval of the version to be published and agree to be accountable for all aspects of the work.
We gratefully acknowledge the assistance and instruction from professor Feicheng Ma of Wuhan University and professor Leung Chung Man Alvin of City University of Hongkong.
This research was funded by the National Natural Science Foundation of China’s Basic Research for Young Students (Ph.D. Students) project “The Co-evolution Mechanism of Stock Market Information Diffusion and Risk Contagion Driven by Social Knowledge Big Graph”, grant number 723B2018.
The authors declare no conflicts of interest.
During the preparation of this work the authors used Deepseek in order to check spell and grammar. After using this tool, the authors reviewed and edited the content as needed and takes full responsibility for the content of the publication.
| Algorithm A.1: Influence Propagation Consistency | |
| FUNCTION detectInfluenceCycles(graph) | |
| FOR EACH node IN graph.getNodes(type=“Investor”) DO | |
| visited = SET() | |
| IF hasCycleDFS(node, visited, None) THEN | |
| REPORT “Influence cycle detected involving node: ” + node.id | |
| END IF | |
| END FOR | |
| END FUNCTION | |
| FUNCTION hasCycleDFS(currentNode, visited, parent) | |
| IF visited.contains(currentNode) THEN | |
| RETURN TRUE | |
| END IF | |
| visited.add(currentNode) | |
| FOR EACH neighbor IN currentNode.getNeighbors(direction=“OUT”, edgeType=“FOLLOWS—RETWEETS”) DO | |
| IF neighbor != parent AND hasCycleDFS(neighbor, visited, currentNode) THEN | |
| RETURN TRUE | |
| END IF | |
| END FOR | |
| visited.remove(currentNode) | |
| RETURN FALSE | |
| END FUNCTION | |
| Algorithm A.2: Social Role Consistency | |
| FUNCTION detectRoleAnomalies(graph) | |
| baseline_metrics = MAP() | |
| FOR EACH category IN [“InstitutionalInvestor”, “RetailInvestor”] DO | |
| nodes = graph.getNodes(label=category) | |
| avg_influence = AVERAGE([n.influenceScore for n in nodes]) | |
| std_influence = STANDARD_DEVIATION([n.influenceScore for n in nodes]) | |
| baseline_metrics[category] = (avg_influence, std_influence) | |
| END FOR | |
| FOR EACH (category, (avg, std)) IN baseline_metrics DO | |
| FOR EACH node IN graph.getNodes(label=category) DO | |
| z_score = (node.influenceScore - avg) / std | |
| IF ABS(z_score) | |
| REPORT “Role-behavior anomaly: ” + node.id + “ in ” + category + “ has Z-score: ” + z_score | |
| END IF | |
| END FOR | |
| END FOR | |
| END FUNCTION | |
| Algorithm B.1: Multi-Modal Investor Profiling Based on SKBG | |
| FUNCTION GenerateInvestorPortraits(SKBG_Graph) | |
| investor_profiles = [] | |
| FOR EACH investor IN SKBG_Graph.Nodes(type=“Investor”) DO | |
| profile = {} | |
| // Extract Categorical Associations | |
| profile.type = investor.labels | |
| portfolio = EXECUTE_CYPHER(“MATCH (investor)-[h:HOLDS_SHARE_OF]- | |
| profile.portfolio_diversity = COUNT_DISTINCT(portfolio.companies) | |
| profile.concentration_ratio = CALC_HERFINDAHL(portfolio.shares) | |
| // Analyze Behavioral Associations with Temporal Context | |
| behaviors = EXECUTE_CYPHER(“““ | |
| MATCH (investor)-[:PERFORMS]- | |
| RETURN b, t ORDER BY t.timestamp | |
| ”””) | |
| profile.activity_consistency = CALC_TEMPORAL_CONSISTENCY(behaviors.timestamps) | |
| profile.sentiment_trend = CALC_SENTIMENT_TREND(behaviors.sentiment_scores, behaviors.timestamps) | |
| // Compute Statistical Associations from Network Structure | |
| profile.influence_centrality = PAGE_RANK(investor, SKBG_Graph, weights=‘engagement’) | |
| profile.structural_importance = BETWEENNESS_CENTRALITY(investor, SKBG_Graph) | |
| // Calculate Cross-Modal Metrics | |
| profile.consistency_score = CALC_BEHAVIORAL_CONSISTENCY(profile) | |
| investor_profiles.ADD(profile) | |
| END FOR | |
| RETURN investor_profiles | |
| END | |
| Algorithm B.2: Misinformation Propagation Analysis Based on SKBG | |
| FUNCTION TraceMisinformationPropagation(SKBG_Graph, target_stock, time_window) | |
| // Phase 1: Identify misinformation candidates | |
| suspicious_posts = EXECUTE_CYPHER(“““ | |
| MATCH (sb:PostingBehavior)-[:HAS_TOPIC]- | |
| WHERE sb.timestamp IN $time_window | |
| AND ABS(sb.sentiment_score - stock_avg_sentiment) | |
| AND SIZE((sb) | |
| RETURN sb | |
| ORDER BY sb.timestamp | |
| ”””, params) | |
| // Phase 2: Reconstruct propagation paths with semantic context | |
| propagation_network = {} | |
| FOR EACH origin_post IN suspicious_posts DO | |
| propagation_tree = EXECUTE_CYPHER(“““ | |
| MATCH path = (origin:PostingBehavior {id: $origin_id}) | |
| UNWIND NODES(path) AS node | |
| WITH node, | |
| [n IN NODES(path) — LABELS(n)] AS participant_types, | |
| REDUCE(s = 0, n IN NODES(path) — s + n.sentiment_score) AS path_sentiment_sum | |
| RETURN COLLECT(DISTINCT { | |
| node: node, | |
| investor_type: HEAD([label IN LABELS(node) WHERE label IN [‘RetailInvestor’, ‘InstitutionalInvestor’]]), | |
| influence_score: node.influence_score, | |
| portfolio_concentration: node.portfolio_concentration, | |
| timestamp: node.timestamp, | |
| sentiment: node.sentiment_score | |
| }) AS propagation_path | |
| ”””) | |
| // Phase 3: Cross-validate with trading patterns | |
| trading_correlation = CORRELATE_WITH_TRADING(propagation_tree, target_stock, time_window) | |
| propagation_network[origin_post.id] = { | |
| ‘propagation_tree’: propagation_tree, | |
| ‘trading_correlation’: trading_correlation, | |
| ‘key_amplifiers’: IDENTIFY_AMPLIFIERS(propagation_tree) | |
| } | |
| END FOR | |
| RETURN propagation_network | |
| END | |
| Algorithm B.3: Multi-Dimensional Comovement Analysis Based on SKBG | |
| FUNCTION PROCEDURE AnalyzePriceComovement(SKBG_Graph, stock_universe, analysis_period) | |
| comovement_network = {} | |
| FOR EACH stock_pair IN COMBINATIONS(stock_universe, 2) DO | |
| stock_A, stock_B = stock_pair | |
| // Traditional financial correlation | |
| price_corr = CALC_PRICE_CORRELATION(stock_A, stock_B, analysis_period) | |
| // SKBG-derived proximity measures | |
| social_proximity = EXECUTE_CYPHER(“““ | |
| MATCH (a:Stock {symbol: $stock_A}) | |
| (inv:Investor)-[:PERFORMS]- | |
| WITH COUNT(DISTINCT inv) AS common_investors | |
| MATCH (a:Stock {symbol: $stock_A}) | |
| WITH common_investors, COUNT(DISTINCT post) AS total_investors_A | |
| MATCH (b:Stock {symbol: $stock_B}) | |
| WITH common_investors, total_investors_A, COUNT(DISTINCT post) AS total_investors_B | |
| RETURN common_investors / SQRT(total_investors_A * total_investors_B) AS jaccard_proximity | |
| ”””) | |
| information_proximity = CALC_COSINE_SIMILARITY( | |
| GET_TOPIC_VECTOR(stock_A), | |
| GET_TOPIC_VECTOR(stock_B) | |
| ) | |
| sentiment_spillover = CALC_SENTIMENT_TRANSFER(stock_A, stock_B, analysis_period) | |
| // Temporal lead-lag analysis | |
| granger_causality = PERFORM_GRANGER_TEST( | |
| GET_SOCIAL_ACTIVITY_SERIES(stock_A), | |
| GET_PRICE_SERIES(stock_B), | |
| analysis_period | |
| ) | |
| comovement_network[stock_pair] = { | |
| ‘price_correlation’: price_corr, | |
| ‘social_proximity’: social_proximity, | |
| ‘information_proximity’: information_proximity, | |
| ‘sentiment_spillover’: sentiment_spillover, | |
| ‘granger_causality’: granger_causality, | |
| ‘comovement_anomaly’: IDENTIFY_ANOMALOUS_COMOVEMENT(price_corr, social_proximity) | |
| } | |
| END FOR | |
| RETURN BUILD_COMOVEMENT_NETWORK(comovement_network) | |
| END | |
References
Publisher’s Note: IMR Press stays neutral with regard to jurisdictional claims in published maps and institutional affiliations.