

 , Chengyong Jiang 1,†, Wenbin Xie 1, Weilong Li 1, Qingyuan Chen 1, Yiheng Wang 1, Yuqing Chen 1, Junwen Luo 1, Su Jiang 1,2, Jiayi Zhang 1,*
 , Biao Yan 1,*
1 State Key Laboratory of Brain Function and Disorders, MOE Frontiers Center for Brain Science, Institutes of Brain Science, Institute for Medical and Engineering Innovation, Department of Ophthalmology, Eye & ENT Hospital, Fudan University, 200031 Shanghai, China
2 Department of Hand Surgery, National Clinical Research Center for Aging and Medicine, Huashan Hospital, Institute of Engineering and Application Technology, Fudan University, Department of Hand and Upper Extremity Surgery, Jing’an District Center Hospital, Shanghai Clinical Medical Center for Limb Function Reconstruction, 200040 Shanghai, China
†These authors contributed equally.
Abstract
The dorsal lateral geniculate nucleus (dLGN) exhibits remarkable functional diversity, yet a systematic classification of its neuronal properties and the subcortical mechanisms that modulate these representations remains to be fully elucidated.
In this study, we performed a comprehensive functional mapping of the mouse dLGN using a diverse battery of visual stimuli. Neurons were grouped into clusters using unsupervised clustering of multi-dimensional response features, and the superior colliculus (SC) was pharmacologically silenced to assess its modulatory role.
We identified at least 33 distinct functional clusters characterized by specialized tuning for contrast, frequency, and speed, as well as direction and orientation selectivity, providing a high-dimensional atlas of dLGN diversity. SC suppression triggered a multidimensional reorganization of dLGN properties that was cluster-specific and selectively affected various functional indices, including contrast sensitivity and feature selectivity, depending on the cell group.
These results indicate that distinct functional clusters of dLGN neurons exhibit heterogeneous modulation by SC inputs, demonstrating that collicular inputs are essential for shaping the diverse functional profiles of thalamic visual channels.
Graphical Abstract
Keywords
- lateral geniculate nucleus
- functional cell types
- superior colliculus
- vision
- mice
Unraveling how visual information is integrated, transformed, and encoded as it propagates through neural circuits remains a fundamental challenge in neuroscience. The dorsal lateral geniculate nucleus (dLGN) of the thalamus serves as a pivotal relay in this hierarchy, receiving convergent input from retinal ganglion cells (RGCs) [1,2] and transmitting integrated signals to the primary visual cortex [3,4]. Consequently, characterizing the functional diversity of dLGN neurons and their specific encoding properties is essential for deciphering how visual signals are selectively routed and modulated at this critical subcortical stage, and for elucidating the cellular substrates that underlie parallel processing streams in the early visual system.
Accumulating evidence has demonstrated that dLGN neurons exhibit extensive functional diversity, actively shaping the visual information transmitted to the cortex [3,5,6,7,8]. An individual dLGN neuron receives convergent input from many types of RGCs [1,9,10], which themselves encode distinct visual features and have been classified into more than 30 functional types [11]. Consequently, dLGN neurons encode a broad spectrum of classical visual features previously characterized in RGCs, including center–surround receptive fields [12], ON/OFF polarities, sustained or transient firing patterns [13], direction and orientation selectivity (DS/OS) [14,15], as well as temporal frequency preferences [6,16]. Recent efforts using multichannel extracellular recordings have decomposed the dLGN responses to ‘chirp’ stimuli into 29 distinct components [1]. In parallel, transcriptomic profiling based on single-cell RNA sequencing has delineated three gamma-aminobutyric acid (GABA)ergic and three glutamatergic neuronal subtypes within the dLGN [17]. These molecular classifications provide a foundational framework for defining dLGN cell type identities, yet they cannot fully substitute for functional phenotyping. Transcriptomic signatures reflect the intrinsic molecular potential of neurons, while functional classification captures how these cells actually encode and process visual information in intact circuits, making the two approaches complementary. However, a comprehensive catalog that systematically characterizes the functional properties across dLGN cell types remains lacking.
Anatomical studies in mice have revealed that approximately 80% of RGCs innervating the dLGN also send collateral projections to the superior colliculus (SC) [18]. Earlier studies suggested that SC input modulates dLGN activity via a general response gain mechanism, because suppressing the SC was found to reduce visually evoked responses but left surround suppression largely unaffected [19]. More recent work, however, has shown that SC input can also influence the content of visual tuning itself, as suppression of collicular input not only decreases response magnitude but also weakens motion selectivity in a subset of shell neurons [20]. Despite these findings, the comprehensive impact of SC inputs on the diverse visual representations across the functionally heterogeneous dLGN population remains largely unexplored.
To address these questions, we systematically characterized the functional diversity of dLGN neurons and investigated the contribution of SC inputs to visual encoding. Using multichannel extracellular recordings, we captured dLGN neuronal responses to a comprehensive battery of visual stimuli. We then employed unsupervised clustering to classify dLGN neurons into functionally distinct groups based on their multi-dimensional response profiles. This approach allowed us to quantify encoding properties across these functional classes and examine their pairwise correlations. Furthermore, by pharmacologically suppressing SC activity while tracking the same dLGN units, we directly compared their encoding properties in the presence and absence of SC influence. Collectively, our results provide a comprehensive framework for understanding how SC inputs differentially modulate specific classes of dLGN neurons, revealing a subcortical mechanism for visual information processing.
C57BL/6J male and female mice (Shanghai JieSiJie Laboratory Animal Co., Ltd., Shanghai, China), 2–3 months of age were used. The mice were raised and bred in controlled environmental conditions, including a room temperature of 23 ± 2 ℃, a relative humidity of 60–65%, and a 12-hour light/12-hour dark cycle.
The mice were maintained under 1.2% isoflurane (R511-32, RWD Life Science, Shenzhen, China) anesthesia and head-fixed in a stereotaxic apparatus. Anesthetic depth was monitored throughout the experiment by testing the absence of withdrawal reflexes to toe pinch. Temperature was measured with a rectal probe and maintained by a feedback-controlled heating pad set to 36.5°C. The platform was adjusted such that the craniotomy plane was vertical to the electrodes.
Silicon electrodes (P32-1-1A6, BlackRock, Microsystems, Salt Lake City, UT, USA) were used for all the extracellular recordings. For recordings in the SC, electrodes were inserted through a craniotomy 600–800 μm lateral and 600–800 μm anterior and 1000–1800 μm down from lambda. For recordings in dLGN, electrodes were inserted through a craniotomy 2050–2200 μm lateral and 2450–2550 μm posterior to bregma and 2200–3000 μm down from the cortical surface.
In order to have a broad silencing of SC, we injected about 100 nL of 2.5 mM fluorescent-conjugated muscimol (M23400, ThermoFisher, Waltham, MA , USA) in the brain regions by a Drummond Nanoject volume injector (with a volume rate of 2.3 nL per second). The targeting of these areas followed the targeting of the recording electrodes. Recording commenced 40 min after muscimol injection [21,22]. The final extent of muscimol spread was verified histologically based on the intrinsic fluorescence of the conjugated muscimol.
Visual stimuli were generated in Python using PsychoPy (version 2023.2.3; Open Science Tools Ltd., Nottingham, England, UK) and presented on a calibrated LED monitor (F23238FL0, Lenovo, Beijing, China) at 60 Hz. An LED screen was placed 20 cm from the mouse’s left eye. For measuring the functional properties, we presented seven types of visual stimuli: (1) Receptive field mapping. Small squares (5° × 5°) were flashed on and off at different locations on the stimulus monitor (represented by a rectangle). (2) The drifting gratings stimulus consisted of a full-field drifting sinusoidal grating at a single spatial frequency (0.04 cycles per degree (cpd)) and contrast (80%). The grating was presented at eight different directions (separated by 45°) and at five temporal frequencies (1, 2, 4, 8 and 15 Hz). Each grating was presented for 2 s, followed by 1 s of mean-luminance gray. Each grating condition was presented 10 times. Trials were randomized [11,23,24]. (3) The static grating stimulus consisted of a full-field static sinusoidal grating at a single contrast (80%). The grating was presented at eight different orientations (separated by 45°), five spatial frequencies (0.02, 0.04, 0.08, 0.16 and 0.32 cpd), and four phases (0, 0.25, 0.5 and 0.75). The grating was presented for 0.25 s, with no inter-grating gray period. Each grating condition was presented ~10 times. Trials were randomized [23]. (4) Full field illumination modulated by a “chirp” in frequency or amplitude according to a previous study [11]. (5) A black disk non-linearly expanded from 2° to 50° diameter with different speeds (10°/s, 20°/s, 40°/s, 80°/s , 160°/s, 320°/s) at the center of a gray screen. Stationary at 50° for 250 ms, followed by gray background for 2 s. Each condition was repeated 10 times [25,26]. (6) A white disk non-linearly expanded from 2° to 50° diameter with different speeds (10°/s, 20°/s, 40°/s, 80°/s ,160°/s, 320°/s) at the center of a gray screen. Stationary at 50° for 250 ms, followed by gray background for 2 s. Each condition was repeated 10 times. (7) Blue (465 nm, ~30 mW/mm2) and green light (530 nm, ~27 mW/mm2) flashes were presented 50 times with 250 ms duration and 250 ms interstimulus interval [26].
Before recording from the dLGN, electrodes were coated with a red-shifted fluorescent lipophilic tracer (DiD, 1,1′-Dioctadecyl-3,3,3′,3′-Tetramethylindodicarbocyanine Perchlorate, D7757, ThermoFisher). After the last recording session, mice were humanely euthanized by an overdose of isoflurane anesthesia followed by cervical dislocation, in accordance with institutional and national guidelines for animal care and use. They were then transcardially perfused with 4% paraformaldehyde phosphate-buffered saline (PBS) solution, and the brains were post-fixed for 24 h. Using a vibratome (CM1950, Leica, Nussloch, Germany), the perfused brains were sliced coronally with a thickness of 50 μm and mounted on glass slides with DAPI (4′,6-diamidino-2-phenylindole, D9542, Sigma-Aldrich, St. Louis, MO, USA), and then cover slipped. Slices were photographed using epifluorescence microscope (VS200, Olympus Corporation, Tokyo, Japan).
All data were presented as mean ± SEM. Statistical analyses were performed by Python(version 3.10, Python Software Foundation, Wilmington, DE, USA). The normality test of the data sets was performed by the Shapiro-Wilk test. A two-tailed unpaired t-test was used for comparing two independent groups and a paired t-test for comparing the same samples with two conditions. Multiple group comparisons were assessed using two-way repeated measures ANOVA, followed by the Bonferroni’s post-hoc test when significant main effects or interactions were detected. Wilcoxon signed-rank test was used when normality was violated. Correlation analyses were performed using Pearson’s product–moment correlation for normally distributed data and Spearman’s rank correlation for non-normally distributed data. For analyses involving multiple comparisons across the full set of cluster–metric tests, false discovery rate correction was performed using the Benjamini–Hochberg procedure (false discovery rate [FDR] <0.05). The change of overall transition pattern was analyzed using a chi-square test. *p < 0.05, **p < 0.01, and ***p < 0.001.
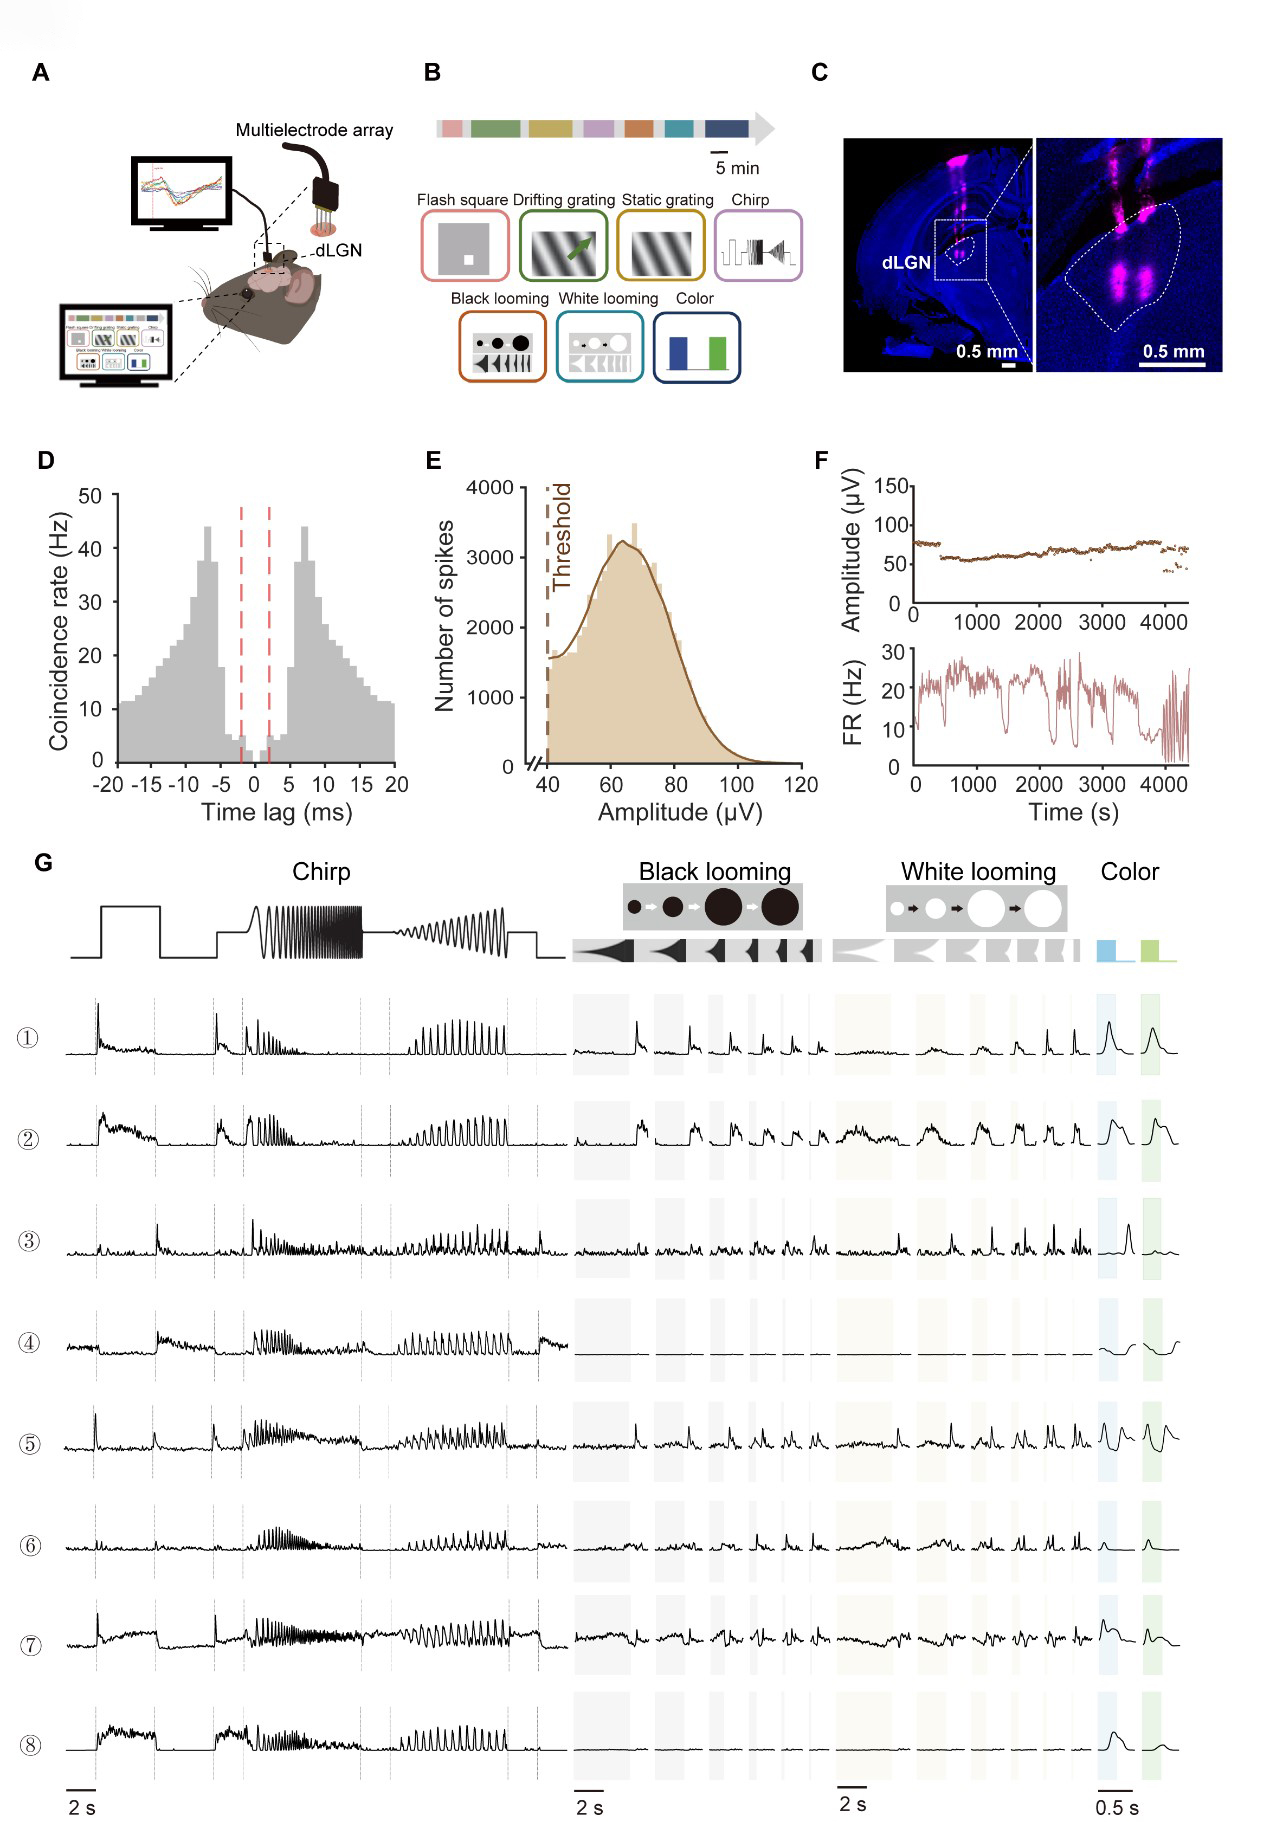
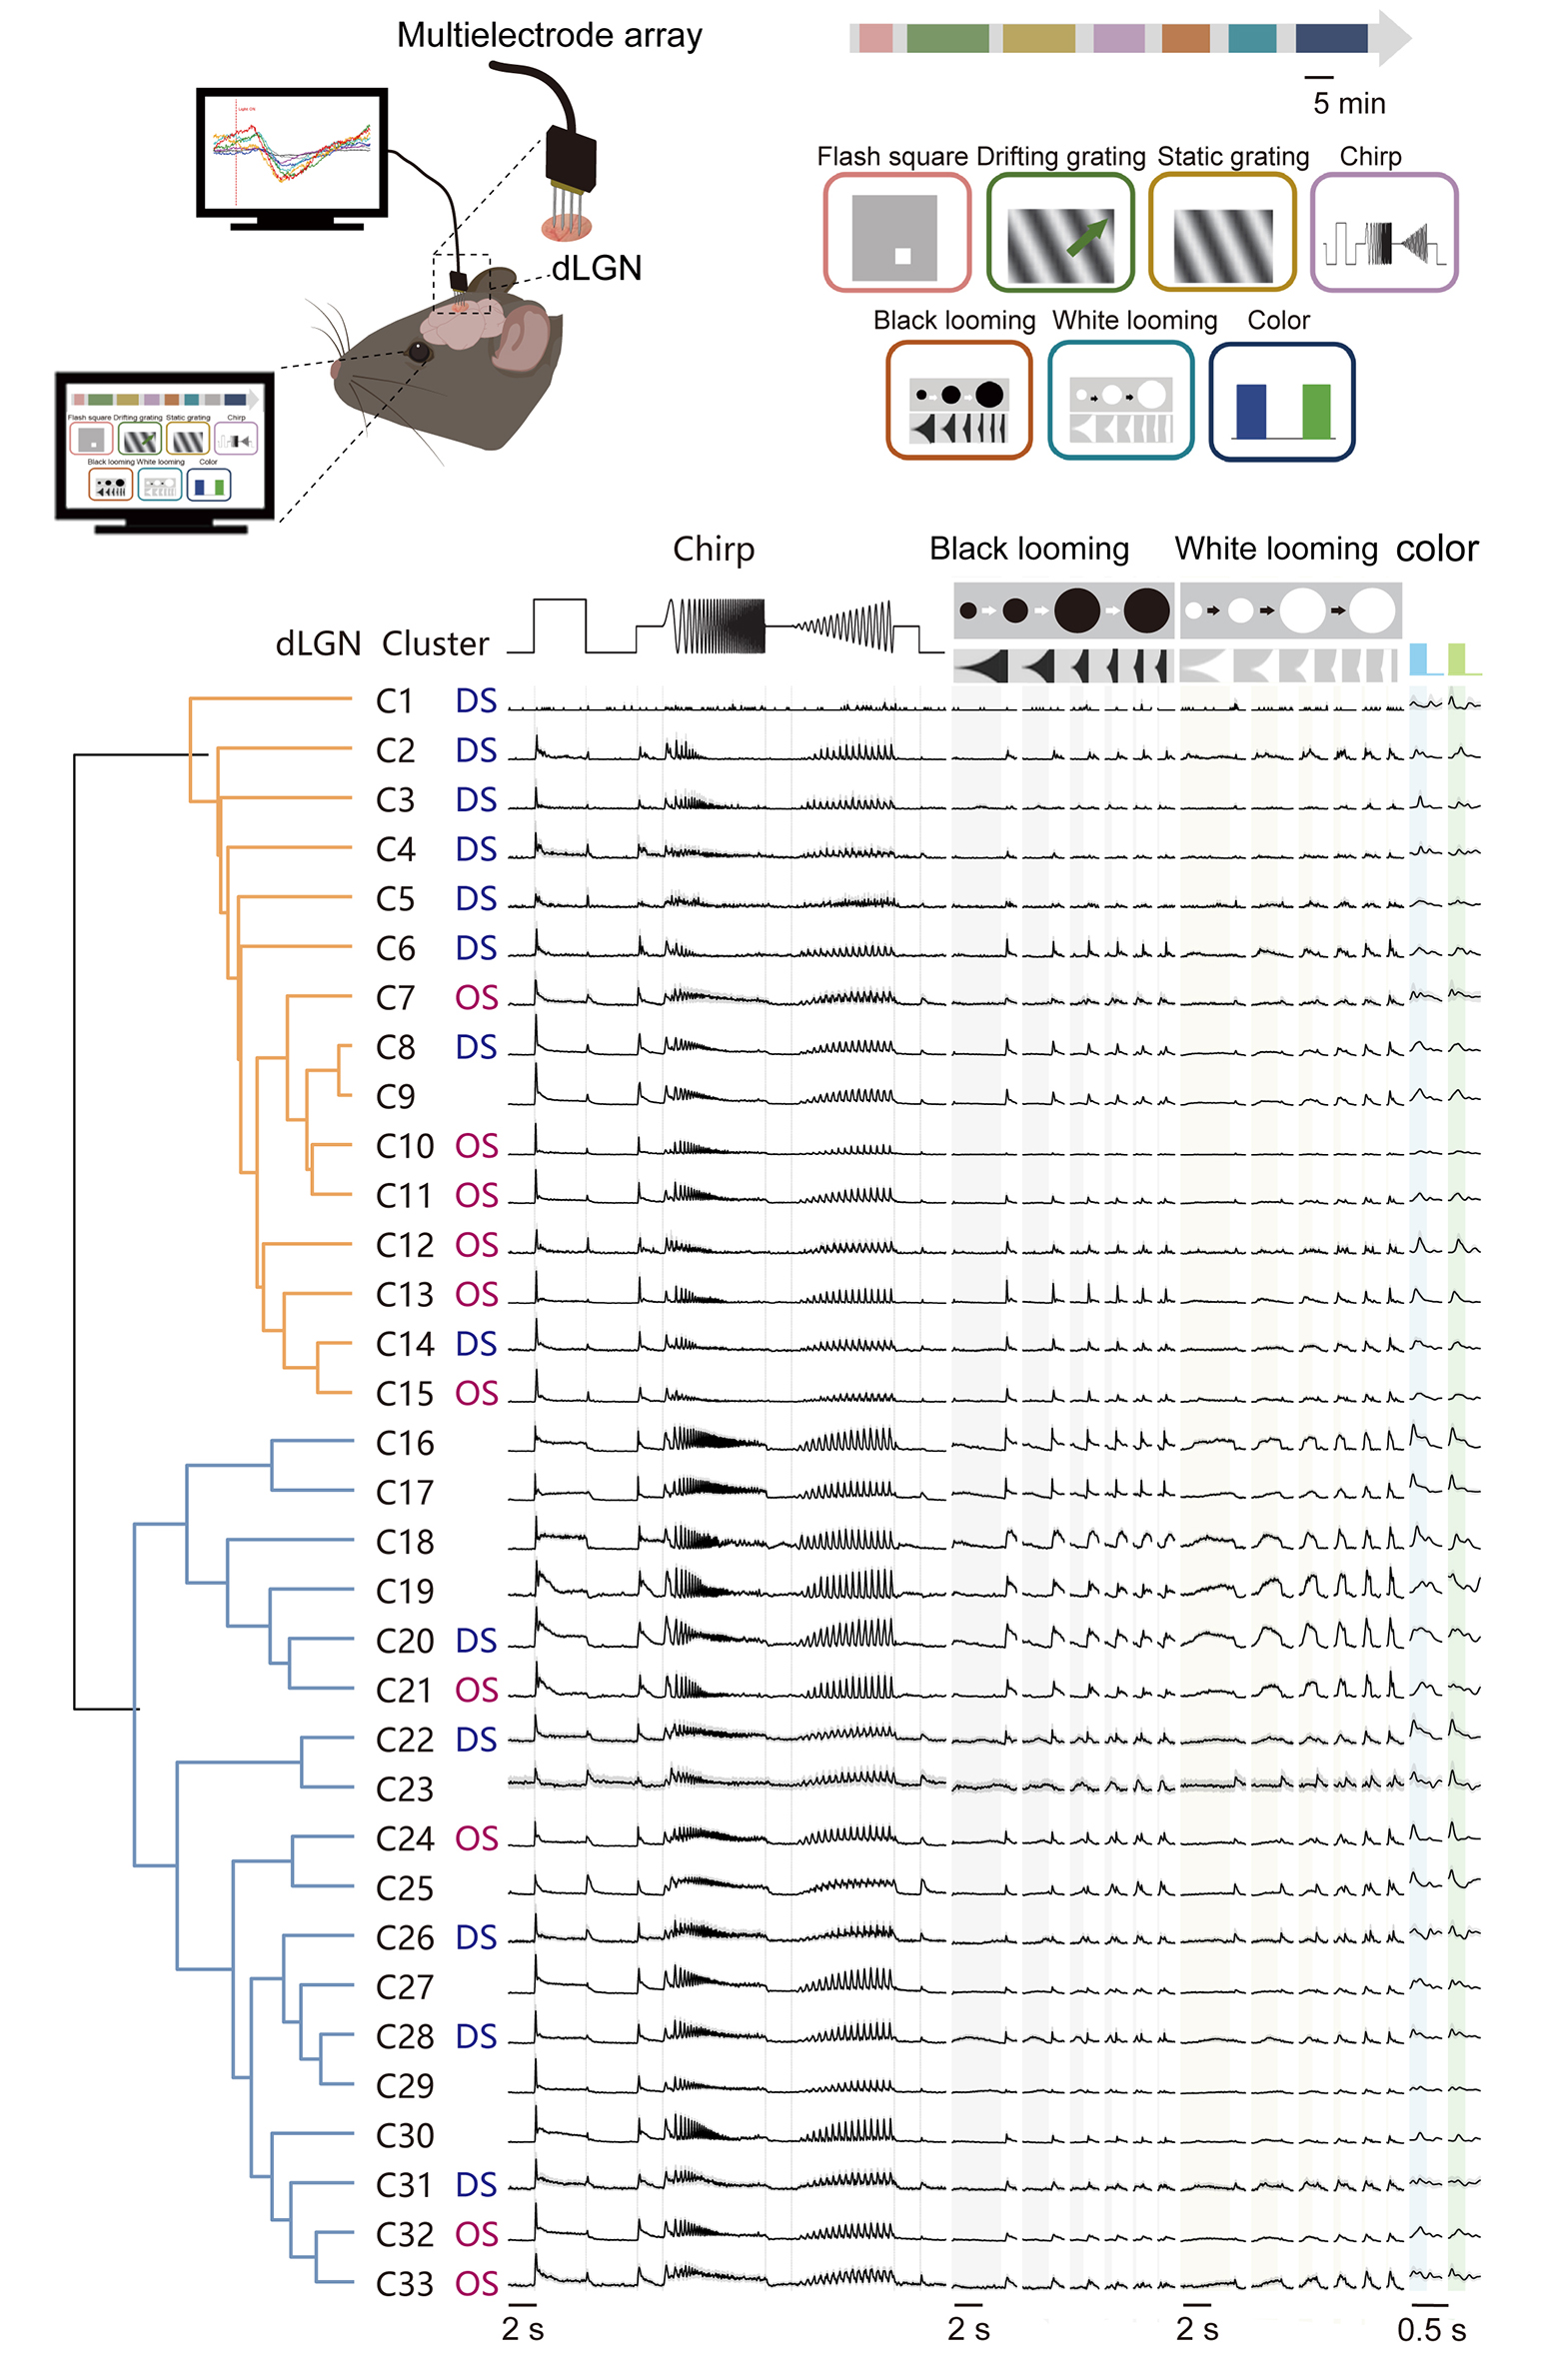
To investigate the functional diversity of dLGN neurons systematically, we performed extracellular recordings in mice (Fig. 1A). Neuronal responses were recorded using a comprehensive battery of visual paradigms, including flashing squares, drifting and static gratings, full-field ‘chirp’ signals, black and white looming, and blue/green full-field flashes (Fig. 1B; see Methods for details). To ensure anatomical precision, electrode tips were labeled with DiD prior to recording, and all recording sites subsequently were verified through histological reconstruction of the electrode trace (Fig. 1C).
 Fig. 1.
Functional characterization of mouse dorsal lateral geniculate nucleus (dLGN) neurons. (A) Schematic of acute extracellular recordings in anesthetized C57BL/6J mice using a 32-channel silicon probe targeting the dLGN. (B) Seven visual paradigms were provided to map dLGN response properties. The paradigms were presented in repeated blocks. Scale bar, 5 min. The green arrow is the example direction of the moving light stimulus. (C) DiD-labeled probe track in dLGN (magenta, DiD; blue, DAPI). Right panel shows a magnified view of the boxed region in the left panel. Scale bar = 0.5 mm. (D) Autocorrelogram of an example neuron. The x-axis represents the time lag between spikes, and the y-axis indicates the spike coincidence rate (Hz). The red dashed lines mark the ±2 ms refractory-period window. (E) Distribution of spike peak amplitudes for the same unit in (D) (peak relative to baseline). The dashed line denotes the detection threshold, defined as 4 times of standard deviation from mean of peak height histogram. (F) Within-session stability of the example unit, showing spike peak amplitude (top) and firing rate (bottom) across recording time. (G) Raw response traces from eight representative single-units across the stimulus battery. Trial-averaged responses are shown in black (Repeats, n = 10 for chirp; n = 10 for black/white looming; n = 50 for blue–green flicker). Shaded time windows indicate stimulus epochs (gray, black looming expansion; yellow, white looming expansion; blue, blue-light ON; green, green-light ON). FR, firing rate; DiD, 1,1′-Dioctadecyl-3,3,3′,3′-Tetramethylindodicarbocyanine Perchlorate; DAPI, 4′,6-diamidino-2-phenylindole.
We isolated 3021 single units from 28 mice. Data quality was rigorously assessed to ensure the robustness of the physiological data. We observed a marked reduction in spike co-occurrence probability within the short latency interval around 0 ms, consistent with the refractory period characteristic of single-units (Fig. 1D). Furthermore, the recorded spikes exhibited high signal-to-noise ratios, with peak-to-trough amplitudes significantly exceeding background levels (Fig. 1E). Both spike amplitudes and firing rates remained stable throughout the duration of the recording sessions (Fig. 1F), confirming the long-term reliability of our data.
Fig. 1G illustrates representative dLGN neuronal responses to the visual stimulus battery. Consistent with previous reports [1,13], we observed diverse response patterns, including ON-transient (example 1), ON-sustained (example 2), OFF-transient (example 3), OFF-sustained (example 4), and ON-OFF (example 5) profiles, which were similar to the functional features established in RGCs. Beyond these classical categories, dLGN responses to the ‘chirp’ stimulus were highly heterogeneous. In addition to canonical transient or sustained dynamics, dLGN neurons displayed distinctive temporal frequency preferences and contrast-tuning properties. For instance, certain units showed markedly higher frequency sensitivity compared to others (e.g., example 8 vs. 1). Furthermore, while some neurons scaled their firing rates with increasing contrast (example 2), others remained largely invariant to contrast changes (example 4). In the looming paradigm, we also observed significant functional divergence. Some neurons exhibited robust excitation that scaled with the expansion speed (example 6), whereas others were strongly suppressed (example 7) or remained non-responsive (example 8) to the expanding stimuli. This rich functional landscape underscored the complexity of visual feature encoding within the dLGN.
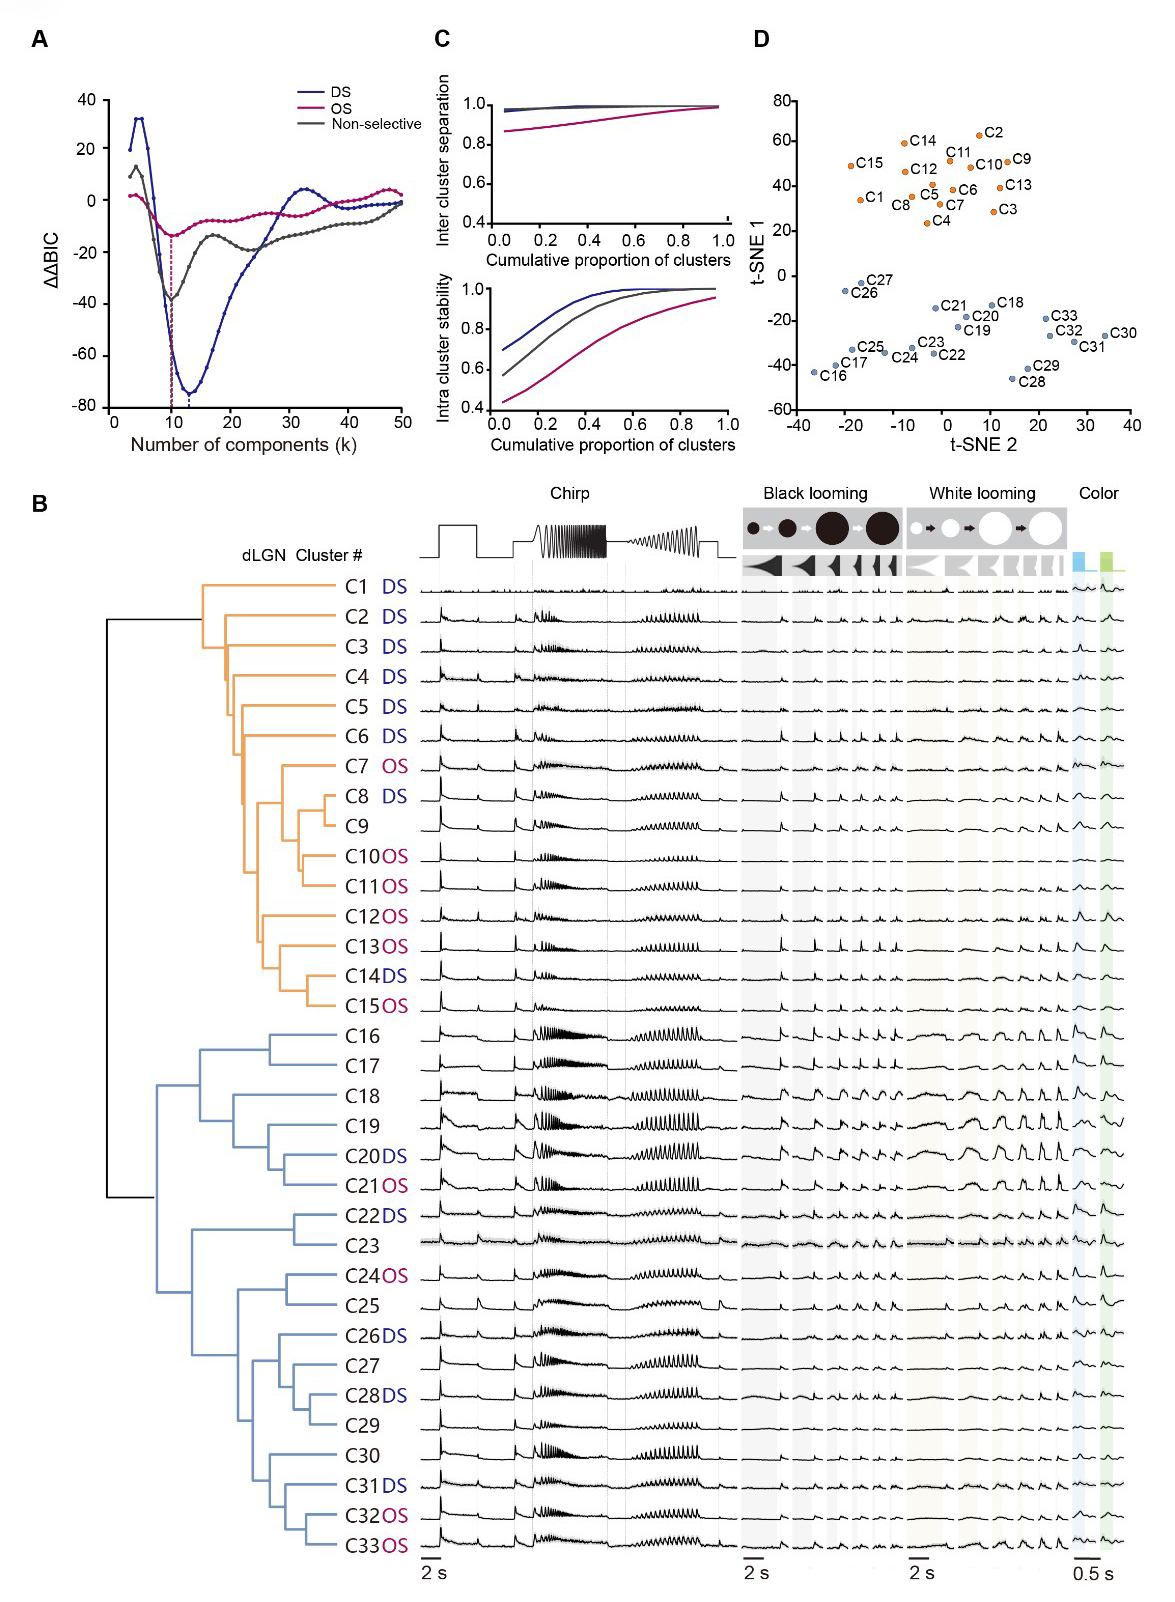
To achieve an unbiased characterization of the comprehensive dLGN responses, we used an unsupervised clustering approach as previously described [11,26,27]. We first decomposed the single-unit responses to various stimuli into discrete functional components using non-negative matrix factorization (NNMF) (Supplementary Fig. 1A). The optimal number of components was determined by selecting the rank that minimized the average mean squared error (MSE) across 200 independent runs, within a 5% tolerance margin via NNMF cross-validation (see Methods). This process yielded 22 components from ‘chirp’ responses, 8 from black looming, 6 from white looming, 5 each from blue and green full-field stimulus (Supplementary Fig. 1B,D). Subsequently, all 3021 units were categorized into DS (n = 917), OS (n = 512), and non-selective (non-DS/OS; n = 1592) groups based on their direction selectivity index (DSI) and orientation selectivity index (OSI) derived from their responses to drifting and static gratings (see Methods). Within each predefined group, units were further subdivided using a Gaussian mixture model (GMM) (Supplementary Fig. 1C). Ultimately, 33 clusters were identified by minimizing the Bayesian Information Criterion (BIC) (Fig. 2A,B). We assessed cluster quality using resampling-based intra-cluster stability and inter-cluster separation metrics (Fig. 2C and Supplementary Fig. 1E). Stability was quantified as the fraction of cells consistently reassigned to the same cluster across bootstrap subsamples, while separation measured the degree of cross-cluster ambiguity. The discrete structure of these 33 functional clusters was further visualized using t-distributed stochastic neighbor embedding (t-SNE) (Fig. 2D).
 Fig. 2.
Functional cell clusters in the mouse dLGN. (A) Second-order difference in Bayesian information criterion (ΔΔBIC) for Gaussian mixture models fitted separately to DS, OS, and non-selective partitions across different numbers of components (k); minima indicate the preferred model order. (blue, direction selectivity (DS) clusters; magenta, orientation selectivity (OS) clusters; gray, non-selective clusters). (B) Representative raw response traces for the 33 data-driven clusters across chirp, black/white looming, and alternating blue–green flicker. Traces show the cluster-averaged time course, with gray shading indicating ± 95% CI across units within each cluster. Cluster labels denote DS, OS, or non-selective designations (left). Vertical scaling is identical across clusters and stimulus conditions. Total dataset: N = 3021 units from 28 mice. Shaded time windows indicate stimulus epochs (gray, black looming expansion; yellow, white looming expansion; blue, blue-light ON; green, green-light ON). (C) Cluster quality metrics for the clustering solution in (A), shown as cumulative distributions of inter-cluster separation (top) and intra-cluster stability (bottom). (D) Low-dimensional embedding (t-distributed stochastic neighbor embedding [t-SNE]) of cluster centroids, with points colored to match dendrogram branch assignment.
Among the 33 identified functional clusters (Fig. 2B), 13 groups exhibited direction selectivity, while 10 displayed orientation selectivity. When characterized by their responses to full-field stimuli, a substantial majority of the clusters (e.g., C2–C15) showed canonical ON/OFF-transient profiles. In contrast, a distinct subset (e.g., C16–C20) was characterized by ON-sustained responses. Notably, no prominent OFF-dominant groups were detected across the population. Some clusters (e.g., C19-C20) exhibited response properties closely resembling the OFF-suppressed RGC type described in earlier studies [11,28]. These results indicated a high degree of fidelity in the thalamic relay of specialized retinal signals.
We further characterized the heterogeneous response profiles of dLGN functional clusters across the visual stimulus battery. For instance, specific clusters exhibited selectivity for distinct flicker frequencies (e.g., C16, C17) or varied contrast levels (e.g., C20, C21, C27, and C30). Other groups, such as C4, C10, and C29, displayed weak temporal locking to high-frequency sinusoidal flickers and limited responsiveness to high-speed black looming stimuli. Notably, we observed diverse modulation by looming stimuli. While clusters C16, C17, and C20 were suppressed by black looming, a subset of clusters (particularly C22–C28) showed responses to both black and white looming. Additionally, several non-selective clusters (e.g., C16–C19) showed a preference for white over black looming. RGC inputs provide the primary functional foundation of dLGN responses [1,9,10], and our results further suggest that these response profiles can be additionally modulated by SC input.
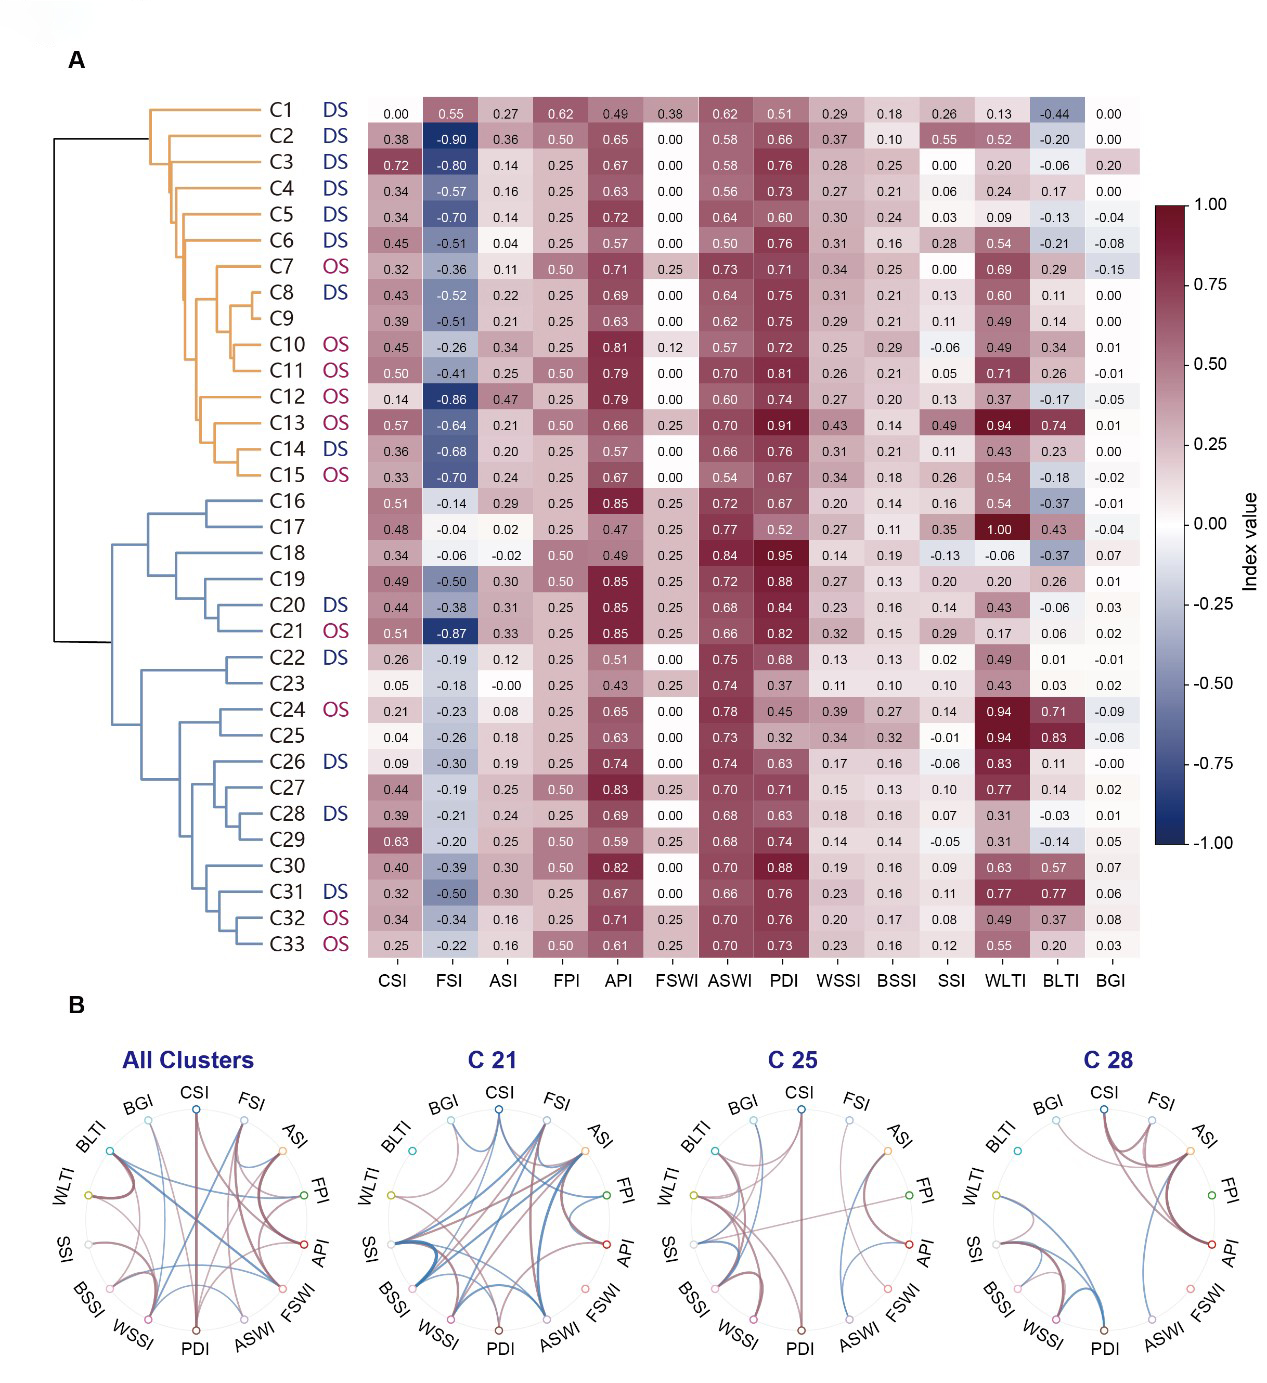
To characterize the functional properties of the identified dLGN clusters, we calculated 14 quantitative indices derived from neuronal responses across the stimulus set (Fig. 3A and Supplementary Fig. 2; see Methods). All indices were normalized to either [−1, 1] or [0, 1] to facilitate standardized comparisons across clusters. The distributions of these indices for representative clusters are shown in Supplementary Fig. 2, and the mean values for all 33 clusters are summarized in Fig. 3A.
 Fig. 3.
Visual functional properties in different clusters of dLGN. (A) Heatmap summarizing 14 response indices across 33 clusters: contrast selectivity index (CSI), frequency selectivity index (FSI), amplitude selectivity index (ASI), frequency preference index (FPI), amplitude changes preference index (API), frequency selectivity window index (FSWI), amplitude selectivity window index (ASWI), phase delay index (PDI), white speed selectivity index (WSSI), black speed selectivity index (BSSI), (speed selectivity index (SSI), white looming tuning index (WLTI), black looming tuning index (BLTI) and blue-green index (BGI). (B) Inter-index correlation networks. Chord diagrams summarize significant pairwise correlations among the 14 functional indices computed across all neurons pooled (left), with three example cluster-specific networks shown for C21, C25, and C28 (right). Only correlations passing the significance criterion are displayed (blue, negative; red, positive); edge thickness scales with (|R|). Complete per-cluster networks are provided in Supplementary Fig. 3.
Regarding contrast tuning, clusters C3 and C29 exhibited the highest contrast sensitivity index (CSI), whereas others, such as C19–C21, were characterized by a higher amplitude sensitivity index (ASI) and amplitude changes preference index (API). Temporal frequency preferences were also heterogeneous across the groups. Clusters C17 and C18 combined a high frequency selectivity index (FSI) with an elevated frequency selectivity window index (FSWI), indicating a broad responsiveness shifted toward higher temporal frequencies compared to the rest of the population. Analysis of temporal dynamics via the phasedelay index (PDI) further identified delayed flicker responses in several clusters, notably C18 and C30. Speed sensitivity exhibited further variation across the identified clusters. C24 and C25 showed high selectivity for expansion speed, as manifested by their elevated white and black speed selectivity index (WSSI and BSSI). Tuning for looming stimuli provided additional functional segregation. Clusters C24 and C25 also exhibited positive tuning for both white (white looming tuning index [WLTI]) and black (black looming tuning index [BLTI]) looming, indicative of expansion-dependent excitation, while C16 and C18 were suppressed by faster looming stimuli. Finally, the blue-green index (BGI) indicated a lack of significant chromatic bias across the sampled dLGN population.
To evaluate the interdependence among response features, we calculated pairwise correlations between all 14 indices, generating correlation matrices for both the total population and individual clusters (Fig. 3B). At the population level, the global correlation map revealed systematic relationships between specific features. For instance, the ASI was positively correlated with the API but negatively correlated with the FSI. Additionally, the WSSI showed strong positive correlations with the BSSI, while the WLTI was positively correlated with the BLTI. However, these correlation patterns were highly heterogeneous across different clusters (Fig. 3B and Supplementary Fig. 3). For example, C21 exhibited broad inter-dependencies across contrast-, frequency-, and speed-related metrics. In contrast, correlations in C25 and C28, for example, were more localized, primarily restricted to speed-related indices or contrast-frequency. These results demonstrate that the functional diversity of the dLGN is defined not only by distinct tuning preferences but also by cluster-specific strategies for co-encoding and integrating multidimensional visual information.
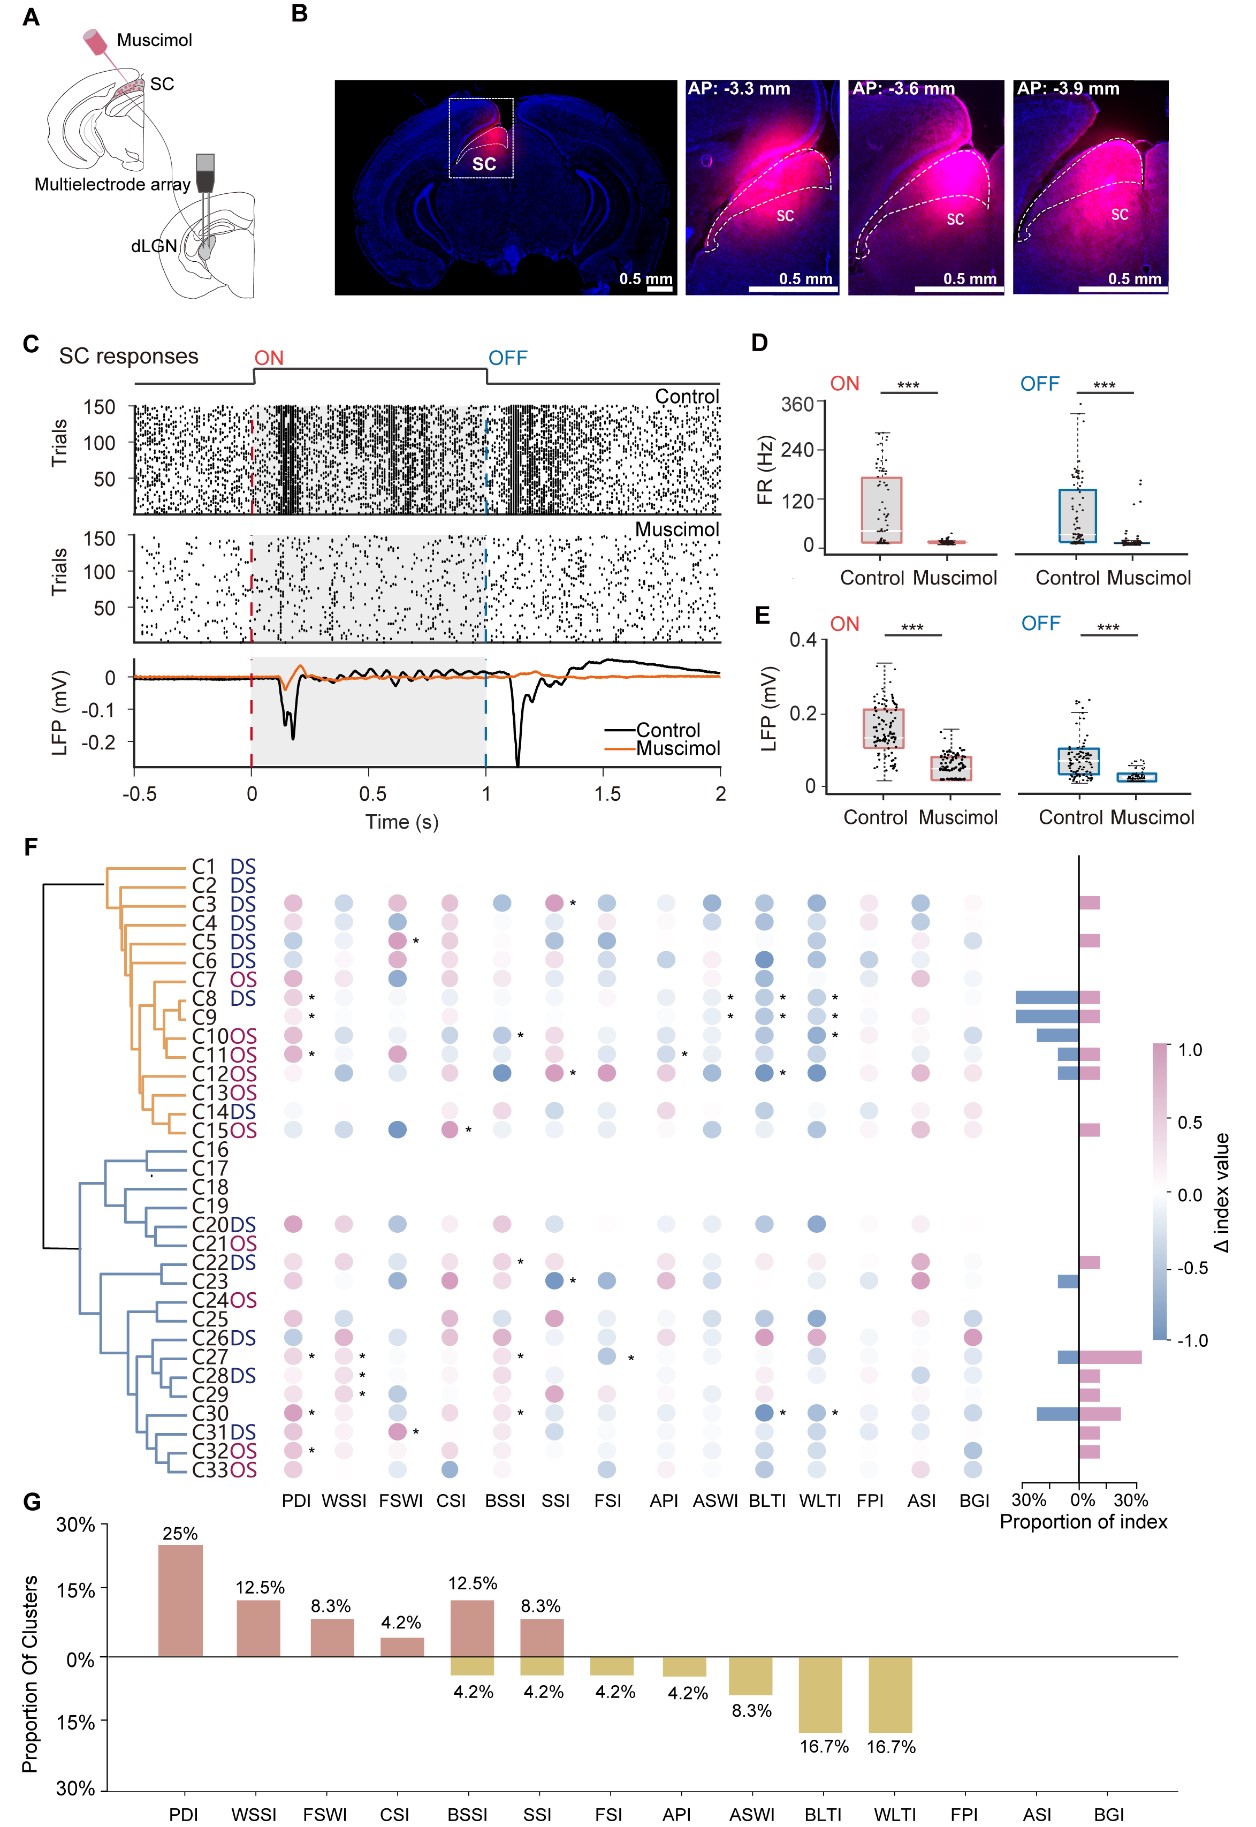
Building on the findings that the SC provides direct innervation to dLGN [29,30], we next investigated the functional contribution of SC activity to dLGN diversity. The SC was silenced by local injection of muscimol, a potent agonist of GABAA receptors (Fig. 4A). Histological analysis confirmed that the spread of muscimol was restricted to the SC (Fig. 4B). To validate the efficacy of pharmacological silencing, we monitored SC neuronal activity before and after injection. As shown in Fig. 4C–E, muscimol administration significantly reduced light-evoked SC activity. Specifically, both ON- and OFF-response firing rates, along with their corresponding local field potential (LFP) components, exhibited a significant decrease after muscimol application, confirming a robust inactivation of SC-mediated visual processing.
 Fig. 4.
SC modulates dLGN visual properties in different clusters. (A) Schematic of muscimol injection into the superior colliculus (SC) with simultaneous multielectrode recordings in dLGN. (B) Post hoc fluorescent histology verifying muscimol spread within the SC (magenta) on a DAPI counterstain (blue). Left, low-magnification overview; right, higher-magnification coronal sections at AP −3.3, −3.6, and −3.9 mm relative to bregma. Scale bar = 0.5 mm. (C) Efficacy of SC silencing. Raster plot showing responses of an example SC unit to flash ON (red dashed line) and OFF (blue dashed line) under Control (top) and Muscimol (middle) conditions. Bottom, corresponding LFP traces averaged across trials (Control, black; Muscimol, orange); shaded epochs indicate stimulus periods. (D) SC firing-rate responses to ON and OFF flashes under Control versus Muscimol. Each dot represents a single unit; boxes summarize the distribution (median and IQR). (E) Peak-to-trough LFP voltage differences evoked by ON and OFF flashes in SC under Control versus Muscimol, quantified from the trial-averaged LFP (peak-to-trough). (F) Cluster-level changes in response indices following SC silencing in 989 paired dLGN units recorded from 14 mice. For each of the 33 clusters, bubbles show the difference in each index between conditions (Δ = Muscimol − Control) across the 14 indices. Color encodes the signed change (pink, increase; blue, decrease) and scales with |Δ|. Asterisks mark clusters exhibiting statistically significant index changes between conditions after Benjamini–Hochberg false discovery rate (BH-FDR) correction (FDR <0.05). Right, summary bars quantify, for each cluster, the number of indices showing significant increases (pink) or significant decreases (blue). (G) Proportion of clusters showing significant index modulation by SC silencing, with significant increases (orange) or significant decreases (yellow) in the Muscimol condition relative to Control. *p < 0.05, ***p < 0.001. AP, anterior posterior; LFP, local field potential; IQR, interquartile range.
We subsequently performed extracellular recordings from the same dLGN units before and after SC suppression. Paired comparisons revealed heterogeneous shifts in functional indices across the population (Fig. 4F). At the cluster level, the proportion of significant increases was highest for PDI. WSSI, FSWI, CSI, BSSI, and speed selectivity index (SSI) also more commonly showed increases, whereas FSI, API, amplitude selectivity window index (ASWI), BLTI, and WLTI more commonly showed decreases, with the reductions in BLTI and WLTI being particularly prominent (Fig. 4G and Supplementary Fig. 4). By contrast, no clear cluster-level changes were observed for frequency preference index (FPI), ASI, or BGI.
Notably, SC suppression increased CSI in C15 (Supplementary Fig. 5A). SC inactivation selectively attenuated frequency-related metrics (e.g., decreased FSI in C27; Supplementary Fig. 5B). This pattern suggests that endogenous SC input may facilitate temporal tuning while constraining contrast sensitivity in specific neurons. Cluster-specific heterogeneity was also observed in contrast processing. Temporal dynamics, quantified by PDI, were also modulated (e.g., C32; Supplementary Fig. 5C). Based on the shape of the average firing traces, we further observed that some clusters exhibited prominent peak components at stimulus onset. After SC suppression, this second response peak was markedly reduced, which likely reflects a component contributed by SC input (e.g., C09; Supplementary Fig. 5D).
Furthermore, SC suppression modulated speed tuning, generally increasing speed selectivity (WSSI/BSSI) concomitant with a decrease in tuning quality (WLTI/BLTI) (Fig. 4G). These effects varied across clusters. SC suppression selectively increased WSSI in C29 and BSSI in C30, while decreasing BSSI in C10; in contrast, C27 showed broad increases across both indices (Supplementary Fig. 5E–G). Collectively, these results indicate that the SC does not merely provide uniform excitatory drive, but instead contributes to a multidimensional reorganization of functional encoding within the dLGN.
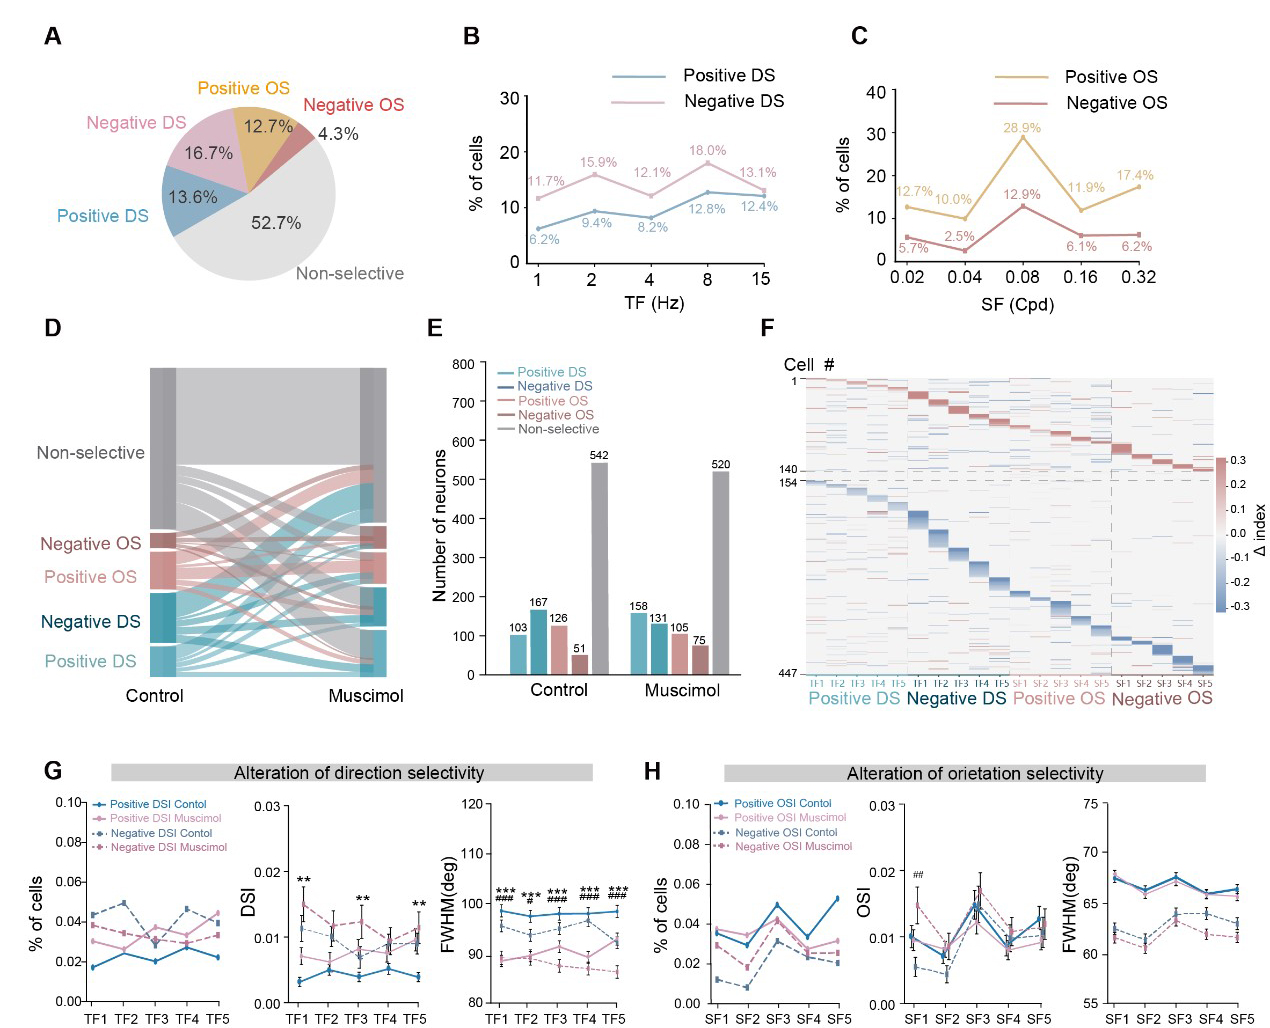
Direction and orientation selectivity are also the core components of the functional landscape of the dLGN [13,14]. To further characterize these properties, we recorded neuronal responses to full-field drifting and static gratings spanning five orders of magnitude in temporal and spatial frequencies, respectively. While a substantial subset of units exhibited distinct DS and OS tuning, others were non-selective to the stimuli presented. Consistent with previous reports [31], we found that the DS and OS responses of dLGN units could be decomposed into positive and negative selectivity indices (Supplementary Fig. 6). We quantified the distribution of these responses and found that the DS population comprised 13.6% positive and 16.7% negative units. In comparison, the OS population comprised 12.7% positive and 4.3% negative units (Fig. 5A). The prevalence of these DS responses remained broadly distributed across temporal frequencies from 1 to 15 Hz, with only modest variation in their proportions (Fig. 5B). In contrast, the proportions of both positive and negative OS cells reached a peak at a spatial frequency of 0.08 cycles/deg (cpd) (Fig. 5C), consistent with the canonical band-pass profile of spatial frequency tuning observed in the dLGN [13,14].
 Fig. 5.
SC inactivation modulates DS/OS selectivity in dLGN across different spatiotemporal frequency. (A) Population fractions of five response classes: positive DS, negative DS, positive OS, negative OS, and non-selective. (B) Fraction of units exhibiting direction selectivity as a function of temporal frequency (TF), plotted separately for positive and negative DS. Units were counted at each TF if direction selectivity index (DSI) >0.1 under that TF condition. (C) Fraction of units exhibiting orientation selectivity as a function of spatial frequency (SF), plotted separately for positive and negative OS. Units were counted at each SF if orientation selectivity index (OSI) >0.1 under that SF condition. (D) Sankey diagram showing transitions of individual dLGN units among five response classes (positive DS, negative DS, positive OS, negative OS, and non-selective) from Control to Muscimol conditions. Bandwidth is proportional to the number of units switching between classes. Class transitions were significantly non-random (chi-square test: χ2 = 132.92, df = 16, p = 1.74 × 10⁻²⁰). (E) Bar plot of the number of units in each response class under Control and Muscimol conditions. (F) Single-unit heatmap of selectivity changes induced by SC silencing. For each unit (rows), the plot shows the within-neuron difference between conditions (Δ = Muscimol − Control) in positive/negative DSI across temporal frequencies and positive/negative OSI across spatial frequencies (TF1–TF5 denote 1, 2, 4, 8, and 15 Hz, respectively; SF1–SF5 denote 0.02, 0.04, 0.08, 0.16, and 0.32 cpd, respectively). (G) Alterations of direction selectivity across temporal frequencies (TF1–TF5). Left, proportion of units classified as positive or negative DS at each TF. Middle, corresponding DSI values. Right, tuning width quantified as full width at half maximum (FWHM). (H) Alterations of orientation selectivity across spatial frequencies (SF1–SF5). Left, proportion of units classified as positive or negative OS at each SF. Middle, corresponding OSI values. Right, tuning width at half maximum (FWHM). Data were presented as mean ± SEM. **p < 0.01, ***p < 0.001 (for positive DSI/OSI comparison); #p < 0.05, ##p < 0.01, ###p < 0.001 (for negative DSI/OSI comparison).
We examined changes in DS and OS tuning across various spatial and temporal frequencies after SC suppression. Using the same classification criteria as in the control condition, we re-evaluated the selectivity properties of each dLGN neuron after muscimol injection. The transition of these functional properties is captured by the Sankey diagram in Fig. 5D, which reveals a highly dynamic functional reorganization. Specifically, a substantial number of neurons (195/989) previously classified as DS or OS lost their selectivity after SC suppression. Conversely, a number of previously non-selective neurons (217/989) gained DS or OS preferences (Fig. 5E). These results indicate that for a subset of dLGN neurons, direction and orientation selectivity are dependent on SC-derived inputs or SC-mediated modulation.
We further examined how SC suppression affected DS and OS tuning across various temporal and spatial frequencies. Among 447 units analyzed, 140 neurons exhibited an increase in DSI or OSI, 293 showed a decrease, and 14 remained unchanged (Fig. 5F). Specifically, SC inactivation led to an increased proportion of positive DS neurons accompanied by elevated DSI values (Supplementary Fig. 7A), whereas the proportion of negative DS neurons was reduced (Fig. 5G). To assess tuning precision, we measured the full width at half maximum (FWHM) and found that the tuning curves of both positive and negative DS neurons significantly narrowed following SC inhibition (Fig. 5G and Supplementary Fig. 7B). For instance, neurons in C8 exhibited a decrease in the number of DS units, DSI, and FWHM, indicating that SC input normally enhances the directional selectivity of these dLGN neurons (Supplementary Fig. 7C–G). Regarding orientation selectivity, SC suppression increased the proportion of negative OS neurons, particularly at a spatial frequency of 0.02 cpd, while reducing the proportion of positive OS units (Fig. 5H). Notably, in contrast to DS neurons, the FWHM of OS tuning curves remained largely unaffected by SC inactivation, suggesting that orientation tuning width is independent of SC modulation (Supplementary Fig. 7B). As a representative example, C33 showed a reduction in both the number of OS neurons and their OSI after SC suppression, further supporting the role of the SC in facilitating orientation selectivity in the dLGN (Supplementary Fig. 7H–L).
In this study, we provided a comprehensive functional atlas of the mouse dLGN, identifying 33 distinct neuronal clusters through large-scale recordings and an extensive range of visual stimuli. Although recent studies have recognized the dLGN as a site of sophisticated visual integration rather than a passive relay [7,13,20,32], the full extent of its functional specialization had not been systematically defined. Our identification of these functional clusters reveals a granularization of visual channels that exceeds previous classification schemes. These groups are characterized not merely by single parameters like polarity or spatial frequency, but by unique combinations of temporal dynamics, contrast sensitivity, speed tuning, direction and orientation selectivity. This high-dimensional diversity suggests that the dLGN performs parallel preprocessing of specific visual features, potentially tailoring information streams for diverse downstream targets in visual cortex. Recent transcriptomic work has shown that mouse dLGN contains multiple molecularly distinct neuronal populations, including three GABAergic types and three glutamatergic types [17]. Future genetic approaches may link the functional clusters identified here to molecularly defined cell types.
Consistent with previous studies, our results indicate that SC inputs provide a highly specific, rather than uniform, modulation of dLGN functional channels [19,20,29,30]. The multidimensional reorganization observed upon SC inactivation, which is characterized by the selective enhancement or attenuation of feature tuning, highlighted a remarkable degree of functional plasticity within this relay. These data suggest that dLGN encoding is not solely a product of hard-wired retinal inputs. Instead, it is actively modulated by subcortical circuits, suggesting that the dLGN functions as a flexible computational hub where non-retinal signals are integrated to optimize thalamocortical output [2,19,29].
This cluster-specific modulation suggests that the dLGN serves as a site for early sensory integration where visual representations are dynamically modulated before reaching the visual cortex. Given the established role of the SC in orienting behaviors and multisensory integration [33,34], its influence on the dLGN may represent a mechanism for prioritizing behaviorally relevant visual information. The observed trade-offs between different visual features could allow the visual system to switch between high-fidelity feature detection and rapid motion processing depending on environmental demands. These findings fit with models in which thalamic circuits act as dynamic gatekeepers, coordinating sensory streams in a behavioral-state–dependent manner [35,36] , thereby modulating thalamocortical signals transmitted to downstream cortical targets.
The mouse dLGN is organized into a dorsolateral “shell” and a ventromedial “core”, each characterized by distinct input patterns. The shell region receives excitatory inputs from the superficial layers of the SC [15,30], with these terminals often co-localizing with the axons of direction-selective RGCs (DSGCs) [10,20,30,37]. In contrast, the core region receives input from both superficial and intermediate layers of the SC [30]. This highly organized anatomical convergence suggests that SC-derived signals may play a crucial role in modulating visual processing within the dLGN [29]. However, although electrode-track histology allowed us to confirm that recordings were obtained within the dLGN, the present extracellular recordings did not provide sufficient anatomical precision to reliably assign individual recorded units to the shell or core, because electrodes sample spikes from neurons within a spatial volume around the recording site [38,39,40]. Future studies will be essential to map the precise spatial distribution of these functional clusters identified within the shell and core, as well as to dissect the layer-specific contributions of the SC. Addressing this issue will help clarify how anatomical organization constrains the cluster-specific influence of SC input on visual processing in the dLGN.
Our study still has several limitations. First, while our unsupervised clustering approach identified 33 distinct groups, functional classification in the dLGN remains an ongoing challenge without a single definitive standard [5], and some redundancy or loss of subtle sub-types may exist within these categories. Second, all recordings were performed under isoflurane anesthesia, which may attenuate corticothalamic feedback, reduce behavioral-state–dependent modulation of dLGN responses, and modify visual response properties in the superior colliculus itself [41,42]. Therefore, the SC-dependent effects reported here only reflected the contribution of SC input to dLGN functional organization under anesthesia. Third, although the SC provides direct projections to the dLGN, some of the observed functional changes could be mediated through indirect pathways, such as the lateroposterior nucleus or the thalamic reticular nucleus [43,44]. Further studies using pathway-specific optogenetic tools to selectively manipulate the direct pathway, or the indirect circuits, will be essential to disentangle the specific contributions of these parallel pathways to the heterogeneous modulation of dLGN functional clusters observed in this study. Finally, although acute, global silencing of the SC with muscimol provides robust suppression of collicular activity, the lack of cell-type specificity inherent to this approach precludes definitive distinction between tonic gain modulation and more specific feature-selective modulation of dLGN responses. Future studies utilizing optogenetic tools to selectively manipulate specific SC cell populations or their terminal projections will be essential to further dissect the precise circuit logic of this subcortical-thalamic pathway.
In summary, our work establishes a high-dimensional functional map of the dLGN and identifies the SC as a significant modulator of its diverse visual representations. These findings demonstrate that subcortical modulation is fundamentally heterogeneous, enabling the thalamus to act as a flexible processing hub. By revealing how collicular inputs refine specific visual channels, this study provides a framework for understanding the logic of subcortical circuit organization and its role in modulating sensory perception.
The data and code that support the findings of this study are available from the corresponding author upon reasonable request.
Conceptualization: BY and JZ; Methodology: BY, XM, CJ and WX; Investigation: XM, CJ, QC and YW; Data analysis: XM, CJ, YC, JL, WL and WX; Project design and supervision: BY and JZ; Visualization: XM, CJ, and SJ; Writing: BY, XM, CJ and JZ; All authors contributed to editorial changes in the manuscript. All authors read and approved the final manuscript. All authors have participated sufficiently in the work and agreed to be accountable for all aspects of the work.
All experimental procedures were strictly in accordance with the National Institutes of Health Guideline for the Care and Use of Laboratory Animals, and were approved by the Animal Care and Use Committee at Fudan University (20211028-016).
Not applicable.
This work was supported by Brain Science and Brain-like Intelligence Technology-National Science and Technology Major Project, 2022ZD0210000 (to BY), 2022ZD0208605, 2022ZD0208604, 2022ZD0208600 (to SJ and JZ); the National Natural Science Foundation of China, T2325008, 82021002, 82588301 (to JZ).; 82571225 (to BY). Science and Technology Commission of Shanghai Municipality, 25TQ009 (to BY), 21TQ013 (to JZ); the Linggang Laboratory, LGL-8998-13 and LGL-5925-11 (to JZ).
The authors declare no conflicts of interest.
Supplementary material associated with this article can be found, in the online version, at https://doi.org/10.31083/JIN52032.
References
Publisher’s Note: IMR Press stays neutral with regard to jurisdictional claims in published maps and institutional affiliations.