


 , Jie Zhou 1,†, Zhan Chen 1,2, Yufei Jing 1, Yawei Xie 1, Hao Yu 1, Yongjie Yao 1, Chunpeng Jiang 3, Chuantao Li 1,*
1 Naval Medical Center of PLA, Second Military Medical University, 200433 Shanghai, China
2 School of Open Learning and Education, East China Normal University, 200062 Shanghai, China
3 National Key Laboratory of Advanced Micro and Nano Manufacture Technology, Shanghai Jiao Tong University, 200240 Shanghai, China
†These authors contributed equally.
Abstract
Cumulative mental fatigue poses a significant threat to safety, productivity, and health in the workplace. In this study, we aimed to establish a robust machine learning framework using optimized resting-state electroencephalography (rs-EEG) features to detect such fatigue and to validate a 4-day high-stress cognitive competition paradigm for its induction.
EEG signals were recorded from participants under eyes-closed (EC) and eyes-open (EO) conditions during fatigue and recovery phases. We extracted 544 features spanning power spectral density, entropy, and nonlinear complexity. Support Vector Machine Recursive Feature Elimination (SVM-RFE) was used for feature selection. The derived model index (Mean Model Result, MMR) was correlated with a subjective sleepiness index (the Stanford Sleepiness Scale, SSS) and sleep duration.
Analysis of participant data identified a discriminative subset of 65 features from the EC EEG. The model achieved an accuracy of 90.37% in classifying deeply fatigued versus fully recovered states, significantly outperforming the EO-based model (86.54%). The MMR demonstrated a significant negative correlation with SSS scores (rs = –0.358, p = 0.020) and a positive correlation with sleep duration (rs = 0.494, p < 0.001).
The results of this study demonstrate the superior efficacy of EC rs-EEG for monitoring cumulative fatigue, establishing a quantifiable EEG-sleep relationship and supporting the practical feasibility of this framework for occupational fatigue risk assessment.
Keywords
- mental fatigue
- electroencephalography (EEG)
- machine learning
- support vector machine
- sleep duration
Fatigue represents a critical threat to operational safety in professions that require sustained attention, significantly elevating error rates and compromising human performance [1,2]. This multidimensional phenomenon, which spans physical exhaustion and cognitive depletion, directly impairs workforce performance across safety-critical domains [3]. Subjective instruments, such as the Fatigue Assessment Scale, suffer from recall bias and low temporal resolution [4], whereas performance-based metrics, such as the Psychomotor Vigilance Task, impede natural workflow and lack ecological validity [5]. Fatigue detection based on physiological signals represents a promising approach for preemptive risk mitigation [6].
Electroencephalography (EEG) serves as an objective method for fatigue assessment, as it directly measures central nervous system activity [7]. Capitalizing on wearability and convenience [8], portable EEG systems have been increasingly employed to detect fatigue induced by repetitive tasks [9] and sustained physical exertion [10]. The expanding adoption of EEG technology, coupled with a heightened focus on fatigue assessment, has spurred the development of multiple standardized, open-access fatigue research datasets [11,12,13]. Significant progress has also been achieved in EEG-based fatigue detection algorithms, driven by advances in deep learning and machine learning techniques [14,15]. For instance, the classification accuracy rate for driving-induced fatigue can reach up to 92.43% [15]. Nevertheless, despite substantial progress in hardware instrumentation, algorithmic sophistication, and the accumulation of experimental data, unresolved challenges continue to impede the translation of EEG-based fatigue assessment into routine clinical applications. Dominant experimental paradigms rely on acute fatigue induction through brief simulations [11] and fail to model the cumulative fatigue dynamics arising from the interaction between prolonged cognitive load and chronic sleep debt [16]. It remains uncertain whether cognitive fatigue induced by short-term tasks exhibits the same neurophysiological signatures as fatigue resulting from chronic sleep debt. Thus, whether fatigue models constructed under such short-term conditions apply to cumulative fatigue has yet to be validated. Previous research on cumulative fatigue has predominantly relied on sleep deprivation paradigms, which represent a passive form of fatigue induction. Whether these paradigms elicit the same patterns of neural activity as fatigue induced by prolonged active engagement under high mental workload and sustained cognitive investment remains unclear. These methodological limitations severely constrain generalization to real-world occupational settings, such as aviation and critical care, where fatigue manifests cumulatively over extended periods [17].
To address these constraints, this study examined whether EEG-based objective metrics exhibit temporal dynamics consistent with subjective fatigue reports under conditions of prolonged, cumulative fatigue. Profound fatigue was induced through a rigorously controlled, four-day protocol involving sustained high-intensity cognitive tasks and sleep restriction. Based on EEG features characterizing states of fatigue and alertness, we constructed a Support Vector Machine (SVM)-based machine learning model for binary classification and employed the Support Vector Machine Recursive Feature Elimination (SVM-RFE) algorithm to reliably identify the most sensitive and interpretable feature subset for cumulative fatigue from high-dimensional EEG data. In addition, we examined the correlations between these EEG-derived indicators and subjective measures (the Stanford Sleepiness Scale [SSS] score and sleep duration) to explore the feasibility of using such models for monitoring intermediate fatigue states.
Fourteen healthy right-handed undergraduates (7 males, 7 females; mean age = 21.00 ± 1.01 years, range 19–23 years) were recruited from the University of Shanghai for Science and Technology. Participants met the following stringent inclusion criteria: (1) no self-reported neurological, psychiatric, or sleep disorders; (2) no uncorrected auditory/visual impairments; and (3) no current use of psychoactive medication. All subjects were selected from cohorts participating in the National Undergraduate Electronics Design Contest (NUEDC), a rigorous four-day continuous cognitive marathon demanding high-intensity mental exertion (e.g., circuit design, programming, and system integration under time constraints). While the study protocol did not require sleep deprivation, the intense time pressures inherent in this competition paradigm historically induced spontaneous, participant-driven sleep restriction among contestants. This pattern aligns with established behavioral observations from prior iterations of this event [18], with emergent sleep debt constituting a key component of the ecologically valid cumulative fatigue model under investigation.
To mitigate confounders affecting EEG signals and fatigue states, participants were instructed in protocols to: (1) abstain from alcohol, caffeine, and other stimulants for 24 hours before each EEG session; (2) maintain habitual sleep schedules during non-contest periods.
The experimental design and procedures are shown in Fig. 1a,b. Five assessment time points captured critical fatigue states: (1) early-stage baseline (T1: Day 2 morning), (2) mid-competition progression (T2: Day 3 morning), (3) advanced cumulative fatigue (T3: Day 4 morning), (4) immediate post-competition peak fatigue (T4: Day 4 evening), and (5) full recovery after seven unrestricted sleep nights (T5: Day 11 morning). At the beginning of each session, the self-reported sleep duration from the prior night was recorded. The SSS was then conducted twice, specifically before and after the EEG recording. Resting-state EEG (rs-EEG) recordings employed an 8-channel wireless system. Participants sat upright in a sound-attenuated, dimly lit room during the experiment. Each session comprised a 5-minute eyes-closed (EC) relaxation phase followed by a 5-minute eyes-open (EO) fixation phase on a central crosshair positioned 0.5 m away from the participant. The data underwent preprocessing and feature extraction pipelines for model development anchored to the T4 and T5 states. As shown in Fig. 1c–e, the EEG data were processed for feature extraction, model development, as well as model evaluation and correlation analysis.
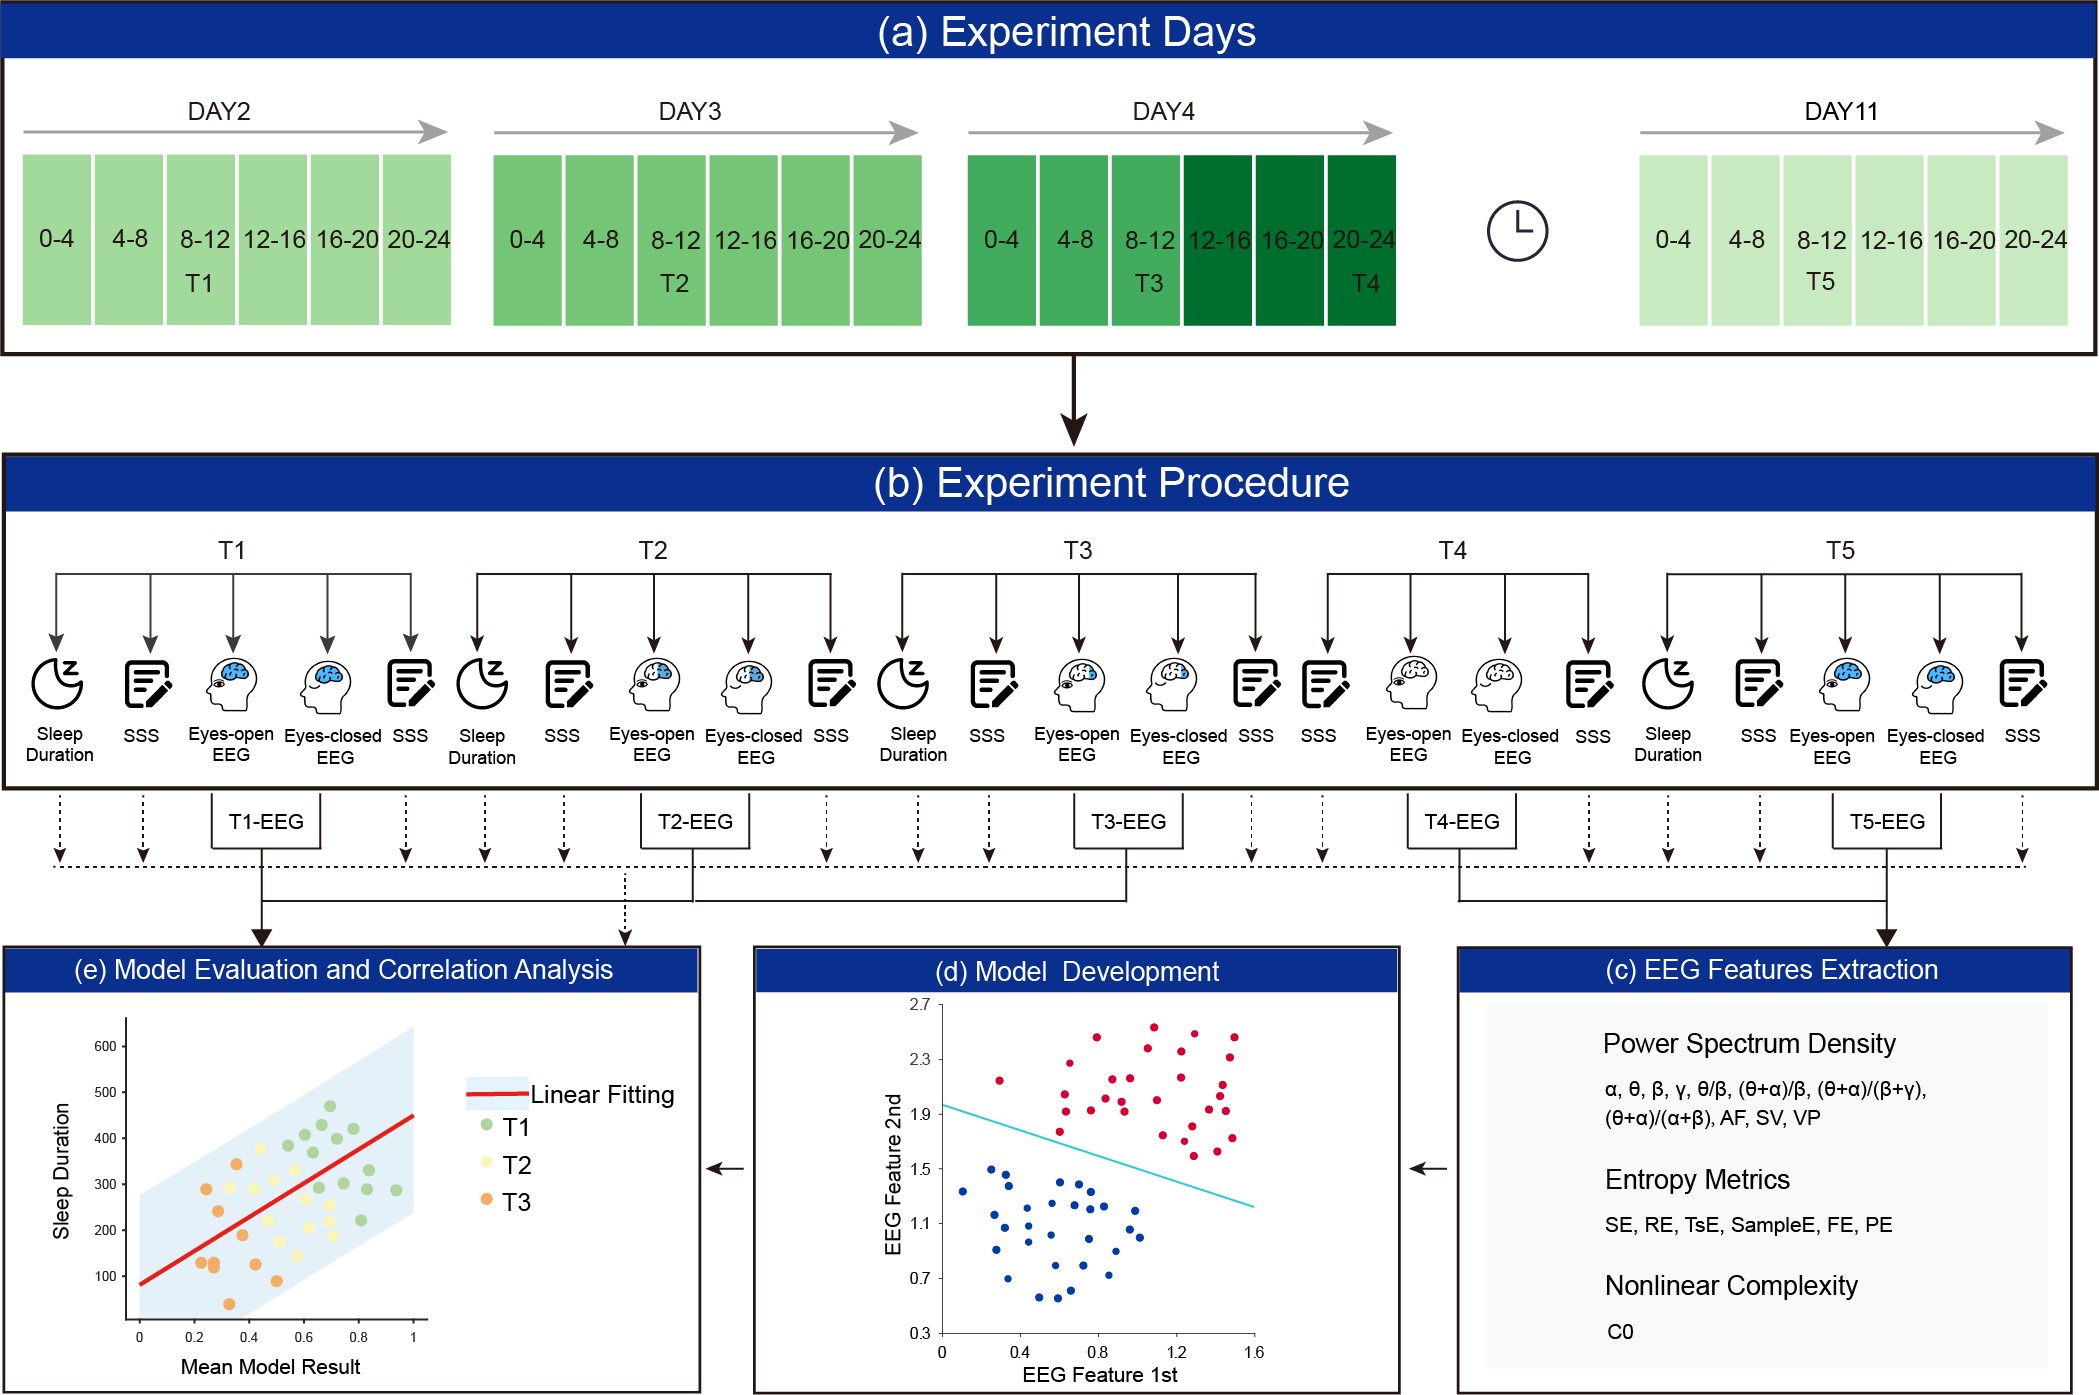 Fig. 1.
Experiment design and procedure. (a) Experiment days, including 2nd, 3rd, 4th, 11th after beginning competition. Different shades of green denote different time points(T1–T5), with T1–T4 representing the competition period and T5 representing the complete recovery period. (b) Experiment procedure, including the concrete operation of every trial. (c) Electroencephalography (EEG) features extraction, including power spectral density, entropy, and complexity features. (d) Model development, constructing a fatigue detection model based on EEG features. (e) Model evaluation and correlation analyses were conducted across time points T1 to T3. SSS, Stanford Sleepiness Scale; AF, Average Frequency; SE, Shannon Entropy; SV, Spectral Variance; VP, Power Variance; RE, Rényi Entropy; TsE, Tsallis Entropy; FE, Fuzzy Entropy; PE, Permutation Entropy; SampleE, Sample Entropy; C0, C0 complexity.
Subjective fatigue was assessed using the SSS, a validated psychometric instrument for transient alertness states. The SSS employs a 7-point Likert scale, providing a measure of perceived sleepiness at each assessment period. Higher scores indicate greater sleepiness. The scores from the pre- and post-EEG SSS assessments were averaged and subsequently utilized in the statistical analyses. Total sleep duration (in minutes) for the preceding night was estimated via participant self-reporting at the beginning of each session. Regarding the subjective measures, subjective fatigue in this study refers specifically to sleepiness—a physiological arousal state driven primarily by homeostatic sleep pressure and circadian rhythms. This state was indexed by the SSS. In contrast, fatigue is a broader, multidimensional state reflecting a general reduction in physical and/or mental capacity. Building upon this distinction, we use the term mental fatigue (formerly referred to as cognitive fatigue) to denote a task-induced state arising from prolonged or demanding cognitive activity.
EEG signals were recorded at 250 Hz using a custom-developed wireless 8-channel system: FP1 (Frontopolar 1), FP2 (Frontopolar 2), F3 (Frontal 3), F4 (Frontal 4), C3 (Central 3), C4 (Central 4), P3 (Parietal 3), P4 (Parietal 4). The electrode placement adhered to the International 10-20 system, with ground and reference electrodes on the left earlobe. The electrode impedance was maintained at <10 kΩ throughout the recordings. Data acquisition occurred in an electrically shielded, dimly-lit room, with participants instructed to remain relaxed and to minimize movement.
Preprocessing was conducted in MATLAB (version R2024a; MathWorks, Natick, MA, USA) using EEGLAB (version 2023.1; available at https://sccn.ucsd.edu/eeglab) [19] and included the following steps: (1) band-pass filtering (1–45 Hz) and 50 Hz notch filtering to remove line noise, (2) visual inspection and manual rejection of artifacts such as head motion, muscle activity, or large drifts, (3) independent component analysis to identify and remove ocular artifacts (blinks and saccades), (4) re-referencing to the average of all scalp electrodes, and (5) sliding-window amplitude thresholding rejecting segments exceeding ±100 µV and their adjacent 0.5-s intervals [20].
To achieve an optimal balance between frequency resolution and computational efficiency [21,22,23], preprocessed EEG signals were segmented into 12-s epochs with 50% overlap (6-s step size), yielding 6730 analyzable segments (EC: 3352; EO: 3378) proportionally distributed across time points (T1: 682 EC/672 EO; T2: 665/686; T3: 668/670; T4: 673/670; T5: 664/680). As shown in Fig. 2a, each slice was subjected to feature extraction to characterize the neurophysiological states associated with cumulative fatigue. As shown in Table 1, sixty-eight established neurophysiological metrics per epoch/channel were computed across three distinct computational domains, based on the established neural correlates of fatigue. Slice (SL) denotes the feature dimension obtained by multiplying the eight channels by 68 spectral indices for each epoch, resulting in 544 subject-stratified features.
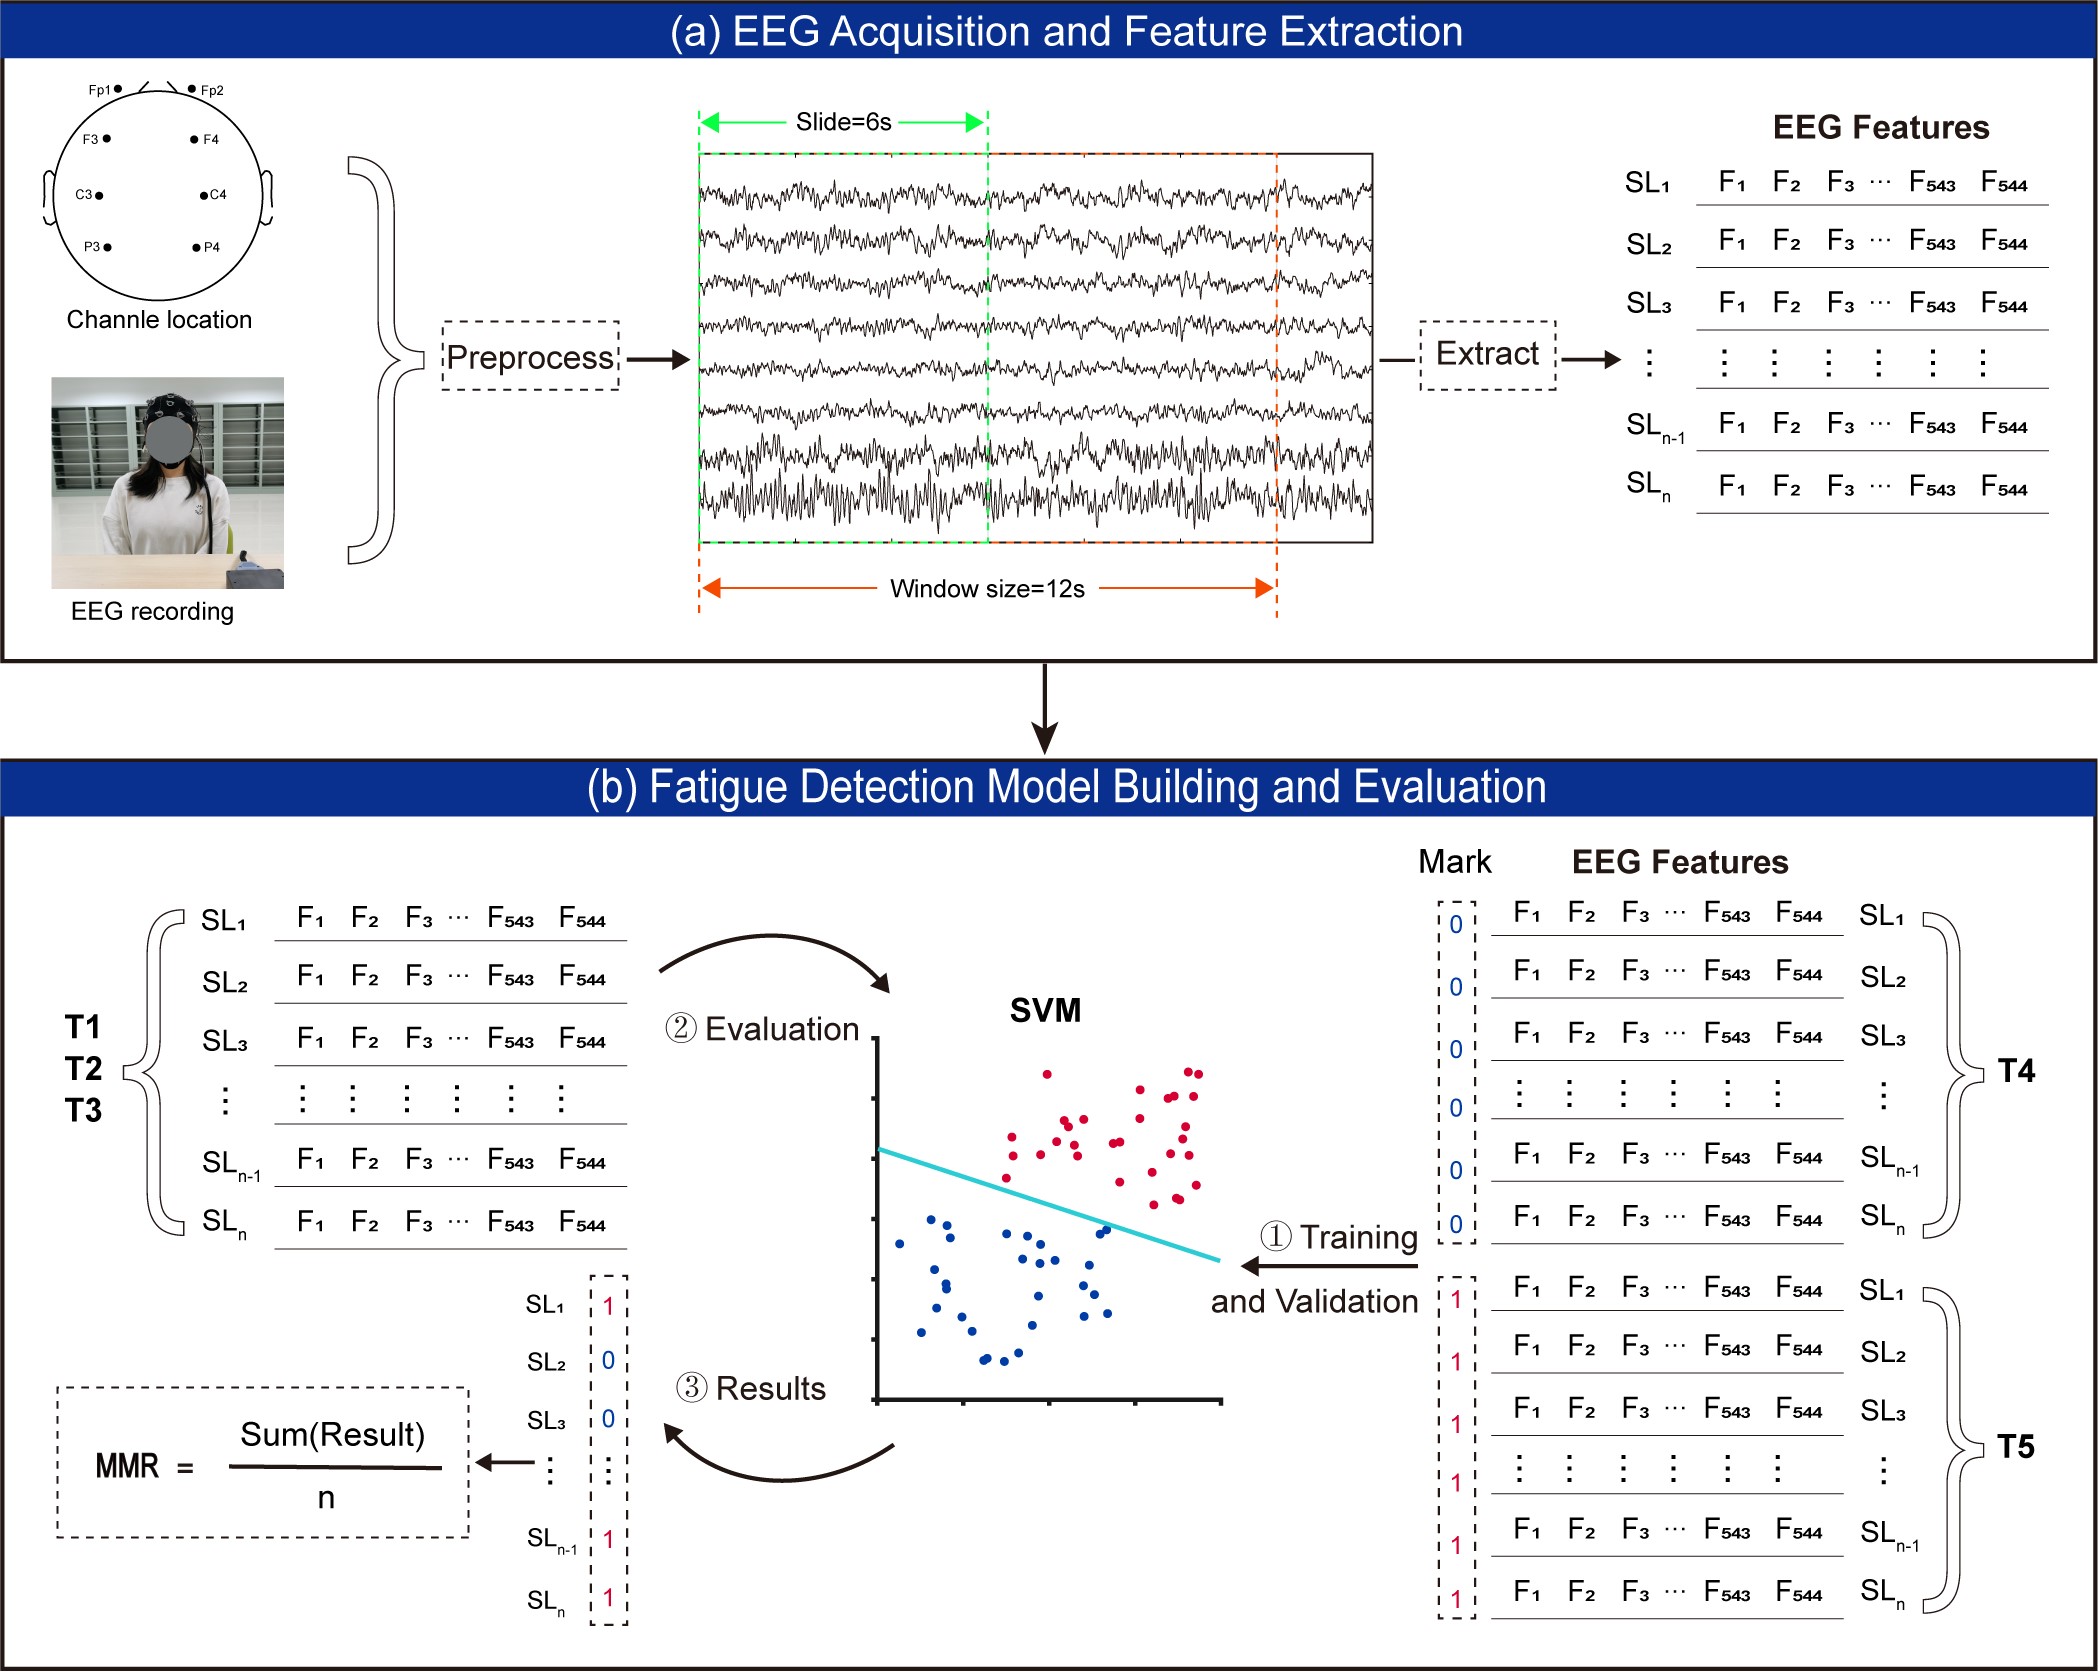 Fig. 2.
Procedure of feature extraction and model building. (a) EEG Acquisition and feature extraction, a “Slice” (SL) represents the 544 feature combinations generated by multiplying each electrode by the full set of feature (F) indices. (b) Model building and evaluation, the EEG features at T4 (fatigue) and T5 (alert) were utilized for model training and validation. The model was evaluated using T1–T3 datasets, yielding a Mean Model Result (MMR) value for each time point. SVM, Support Vector Machine.
| Power spectral density | Entropy metrics | Nonlinear complexity |
|---|---|---|
|
δ, θ, α, β, γ, All, (α+θ)/(β+γ), θ/β, (α+θ)/β, α/β, (α+θ)/(α+β), AF (δ, θ, α, β, γ), SV (δ, θ, α, β, γ), VP (δ, θ, α, β, γ) |
SE (δ, θ, α, β, γ, all), RE (δ, θ, α, β, γ, all), TsE (δ, θ, α, β, γ, all), SampleE (δ, θ, α, β, γ, all), FE (δ, θ, α, β, γ, all), PE (δ, θ, α, β, γ, all) |
C0 (δ, θ, α, β, γ, all) |
| 26 features | 36 features | 6 features |
Note: Features including AF, SV, VP, SE, RE, TsE, SampleE, PE, and C0 were extracted for each frequency band and the whole-band signal (all).
Power spectral density (PSD) was estimated via the Hamming-windowed Fast Fourier Transform (FFT). Absolute and relative powers were calculated for standard frequency bands: delta (δ: 1–4 Hz), theta (θ: 4–8 Hz), alpha (α: 8–13 Hz), beta (β: 13–30 Hz), and gamma (γ: 30–45 Hz). Additionally, several inter-frequency band energy ratios, such as (α+θ)/(β+γ), (α+θ)/β, α/β, and (α+θ)/(α+β), were computed and employed as sensitive indicators of fatigue [24,25].
Fatigue has also been established as a modulator of the frequency distribution and variability of EEG signals [26,27]. These properties were also calculated to capture the spectral distribution characteristics.
The Average Frequency (AF), quantifying the centroid of spectral power:
where fi denotes the frequency bin and P(fi) represents the corresponding power value.
The Spectral Variance (SV), measuring dispersion around the mean frequency:
The Power Variance (VP) characterizes the variability of the power values within the band:
where Pi is the power in bin i, P̅ is the mean power within the band, and n is the number of bins.
Signal complexity and irregularity were quantified using multiscale entropy approaches [28,29,30]. We calculated the multiscale entropy using the frequency band energy derived from wavelet decomposition. A 5-level wavelet decomposition was employed, and the Daubechies 3 (db3) wavelet was used. Shannon entropy (SE) was calculated using the relative wavelet energies of the standard bands.
where Pi is the relative wavelet energy of the standard frequency bands.
Wavelet Rényi Entropy (RE) was computed to provide a more generalized measure,
where q denotes the entropy index. In this study, q was set to 2 to calculate the 2nd order Rényi entropy. Time-domain Tsallis Entropy (TsE) was also extracted:
where q was set to 2 to calculate the 2nd order TsE. Additionally, the Sample Entropy, Fuzzy Entropy, and Permutation Entropy were also calculated.
C0 complexity was derived for practical analysis of EEG signals [31]. Its fundamental principle involves decomposing the signal into major and minor components via a threshold in the power spectrum. C0 complexity demonstrates robustness to the dynamic characteristics of EEG signals and has been validated for biomedical signal analysis.
Given the high dimensionality of the feature space (544 features) relative to the sample size, there was a significant risk of model overfitting and increased computational burden. Therefore, to mitigate these issues and identify the most discriminative indices, we implemented the SVM-RFE algorithm [32,33]. SVM-RFE is a sequential backward selection method that ranks features based on their contribution to SVM’s margin maximization principle. Beginning with the full feature set, the algorithm iteratively trained SVM models, ranked features by the absolute magnitude of their weight coefficients in the decision function, and eliminated the lowest-ranked features. This recursive sequence of training, weight-based ranking, and feature elimination continued until all features were removed, thereby producing a complete feature ranking hierarchy. Therefore, SVM-RFE was selected owing to its superior accuracy compared to filter-based feature selection methods [34].
The optimal number of features was defined as the smallest number beyond which further increases yielded negligible improvements in the cross-validated binary classification accuracy of the training data (T4 and T5). As shown in Fig. 2b, EEG features at the T4 (fatigue) and T5 (alert) time points were used to train an SVM classifier. The trained model was then applied to every epoch within T1, T2, and T3; the result for each epoch was computed and averaged within each time point, yielding the subject-level Mean Model Result (MMR), which represents the average output probability (range: 0–1), functioning as a continuous fatigue index.
To validate the predefined experimental states, non-parametric analyses were conducted in SPSS Statistics (version 26.0; IBM Corp., Armonk, NY, USA). Normality of sleep duration and SSS score distributions was first assessed using the Shapiro-Wilk test. Given the non-normal distributions confirmed by this test, the Friedman rank test was employed to evaluate overall differences across time points (T1–T5 for SSS, T1, T2, T3, and T5 for Sleep duration). Where significant results were obtained in the Friedman rank test, post hoc pairwise comparisons were conducted using Wilcoxon signed-rank tests, with Bonferroni correction applied to control for Type I error inflation during multiple comparisons. A simple linear regression analysis was performed to evaluate the relationship between MMR and both the SSS score and sleep duration.
The statistical analysis results of SSS scores and sleep duration are shown in Fig. 3. The SSS scores showed a statistically significant change over time (Kendall’s W = 0.692, χ2(4) = 38.74, p < 0.001). The SSS scores (mean ± standard error of the mean [SEM]) exhibited a progressive increase from T1 to T3 (T1: 3.36 ± 0.28, T2: 3.82 ± 0.29, T3: 4.96 ± 0.24), which remaining at a high level at T4 (4.89 ± 0.30), before decreasing at T5 (1.86 ± 0.19). There were significant differences between SSS scores at T1 and T3 (Z = –3.22, p = 0.004, r = 0.861), T1 and T5 (Z = 3.05, p = 0.010, r = 0.815), T2 and T5 (Z = 3.19, p = 0.002, r = 0.854), T3 and T5 (Z = 3.19, p = 0.002, r = 0.853), T4 and T5 (Z = 3.31, p = 0.001, r = 0.884), with Bonferroni correction. Similarly, there was a statistically significant difference in sleep duration across the time points (Kendall’s W = 0.713, χ2(3) = 29.94, p < 0.001). The mean sleep durations at T1 (389.64 ± 37.39), T2 (312.71 ± 110.65), T3 (191.36 ± 103.66), and T5 (478.93 ± 60.01) exhibited a similar trend. There were significant differences in sleep durations between T1 and T3 (Z = 3.18, p = 0.001, r = 0.850), T1 and T5 (Z = –3.29, p < 0.001, r = 0.881), T2 and T5 (Z = –3.23, p = 0.001, r = 0.864), T3 and T5 (Z = –3.30, p < 0.001, r = 0.881), with the Bonferroni correction. For sleep duration, there was a clear downward trend from T1 to T3, and an upward trend from T3 to T5. In addition, Spearman correlation analysis showed a significant negative relationship between sleep duration and SSS scores (n = 56, r = –0.76, p < 0.001).
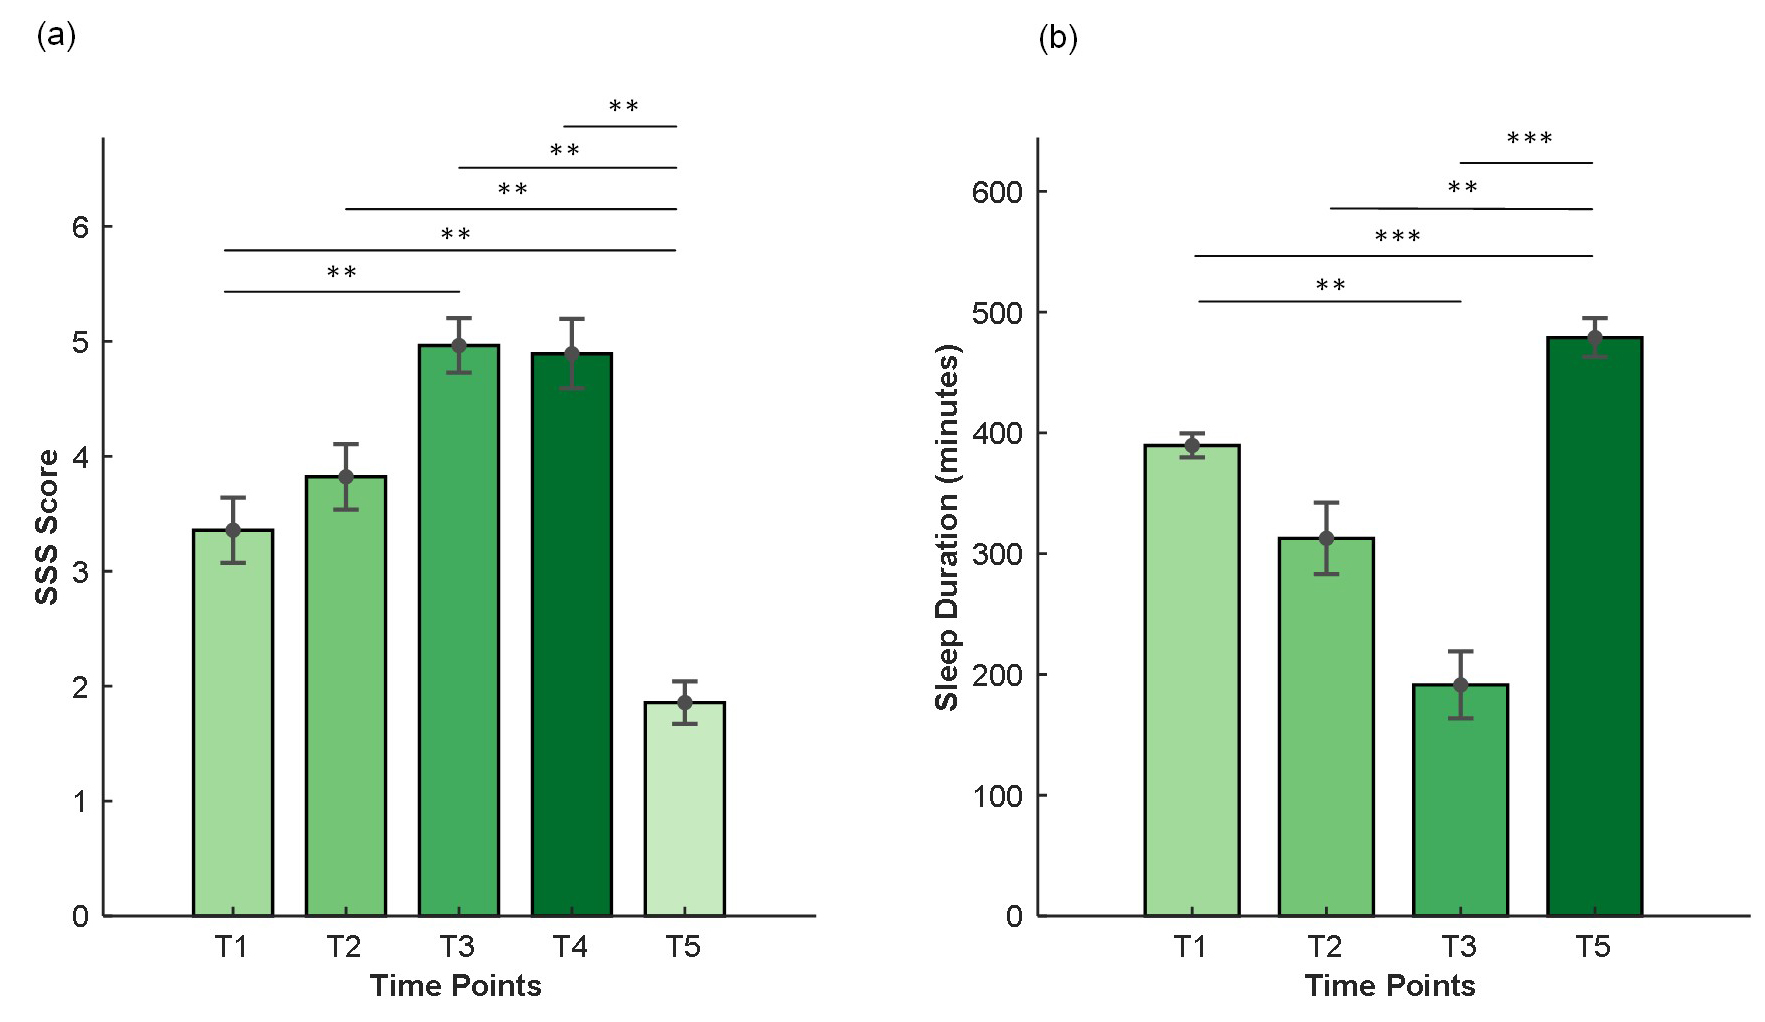 Fig. 3.
Comparison of mean SSS scores and sleep duration across measurement time points. (a) Mean SSS scores. (b) Mean sleep duration. Bar heights represent the mean, and error bars represent the standard error of the mean (SEM). Note: The levels of significance are indicated by asterisks: ** p < 0.01, and *** p < 0.001.
EEG segments from 14 participants were categorized to define two fatigue states: segments acquired at peak fatigue (T4) were labeled as the Fatigue State (“0”), comprising 673 EC and 670 EO epochs. Segments from the fully recovered state (T5) were designated as the Alert State (“1”), including 664 EC and 680 EO epochs. Three distinct datasets were evaluated: EC-only, EO-only, and a combined EC+EO set. As shown in Fig. 4, the EC-only data (65 features) achieved 90.37% classification accuracy, while the EO-only data (50 features) attained 86.54% accuracy. Although the combined eye-open and eye-closed feature set (51 features) achieved the highest accuracy (93.85%), the EC-only configuration provided a favorable balance between computational efficiency and classification performance, achieving high accuracy using only half of the recording conditions compared with the combined dataset.
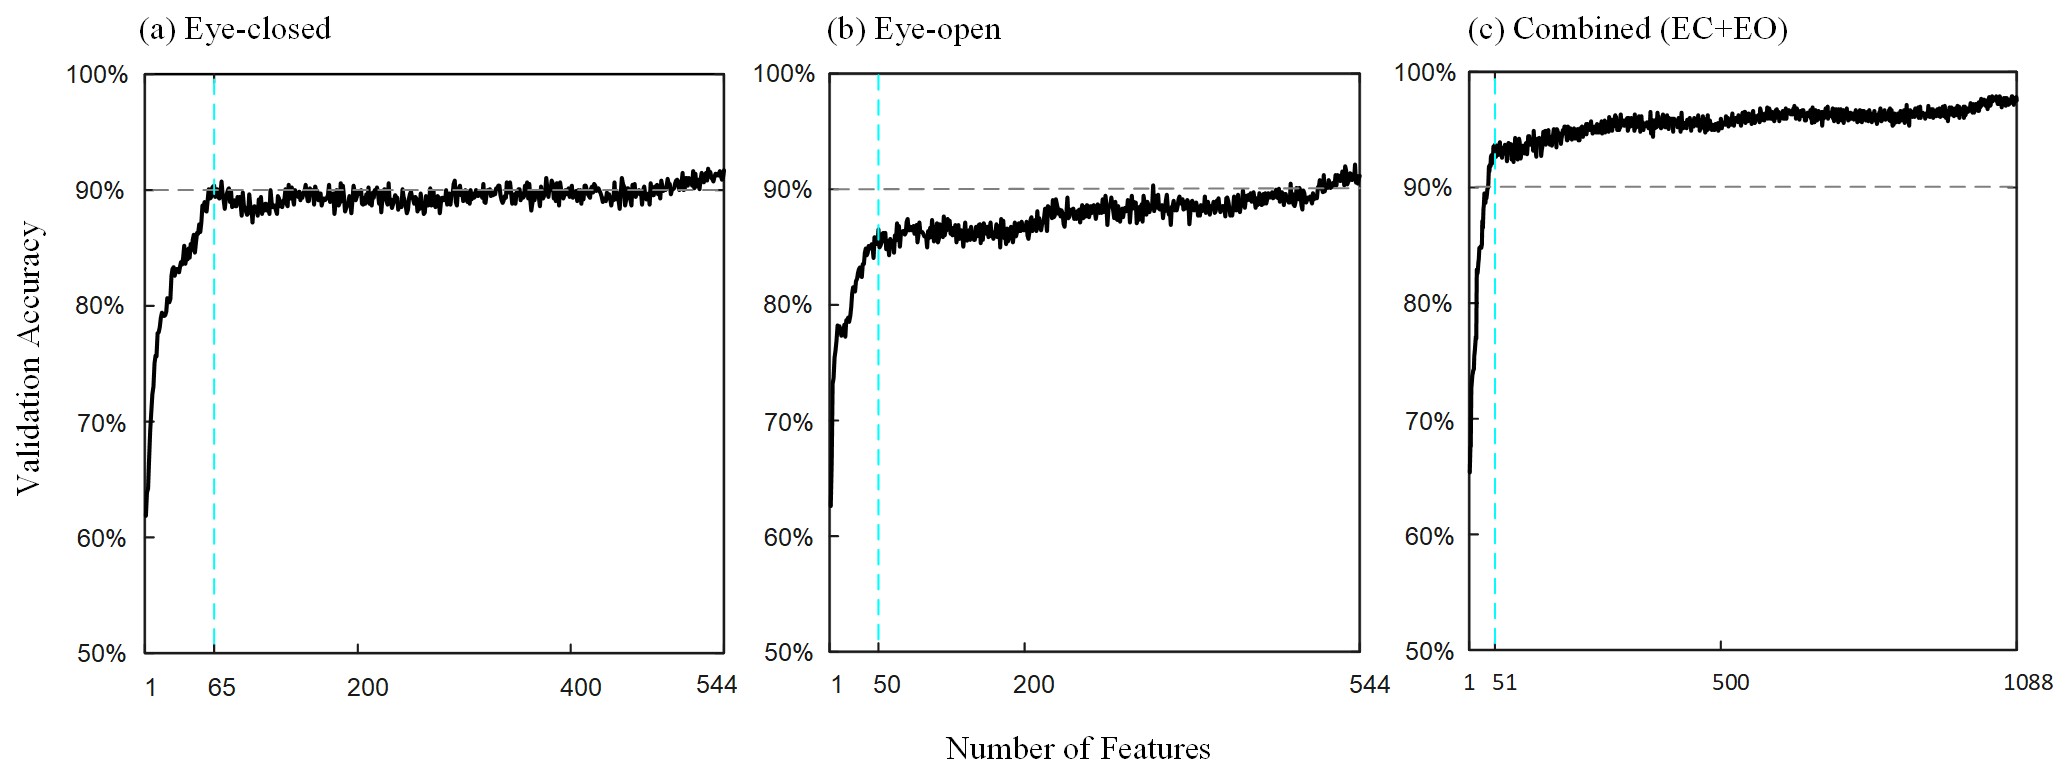 Fig. 4.
Validation set performance of Support Vector Machine Recursive Feature Elimination (SVM-RFE) feature selection for binary classification of fatigue states. (a) Eyes-closed (EC)-only data (optimal features = 65), (b) eyes-open (EO)-only data (optimal features = 50), and (c) combined EC+EO data (optimal features = 51). The blue dashed vertical lines indicate the optimal number of features selected to maximize classification performance. Performance metrics were derived from 5-fold cross-validation.
Through iterative SVM-RFE computation, key features were identified based on their selection frequency across multiple runs. Within the EC-only model, Power spectral Density features appeared 20 times, Entropy Metrics features appeared 45 times, and Nonlinear Complexity features were not selected (0 occurrences). Specifically, across the eight channels, the whole-spectrum Tsallis entropy (all-TsE) was selected 6 times, alpha-band Rényi entropy (α-RE) was selected 5 times, and theta-band power (θ-Power), theta-band Tsallis entropy (θ-TsE), and theta-band Shannon entropy (θ-SE) were each selected 4 times. These findings indicate that entropy-based metrics show a comparative advantage for fatigue monitoring, while the alpha and theta frequency bands are particularly relevant for capturing fatigue-related neural dynamics.
We evaluated the model’s generalizability by calculating Spearman’s rank correlations between the MMR and SSS and sleep duration within the intermediate timepoints (T1–T3). As shown in Table 2, the MMR exhibited a marked decline across the time points, capturing the cumulative progression of neurobehavioral fatigue from T1 to T3. Under the EC condition using 65 selected features, the MMR demonstrated a significant negative correlation with SSS scores (rs = –0.358, p = 0.020) and a positive correlation with sleep duration (rs = 0.494, p < 0.001).
| Feature used | Time points | MMR |
[r, p] | MMR |
[r, p] | MMR |
[r, p] |
|---|---|---|---|---|---|---|---|
| All features | T1 | 0.70 |
[–0.236, 0.133] (SSS score) | 0.68 |
[–0.319, 0.040] (SSS score) | 0.70 |
[–0.354, 0.021] (SSS score) |
| T2 | 0.65 |
[0.297, 0.056] (Sleep duration) | 0.69 |
[0.530, |
0.69 |
[0.368, 0.016] (Sleep duration) | |
| T3 | 0.45 |
0.28 |
0.31 |
||||
| Selected features | T1 | 0.57 |
[–0.287, 0.066] (SSS score) | 0.77 |
[–0.358, 0.020] (SSS score) | 0.69 |
[–0.328, 0.034] (SSS score) |
| T2 | 0.57 |
[0.200, 0.205] (Sleep duration) | 0.74 |
[0.494, |
0.70 |
[0.419, 0.006] (Sleep duration) | |
| T3 | 0.46 |
0.36 |
0.35 |
Note: “All features” = 544 features; “Selected features” = SVM-RFE optimized features. Total n = 42 (14 participants × 3 sessions).
Simple linear regressions (n = 42) were performed to evaluate the physiological validity and predictive utility of the MMR (EC) for both subjective sleepiness (SSS) and objectively reported sleep duration. As illustrated in Fig. 5a, the linear regression model fitted via ordinary least squares (SSS Score= –1.5 × MMR + 5.0) was statistically significant (F (1, 40) = 6.396, p = 0.015, R2 = 0.138, root mean square error (RMSE) = 1.100). As shown in Fig. 5b, the model (Sleep Duration [min] = 198.7 × MMR + 174.6) was also significant (F (1, 40) = 11.687, p = 0.001, R2 = 0.226, RMSE = 104.9 [min]).
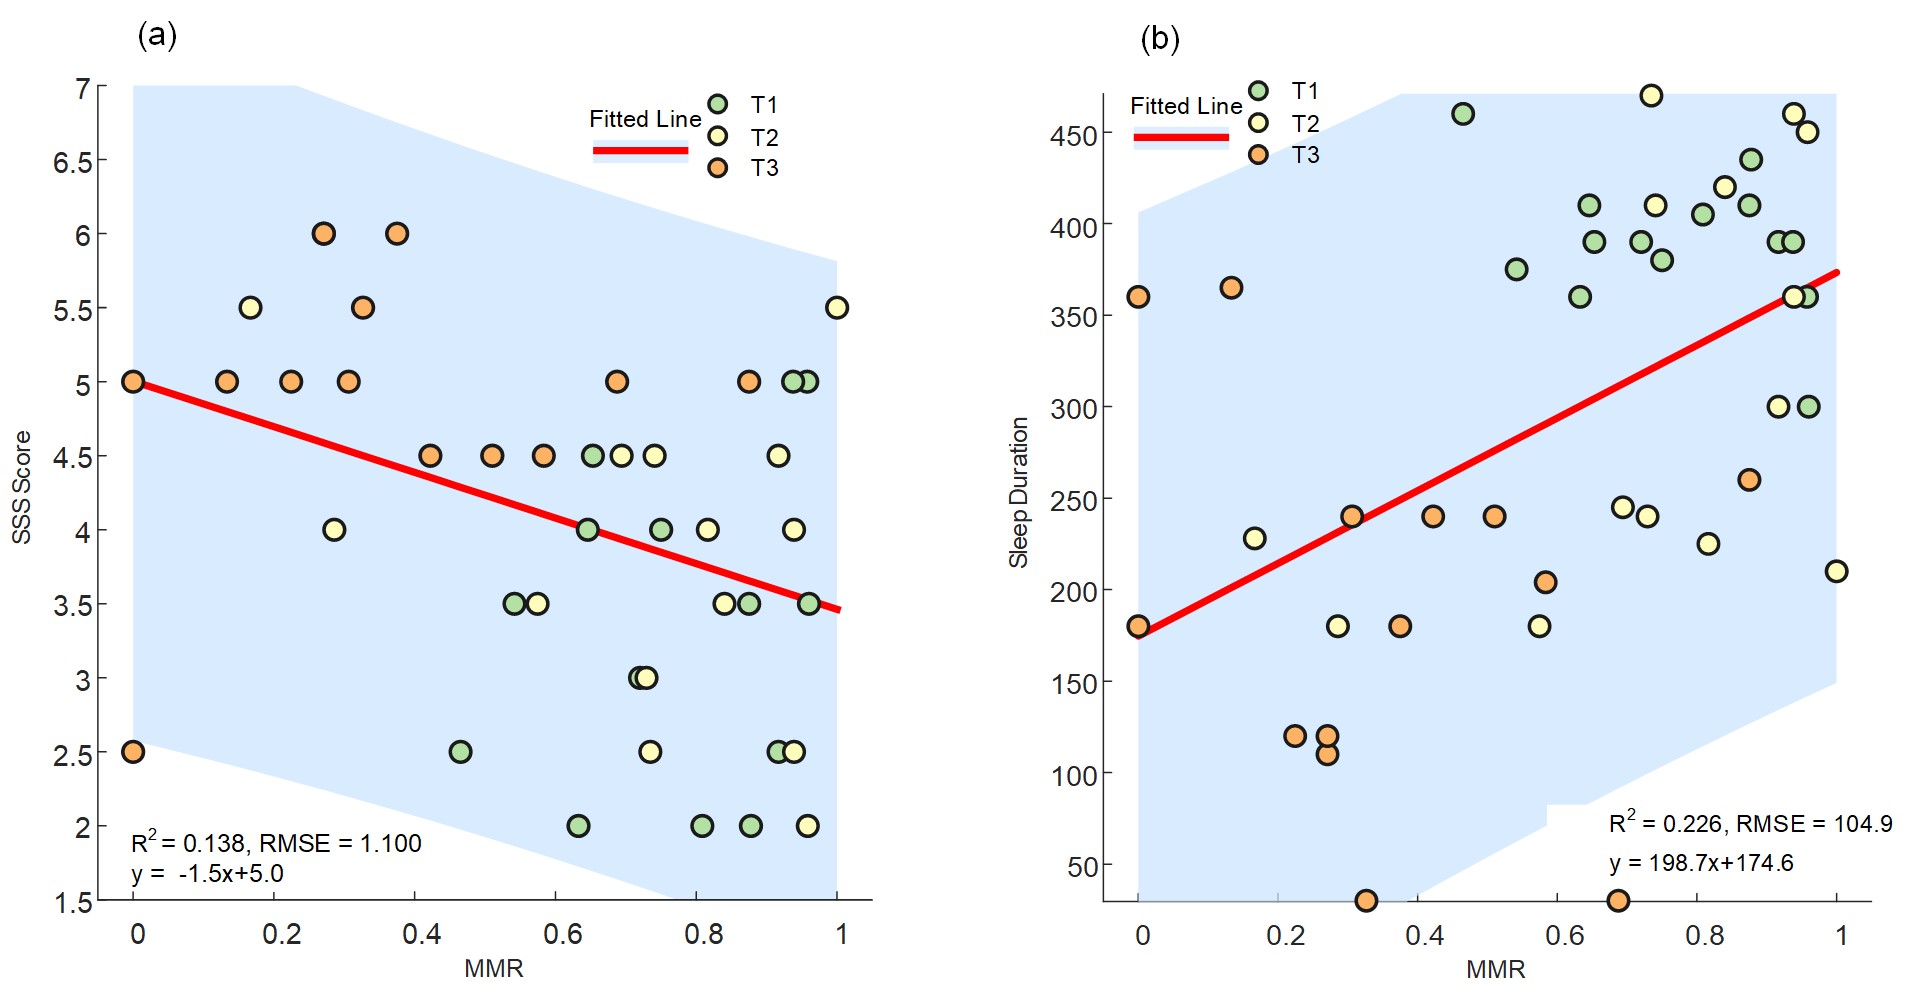 Fig. 5.
Linear regression analyses of EC-EEG-derived MMR with SSS and sleep duration. (a) Linear regression between EC MMR and SSS scores. Red line: linear regression fit; shaded area: 95% confidence interval. (b) Significant positive linear relationship between EC MMR and prior-night sleep duration (R2 = 0.226, RMSE = 104.9 min). Each data point represents a single participant at a single time point. Total n = 42 (14 participants × 3 sessions). RMSE, root mean square error.
EEG signals exhibit high sensitivity in objectively reflecting the impact of fatigue on brain activity. Therefore, there has been a growing interest in EEG-based fatigue detection (Table 3, Ref. [15,35,36,37,38,39,40,41,42,43,44,45]) in recent years, driven by advances in machine learning techniques and an enhanced understanding of mental fatigue. In this study, we conducted a four-day EEG measurement during an intense competition scenario that induced progressive fatigue through chronic sleep deprivation and sustained high-intensity cognitive tasks. Our operational measure of mental fatigue likely represents a systems-level brain state marked by local neural resource reorganization and shifts in global information integration complexity. An SVM-based fatigue detection model was constructed using multidimensional EEG features (including power spectral density, entropy metrics, and nonlinear complexity), and achieved a binary classification accuracy of 93.85% (using 544 features). A simplified model based on feature selection principles demonstrated competitive performance, achieving validation accuracies of 90.37% (65 features, EC) and 86.54% (50 features, EO).
| Reference | EEG features | Method | Tasks | Classification levels | Accuracy |
|---|---|---|---|---|---|
| Baygin et al., 2025 [35] | Power spectral density | SVM | Sleep deprivation | 2 (NS vs. SD) | 97.71% |
| Guo et al., 2025 [36] | Temporal-spatial features, Electrodermal activity, Photoplethysmography | MMA-Net (CNN-LSTM + Attention) | Simulated driving | 2 (Alert vs. fatigue) | 82.14% |
| Liang et al., 2025 [37] | Eye-tracking, Temporal-spatial features, Electrocardiography, Electrodermal activity | LightGBM-MLP | Simulated remote tower task | 2 (Alert vs. fatigue) | 92.00% |
| Hu et al., 2024 [15] | Long short-term temporal and spatial features | STFN-BRPS | Real-world driving | 3 (N/LD, MD, HD) | 92.43% |
| Ardabili et al., 2024 [38] | Graph theory metrics | Combination of GAN and GCN | Simulated driving | 5 (Fatigue classes) | 99.00%, 97.00%, 96.00%, and 91.00% |
| Ma et al., 2024 [39] | Temporal + spatial features | DTDDAN | Simulated driving | 2 (Alert vs. fatigue) | 92.20% |
| Wan Masri et al., 2024 [40] | Power spectral density | RF, kNN, SVM, ANN | Sleep deprivation | 2 (NS vs. SD) | 94.00% (SVM) |
| Li et al., 2023 [41] | Behavioral performance, Functional connectivity, Network characteristics | kNN, SVM, BP_Adaboost | Simulated driving | 2 (Vigilant vs. fatigue) |
FSR group: 82.95 ± 0.96% (SVM) non-FSR group: 94.26 ± 1.16% (SVM) |
| Shahbakhti et al., 2023 [42] | Power spectrum, Entropy, Fractal dimension, Blink-related features | AdaBoost | Simulated driving | 2 (Alert vs. fatigue) |
88.40% (Database A) 86.80% (Database B) |
| Xu et al., 2023 [43] | Temporal-spatial features | CNN-Attention | Simulated driving | 2 (Vigilant vs. fatigue) | 97.8% |
| Cui et al., 2022 [44] | Temporal + spatial features | CNN | Simulated driving | 2 (Alert vs. fatigue) | 73.22% |
| Wang et al., 2016 [45] | Power spectral density | kNN, SVM, GELM | Sleep restriction | 3 (8-, 6-, and 4-hours sleep) | 83.57% |
| This paper | Power spectral density, Entropy metrics, Nonlinear complexity | SVM-RFE | Real-world competition & cumulative sleep restriction | 2 (Alert vs. fatigue) |
93.85% (EC&EO, 544 features) 90.37% (EC, 65 features) 86.54% (EO, 50 features) |
Abbreviations: CNN-LSTM, convolutional neural network–long short-term memory; LightGBM-MLP, light gradient boosting machine–multilayer perceptron; STFN-BRPS, spatio-temporal fusion network with brain region partitioning strategy; GAN, generative adversarial network; GCN, graph convolutional network; DTDDAN, dynamic threshold distribution domain adaptation network; kNN, k-nearest neighbors; ANN, artificial neural network; BP_Adaboost, backpropagation AdaBoost; GELM, generalized extreme learning machine; NS, normal sleep; SD, sleep deprivation; N/LD, no/low drowsiness; MD, moderate drowsiness; HD, high drowsiness.
Compared with most existing studies utilizing controlled driving simulations [36,37,39,41] or acute sleep deprivation protocols [35,40], our experimental paradigm substantially improves the ecological validity of our findings, bridging the gap between highly controlled laboratory settings and the complexities of real-world cognitive demands. In addition, we employed a composite feature set integrating power spectral density, entropy metrics, and nonlinear complexity. This approach helps to capture hierarchical and complementary information from neural oscillations, providing a systemic representation of fatigue. Moreover, our model was evaluated at three intermediate time points, revealing significant correlations between the EEG-derived MMR and subjective fatigue (SSS scores), as well as the sleep duration.
The machine learning model based on EC rs-EEG demonstrated a higher efficacy for fatigue detection than the model using the EO state. A possible explanation is that fatigue causes a significant decrease in alpha power when the eyes are closed [46]. Concurrently, during EC states, eyeblink artifacts are reduced, particularly at frontal sites (FP1/FP2), enhancing the signal-to-noise ratio of nonlinear entropy features. These characteristics render the EC rs-EEG particularly suitable for fatigue detection. Furthermore, feature selection enables the removal of irrelevant and redundant EEG features while reducing the computational time [34]. Our findings corroborate earlier reports [47,48,49,50] suggesting that a close association has been identified between subjective fatigue and sleep deprivation or restriction. Subjective fatigue levels exhibited an inverted U-shaped pattern throughout the study; specifically, SSS scores progressively increased from T1 to T4 under accumulated sleep restriction, before decreasing at T5 during the recovery phase. Therefore, we selected T4 as the fatigue landmark point based not solely on its SSS score, but also on the actual work duration and the intensity of the cognitive load. Specifically, we observed that entropy and spectral features contributed most significantly to the model’s performance. As a key metric of nonlinear dynamics, entropy reflects the diversity of local neuronal population activity patterns and is widely used to track vigilance and changes in brain dynamics. Variations in EEG entropy are associated with performance on neurophysiological tasks, typically indicating a reduction in neural signal complexity and a diminished adaptive capacity under sustained cognitive load. Concurrently, the reorganization of spectral power (e.g., in theta and alpha bands) reflects a shift in local neural resource allocation, underscoring a progressive decline in region-specific processing efficiency. We propose that the high relevance of these features reflects a progressive stabilization of neural oscillations and a reduction in signal complexity, which may indicate declining information-processing efficiency and a loss of cortical flexibility under cumulative fatigue.
The model remains applicable in intermediate states between absolute alertness and extreme fatigue and effectively tracks the cumulative transition of fatigue. This indicates that MMR provides a reliable basis for quantifying sleep debt and estimating recovery requirements [18,51,52]. As a model-derived index, the MMR provides a quantitative measure of cumulative fatigue and brain-state destabilization, paralleling the utility of brain-state vulnerability indices (e.g., cortical excitability, CE) for evaluating cognitive resilience and risk of cognitive decline [53,54]. Rather than reflecting a single, isolated fatigue mechanism, the MMR serves as an integrative index of distributed neural processes. It captures system-level changes in neural efficiency and information processing, which are dynamically shaped by the cumulative effects of sleep debt and sustained cognitive load [55]. This systemic perspective acknowledges the high inter-individual variability in fatigue manifestations while providing the feasibility of system-level fatigue monitoring applications [56]. These findings offer potential applications for occupational fatigue management: developing EEG-derived indicator-based fatigue estimation could potentially reduce human error accidents in high-intensity occupations such as aviation crews and surgeons.
The current study, while demonstrating the feasibility of EEG-based fatigue assessment in ecological settings, still has several limitations. First, the findings are primarily derived from a within-subject analysis on a limited cohort. This inherently restricts the model’s generalizability to new, unseen individuals. Therefore, more work is needed to enhance cross-subject robustness before the performance can be considered sufficient for broader, deployable applications. Nevertheless, we have mitigated this constraint through a longitudinal design featuring EEG recordings and scale assessments across five consecutive time points, with sufficiently prolonged EEG recording sessions. Although the EEG index MMR showed a correlation with fatigue measurements across days (T1–T3), its specific neurophysiological substrate remains unclear. The observed changes may represent general decreases in neural resource allocation or synaptic efficiency, rather than a fatigue-specific process. Future studies should incorporate direct validation against established physiological or neurochemical correlates to strengthen the mechanistic interpretation of the model’s predictions and integrate them into a broader neurophysiological framework of fatigue.
In this study, we investigated the efficacy of machine learning models for alert and fatigued states using EC rs-EEG data collected within a four-day protocol of sustained high-intensity cognitive tasks and restricted sleep. When applied to intermediate time points (T1 to T3) between extreme fatigue and full alertness, the change of MMR exhibited significant correlation with self-reported fatigue levels (SSS scores and sleep duration), demonstrating MMR’s potential as a sensitive and interpretable predictor for cumulative fatigue from high-dimensional EEG features. Furthermore, EEG-derived machine learning provides a viable methodology for fatigue-risk assessment in occupational settings through longitudinal, objective monitoring of neurophysiological states and prediction of cumulative fatigue.
Data will be made available on request.
XY: Conceptualization, methodology, writing—original draft preparation, writing—review and editing. JZ: formal analysis, visualization, writing—original draft preparation, writing—review and editing. ZC: formal analysis, visualization. YJ: investigation, software. YX: investigation, validation. HY: methodology, supervision. YY: methodology, supervision. CJ: methodology, validation. CL: Conceptualization, methodology, formal analysis, writing—review and editing, visualization, funding acquisition. All authors contributed to editorial changes in the manuscript. All authors read and approved the final manuscript. All authors have participated sufficiently in the work and agreed to be accountable for all aspects of the work.
The study was approved by the Institutional Review Board of the Second Military Medical University (Navy Medical University, Approval No. 20210305). The study was conducted in accordance with the Declaration of Helsinki. Written informed consent has been obtained from the participants to publish this paper.
We are grateful to Professor Chenxue Li, Senior Experimentalist Zhan Zhao, and Lecturer Peiding Li, all of the University of Shanghai for Science and Technology, for providing the experimental facilities and assisting in the execution of the experiments. We also extend our sincere thanks to all the students from the University of Shanghai for Science and Technology who participated in this study. Their valuable assistance was instrumental in advancing the progress of this research.
This research was funded in part by the Youth Project (National Natural Science Foundation, No. 82101970) and in part by the Talent Program Fund (Naval Medical Center, Second Military Medical University (Naval Medical University), No. 21TPQN0201).
The authors declare no conflicts of interest.
During the preparation of this work, the authors used DeepSeek in order to check spelling and grammar. After using this tool, the authors reviewed and edited the content as needed and take full responsibility for the content of the publication.
References
Publisher’s Note: IMR Press stays neutral with regard to jurisdictional claims in published maps and institutional affiliations.