


 , Andres Polania 1,*,†
 , Gaston A. Rodriguez-Granillo 2,*, Pablo Diluca 1, Carlos Bleise 3, Pedro Lylyk 3
1 Department of Radiology, Clinica La Sagrada Familia, Instituto Médico ENERI, C1426EOB Buenos Aires, Argentina
2 Department of Cardiovascular Imaging, Clinica La Sagrada Familia, Instituto Médico ENERI, C1426EOB Buenos Aires, Argentina
3 Department of Interventional Neuroradiology, Clinica La Sagrada Familia, Instituto Médico ENERI, C1426EOB Buenos Aires, Argentina
†These authors contributed equally.
Abstract
Electron density (ED) imaging has shown the ability to discriminate between different soft tissue components in preliminary studies. We hypothesized that ED might improve the identification of brain tissue abnormalities in patients with large vessel occlusion acute ischemic stroke (AIS).
We retrospectively included a series of patients with large vessel occlusion AIS comprising the middle cerebral artery (MCA) territory. All patients underwent non-contrast brain computed tomography (CT) and CT angiography using a dual-layer spectral CT scanner. Using a multiparameter display including conventional CT images (Hounsfield units, HU), ED relative to water (%EDW), and effective atomic number (Zeff), we evaluated the brain tissue territory distal to the occlusion, and the contralateral hemisphere.
Twenty-eight patients were included, with a mean age of 75.7 ± 10.9 years. The brain tissue distal to the MCA occlusion showed significant differences compared with the contralateral hemisphere only using conventional CT (25.0 ± 2.7 HU vs. 29.2 ± 2.4 HU, p < 0.0001) and ED imaging (102.2 ± 0.3 %EDW vs. 102.6 ± 0.2 %EDW, p < 0.0001), whereas the Zeff (7.37 ± 0.1 vs. 7.37 ± 0.1, p = 0.36) showed similar values. ED imaging was associated with a significantly higher diagnostic confidence for the identification of abnormal findings, both for the evaluation of the hyperdense MCA (conventional CT 3.46 ± 1.3 vs. ED imaging 4.79 ± 0.4 vs. Zeff imaging 2.07 ± 1.0, p < 0.0001) as well as for the subtended brain parenchyma (conventional CT 3.30 ± 1.3 vs. ED imaging 4.30 ± 0.8 vs. Zeff 1.44 ± 0.6, p < 0.0001).
In this study, ED imaging enabled a more confident identification of brain tissue changes related to large vessel occlusion AIS compared with conventional CT imaging.
Keywords
- tomography
- X-ray computed
- intracranial thrombosis
- ischemic stroke
Timely detection and accurate characterization of vascular and parenchymal changes are essential for optimizing therapeutic management and improving outcomes of patients with acute ischemic stroke (AIS) [1]. Among early computed tomography (CT) signs, the hyperdense middle cerebral artery (MCA) and loss of gray–white matter differentiation are indirect findings that guide initial treatment decisions and do not require the administration of contrast [2, 3]. However, these signs may be subtle or difficult to identify during the earliest phases of stroke. Indeed, parenchymal tissue assessment on CT relies heavily on perfusion techniques [4].
Dual-energy CT has consistently demonstrated improved tissue characterization, particularly related to the higher intravascular attenuation levels achieved using low-energy monochromatic imaging [5]. Furthermore, when acquired with dual-layer spectral CT-scanners, tissue electron density (ED)—normalized to pure water—can be directly estimated without altering acquisition protocols or administering contrast [6, 7]. Recent studies have reported promising results regarding soft tissue characterization by ED imaging, including thrombus detection and early ischemic changes [6, 7, 8, 9]. Nonetheless, to date, the application of spectral-based imaging (SBI) reconstructions to the interpretation of noncontrast CT studies has received very limited attention in the setting of acute ischemic stroke.
In this context, we hypothesized that ED-based imaging could reveal vascular and parenchymal abnormalities that might be overlooked on conventional noncontrast CT. Accordingly, we sought to evaluate the ability of ED imaging compared with conventional CT imaging to identify abnormalities within the subtended brain tissue territory in patients with large vessel occlusion AIS.
This observational study was conducted at a tertiary-level
comprehensive stroke center (Instituto Médico ENERI, Clínica La Sagrada
Familia, Buenos Aires, Argentina). Adult patients of both sexes
(
Patients were included if they fulfilled all of the following criteria: presence of a hyperdense MCA sign on initial noncontrast CT, availability of subsequent brain magnetic resonance imaging (MRI) during the same hospitalization, and angiographic confirmation of an intra-arterial thrombus during endovascular mechanical thrombectomy. Patients were excluded if imaging studies were incomplete or technically inadequate, if the spectral-based imaging (SBI) dataset of the noncontrast scan was not available, if alternative diagnoses such as intracranial hemorrhage, neoplastic disease, or inflammatory conditions were identified, or if there was a history of previous stroke.
All patients underwent an initial noncontrast brain CT examination using a dual-layer spectral CT system (IQon Spectral CT, Philips Medical Systems, Best, The Netherlands). This technology allowed the simultaneous generation of conventional attenuation-based images expressed in Hounsfield units (HU), as well as spectral-derived quantitative maps including ED relative to water (%EDW) and effective atomic number (Zeff), without the need for additional radiation exposure or separate acquisitions [6, 7, 9].
MRI examinations were performed during hospitalization using a 3.0 Tesla scanner (Ingenia dStream, Philips Healthcare, Best, The Netherlands), including diffusion-weighted imaging (DWI), apparent diffusion coefficient maps, fluid-attenuated inversion recovery (FLAIR), and susceptibility-weighted imaging (SWI). MRI served as the reference standard for confirming acute ischemic parenchymal injury and excluding hemorrhagic transformation.
CT image analysis was performed using a multiparametric display (Intellispace Portal, Philips Healthcare) that combined conventional HU images with co-localized %EDW and Zeff maps. Regions of interest (ROIs) were manually placed over the hyperdense MCA sign and in parenchymal regions distal to the occlusion, with mirrored ROIs in the contralateral hemisphere. In addition to quantitative analysis, a qualitative assessment was independently performed by consensus of two board-certified neuroradiologists with extensive experience in acute stroke imaging (with discrepancies resolved by consensus), who were blinded to clinical outcomes, MRI findings, and angiographic results. Diagnostic confidence in identifying abnormal vascular and parenchymal findings was assessed for each imaging parameter using a 5-point Likert scale, ranging from 5 (very high diagnostic confidence) to 1 (very low diagnostic confidence). This metric was intended to capture the perceived clarity of spectral reconstructions compared to conventional CT, rather than providing an objective measure of sensitivity.
Discrete variables were reported as counts (%) and continuous variables as
mean
A total of 85 patients presenting with clinical symptoms suggestive of AIS were retrospectively identified. Of these, 40
patients were excluded due to the absence of SBI reconstruction of the
noncontrast CT series. Seventeen additional patients were excluded: four due to
indeterminate time since onset of symptoms; five who did not undergo CT upon
admission; three whose imaging studies were deemed technically suboptimal,
primarily due to significant motion artifacts; and five with imaging evidence of
contralateral tissue disease. Accordingly, the final cohort comprised 28 patients
(57% male), with a mean age of 75.7
The region corresponding to the hyperdense MCA sign showed significant
differences between the affected compared to the contralateral hemispheres
irrespective of the parameter explored (conventional CT: 46.6
ED imaging was associated with a significantly higher diagnostic confidence for
the identification of abnormal findings (Fig. 1: subacute phase; and Fig. 2:
hyperacute phase), both for the evaluation of the hyperdense MCA (conventional CT
3.46
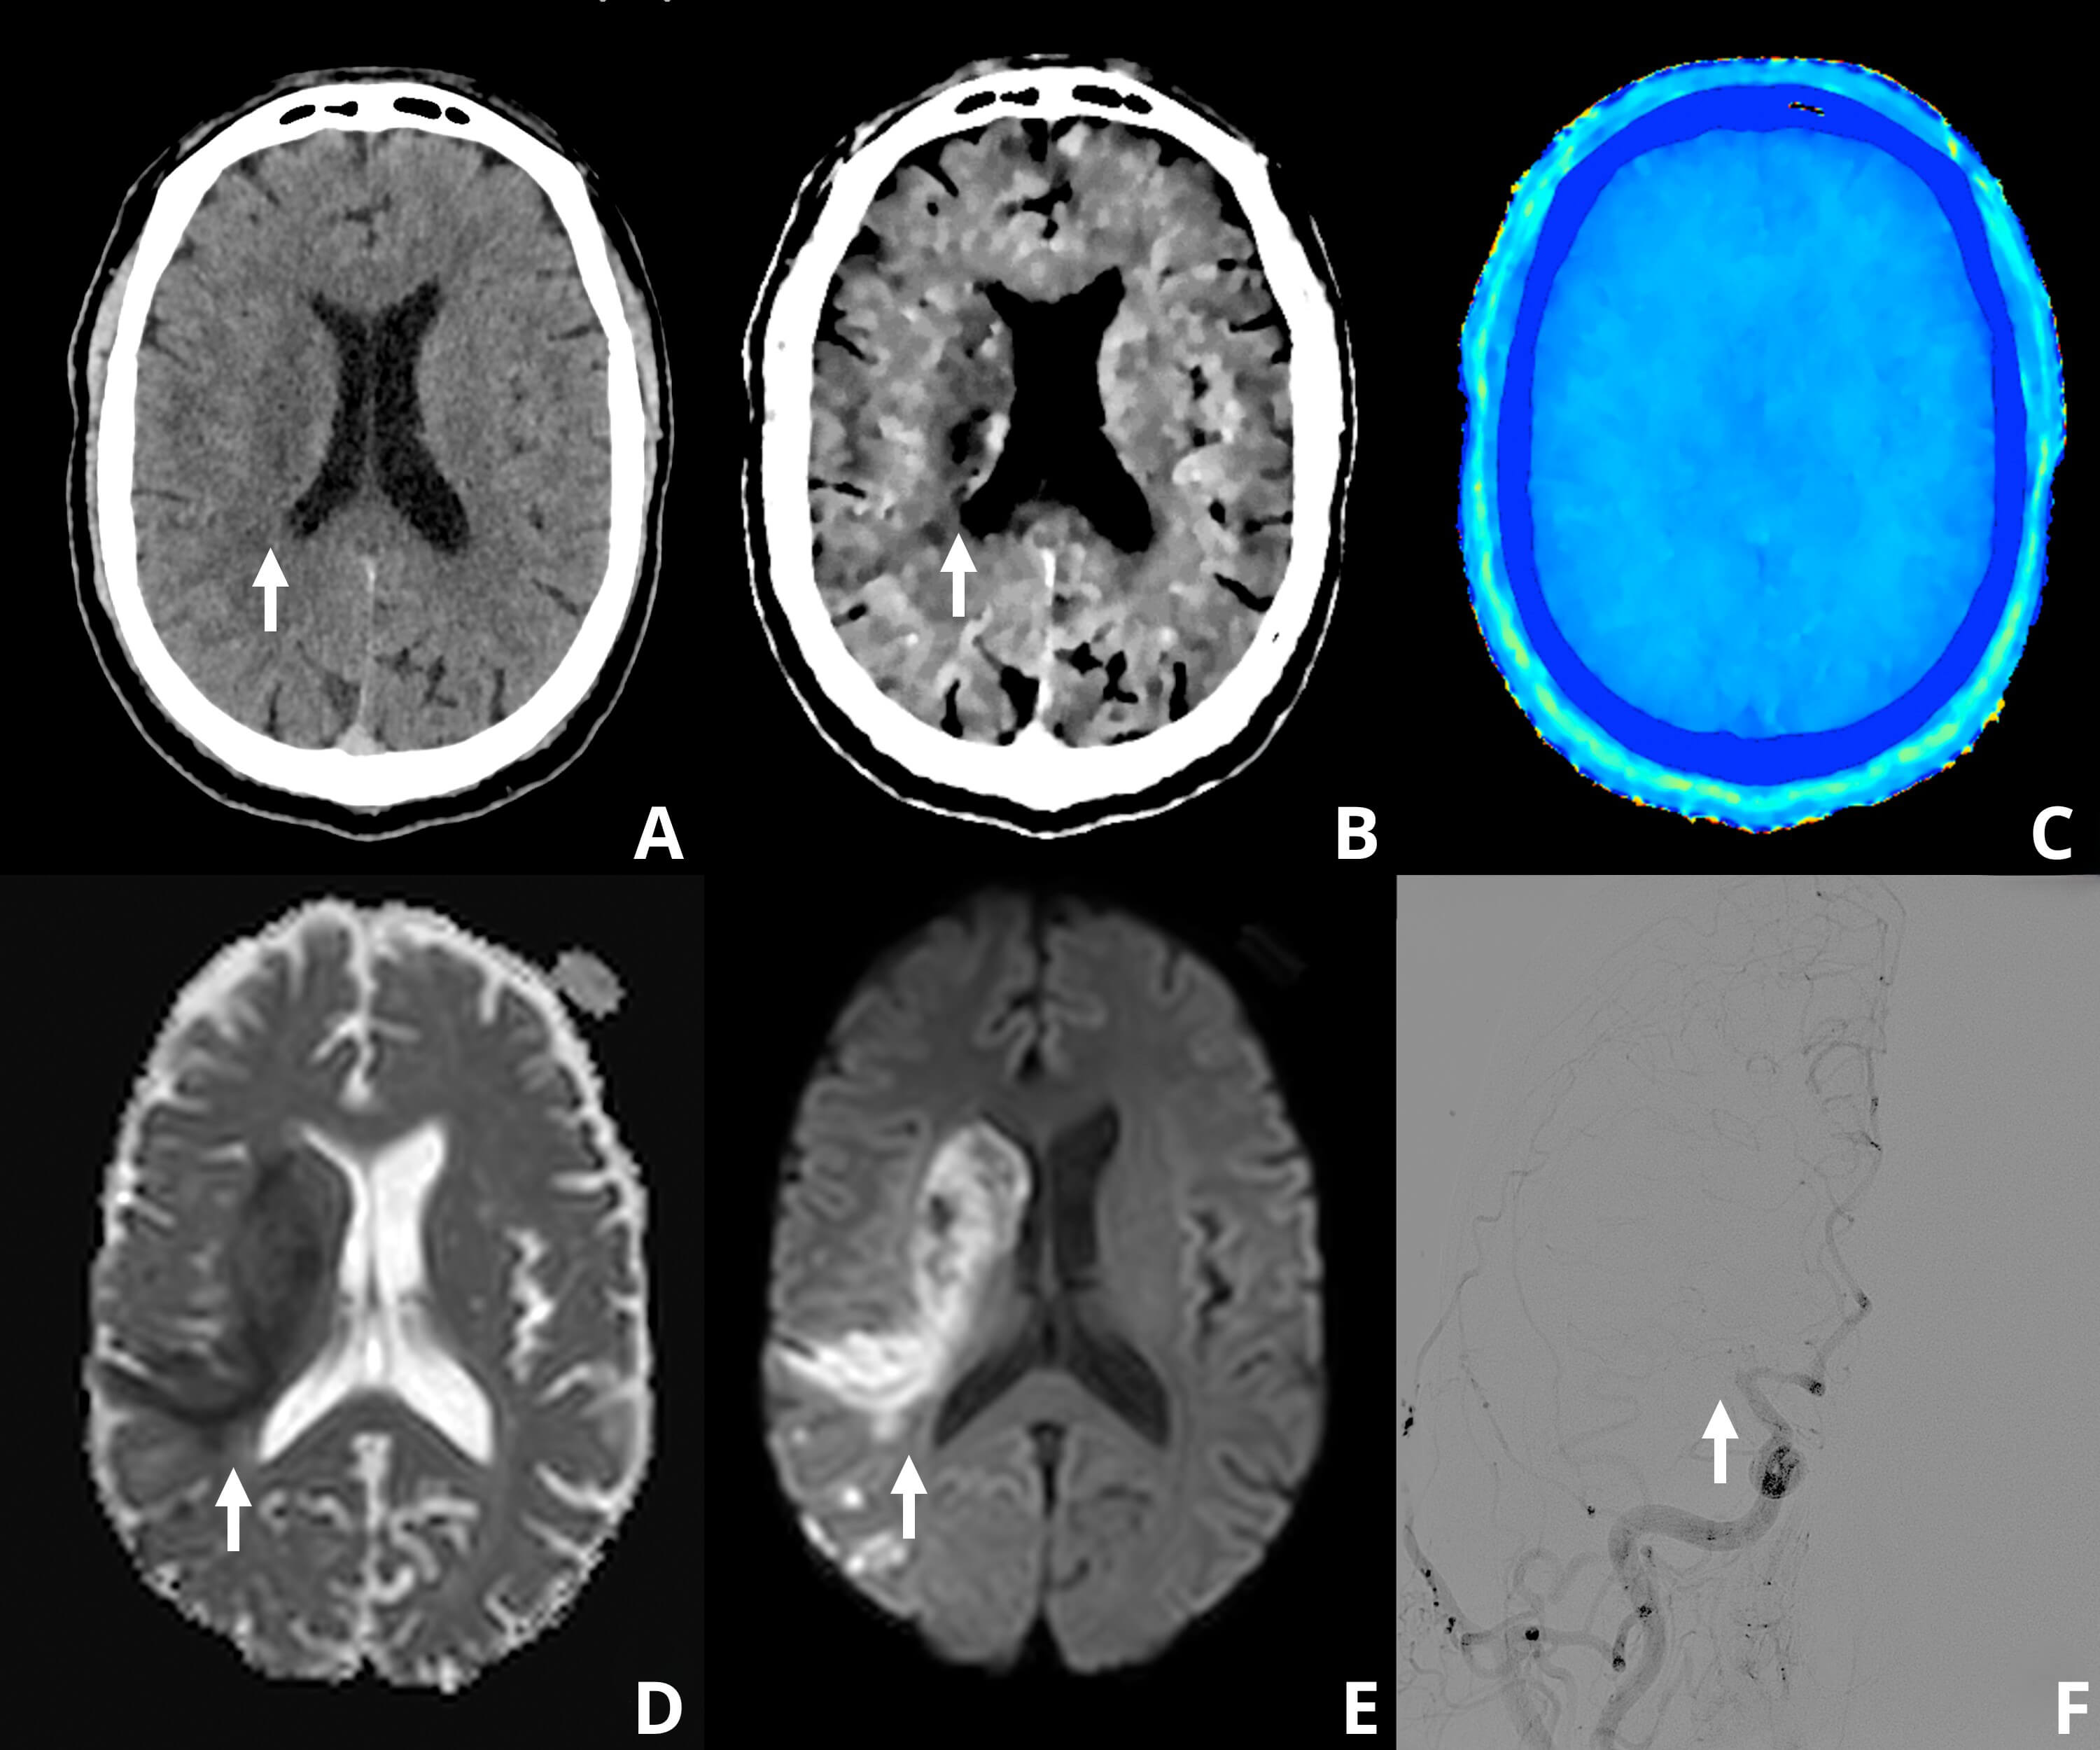 Fig. 1.
Representative case of the subacute phase of ischemic stroke in a 61-year-old man (9 hours since symptoms onset). Noncontrast brain CT (A) demonstrates subtle parenchymal hypodensity in the right corona radiata (arrow). Spectral CT-derived electron density (ED) imaging (B) provides improved characterization and sharper delineation of the ischemic area (arrow) compared to conventional CT. Effective atomic number (Zeff) maps (C) did not provide additional parenchymal information. Brain MRI performed 10 minutes later (D,E) confirms the extent of the ischemic lesion (arrows) using diffusion-weighted imaging. Subsequent cerebral angiography (F) demonstrates occlusion of the M1 segment of the right middle cerebral artery (arrow). CT, computed tomography; MRI, magnetic resonance imaging.
 Fig. 2.
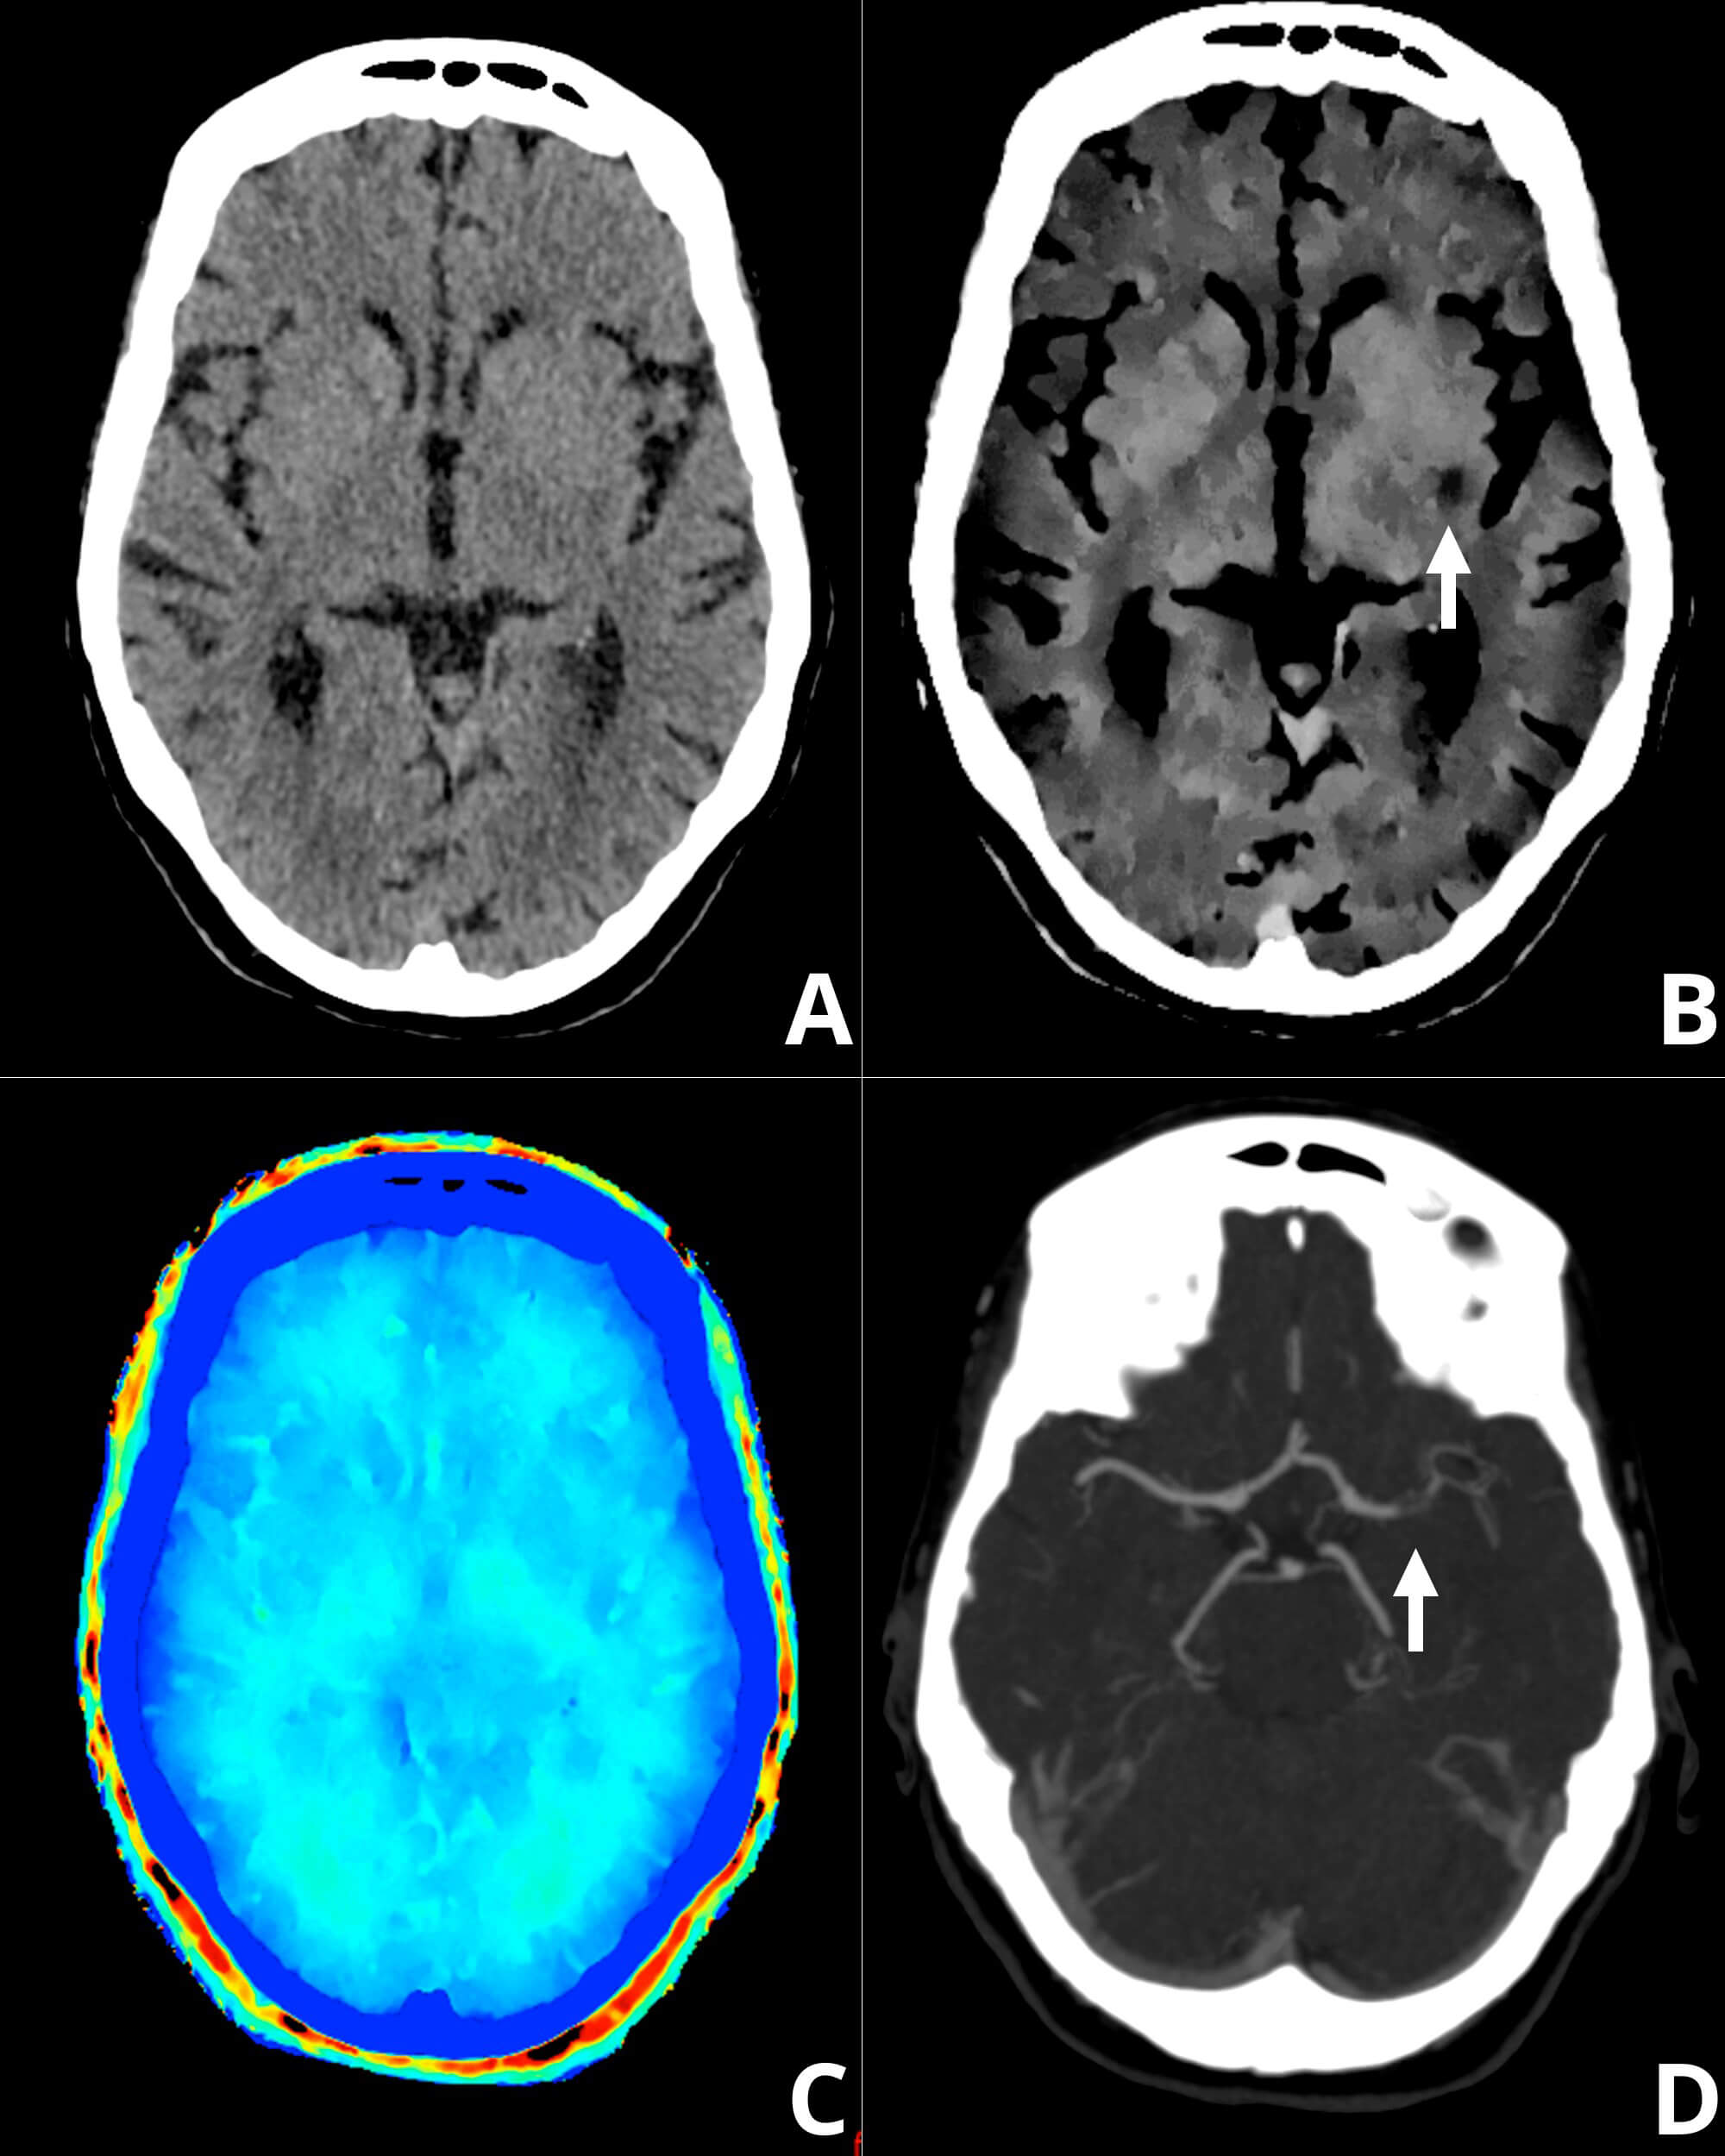
Representative case of the hyperacute phase of ischemic stroke in a 73-year-old woman (3 hours since symptoms onset), illustrating a clinically critical scenario where conventional CT may be inconclusive. While initial noncontrast brain CT (A) shows no definite parenchymal hypodensity, ED imaging (B) identifies subtle gangliobasal ischemic alterations (arrow) not clearly visible on the conventional image. Zeff maps (C) did not add further parenchymal characterization. CT angiography (D) demonstrates a lack of opacification of the left M1 segment (arrow). Digital subtraction angiography confirmed thrombotic occlusion of the proximal M1 branch, followed by successful aspiration thrombectomy.
We further explored the correlations between the time since onset of symptoms and the multiparameter assessment of changes within the MCA and subtended brain tissue (Table 1). In this regard, we found significant correlations using conventional and ED imaging, with an inverse correlation between the time since onset and the density of the subtended brain tissue (conventional CT, r = –0.55, p = 0.005; %EDW, r = –0.50, p = 0.011) and a positive correlation between the time since onset and the diagnostic confidence (conventional CT, r = 0.53, p = 0.009; %EDW, r = 0.52, p = 0.010).
| Density | |||||||
| Hyperdense MCA | Brain parenchyma | ||||||
| HU | ED | Zeff | HU | ED | Zeff | ||
| Time since onset | |||||||
| r | –0.14 | –0.18 | –0.33 | –0.55 | –0.50 | –0.17 | |
| p value | 0.495 | 0.392 | 0.106 | 0.005 | 0.011 | 0.418 | |
| Diagnostic confidence | |||||||
| Hyperdense MCA | Brain parenchyma | ||||||
| HU | ED | Zeff | HU | ED | Zeff | ||
| Time since onset | |||||||
| r | –0.32 | –0.36 | –0.03 | 0.53 | 0.52 | 0.04 | |
| p value | 0.122 | 0.074 | 0.882 | 0.009 | 0.010 | 0.856 | |
HU, Hounsfield units; MCA, middle cerebral artery; r, pearson correlation coefficient.
The main finding of our study was a more confident assessment of brain tissue changes related to large vessel occlusion using ED imaging compared with conventional CT imaging. Although both techniques demonstrated significant differences in the subtended brain tissue distal to the occlusion, ED imaging enabled higher diagnostic confidence for both parenchymal abnormalities and the detection of the hyperdense MCA.
Our findings regarding decreased density in both HU and electron density (%EDW) within hypoperfused regions likely reflect the dynamic evolution of tissue water content and early edema formation. While these changes are consistent with the onset of cytotoxic edema in the hyperacute and subacute phases, our observations cannot definitively discriminate among specific pathophysiological processes, such as the transition from cytotoxic to vasogenic edema or other early ischemic markers [3, 9, 10]. Nevertheless, ED imaging provides improved parenchymal characterization on non-contrast CT by isolating physical density shifts that may be masked by the polychromatic nature of conventional CT. It is noteworthy that ischemic injury also involves metabolic alterations, including variations in the oxygen extraction fraction and deoxyhemoglobin-related susceptibility effects. While advanced MRI techniques like Quantitative Susceptibility Mapping (QSM) are required to quantify these metabolic parameters, ED imaging serves as a pragmatic and accessible structural surrogate in the emergency setting, especially when MRI is unavailable [11, 12].
The limited value of the effective atomic number for differentiating parenchymal hypoattenuation in AIS may be explained by the fact that early ischemic changes are primarily driven by increased tissue water content rather than alterations in elemental composition. Since normal and ischemic brain tissue share a similar atomic makeup, Zeff remains relatively unchanged despite reductions in Hounsfield units.
In line with our findings, previous studies have highlighted the limitations of HU-based assessment due to partial volume effects and beam-hardening artifacts [5]. In contrast, ED has been described as a more stable, composition-oriented metric, particularly for differentiating erythrocyte-rich thrombi from fibrin-dominant or calcified material [13]. Prior reports have also suggested that ED reductions in hypoperfused parenchyma may precede visually appreciable hypoattenuation on conventional CT, a finding corroborated by our results [14].
Furthermore, an in vitro study demonstrated very high accuracy of ED measurements compared with expected values of soft tissue inserts, with deviations as low as 0.1–1.1% [6]. This accuracy likely contributes to the narrow yet significant interhemispheric differences detected using ED imaging in our cohort.
Our results confirm preliminary observations of a recent pilot study (n = 15) where ED imaging demonstrated a better agreement with MRI in patients with AIS. Indeed, in the study of Honda et al. [9], Zeff imaging also was a poor discriminator between the infarcted and non-infarcted areas. Aside from providing data from a larger population, to attain a more comprehensive assessment of the acute ischemic insult, in our study, we also demonstrated a similar incremental value of ED for the detection of the hyperdense MCA sign.
It is worth mentioning that, according to our findings, the clinical value of spectral CT-derived parameters varies significantly depending on the time from symptom onset. In the subacute phase, where conventional CT often already demonstrates subtle changes, ED imaging might sharpen the delineation and improve the characterization of the ischemic core. However, the most significant potential for ED imaging lies in the hyperacute phase, as shown in Fig. 2. In this clinically critical window, conventional CT may be inconclusive or ‘pseudo-normal’ due to minimal net water uptake. Our results demonstrate that ED imaging might identify subtle ischemic alterations before they become clearly visible on conventional CT, potentially facilitating earlier triage and more confident decision-making for reperfusion therapies.
Interestingly, the time since onset of symptoms was correlated inversely with the density of the subtended brain tissue, and directly with the diagnostic confidence; whereas we did not find significant relationships between the time since onset of symptoms and the hyperdense MCA. These findings, though warranting further investigation, support the “time is brain” notion and that early parenchymal ischemic changes, such as incipient loss of gray–white matter differentiation, require some time to develop.
Several limitations should be acknowledged, including the small sample size and single-center design. Additionally, because spectral datasets from noncontrast CT are often discarded, SBI data were not available for all patients. These findings underscore the importance of preserving raw spectral data from noncontrast examinations. Besides, due to the exploratory nature of this study and the objective of characterizing novel spectral parameters, no formal correction for multiple comparisons was applied. Consequently, these findings should be considered hypothesis-generating and interpreted with caution, given the potential for type 1 error. We also acknowledge that the correlation between time from symptom onset and diagnostic confidence may be influenced by confounding variables such as clinical severity or infarct volume; however, our sample size was insufficient for a robust multivariable adjustment. Finally, histopathological correlation was not available, precluding definitive conclusions regarding clot subtype.
In this study, electron density imaging enabled a more confident assessment of brain tissue changes related to large vessel occlusion acute ischemic stroke compared to conventional CT imaging. Our findings support the role of electron density imaging as a promising spectral CT metric for the detection of arterial thrombi and early ischemic injury without the need for intravenous contrast, which might support timely clinical decision-making, particularly when advanced perfusion imaging is not readily available.
The data that support the findings of this study are available upon reasonable request from the corresponding author.
SDE, AP, and GRG designed the research study. SDE and AP performed the research. PD, CB, and PL performed the conduct of the study and interpretation of the data. SDE, AP, and GRG analyzed the data. SDE and AP wrote the manuscript. All authors contributed to editorial changes in the manuscript. All authors read and approved the final manuscript. All authors have participated sufficiently in the work and agreed to be accountable for all aspects of the work.
Written informed consent was obtained from all patients. This observational study was performed in accordance with the Declaration of Helsinki and later amendments, and was approved by the institutional ethics review board of Instituto Medico ENERI, Clinica La Sagrada Familia. Regarding the Ethics Committee approval number, rather than numbers, our institution uses the title (in Spanish): “Identificacion de trombos sin contraste mediante el uso de densidad de electrones por TC espectral”, which was approved on June 20th 2022.
Not applicable.
This research received no external funding.
The authors declare no conflicts of interest.
During the preparation of this work the authors used ChatGPT-3.5 in order to check spell and grammar. After using this tool, the authors reviewed and edited the content as needed and take full responsibility for the content of the publication.
References
Publisher’s Note: IMR Press stays neutral with regard to jurisdictional claims in published maps and institutional affiliations.