


 , Changqin Pu 1,†, Congcong Deng 1, Xuexue Bai 1, Si Wu 1, Chenxin Tian 1, Xueyou Xu 2, Renzhi Wang 1, Mengqi Chang 1,3,*
 , Ming Feng 1,*
1 Department of Neurosurgery, China Pituitary Disease Registry Center, Peking Union Medical College Hospital, Chinese Academy of Medical Science and Peking Union Medical College, 100730 Beijing, China
2 Department of Neurosurgery, The Affiliated Hospital of Guizhou Medical University, 550004 Guiyang, Guizhou, China
3 Institute of Clinical Medicine, National Infrastructures for Translational Medicine, Peking Union Medical College Hospital, Chinese Academy of Medical Sciences and Peking Union Medical College, 100007 Beijing, China
†These authors contributed equally.
Abstract
Pituitary neuroendocrine tumors (PitNETs) have different cell types and levels of growth. We do not fully understand why they grow so much. Cuproptosis is a new way that copper kills cells and it is important in cancer. But, we do not know how it works in PitNETs yet.
We used several methods like bulk and single-cell sequencing with machine learning to investigate cuproptosis in PitNETs. We used Weighted Gene Co-expression Network Analysis (WGCNA) and random forest to find important genes. Then, we did tests in the lab to see how these genes work.
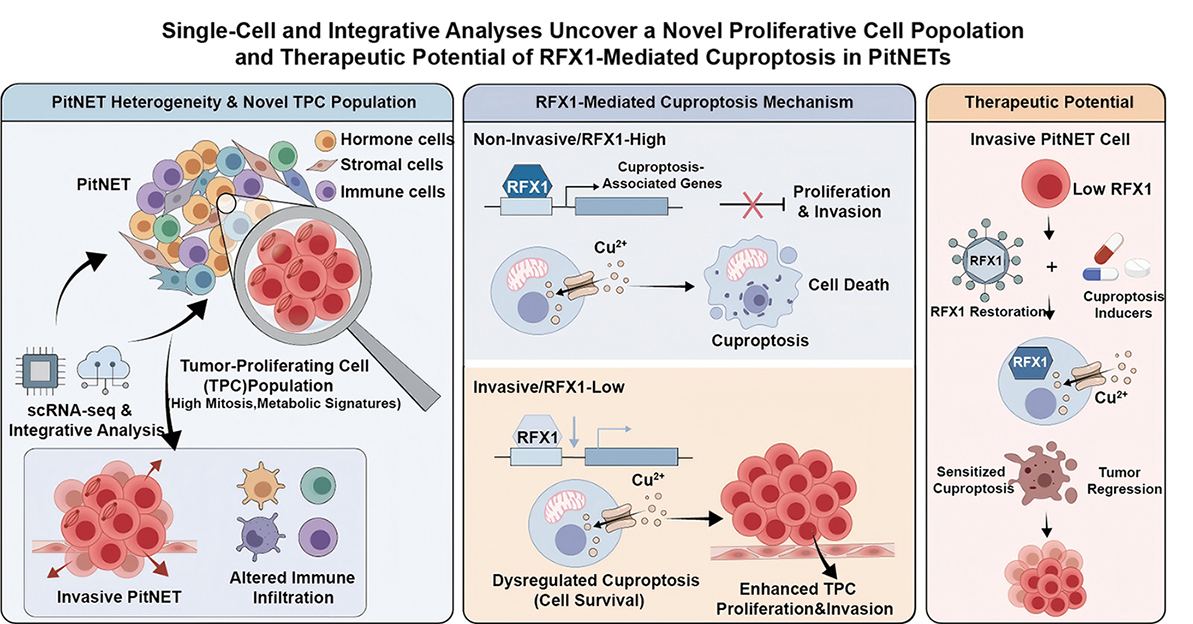
Analysis of cuproptosis-related genes (CRGs) revealed significant differences in expression and immune landscapes between invasive and non-invasive PitNETs. We established CRG-based molecular subtypes and a high-performance predictive model for tumor invasiveness. Notably, regulatory factor X1 (RFX1) was identified and validated as a key regulator that suppresses tumor growth and sensitizes cells to cuproptosis. These results highlight the clinical relevance of cuproptosis in PitNET progression and suggest RFX1 as a potential therapeutic target.
This study establishes a single-cell–based molecular landscape of PitNETs and uncovers RFX1-mediated cuproptosis as a key suppressive mechanism of tumor progression. These findings not only deepen the understanding of PitNET heterogeneity but also propose RFX1 as a promising therapeutic target for PitNETs.
Graphical Abstract
Keywords
- pituitary neoplasms
- single-cell analysis
- machine learning
- cell death
- molecular targeted therapy
Pituitary neuroendocrine tumors (PitNETs) are a heterogeneous group of neoplasms arising from adenohypophyseal cells, exhibiting diverse clinical manifestations and biological behaviors [1, 2]. While most PitNETs are benign and slow-growing, a significant subset exhibits aggressive features, including invasiveness into critical surrounding structures such as the cavernous sinus, sphenoid bone, and internal carotid artery. These invasive PitNETs pose formidable clinical challenges; their infiltrative nature often precludes gross total surgical resection via the transsphenoidal approach and is associated with a significantly higher risk of postoperative recurrence [3, 4]. Furthermore, current medical mainstays, such as somatostatin receptor ligands and dopamine agonists, frequently demonstrate limited efficacy in controlling tumor volume or hormone secretion in these aggressive subtypes [5, 6]. The lack of reliable molecular biomarkers and effective targeted therapies for refractory cases underscores the urgent need to identify the novel mechanistic drivers underlying PitNET progression [7].
Cuproptosis, a recently identified copper-dependent form of regulated cell death, has emerged as a crucial regulator of tumor biology that is mechanistically distinct from apoptosis, necroptosis, and ferroptosis [8, 9]. This unique process is characterized by the direct binding of copper ions to lipoylated components of the tricarboxylic acid cycle, leading to the aggregation of lipoylated proteins and the loss of iron-sulfur cluster proteins [10, 11]. Such interactions trigger catastrophic proteotoxic stress and eventual cell death. In various malignancies, metabolic reprogramming in malignant cells often creates specific vulnerabilities to copper-induced stress, suggesting that dysregulation of copper homeostasis contributes significantly to tumor progression [12, 13]. However, the role of cuproptosis in invasive PitNETs remains largely unexplored, and the expression patterns of cuproptosis-related genes (CRGs) in these tumors have yet to be systematically characterized.
Also, the tumor microenvironment is very important for tumor progression and therapeutic response [14, 15]. Invasive PitNETs show distinct immune infiltration profiles. Investigating the link between CRGs and immune cells could show the immunomodulatory mechanisms in PitNET pathogenesis. Also, molecular subtyping based on CRG expression may help group invasive PitNET patients into distinct clusters for prognostic and therapeutic use [16].
In this study, we comprehensively analyzed the expression profiles of cuproptosis-related genes in invasive and non-invasive PitNETs. We further investigated their associations with immune cell infiltration, constructed molecular subtypes based on differentially expressed CRGs, and explored the underlying biological pathways. Additionally, we developed a predictive model for invasive PitNETs classification and identified key hub genes involved in cuproptosis regulation. Finally, we validated the tumor-suppressive role of RFX1 in invasive PitNETs and its potential involvement in enhancing cuproptosis-mediated cell death. Our findings provide novel insights into the role of cuproptosis in invasive PitNETs progression and may contribute to the development of targeted therapeutic strategies. A summary of the research workflow is presented in Fig. 1.
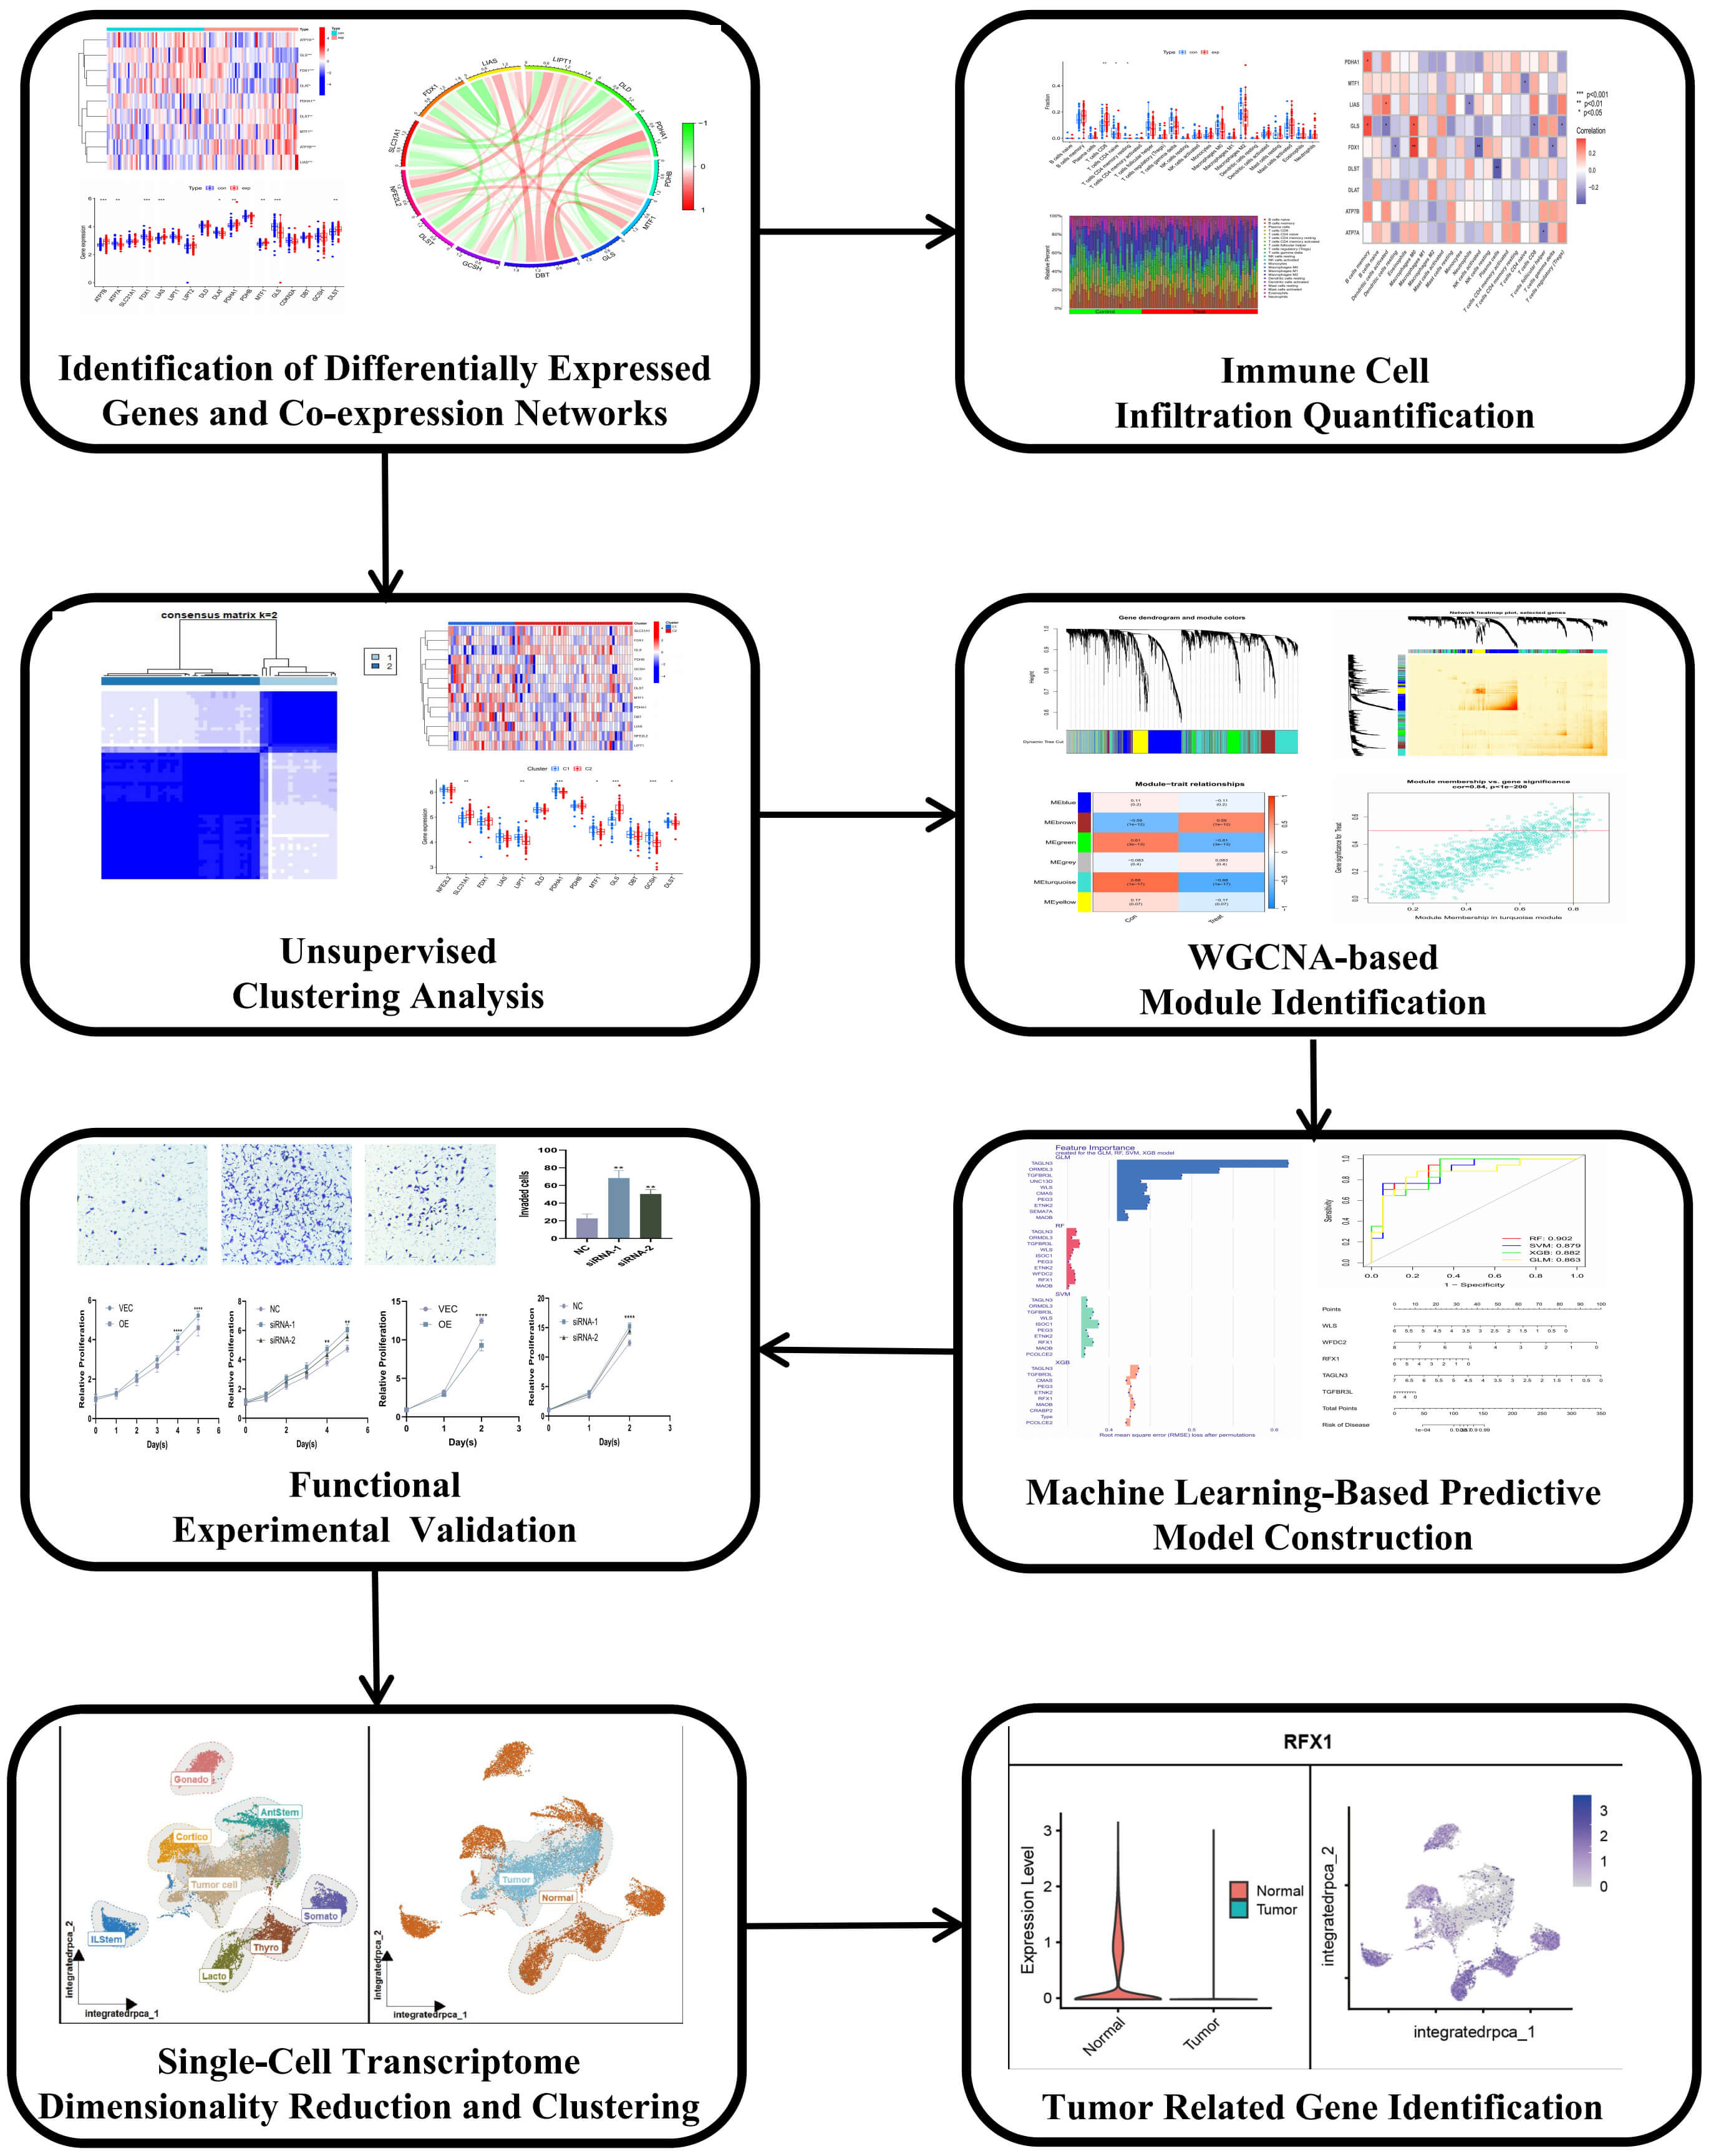 Fig. 1.
Flow diagram depicting the systematic approach and procedural
framework of the study. WGCNA, Weighted Gene Co-expression Network Analysis. *p
We got RFX1 overexpression plasmids (GP-PL-RFX1, GenePharma, Shanghai, China) (Supplementary Table 1). We used Lipofectamine 2000 (cat. no. 11668019, Invitrogen; Thermo Fisher Scientific, Inc., Carlsbad, CA, USA) for transfection following the manual. To perform gene silencing, we put small interfering RNA (siRNA) (GP-siR-RFX1, GenePharma, Shanghai, China) for RFX1 into HP75 and AtT20 cells (authenticated by STR profiling and tested negative for mycoplasma, sourced from the Cell Bank of the Chinese Academy of Sciences) with Lipofectamine 2000. Also, we used RT-qPCR and Western blot to check if the overexpression and knockdown worked.
We seeded cells (1
We seeded 1000 cells in each well of 6-well plates and kept them for 14 days. Then, we fixed the colonies with 4% paraformaldehyde and stained them with crystal violet (Sigma-Aldrich; Merck KGaA, Darmstadt, Germany). We used ImageJ (v1.53, National Institutes of Health, Bethesda, MD, USA) to count the results.
We used Transwell inserts coated with 100 µL of Matrigel Matrix (cat. no.
354234, Corning, Inc., Corning, NY, USA). We put them at 37 °C for 30
minutes to make the gel solid. Then, we put the inserts into a 24-well plate to
make the upper chamber. We seeded 5
We used Trizol (cat. no. 15596026, Invitrogen; Thermo Fisher Scientific, Inc., Carlsbad, CA, USA) to get total RNA. Then, 1 µg of RNA was turned into complementary DNA using a reverse transcription kit (RR036A, Takara Bio, Inc., Kusatsu, Shiga, Japan). We did qPCR with PowerUp SYBR Green Master Mix (A25742, Applied Biosystems (Thermo Fisher Scientific, Inc., Austin, TX, USA)) on a Quantitative real-time PCR system (QuantStudio 1, Thermo Fisher Scientific, Inc., Waltham, MA, USA). The settings were: 95 °C for 5 minutes, then 40 cycles of 95 °C for 10 seconds and 60 °C for 30 seconds. We calculated gene expression using the 2-(ΔΔCT) method and used GAPDH as a control. The specific primer sequences used in this study are listed in Supplementary Table 2.
We used RIPA lysis buffer (P0013B, Beyotime Biotechnology, Shanghai, China) with inhibitors to lyse the cells. We used SDS-PAGE to separate the proteins and moved them to PVDF membrane (ISEQ00010, Merck Millipore, Billerica, MA, USA) membranes using a semi-dry system. After using blocking buffer, we put the membranes with primary antibodies (Anti-RFX1 primary antibody (1:1000 dilution, 26859-1-AP, Proteintech, Wuhan, Hubei, China); Anti-GAPDH primary antibody (1:50,000 dilution, 81640-5-RR, Proteintech); Anti-Cyclin D1 primary antibody (1:2000 dilution, 26939-1-AP, Proteintech); Anti-CDK2 primary antibody (1:1000 dilution, 10122-1-AP, Proteintech)) at 4 °C overnight. Then, we used HRP-conjugated goat anti-rabbit IgG secondary antibody (1:50,000 dilution, ZB-2301, Beijing Zhongshan Golden Bridge Biotechnology Co., Ltd., Beijing, China) for 1 hour at room temperature. We saw the protein bands using NcmECL Ultra (NCM Biotech, Suzhou, China) and a ChemiDoc XRS+ imaging system (ChemiDoc XRS+, Bio-Rad Laboratories, Inc., Hercules, CA, USA). We used ImageJ (v1.53) to measure the data.
We used the AddModuleScore function in Seurat to measure cuproptosis activity.
We looked for differential gene expression using the Wilcoxon rank-sum test
(p
We did all stats in R software (v4.3.1, R Core Team, Vienna, Austria). We showed data as mean
Analysis of 19 CRGs in invasive versus non-invasive PitNET samples revealed nine
significantly dysregulated genes: ATP7B (log2FC = 0.225, p
Consensus clustering was performed based on the expression profiles of the nine differentially expressed cuproptosis-related genes. The optimal number of clusters was determined to be k = 2, as indicated by the highest clustering stability (Supplementary Fig. 1E–H). The cumulative distribution function (CDF) curves fluctuated within a minimal consensus index range of 0.03 to 0.55, demonstrating robust clustering stability Additionally, variations in the area under the curve (AUC) between k-1 and k further supported the selection of k = 2, as observed in the CDF curve analysis across values ranging from 2 to 6 (Supplementary Fig. 1I). Consequently, invasive PitNET samples were categorized into two distinct subtypes, designated as Cluster 1 and Cluster 2. Principal component analysis (PCA) further validated the substantial divergence between these two clusters, highlighting distinct transcriptional patterns associated with the differentially expressed cuproptosis-related genes (Supplementary Fig. 1J). Notably, Cluster 1 exhibited higher proportions of CD8⁺ T cells and resting mast cells, whereas Cluster 2 was enriched with follicular helper T cells and activated mast cells (Supplementary Fig. 2H). Enrichment analysis further revealed that starch and sucrose metabolism as well as mismatch repair pathways were prominently enriched in Cluster 2 (Supplementary Fig. 2I). These distinct signatures suggest that CRG-based subtyping effectively captures the metabolic and immunogenic heterogeneity of invasive PitNETs.
Six-week-old BALB/c nude mice were obtained from GemPharmatech Co., Ltd. and maintained in a specific pathogen-free (SPF) environment. All mice were allowed a 1-week acclimation period after being transferred to the experimental facility before being used in the study. For the subcutaneous xenograft assay, the mice were randomly stratified into distinct groups, and 2 × 10⁷ target cells were subcutaneously injected into the right axillary region of each mouse. The tumor size and body weight of the mice were measured every 2 to 3 days using a digital caliper. At the conclusion of the experiment, the tumors were excised and weighed.
Weighted Gene Co-expression Network Analysis (WGCNA) was performed to construct co-expression networks for both invasive and non-invasive PitNET samples. Initially, variance computations were conducted across all genes within the training dataset, followed by further analysis of the top 25% of genes exhibiting the highest variance. Co-expressed gene modules were identified by setting the soft-threshold power to 6, achieving a scale-free R2 value of 0.9 (Supplementary Fig. 3A). The dynamic tree-cutting algorithm partitioned the genes into six distinct co-expression modules, each assigned a unique color, with the topological overlap matrix heatmap further illustrating module connectivity (Supplementary Fig. 3B–D).
To evaluate the relationship between gene modules and clinical traits, correlation analysis was performed across the six identified modules. The turquoise module exhibited the strongest association with invasive PitNET samples (Supplementary Fig. 3E), suggesting its potential involvement in invasive PitNETs pathogenesis. Moreover, correlation analysis revealed a significant positive association between turquoise module genes and module-related genes, reinforcing their functional relevance in invasive PitNET (Supplementary Fig. 3F).
Additionally, WGCNA was applied to identify key gene modules specifically associated with cuproptosis-related clusters. Following the determination of optimal soft-thresholding parameters (soft threshold = 4, R2 = 0.9), a scale-free network was successfully constructed (Supplementary Fig. 3G). The analysis identified six major co-expression modules, with their Topological Overlap Matrix (TOM)-based heatmap visualization further delineating inter-module relationships (Supplementary Fig. 3H–J). Correlation analysis of module-clinical trait relationships indicated that invasive PitNETs-related clusters were most strongly associated with the green module (Supplementary Fig. 3K). Furthermore, gene-module correlation analysis demonstrated that genes within the green module exhibited strong connectivity and functional relevance within the selected module (Supplementary Fig. 3L).
We found 15 hub genes by looking at the overlap between genes from invasive PitNETs and cuproptosis clusters (Fig. 2A). To make a predictive framework, we built four machine learning models: Random Forest (RF), Support Vector Machine (SVM), Generalized Linear Model (GLM), and Extreme Gradient Boosting (XGB). We used the DALEX R package (v2.5.3, ModelOriented, Warsaw, Poland) to check model performance and investigated the residual distribution in the validation set. Among the four, RF and SVM had the lowest residuals. This means they had the best accuracy (Fig. 2B).
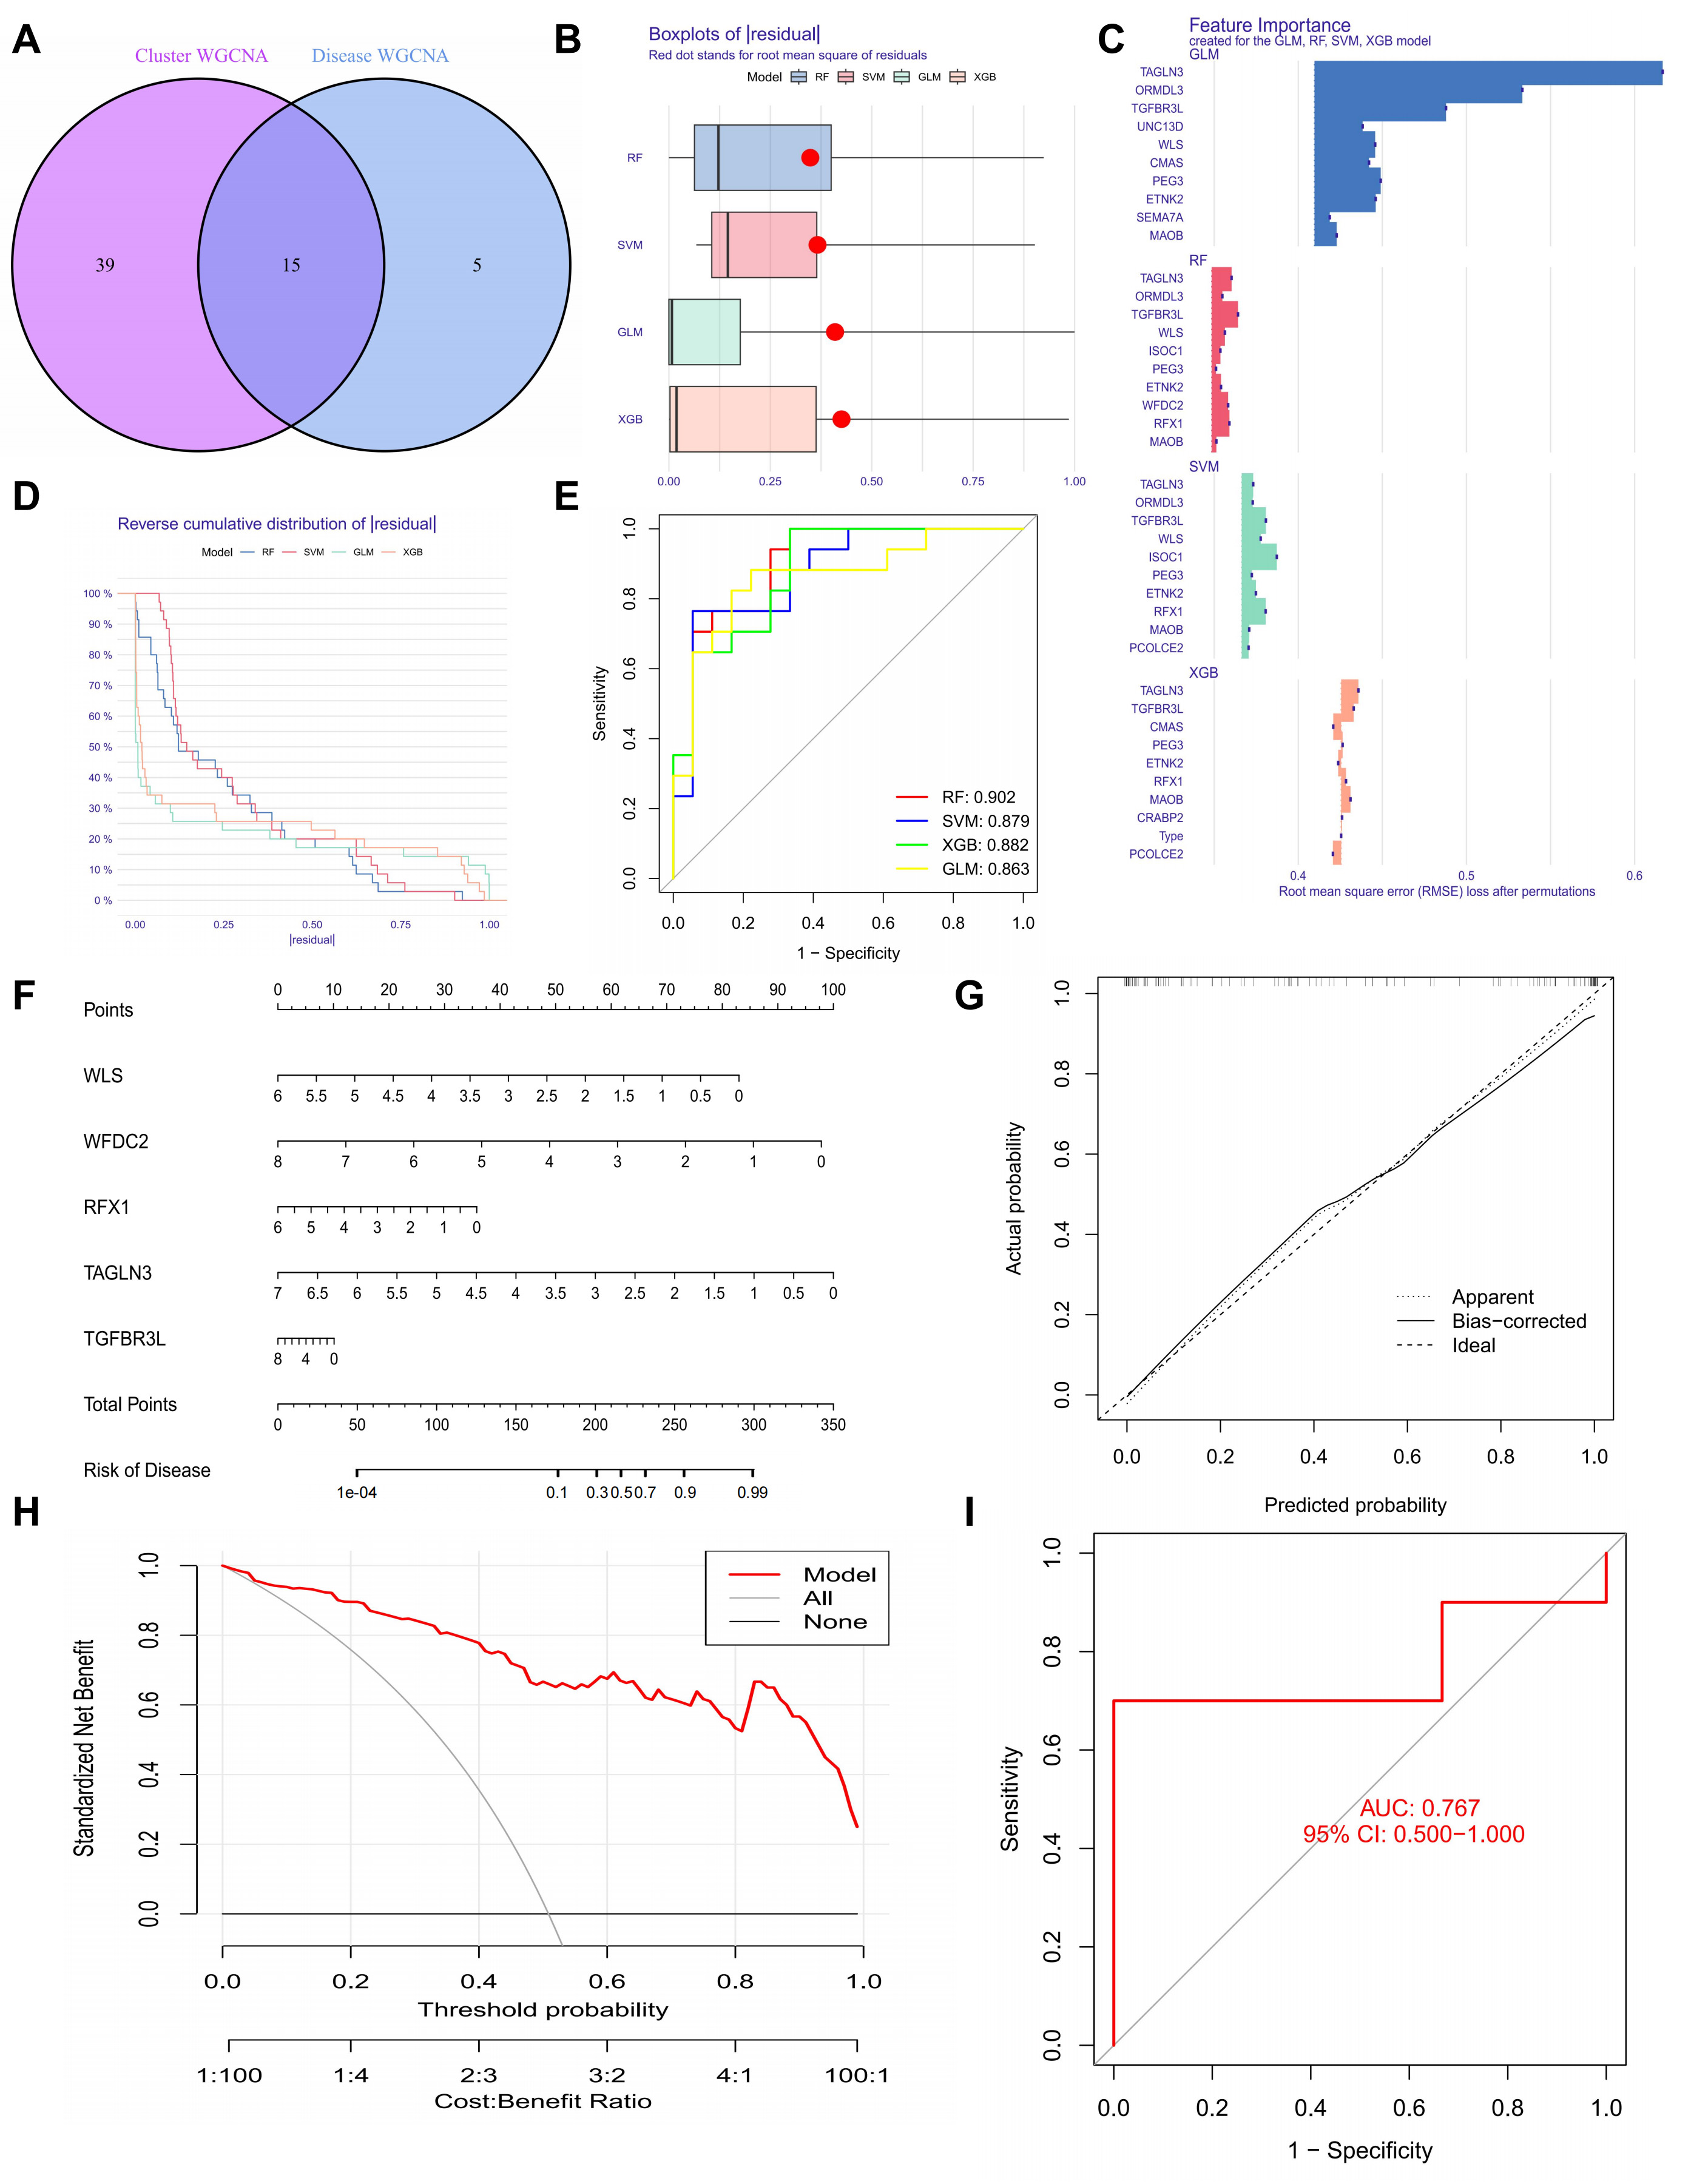 Fig. 2.
Optimization and validation of machine-learning-based predictive models and nomogram construction in invasive pituitary neuroendocrine tumors (PitNETs). (A) Identification of overlapping genes between disease-WGCNA and cluster-WGCNA. (B) Box plot comparing the residuals of the four candidate models. (C) Key performance characteristics of the evaluated machine learning models. (D) Reverse cumulative distribution curves for the four models. (E) ROC curves assessing the performance of Random Forest (RF), Support Vector Machine (SVM), Extreme Gradient Boosting (XGB), and Generalized Linear Model (GLM) models. (F) Nomogram for predicting the risk of invasive PitNET clusters based on the Random Forest (RF) model. (G) Calibration curve assessing the predictive accuracy of the nomogram. (H) Decision curve analysis evaluating the clinical utility of the nomogram. (I) ROC curve of the five-gene RF model, demonstrating its predictive performance.
Next, we ranked the top 15 genes in each model using the root mean square error (Fig. 2C). We used ROC analysis to check how well the models classified the data. The RF model had the highest AUC (0.902). This shows it has a very good predictive ability (Fig. 2D,E). By looking at both residuals and AUC, the RF model was the best at finding invasive PitNET patients. So, we picked the top five genes from the RF model—WLS, WFDC2, RFX1, TAGLN3, and TGFBR3L—for more study.
We made a nomogram to help estimate risk for individual invasive PitNET patients (Fig. 2F). We checked the accuracy of the nomogram using calibration curves and decision curve analysis (DCA). The calibration curves showed that the predicted and actual results were very similar (Fig. 2G). Also, the DCA showed that the nomogram gives a net clinical benefit (Fig. 2H). In the test data, the ROC curve for the five genes (WLS, WFDC2, RFX1, TAGLN3, and TGFBR3L) showed a good AUC of 0.767 (Fig. 2I).
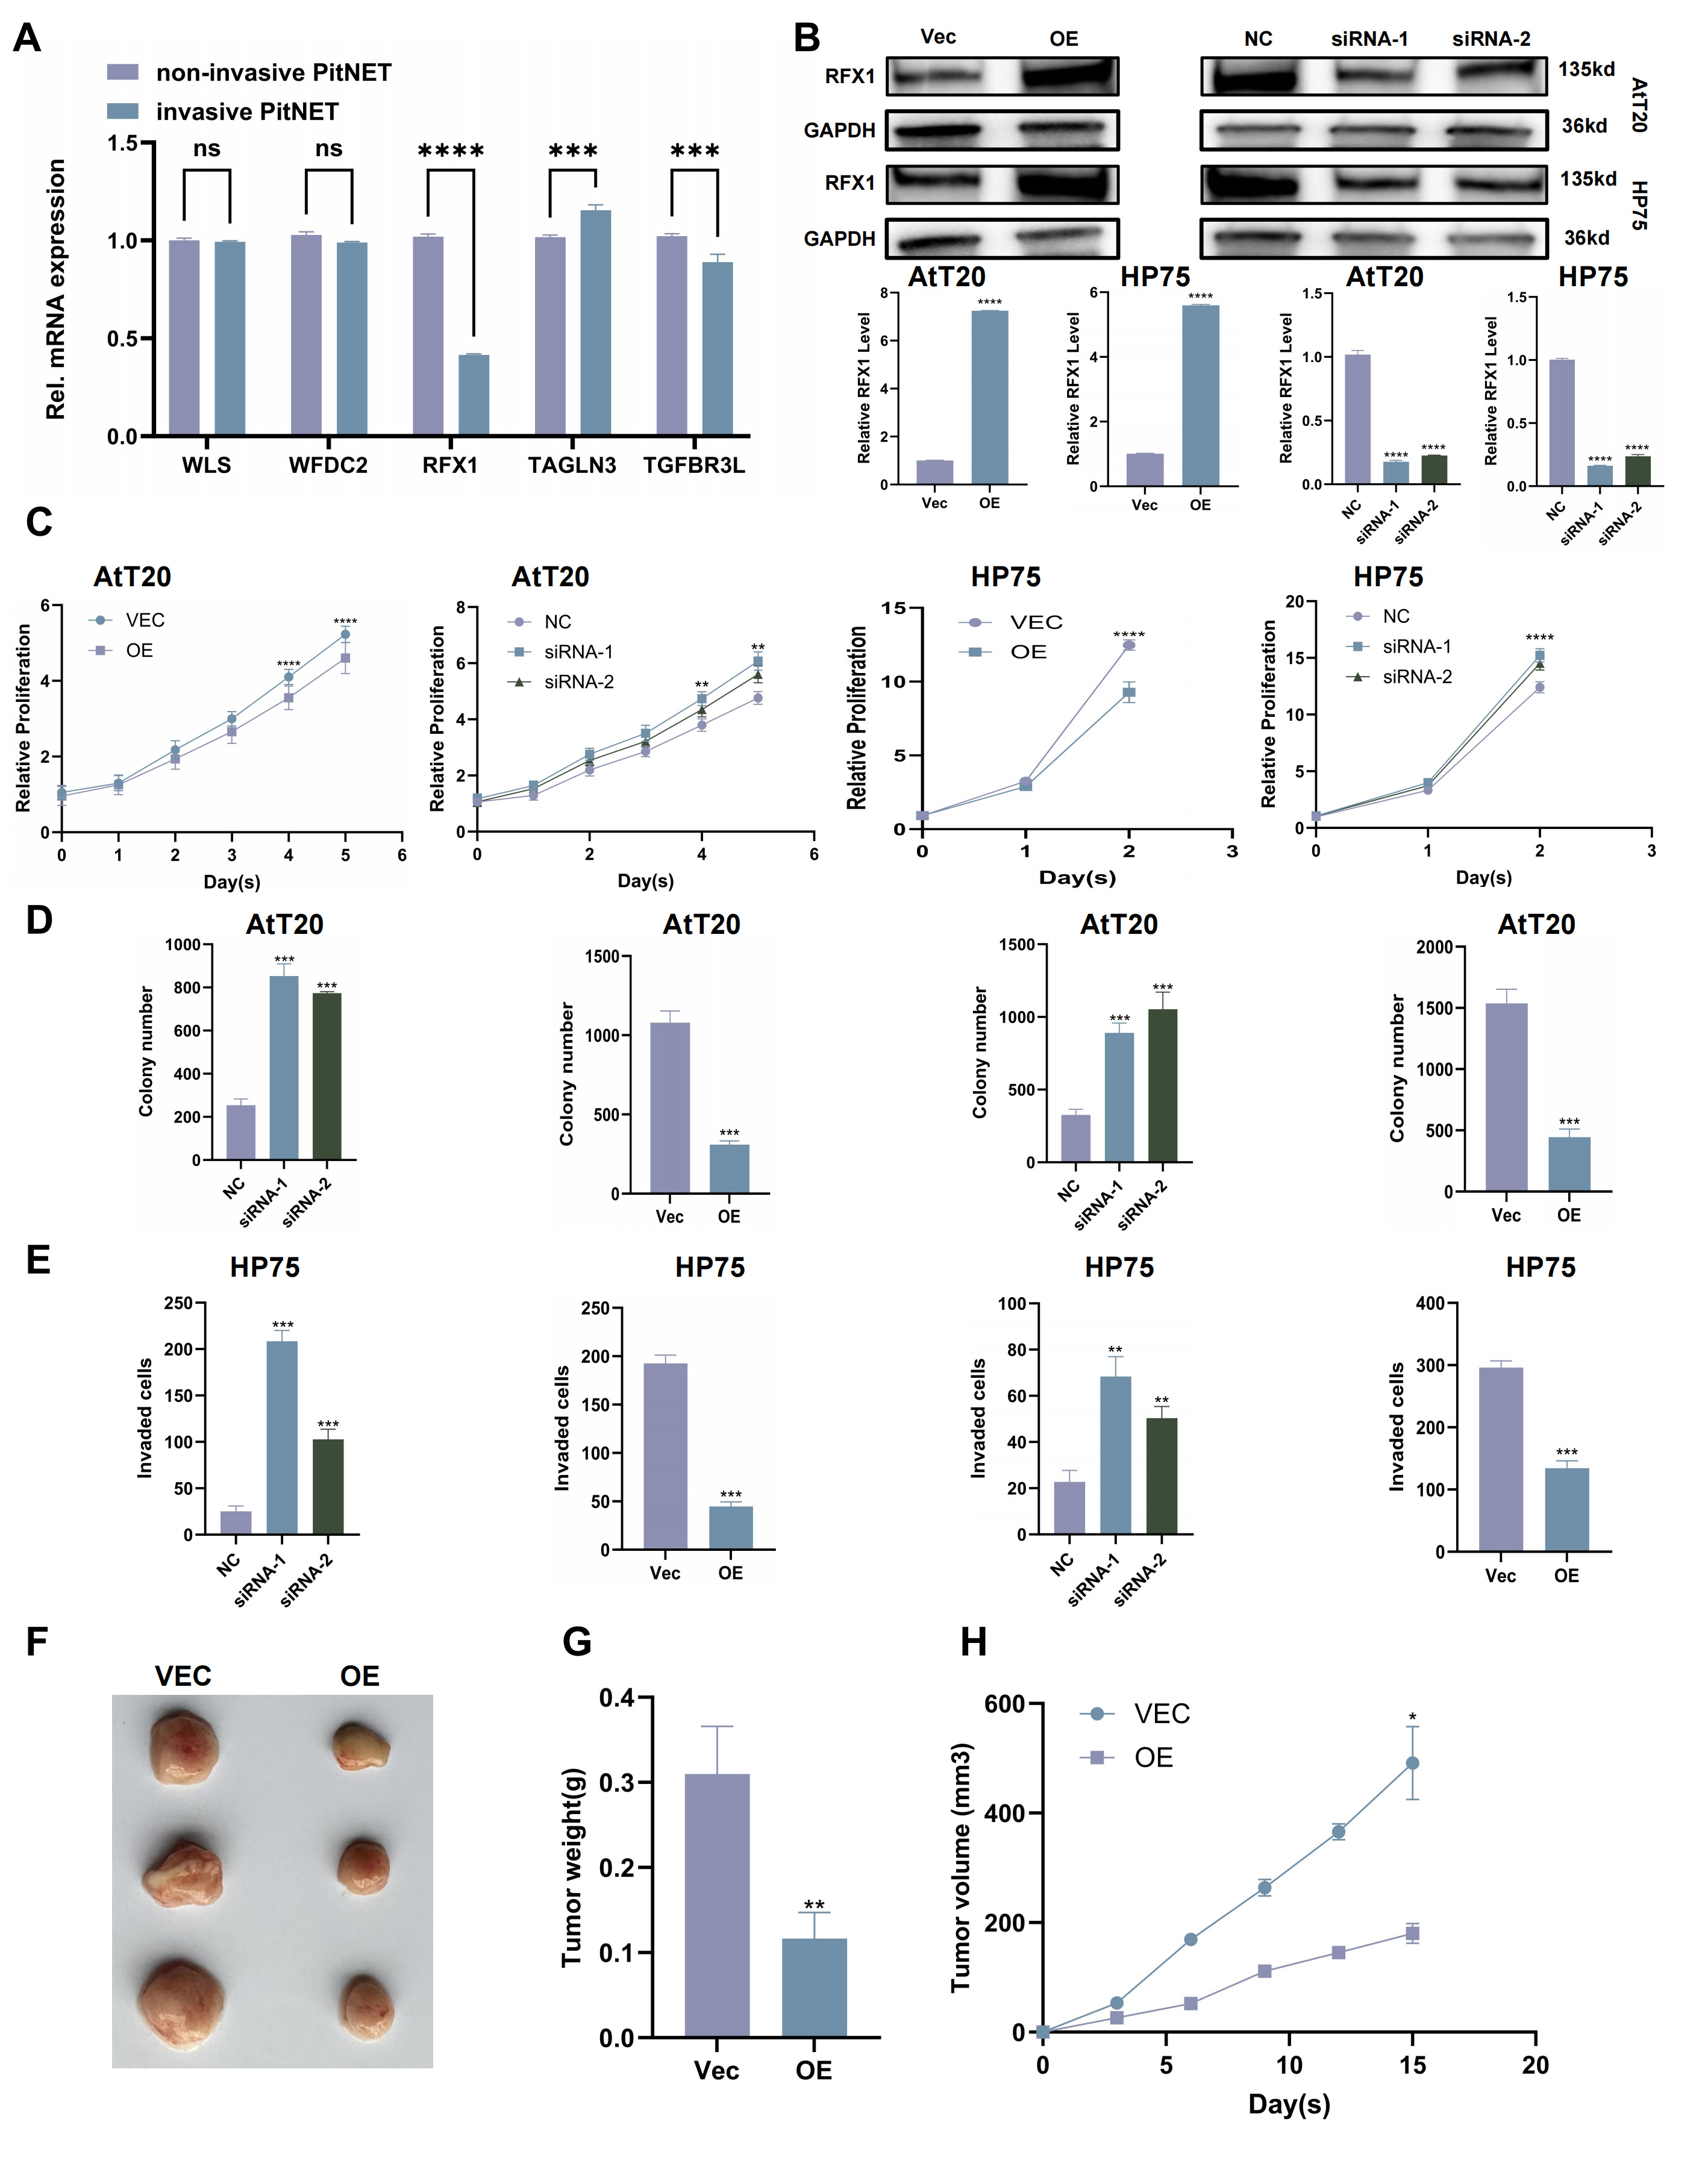
We investigated the expression of the five candidate genes in invasive and non-invasive PitNET samples. RFX1 was the only gene that was significantly different between the two groups. It was much lower in the invasive PitNETs (Fig. 3A).
 Fig. 3.
RFX1 overexpression inhibits proliferation and invasion of
PitNET cells. (A) Relative mRNA expression levels of five key genes in invasive and non-invasive PitNET samples. (B) Validation of RFX1 overexpression and knockdown in constructed cell lines. (C) CCK-8 assay assessing cell viability following RFX1 Overexpression or knockdown. (D) Colony formation assay evaluating the proliferative capacity of cells with RFX1 overexpression or knockdown. (E) Transwell invasion assay measuring the invasive Capacity of cells with RFX1 overexpression or knockdown. (F) Representative images of xenograft tumors from nude mice. (G) Tumor weight measured at the end of the experiment. (H) Tumor volume measured over time. Scale bar, 100 µm. *p
To further investigate the functional significance of RFX1, we did overexpression and knockdown tests (Fig. 3B). The tests showed that making more RFX1 stopped PitNET cells from growing and invading. But, taking away RFX1 made the tumor cells grow and spread more (Fig. 3C–E. Supplementary Fig. 4A,B). Mice were anesthetized by intraperitoneal injection of 50 mg/kg pentobarbital sodium (cat. no. P3761, Sigma‑Aldrich, St. Louis, MO, USA) before tumor implantation. Also, the in vivo xenograft assay showed that RFX1 overexpression slowed down tumor growth in mice (Fig. 3F–H).
Copper is an important micronutrient for cell growth and metabolism. To see how copper affects PitNET cells, we treated them with copper ions and carriers. The results showed that tumor cells are sensitive to copper. This effect depended on the dose of Elesclomol (ELES), a copper ionophore, from 0 to 200 nM. Also, using 5 µM tetrathiomolybdate (TTM), which is a copper chelating agent, stopped the effects of ELES (Fig. 4A) [17, 18]. These findings show a link between cuproptosis and PitNET biology.
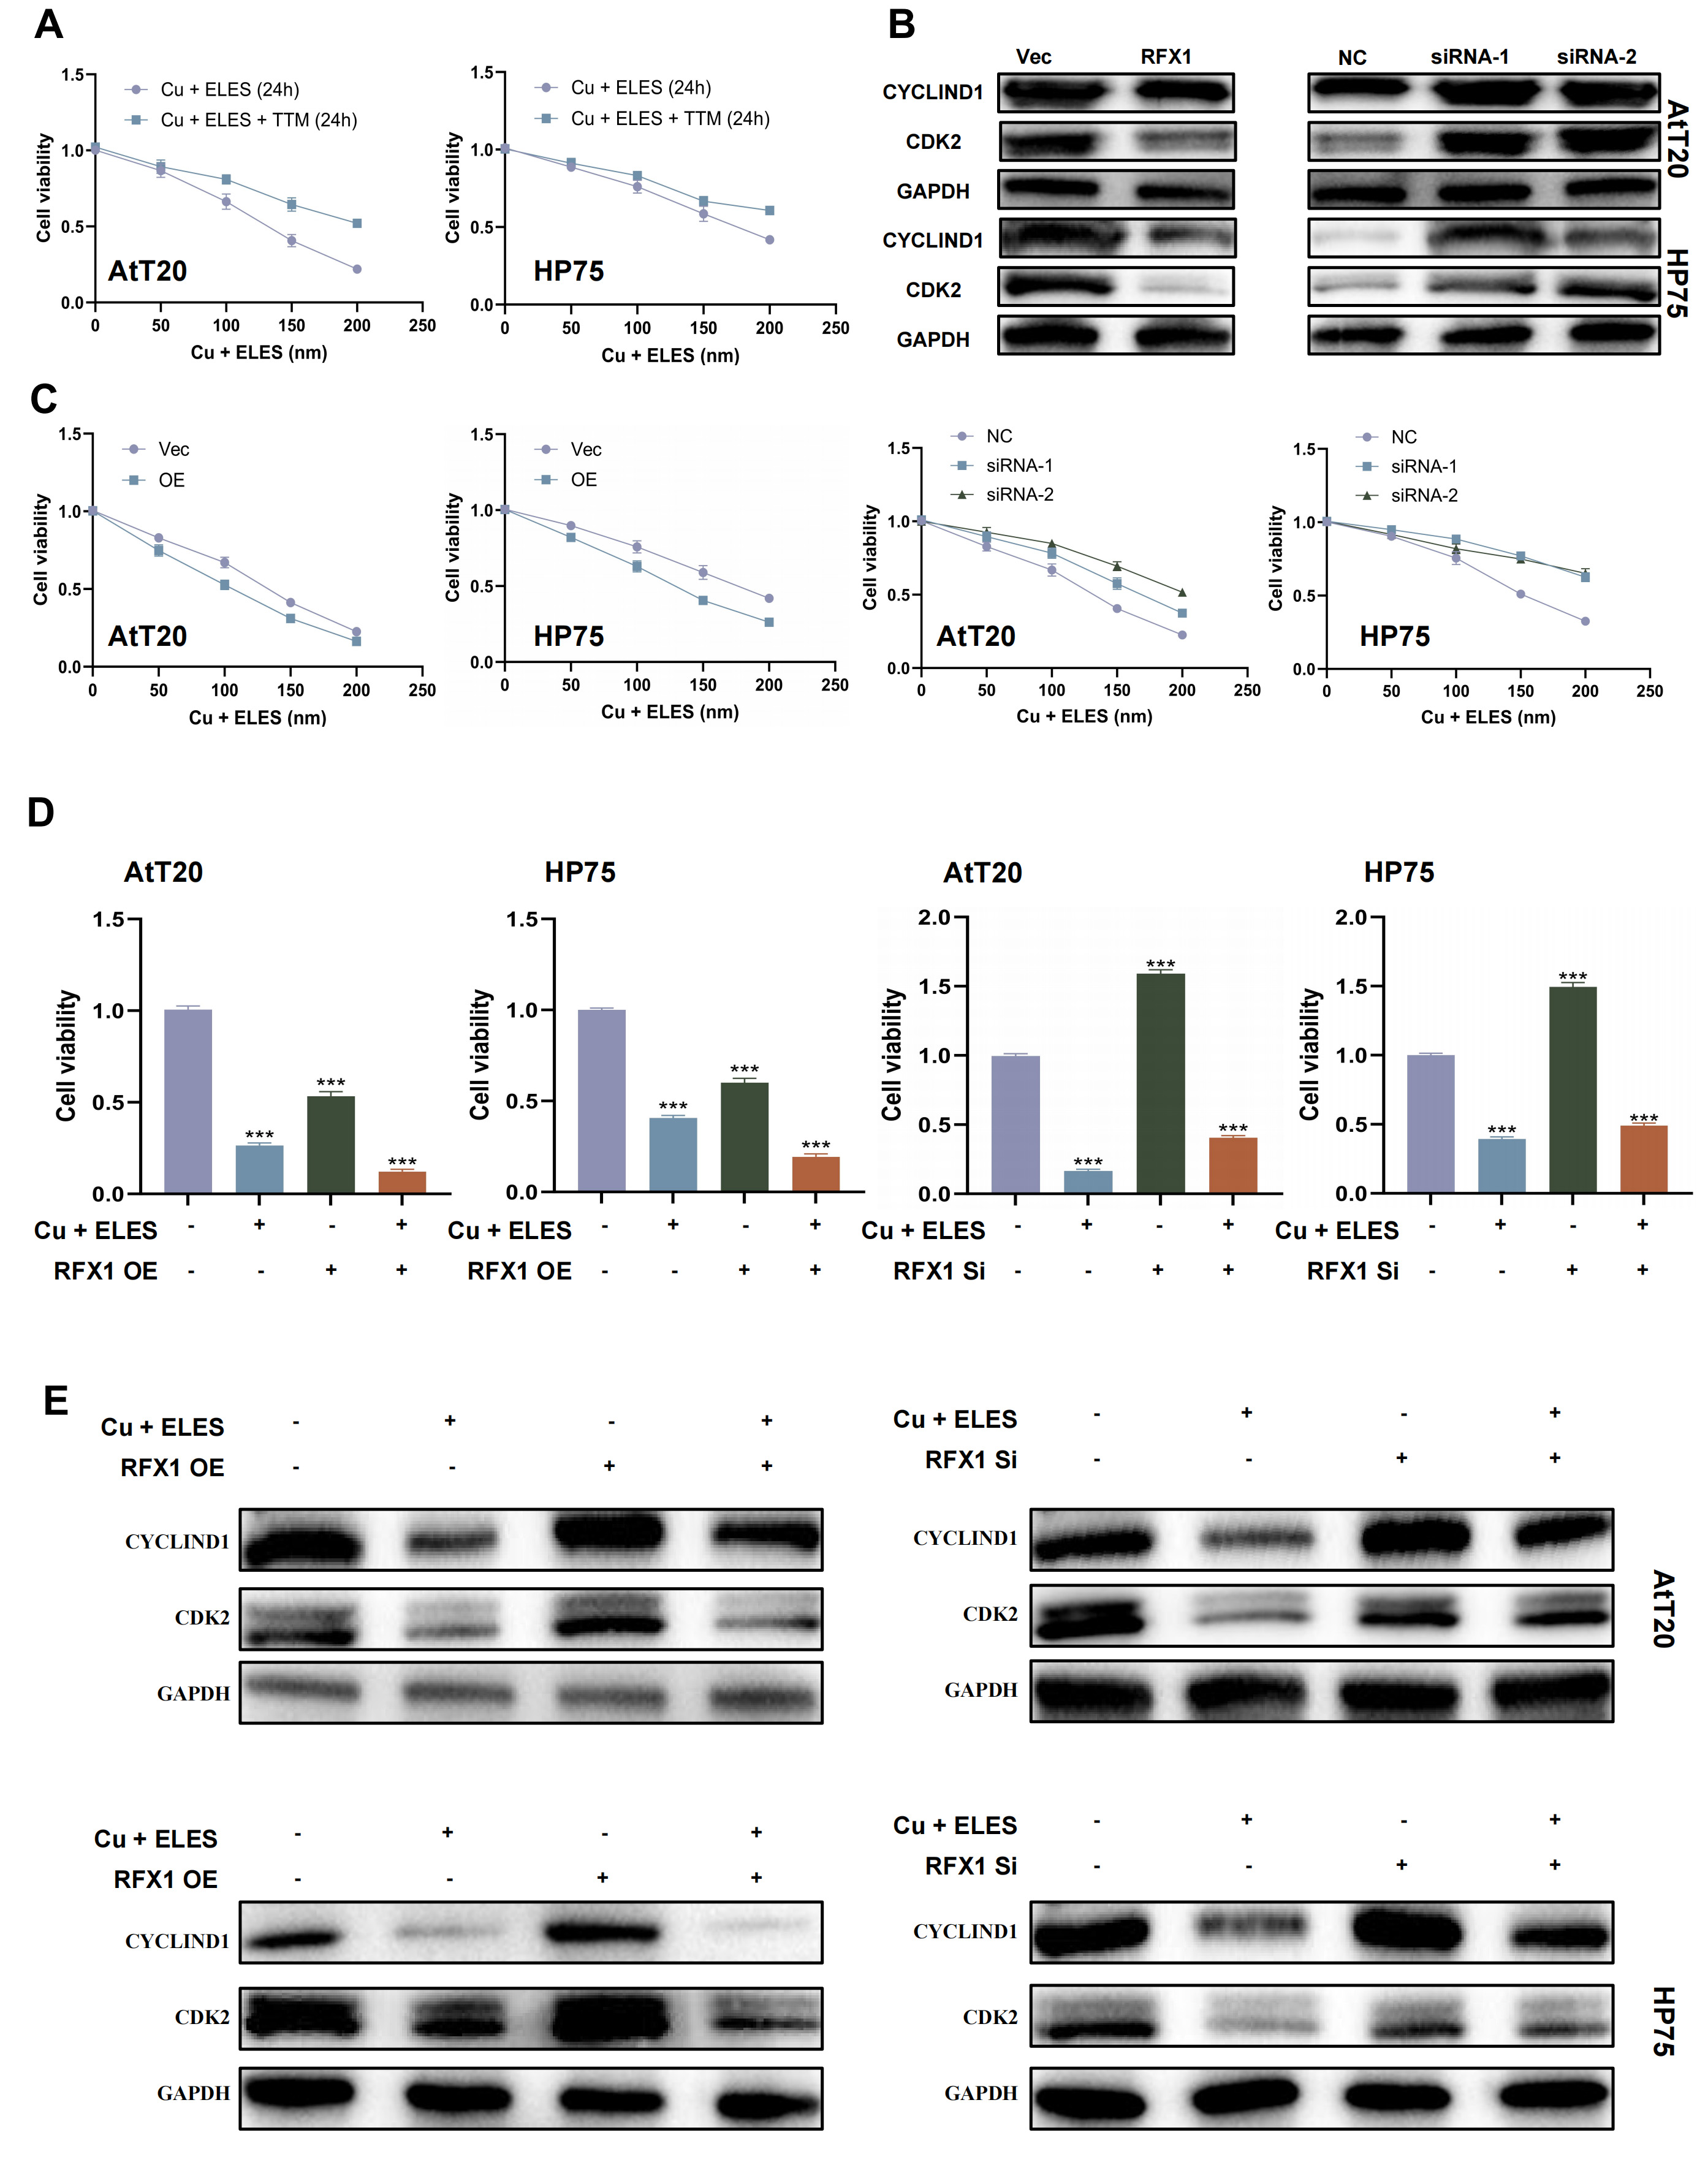 Fig. 4.
RFX1 overexpression enhances cuproptosis in PitNET cells. (A)
The inhibitory effect of ELES-Cu on PitNET viability was dose-dependent, and this
effect was reversible by tetrathiomolybdate (TTM) treatment. (B) PitNET cell
viability decreased in a dose-dependent manner after ELES-Cu treatment. Restoring
RFX1 expression promoted cuproptosis, whereas knocking down RFX1 inhibited
cuproptosis. (C) Western blot analysis of CYCLIND1 and CDK2 in PitNET cells
treated with ELES-Cu for 24 h, with or without RFX1 overexpression or knockdown.
(D) Comparison of PitNET cell viability with or without ELES-Cu treatment for 24
h, and with or without RFX1 overexpression or knockdown. (E) Western blot
analysis of CYCLIND1 and CDK2 in PitNET cells with or without ELES-Cu treatment,
and with or without RFX1 overexpression or knockdown. ***p
We also investigated how RFX1 regulates cuproptosis. Our results showed that cells with more RFX1 were more sensitive to Elesclomol-Cu and had lower cell viability. But, cells with low RFX1 survived better when exposed to copper (Fig. 4C). Western blot tests for CYCLIND1 and CDK2 also showed changes in these cell cycle proteins (Fig. 4B, Supplementary Material-original images of western blot).
When we used the same dose of Elesclomol-Cu, the cells with more RFX1 had more cell death. In contrast, cells with RFX1 knockdown had less cell death than the control group (Fig. 4D). Western blot data for CYCLIND1 and CDK2 supported these results again (Fig. 4E).
We combined 20,591 cells from normal (n = 7) and PitNET (n = 47) groups. We found 11 clusters, including tumor cells and seven normal subtypes (Fig. 5A). The Uniform Manifold Approximation and Projection (UMAP) plot showed clear groups for tumor and normal cells (Fig. 5A, right). Tumor clusters mostly came from PitNET patients, while normal clusters came from controls (Fig. 5B). Marker analysis confirmed the cell types, such as POU1F1 for tumor cells and POMC for normal cells (Fig. 5C).
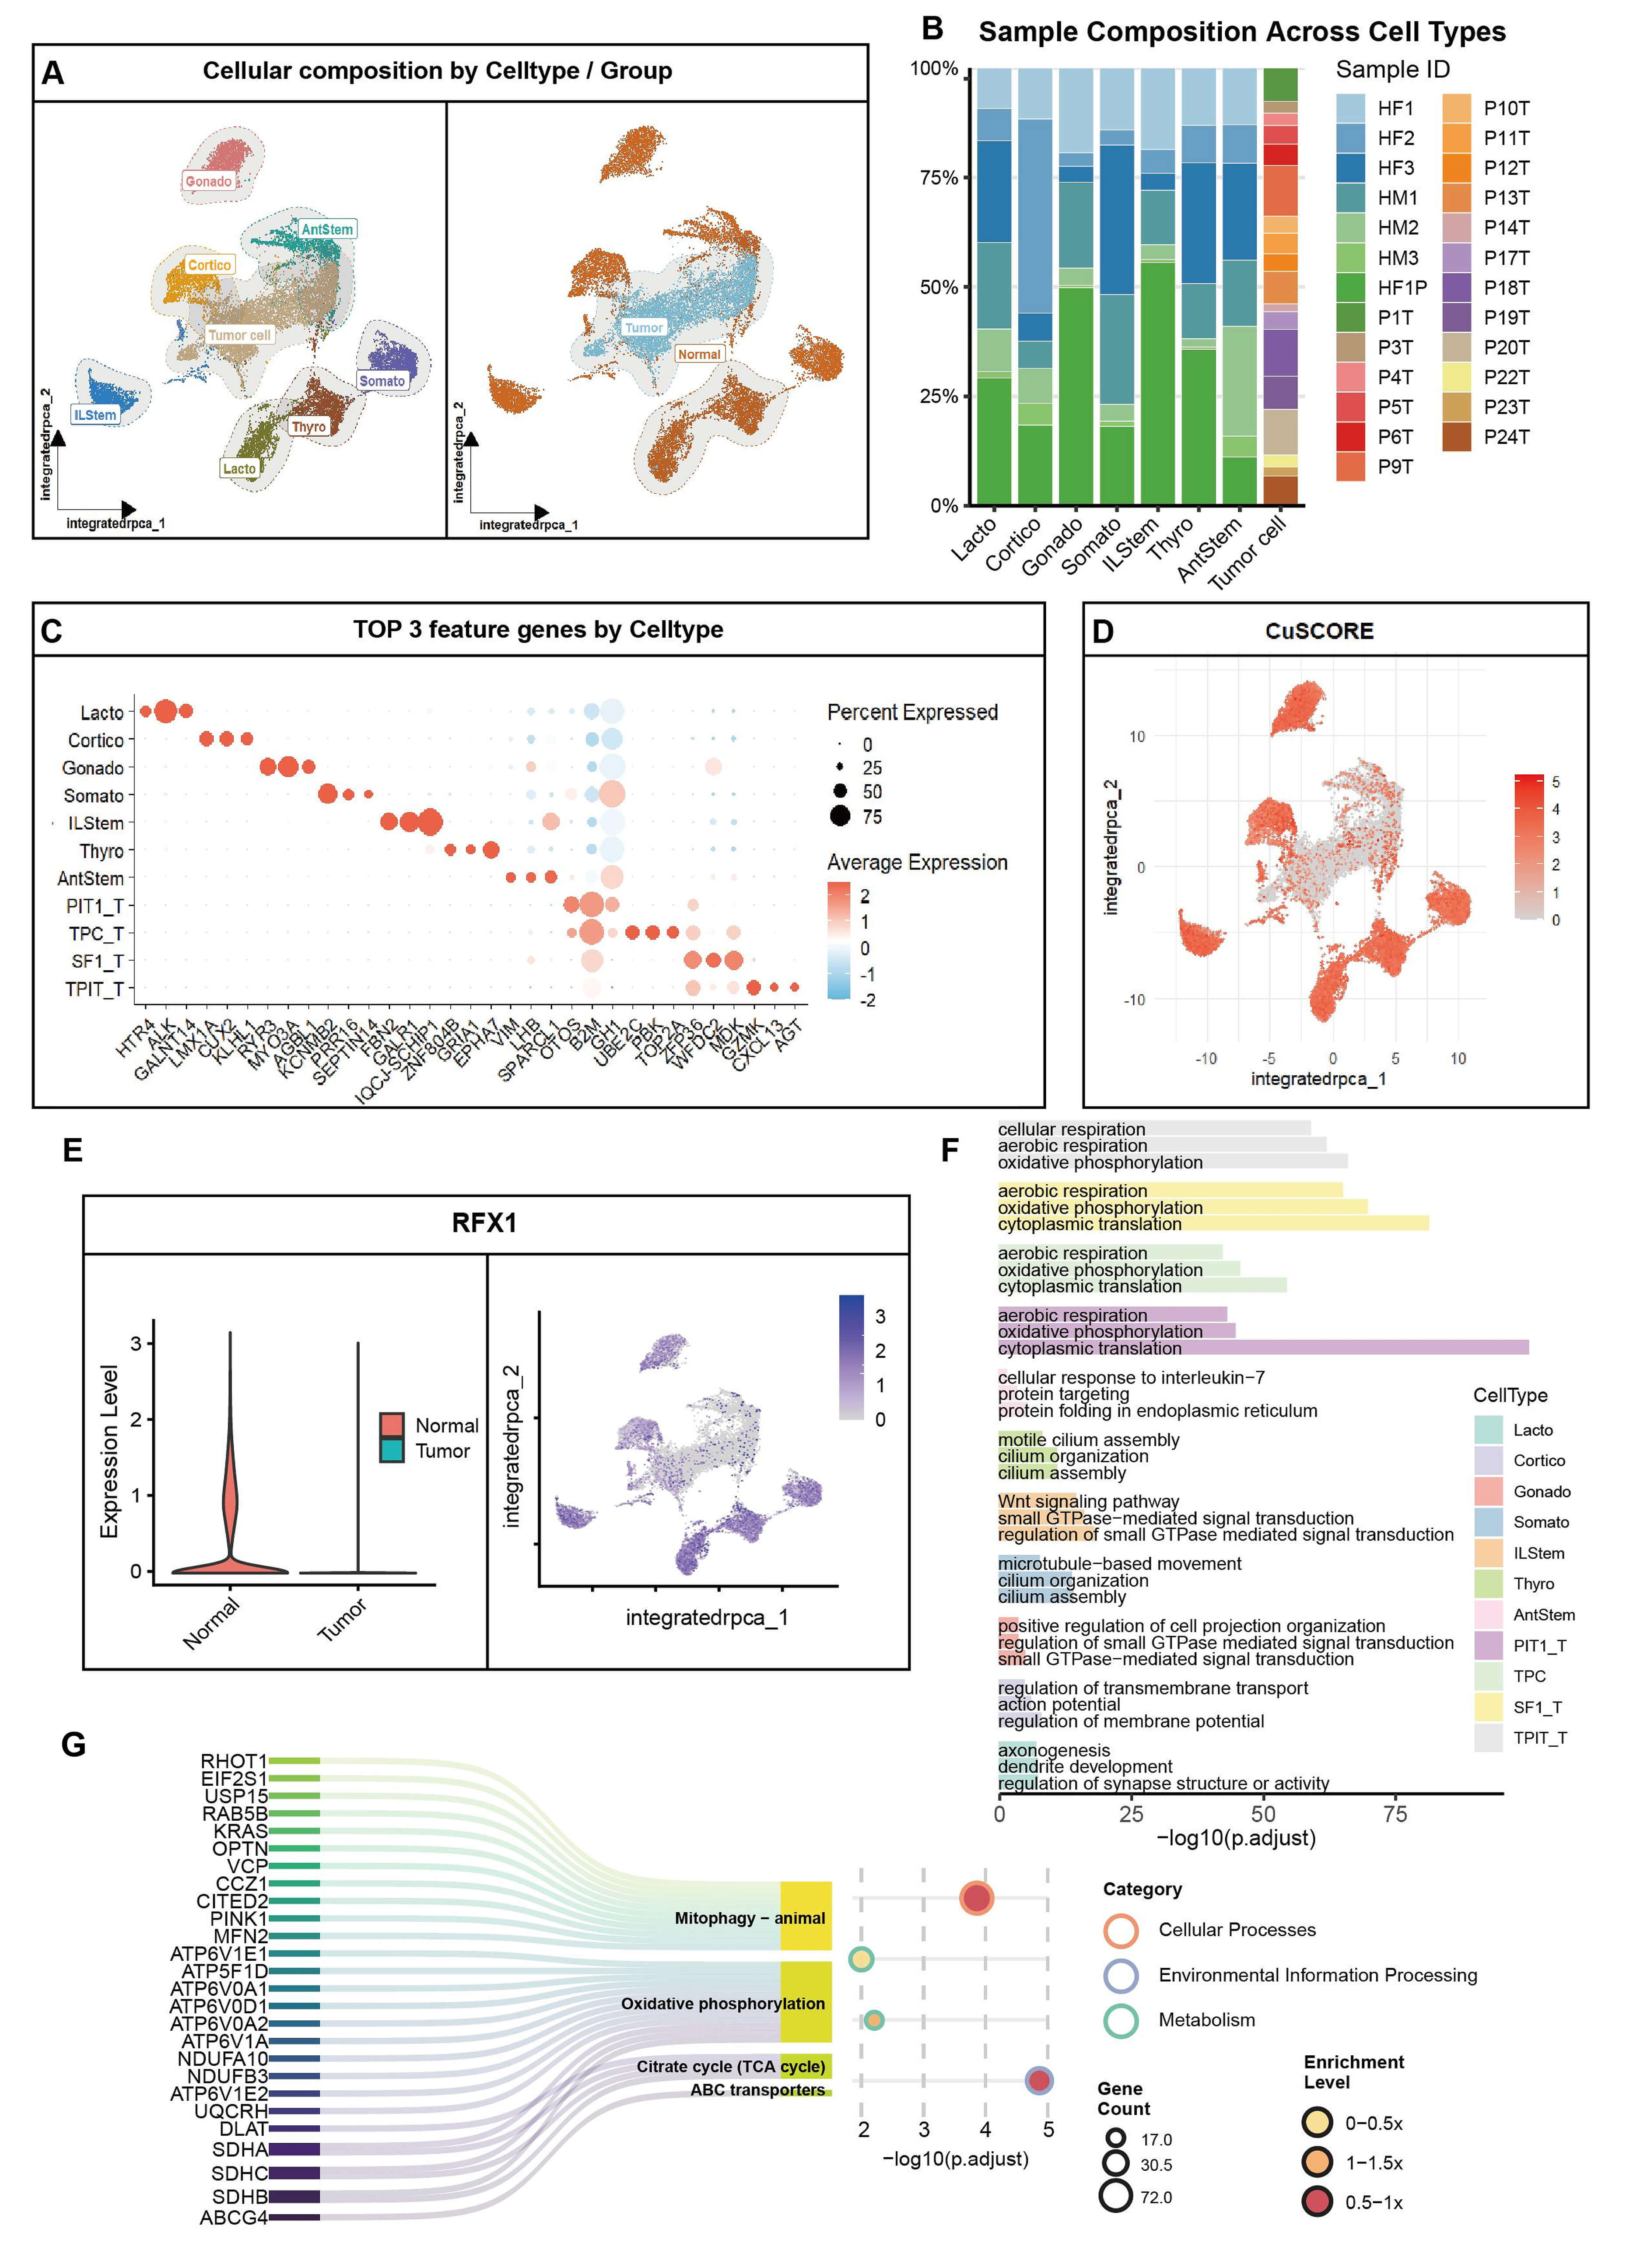 Fig. 5.
Integrated single-cell profiling links RFX1 loss to cuproptosis dysregulation in PitNET. (A) Uniform Manifold Approximation and Projection (UMAP) plots: Left, cell type annotation (11 clusters); Right, tumor/normal origin. (B) Stacked bar plot showing sample source proportions across clusters. (C) Dot plot displaying top 3 marker genes per cluster. Tumor cells unified as “Tumor cell”. (D) Violin plots of cuproptosis scores across clusters. (E) Left: Violin plot comparing RFX1 expression (normal vs. tumor); Right: UMAP feature plot of RFX1. (F) Enriched pathways for top 3 markers per cluster (GO/KEGG). (G) Enrichment results for RFX1-correlated genes in normal cells, highlighting mitochondrial metabolism pathways.
We calculated cuproptosis scores using 19 genes. The scores were lower in tumor clusters than in normal cells (Fig. 5C,D). RFX1 is a transcription factor linked to mitochondrial metabolism. It was almost absent in tumor cells but high in normal cells (Fig. 5E). Feature plots showed RFX1 was mainly in normal clusters (Fig. 5E, right). Multiplex immunofluorescence on clinical samples showed that RFX1 protein levels were low when Topoisomerase II alpha (TOP2A) and marker of proliferation Ki-67 (Ki-67) were high (Supplementary Fig. 4C). In normal cells, we found 98 genes linked to RFX1. These genes are involved in mitophagy, the TCA cycle, and oxidative phosphorylation (Fig. 5F). Pathway enrichment showed that RFX1-linked genes in normal cells relate to mitochondrial autophagy and ATP-Binding Cassette (ABC) transporters (Fig. 5G). These processes are part of copper balance and cell death.
This study systematically elucidates the pivotal role of CRGs in the pathogenesis of PitNETs. By integrating single-cell transcriptomic profiling, bulk RNA sequencing, and machine-learning algorithms, we have delineated the molecular landscape of invasive PitNETs and established RFX1 as a central regulator of cuproptosis and tumor suppression.
The identification of the TPC population at the single-cell level represents a significant advancement in understanding the cellular hierarchy of PitNETs. We interpret these tumor proliferating cells (TPCs) as the proliferative engine driving tumor progression and invasiveness. In contextualizing this finding with existing research, it is important to distinguish TPCs from the established SOX2+ pituitary stem-like cells [19, 20]. While SOX2+ cells are often associated with a quiescent or slow-cycling state, our identified TPC population exhibits high mitotic activity and specialized metabolic signatures. We propose that TPCs represent a unique transitional state of high metabolic plasticity—bridging the gap between undifferentiated stemness and rapid proliferation. This plasticity likely affords a survival advantage within the nutrient-deprived tumor microenvironment, potentially serving as the primary driver of therapy resistance and post-surgical recurrence in aggressive PitNET subtypes [21, 22, 23].
A cornerstone of this research is the identified downregulation of RFX1 in invasive PitNETs and its mechanistic link to suppressed cuproptosis. While RFX1 has been documented as a tumor suppressor in other malignancies, such as glioma, where it primarily regulates the cell cycle, our study expands its functional repertoire to include the maintenance of mitochondrial homeostasis [24, 25, 26, 27, 28]. We interpret the downregulation of RFX1 as a critical metabolic “switch”. In non-invasive PitNET cells, robust RFX1 levels maintain active mitochondrial metabolism, rendering cells acutely sensitive to copper-induced proteotoxic stress—the hallmark of cuproptosis [29]. Conversely, in invasive PitNETs, the suppression of RFX1 triggers a metabolic rewiring akin to a “Warburg-like” adaptation. By dampening mitochondrial activity, invasive cells effectively bypass cuproptosis-mediated cell death, allowing them to survive under elevated copper levels while sustaining the high energetic demands required for aggressive infiltration into surrounding structures.
Our findings demonstrate that CRG-based molecular subtyping reveals distinct immune landscapes. Cluster 1, characterized by increased CD8+ T cell infiltration and enrichment in glycolysis pathways, suggests that cuproptosis may function as a form of immunogenic cell death [30]. The release of damage-associated molecular patterns during copper-induced cellular collapse may reshape the tumor microenvironment, potentially enhancing anti-tumor immunity. This “immune-active” yet dysregulated environment provides a theoretical rationale for combining copper ionophores (e.g., Elesclomol) with immune checkpoint inhibitors as a synergistic strategy for treating invasive PitNETs [31].
However, several limitations remain. First, while our findings are grounded in extensive transcriptomic data, further validation at the proteomic level is necessary to confirm the dynamic expression patterns of CRGs [32]. Second, although our integrated single-cell atlas provides high resolution, the bulk transcriptomic datasets utilized for initial screening were derived from retrospective cohorts with a relatively limited sample size, which may impact the statistical power to capture the molecular signatures of rare aggressive PitNET variants. Third, the retrospective nature of the available data precludes the inclusion of prospective longitudinal follow-up, which is essential for establishing the definitive prognostic value of our findings. Furthermore, the direct transcriptional regulatory mechanisms, specifically whether RFX1 directly binds the promoters of core cuproptosis genes like FDX1, require further elucidation through chromatin immunoprecipitation and luciferase assays. Finally, while our study includes in vivo validation in animal models, further investigation in large-scale, multi-center clinical cohorts is essential to confirm the therapeutic relevance and systemic safety of targeting the RFX1-cuproptosis axis in human patients.
This study shows how cuproptosis-related genes change in invasive PitNETs. We investigated how these genes affect tumor growth, immune cells, and molecular types. We found key hub genes and made a model to group patients. Our tests showed that RFX1 stops growth in invasive PitNETs. These results help us understand how PitNETs develop. Also, they suggest that targeting cuproptosis could be a way to treat invasive PitNETs.
Publicly available datasets were analyzed in this study. This data can be found here: https://www.ncbi.nlm.nih.gov/, GSE136781, GSE169498, and GSE260487. Further enquiries can be directed to the corresponding author.
CD, XB, CT, SW, XX, RW, MC and MF contributed to the study conception and design. SY, CP contributed to the bioinformatics analysis, experimental validation, data analysis and drafting the manuscript. All authors contributed to editorial changes in the manuscript. All authors read and approved the final manuscript. All authors have participated sufficiently in the work and agreed to be accountable for all aspects of the work.
All animal experiments were approved by the Animal Ethics Committee of Peking Union Medical College Hospital (Ethics approval number: XHDW-2023-066). All animal housing, care, and experimental procedures were strictly conducted in compliance with the national Guidelines for the Care and Use of Laboratory Animals and the institutional animal welfare regulations. For euthanasia, mice were deeply anesthetized via an overdose of sodium pentobarbital, followed by cervical dislocation to achieve painless and humane euthanasia prior to tissue harvesting.
We show gratitude for the authors who provided the GEO public datasets.
This work was supported by the Guizhou Provincial Science and Technology Support Program (Qiankehe Support [2021] General 452), the CAMS Innovation Fund for Medical Sciences (No. CIFMS 2021-I2M-1-003), the National High Level Hospital Clinical Research Funding (No. 2022-PUMCH-C-012), Non-profit Central Research Institute Fund of Chinese Academy of Medical Sciences (2020-JKCS-021).
The authors declare no conflicts of interest.
Supplementary material associated with this article can be found, in the online version, at https://doi.org/10.31083/JIN49669.
References
Publisher’s Note: IMR Press stays neutral with regard to jurisdictional claims in published maps and institutional affiliations.