


 , Yan Liu 3, Yan Yu 1,2,*
1 College of Animal Science and Veterinary Medicine, Henan Institute of Science and Technology, 453003 Xinxiang, Henan, China
2 Henan International Joint Laboratory of Animal Health Breeding and Disease Prevention and Control, Henan Institute of Science and Technology, 453003 Xinxiang, Henan, China
3 Emergency Department, The 83rd Army Group Hospital of the Chinese People’s Liberation Army, 453003 Xinxiang, Henan, China
Abstract
Diabetic encephalopathy is a prevalent complication of diabetes mellitus, which is primarily characterized by hippocampal injury and blood-brain barrier (BBB) dysfunction. This study investigates the neuroprotective effect of tea polyphenols (TP) on hippocampal tissue in early-stage diabetic mice.
Sixty BALB/c mice were randomly assigned to the control group (C), the diabetes group (T0), and the TP-treated group (T1). After successful model induction, mice in group T1 received TP intragastrically (100 mg/kg/d). Hematoxylin and eosin (H&E), toluidine blue, and Hoechst 33342 staining, combined with polymerase chain reaction (PCR) and enzyme-linked immunosorbent assay (ELISA), were used to assess the effects of TP on hippocampal histology, inflammation and oxidative stress, the advanced glycation end products (AGEs) – Receptor for Advanced Glycation End products (RAGE) pathway, and the expression of key proteins associated with the BBB.
The contents of AGEs, RAGE, NF-κB, P-glycoprotein (P38), and oxidative stress factors in group T1 were lower than those in group T0 at 7, 14, and 21 days (p < 0.05). At the same time points, the mRNA expression levels of inflammatory factors in group T1 were lower than those in group T0 (p < 0.05). Moreover, compared with group T0, both P-glycoprotein (P-gp) protein expression and glucose transporters (Glut1) mRNA expression increased in group T1 (p < 0.05). The mRNA expression levels of key BBB-related molecules in group T1 also increased to varying degrees (p < 0.05). Histopathological analysis showed marked improvement in the hippocampal architecture of group T1 compared with group T0. Moreover, the expression levels of P38, NF-κB, IL-6, TNF-α, ROS, and Glut1 were significantly or highly significantly positively correlated with RAGE protein levels (p < 0.05 or p < 0.01).
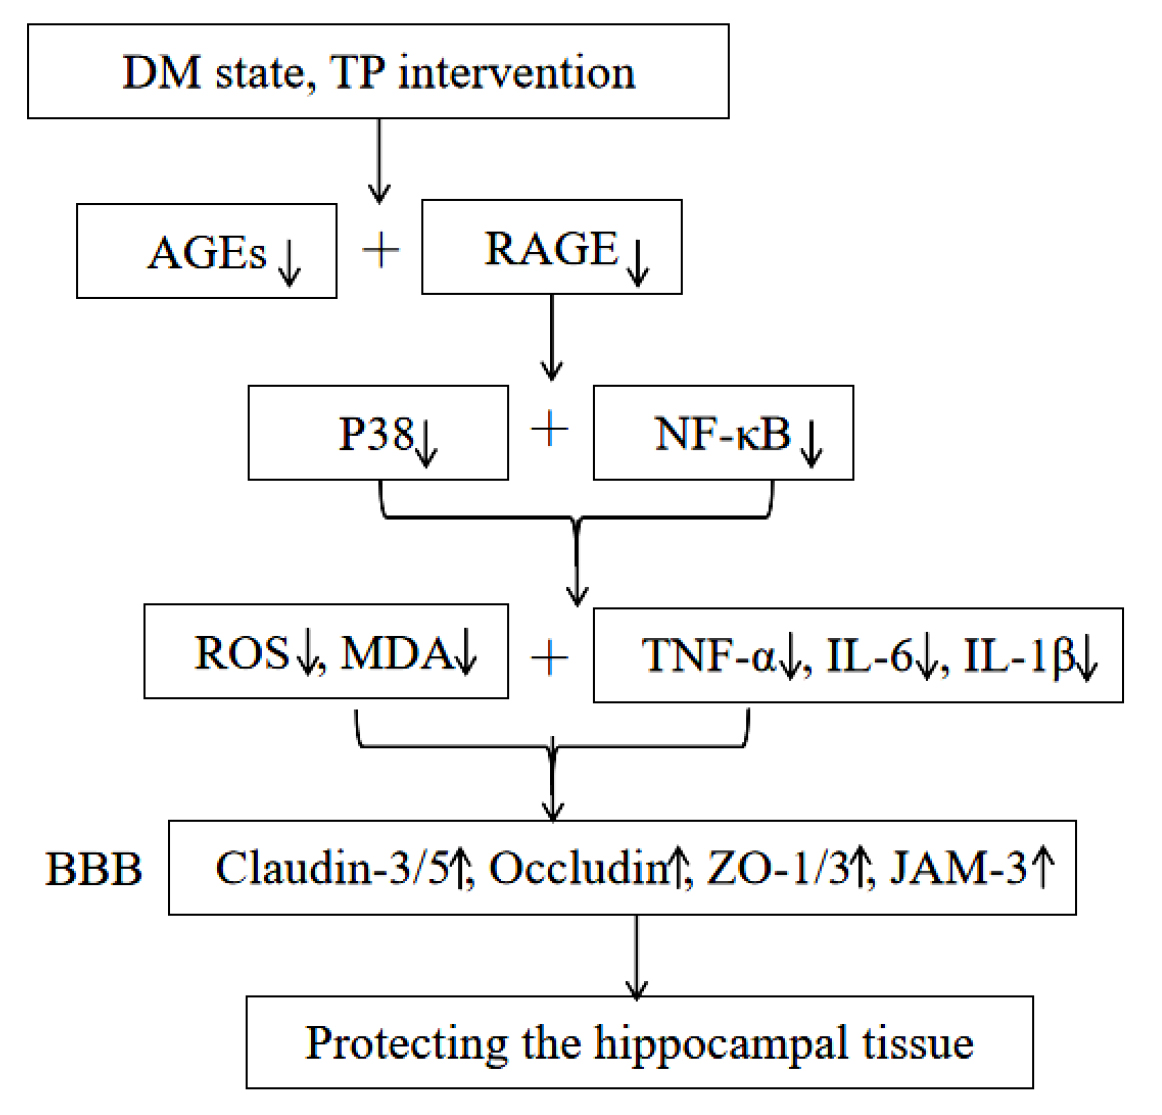
TP enhanced BBB structural integrity by inhibiting the AGEs–RAGE pathway, thereby attenuating hippocampal tissue damage.
Graphical Abstract
Keywords
- tea polyphenols
- hippocampus
- blood–brain barrier
- AGEs
- RAGE
Diabetes mellitus (DM) is a chronic metabolic disease and is now one of the major threats to human health. By 2045, an estimated 693 million people worldwide are projected to have diabetes. As blood glucose levels rise, cellular glucose tolerance reaches a threshold. Excessive hyperglycaemia damages neural tissues and disrupts microvascular integrity by triggering oxidative stress, activating inflammatory responses, and initiating coagulation mechanisms, leading to multisystem injury and complications [1]. Current research indicates that most diabetic patients exhibit structural damage to the hippocampus and the blood–brain barrier (BBB), leading to neurocognitive impairment and neurological disorders [2].
The BBB is a highly selective semipermeable structural and functional barrier
formed by continuous capillary endothelial cells (ECs) connected through tight
junctions (TJs). It separates the central nervous system (CNS) from peripheral
blood circulation and prevents potentially harmful circulating substances from
entering the brain [3]. As a critical structural component of the BBB,
dysregulation of TJ proteins contributes to BBB disruption. When TJs are damaged,
the permeability of the BBB increases, immune cell extravasation rises, and
molecular and ion flux across the barrier becomes dysregulated. TJs are anchored
to the actin cytoskeleton through transmembrane proteins—including claudins,
occludin, and junctional adhesion molecules (JAMs)—which interact with
cytoplasmic scaffolding proteins of the zonula occludens (ZO) family [4].
Claudins—particularly claudin-5 and claudin-3, form the primary seal of TJs by
homophilic interactions with identical claudins on adjacent ECs and determine
paracellular permeability and charge selectivity [5, 6]. Occludin is highly
enriched in CNS ECs and is a major transmembrane protein of TJs. Its carboxyl
terminus binds the PDZ domain of ZO, influencing BBB integrity, permeability, and
intracellular signalling [7]. JAM is a cell adhesion molecule that enhances
endothelial barrier function, regulates leukocyte adhesion, and modulates
paracellular permeability. As a cytoskeletal linker, the ZO complex assists
claudin, occludin, and JAM in anchoring to the cytoskeleton [8]. A previous study
showed that several key BBB proteins in the hippocampus of early DM mice are
altered [9]. Moreover, P-glycoprotein (P-gp) is an ATP-binding cassette (ABC)
transporter with efflux activity in brain ECs. Under hyperglycaemic conditions,
immortalised human brain microvascular ECs significantly downregulated ZO-1
within 24 h and showed upregulation of P-gp membrane expression [10]. Glucose
transporters (Glut) are a key family of membrane proteins that regulate
intracellular and extracellular glucose balance, with Glut1 being essential for
glucose metabolism. Deficiency of Glut1 disrupts glucose transport across the
BBB, leading to persistent brain energy insufficiency and neurological disease.
Serum levels of major inflammatory markers in type 2 diabetes mellitus (T2DM),
including IL-1
Advanced glycation end products (AGEs) are generated through excessive binding
of sugars to proteins. They are widely distributed in tissues and exert
pathophysiological effects primarily by binding to the receptor for advanced
glycation end products (RAGE) on cell membranes. RAGE is a polyligand member of
the immunoglobulin superfamily. AGE–RAGE interaction activates the AGEs–RAGE
signalling cascade and downstream pathways, including P38 mitogen-activated
protein kinase (P38 MAPK), nuclear factor-
Tea polyphenols (TP) are natural antioxidants that inhibit the oxidation of unsaturated fatty acids and exert anti-inflammatory, lipid-lowering, glucose-lowering, and cardiocerebrovascular protective effects. Epigallocatechin gallate (EGCG), a principal component of TP, increases the expression of survival markers in adipose-derived stem cells isolated from diabetic rats under high-glucose conditions and decreases serum oxidative stress [14]. Green tea also prevents hippocampal neuronal apoptosis in diabetic rats by inhibiting the Jun N-terminal kinase/Myosin light-chain kinase (JNK/MLCK) pathway and improves cognitive function [15].
Current evidence indicates that AGEs and RAGE are markedly elevated in the brain tissues of diabetic mice [16]. AGEs accumulate through non-enzymatic glycosylation and, upon binding RAGE, activate pathways such as JNK/P38 MAPK, contributing to progressive neural damage [17, 18] and offering a potential molecular target for intervention. Although TP has shown beneficial effects in diabetic neuropathy, its mechanism remains incompletely described. In particular, whether TP modulates the hippocampal structure in diabetic mice by regulating the AGEs–RAGE signalling pathway has not been systematically examined. Therefore, this study used hematoxylin and eosin (H&E), toluidine blue, and Hoechst 33342 staining, combined with polymerase chain reaction (PCR) and enzyme-linked immunosorbent assay (ELISA), to assess the effects of TP on key proteins in the AGEs–RAGE pathway, inflammation and oxidative stress, and BBB-related structural proteins in the hippocampus of early-stage diabetic mice. These findings provide a mechanistic foundation for the protective role of TP in neurological dysfunction in early-stage diabetes.
Sixty BALB/c mice were housed at 25
The criteria for successful establishment of a diabetic mouse model are as follows: (1) fasting blood glucose (FBG) concentration exceeding 11.1 mmol/L; and (2) manifestation of classic diabetic symptoms—including polydipsia, polyphagia, and polyuria. These criteria are uniformly evaluated on the 7th day after the intervention of high-sugar and high-fat diet feeding combined with STZ intraperitoneal injection. Prior to assessment, mice are fasted for 12–16 hours with unrestricted access to water. Model establishment is deemed successful if both criteria are concurrently fulfilled.
After successful modelling, all mice were provided normal feed and water. Mice in group T1 received TP solution by gavage (100 mg/kg/d, once daily), whereas groups C and T0 received the same dose of saline. Administration continued for 21 days. FBG was measured every 3–4 days. All animal procedures were approved by the Scientific Ethics Committee of Henan Institute of Science (License No. LLSC2021034).
The initial body weight of mice was recorded before modelling. Body weight in each group was measured on days 1, 7, 14 and 21, and average values were calculated to document weight changes.
Water intake on the first day of the experiment was recorded. Daily water intake was then measured at a fixed time. On days 7, 14 and 21, the average weekly water intake per mouse was recorded. The calculation formula was:
Average water intake (g/d) = [Total water intake in a week (g) – Remaining water weight on the recorded day (g)] / {[(Time) (d)] × [Number of mice per cage (only)]}.
During the final week of the experiment, bedding wetness was recorded after one day under identical bedding conditions and the same number of mice per cage.
On days 1, 7, 14 and 21, five mice were randomly selected from groups C, T0 and T1, batch execution without repeated measurement. Mice were euthanized with 1% pentobarbital sodium (Cat. No: P3761, Sigma-Aldrich, St. Louis, MO, USA) (40 mg/kg), and hippocampal CA1 region tissues were collected. Half of each sample was fixed in 4% paraformaldehyde (PFA) (Cat. No: MM1504, Shanghai Maokang Biotechnology Co., Ltd., Shanghai, China) for paraffin embedding and H&E, toluidine blue (Cat. No: 2883914, Shanghai Macklin Biochemical Co., Ltd., Shanghai, China), and Hoechst 33342 (Cat. No: AR0039, Wuhan Boster Biological Technology Co., Ltd., Wuhan, Hubei, China) staining. The remaining tissue was stored at –80 °C for PCR and ELISA analysis.
Hippocampal tissue fixed in 4% PFA for 48 h was rinsed in running water,
dehydrated through graded ethanol, cleared in xylene, infiltrated with wax,
embedded, and sectioned at 5 µm thickness. Sections were stained with H&E,
toluidine blue, and Hoechst 33342 (Boster), and observed under a 400
For each group, the number of neurons with nuclear swelling per 100 neurons in
the CA1 region was counted. The neuronal swelling index (%) was calculated as:
(number of swollen neurons/total number of neurons)
In the CA1 region, the number of congested vessels per 30 vessels examined was
recorded. The congestive vascular index (%) was calculated as: (number of
congestive vessels/total number of vessels)
Images of CA1 neurons were captured at 1000
The number of apoptotic cells per 100 cells in the CA1 region was counted,
including ECs, neurons, glial cells, and other cell types. The apoptosis index
(%) was calculated as: (number of apoptotic cells / total number of cells)
Total RNA was extracted from hippocampal tissues of groups C, T0 and T1 on Days
1, 7, 14 and 21, following the manufacturer’s instructions. RNA purity and
concentration were measured, and 1 µg of total RNA was reverse transcribed
into 20 µL cDNA. Real-time PCR was performed, and the mRNA expression
levels of ZO-1, JAM-3, ZO-3, claudin-5, claudin-3, occludin, TNF-
| Forward primer (5′-3′) | Reverse primer (3′-5′) | |
| TATGCTCTCCCTCACGCCATCC | GTCACGCACGATTTCCCTCTCAG | |
| Claudin-3 | TGGCGGCTCTGCTCACCTTAG | GGGCACCAACGGGTTATAGAAATCC |
| Claudin-5 | TGCCTTCCTGGACCACAACATC | GCCAGCACAGATTCATACACCTTG |
| Occludin | TGGCTATGGAGGCGGCTATGG | ACTAAGGAAGCGATGAAGCAGAAGG |
| ZO-1 | AACCCGAAACTGATGCTGTGGATAG | CGCCCTTGGAATGTATGTGGAGAG |
| ZO-3 | ACCACAGAGATGCCAGAAGAGTTTG | GACATCCAGGAGTGCGTGCTTATC |
| JAM-3 | GACTTCTTCCTGCTGCTGCTCTTC | TGGGTTTCGGTTGCTGGATTTGAG |
| Glut1 | GTGACTGGAACACTGGTCCTA | CCAGCCACGTTGCATTGTAG |
| TNF- |
TCACTGGTGCTCCTGGCTCTG | GCTATCCCTCTTCTCCCGGTCAC |
| IL-6 | CTTCTTGGGACTGATGCTGGTGAC | TCTGTTGGGAGTGGTATCCTCTGTG |
| IL-1 |
CACTACAGGCTCCGAGATGAACAAC | TGTCGTTGCTTGGTTCTCCTTGTAC |
qPCR, quantitative Polymerase Chain Reaction; ZO, zonula occludens; JAM, junctional adhesion molecule; Glut1, glucose transporters.
Cryopreserved hippocampal tissue was homogenised in pre-cooled PBS and
centrifuged at 1000
Data were analysed using Prism 8.0 (GraphPad Software, Boston, MA,
USA) and SPSS 23.0 (IBM Corp., Chicago, IL, USA). Results are expressed as mean
Mice in group C remained active, maintained normal diet and water intake, and showed no clinical abnormalities.
Prior to model induction, no significant difference in mean body weight was
observed among the three groups of mice (p
| Group | C | T0 | T1 |
| Prior to model establishment | 23.38 |
23.26 |
23.30 |
| 1 d | 24.18 |
28.60 |
28.70 |
| 7 d | 25.09 |
27.82 |
27.37 |
| 14 d | 26.31 |
25.30 |
26.80 |
| 21 d | 28.06 |
23.26 |
26.55 |
Note: Compared with group C, * indicates p
Water intake in the T0 and T1 groups was significantly elevated relative to the
control (C) group on Days 1, 7, 14, and 21 of the experiment (p
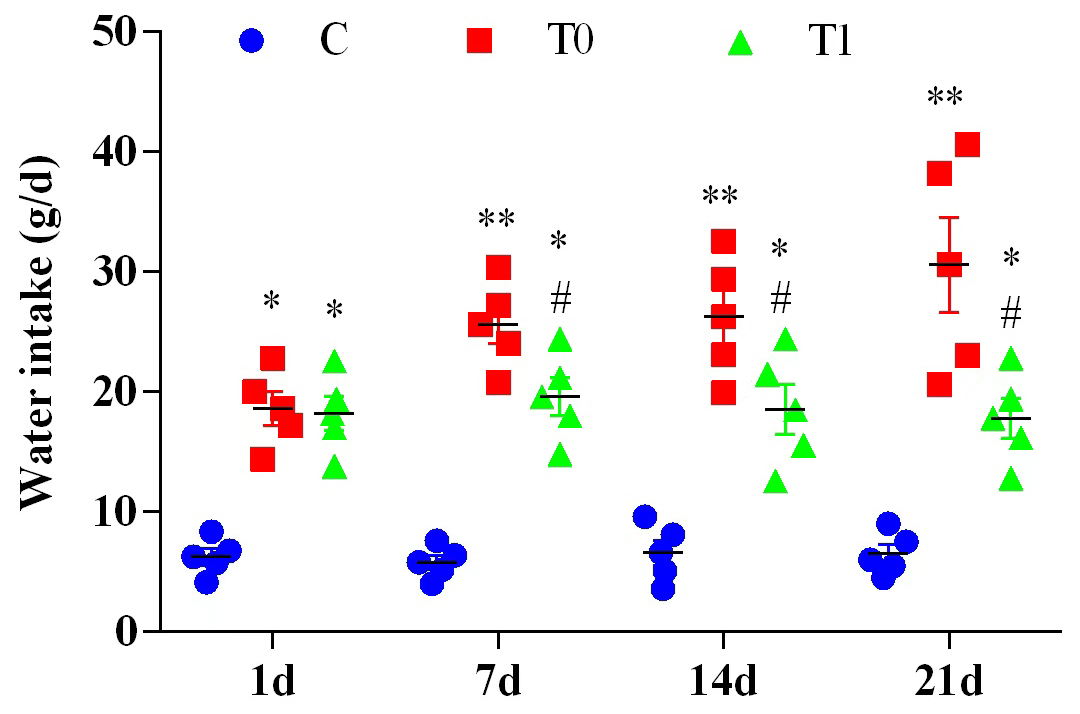 Fig. 1.
Comparison of water intake among group C mice, group T0 mice,
and group T1 mice (n = 20, the initial total sample size of each group). Note: Compared with group C, * indicates p
In addition, as the diabetic model progressed, mice in the T0 group exhibited a marked increase in urine output (Fig. 2) and progressive deterioration of coat condition, characterized by unkempt and damp fur (Fig. 3). In contrast, relative to the T0 group, the T1 group showed significantly reduced urine output (Fig. 2), restoration of fur luster and smoothness, and marked improvement in both physical condition and mental alertness (Fig. 3).
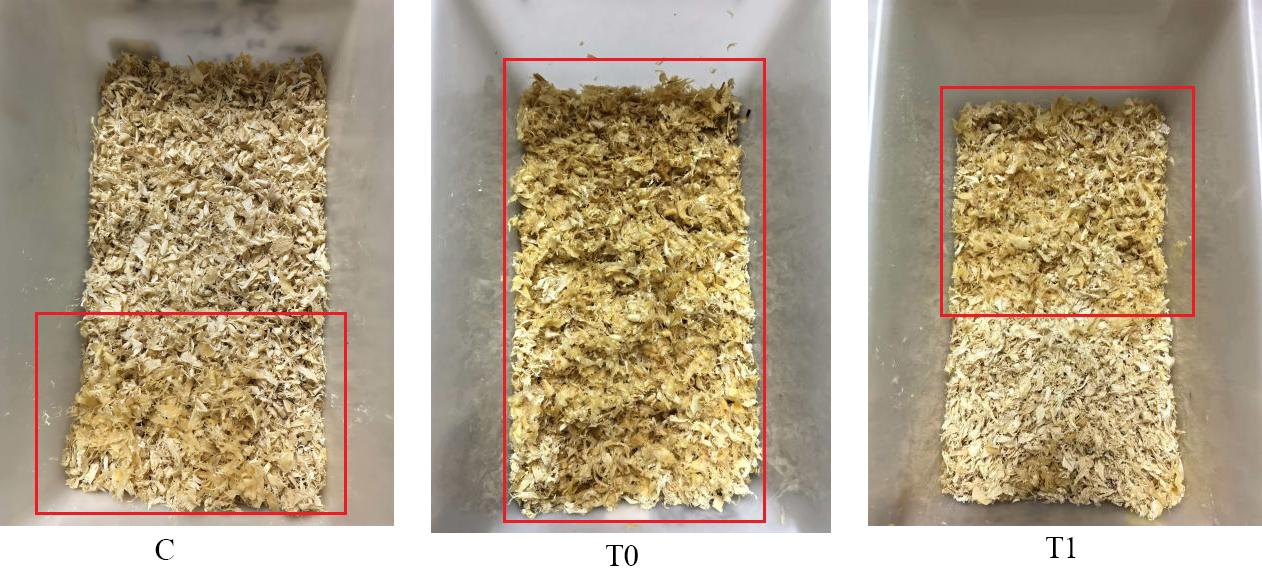 Fig. 2.
The effect of TP on bedding of diabetic mice. Note: Compared with group C, the wet area of bedding in group T0 expanded. Compared with group T0, the wet area of bedding in group T1 decreased. The red box indicates the wet area of the bedding.
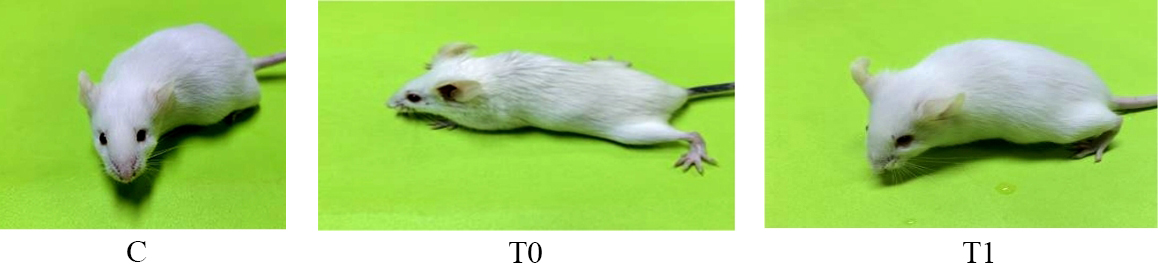 Fig. 3.
Comparison of appearance among group C mice, group T0 mice, and group T1 mice at 21 d.
At 1, 4, 7, 10, 14, 17 and 21 days, the average blood glucose level of group T0
remained significantly higher than that of group C (p
| Groups | 1 d | 4 d | 7 d | 10 d | 14 d | 17 d | 21 d |
| C | 6.22 |
6.80 |
6.70 |
6.80 |
6.52 |
6.55 |
6.18 |
| T0 | 19.20 |
18.66 |
16.15 |
16.38 |
16.12 |
15.30 |
15.18 |
| T1 | 18.28 |
17.41 |
15.66 |
14.16 |
14.05 |
12.26 |
11.60 |
Note: ** indicates the comparison between group C and group T0, **p
Throughout the experiment, AGEs protein expression in groups T0 and T1 increased
significantly compared with group C (p
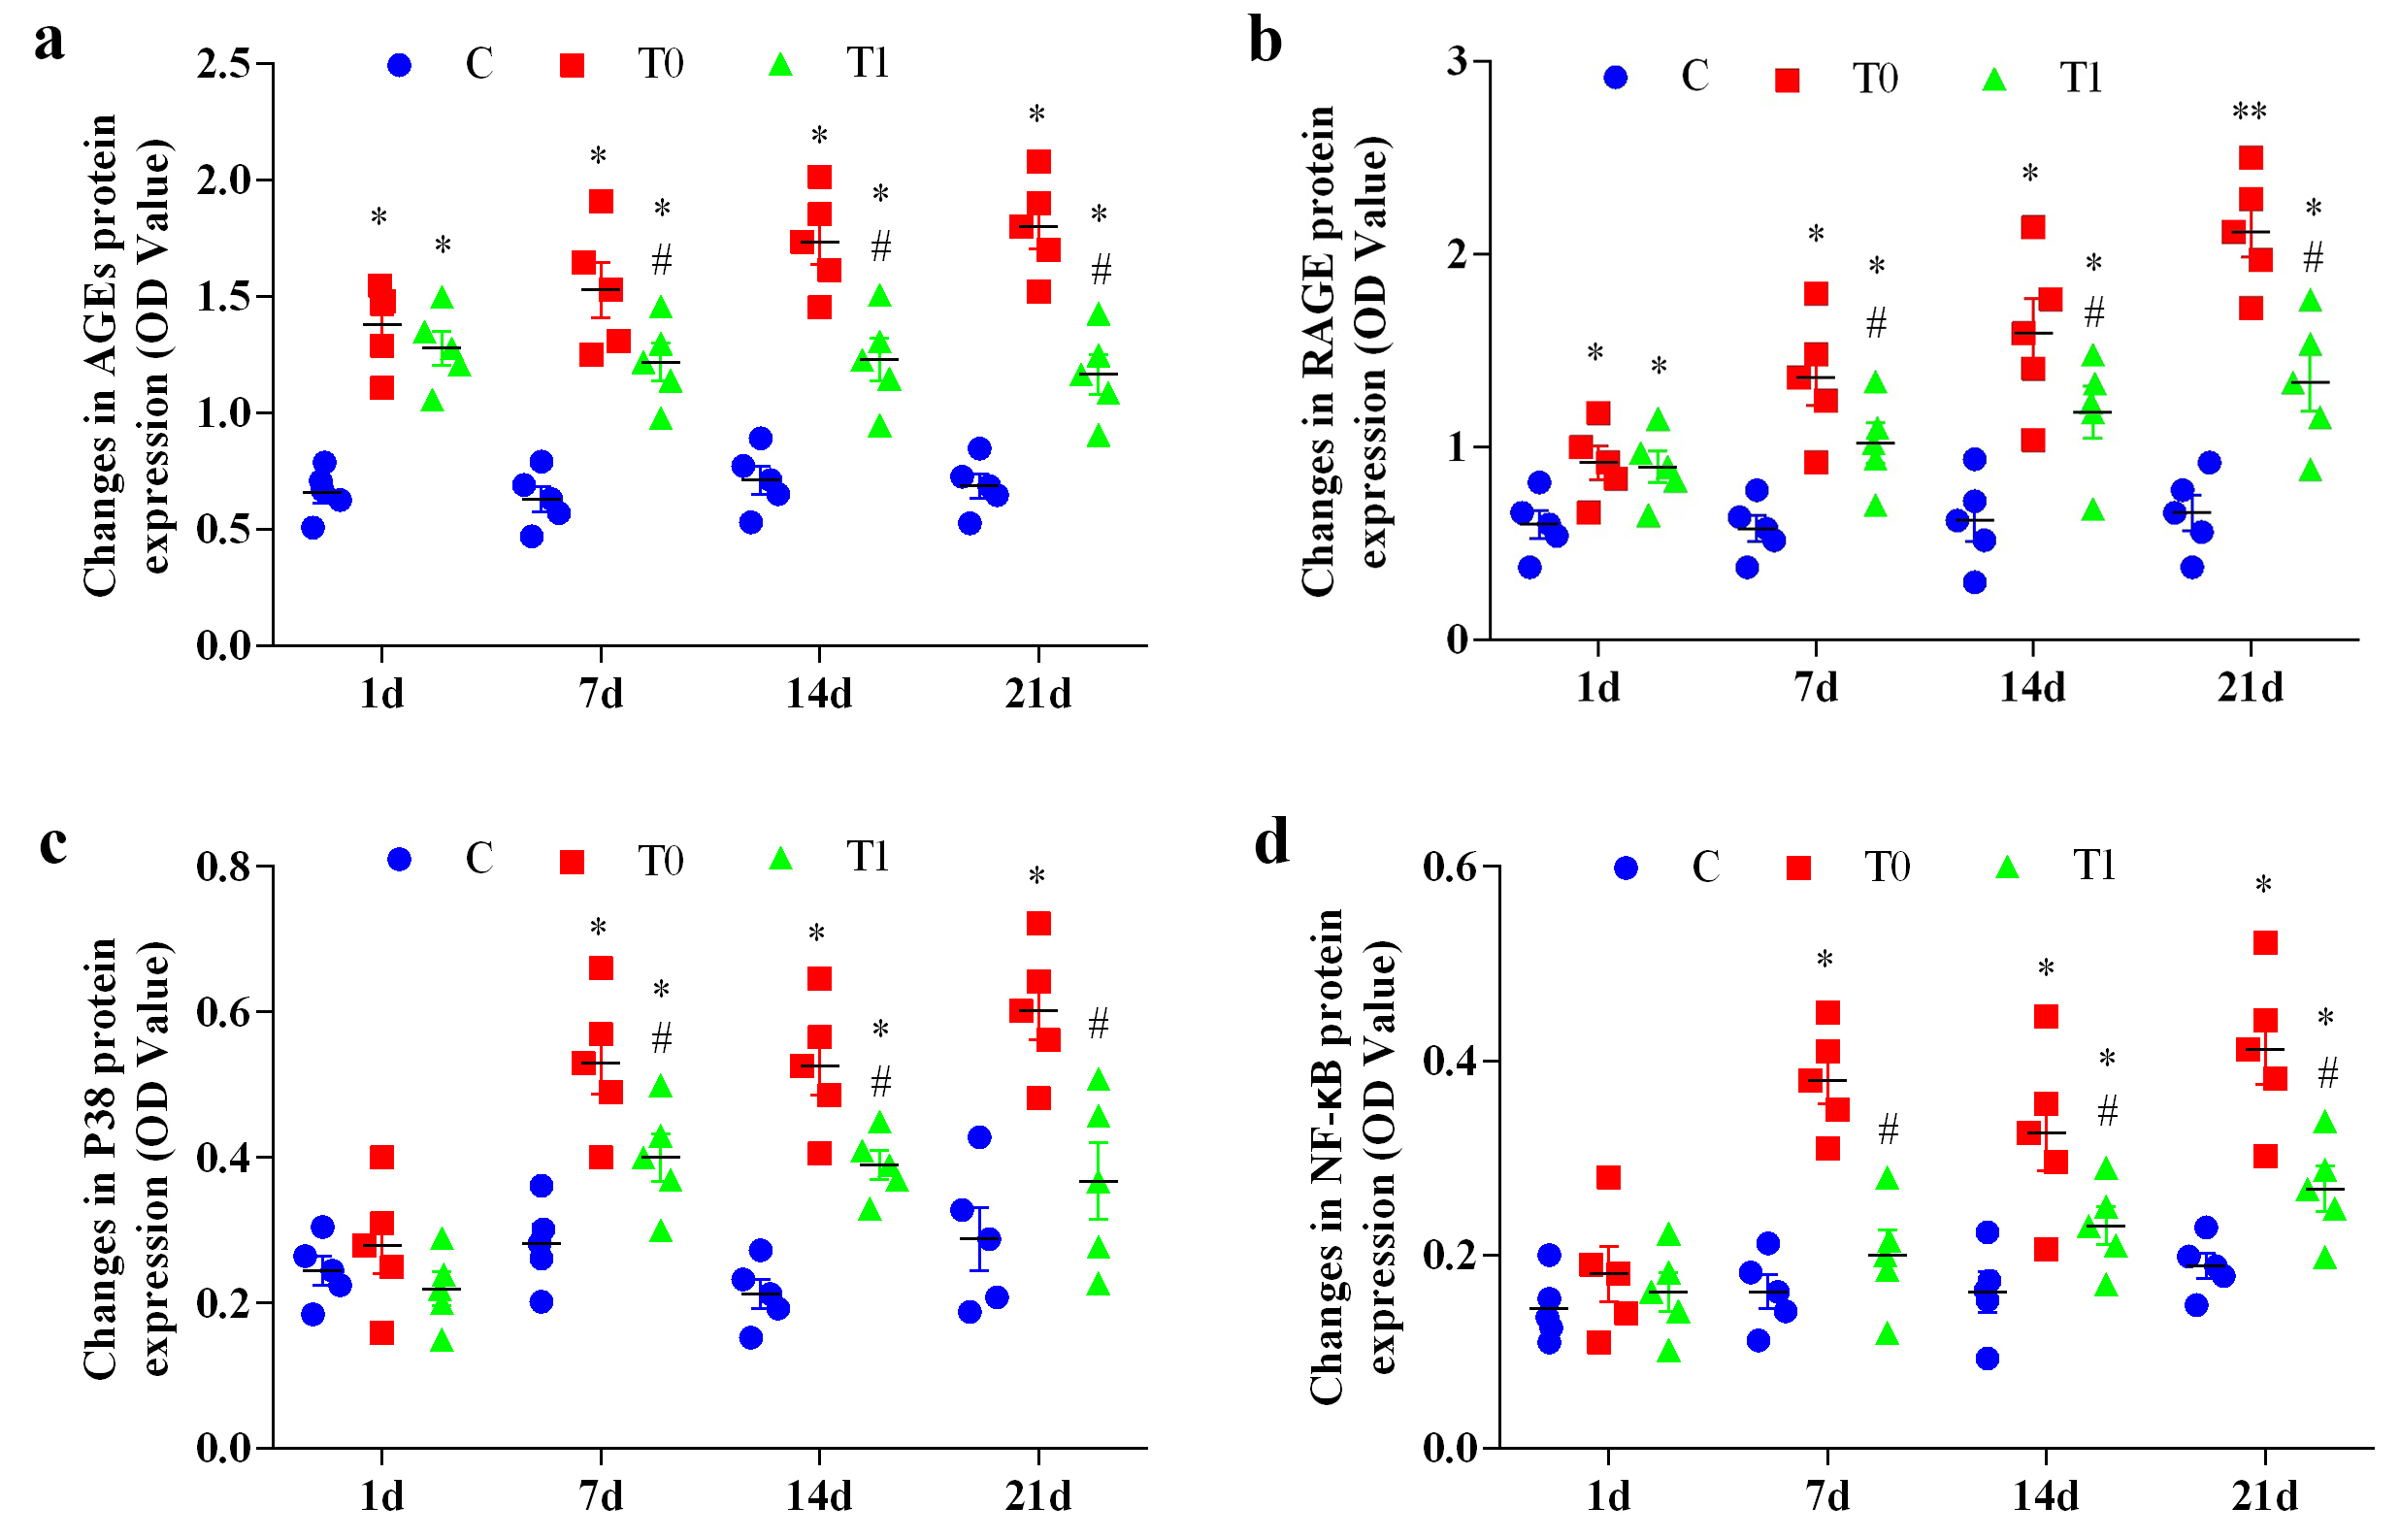 Fig. 4.
The effect of TP on the expression of AGEs, RAGE, P38, and
NF-
RAGE protein expression in groups T0 and T1 increased significantly or highly
significantly at 1, 7, 14 and 21 days compared with group C (p
P38 protein expression increased significantly in group T0 at 7, 14 and 21 days
(p
Activation of NF-
At day 1, TNF-
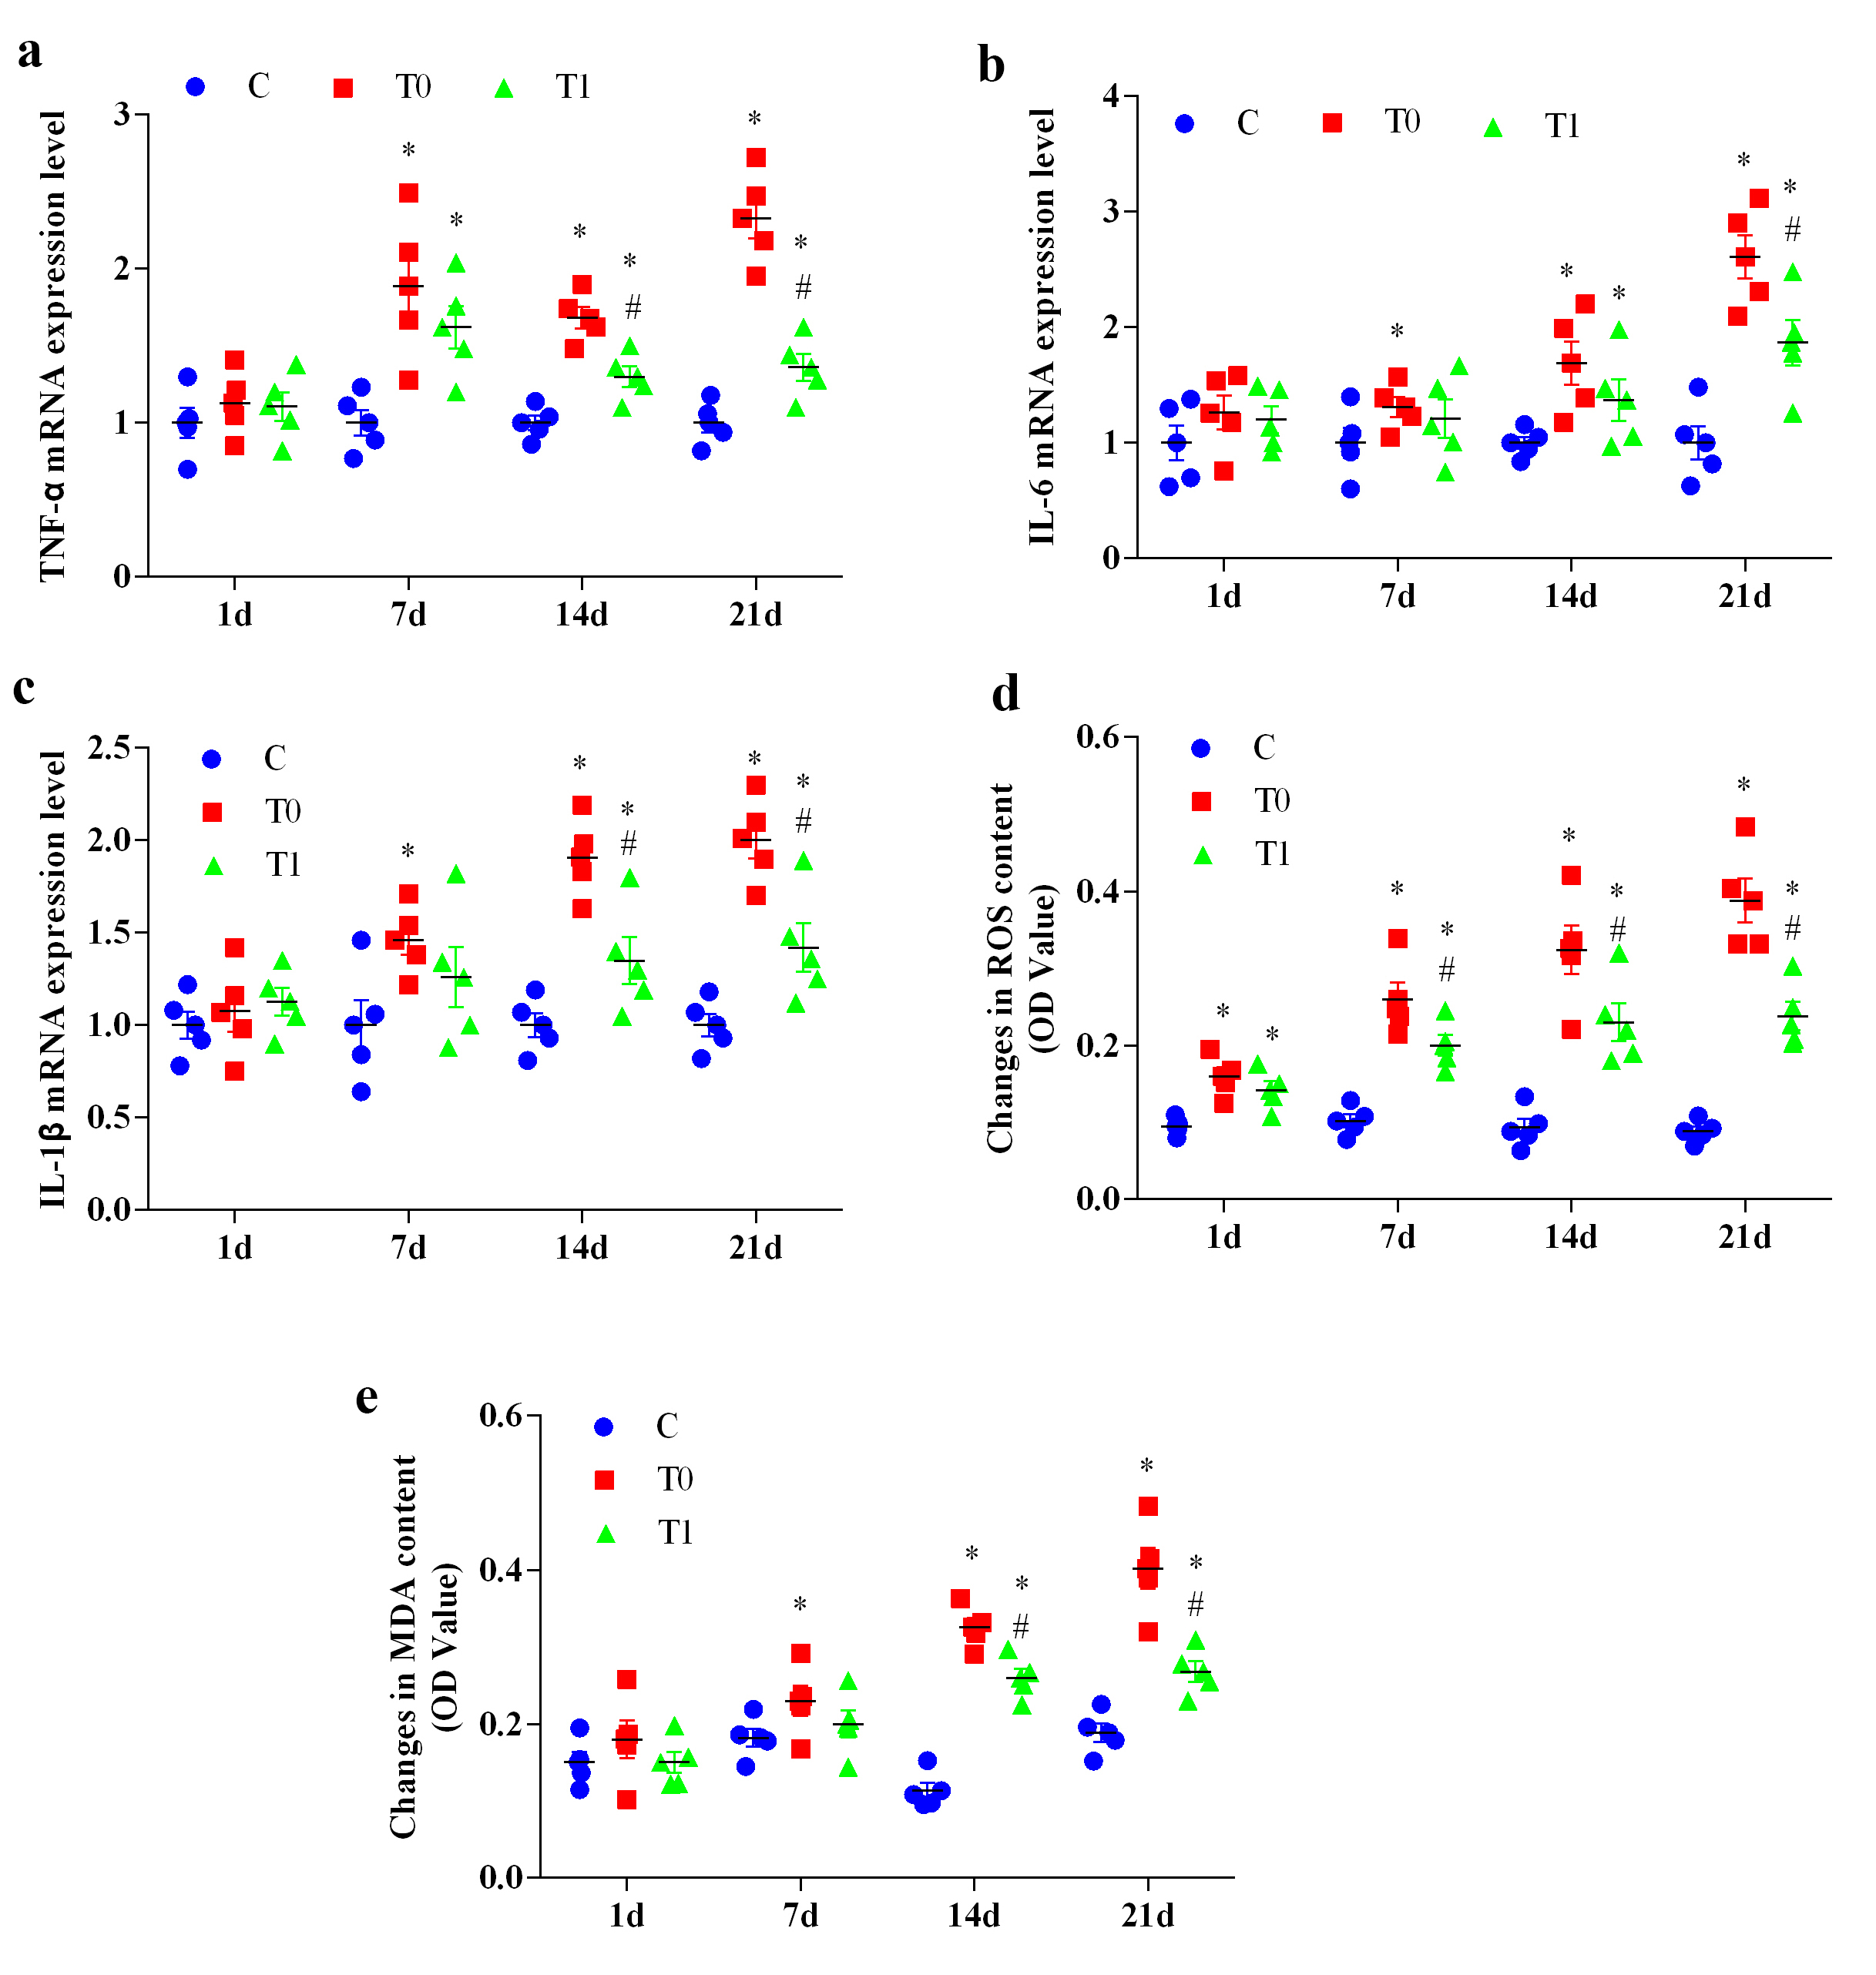 Fig. 5.
The effect of TP on the expression changes of key genes in
inflammation and oxidative stress in the hippocampal tissue of diabetic mice (n =
5). “a” represents the expression level of TNF-
Similarly, IL-6 mRNA expression showed no significant differences at day 1
(p
For IL-1
ROS levels were significantly elevated in groups T0 and T1 compared with group C
across all time points (p
At day 1, MDA levels did not differ significantly among groups. MDA levels
increased significantly in group T0 at 7, 14 and 21 days (p
P-gp protein expression in group T0 showed no significant differences from group
C at days 1 and 21 (p
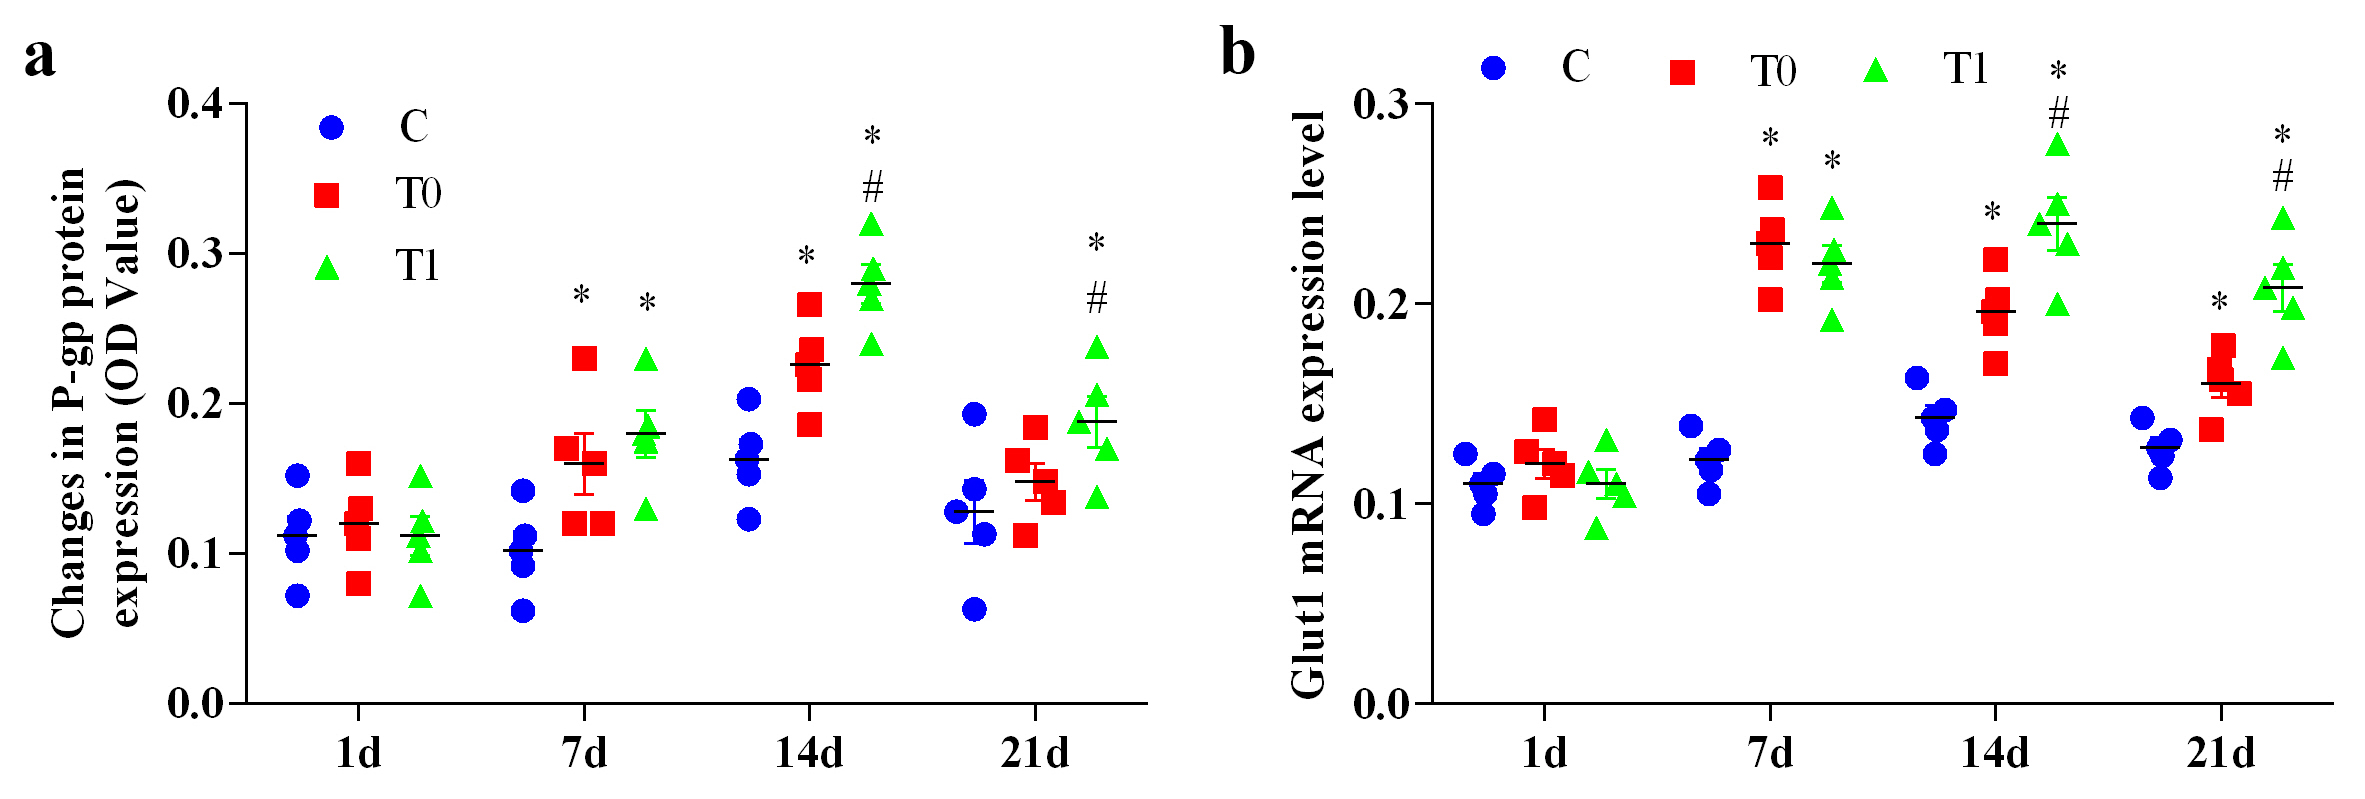 Fig. 6.
The effect of TP on P-gp protein expression, and Glut1 mRNA
expression in hippocampal tissue of diabetic mice (n = 5). “a” represents the
change in P-gp protein expression, and “b” represents the expression level of
Glut1 mRNA. Note: Compared with group C, * represents p
Glut1 mRNA expression showed no significant differences among groups at day 1
(p
P38, NF-
| Indicator | P38 | NF- |
IL-6 | TNF- |
ROS | Glut1 |
| r value | 0.994 | 0.987 | 0.992 | 0.999 | 0.998 | 0.960 |
| p value | 0.006 | 0.013 | 0.008 | 0.001 | 0.002 | 0.040 |
Compared with group C, Claudin-3 mRNA expression in group T0 increased
significantly at 1 and 7 days (p
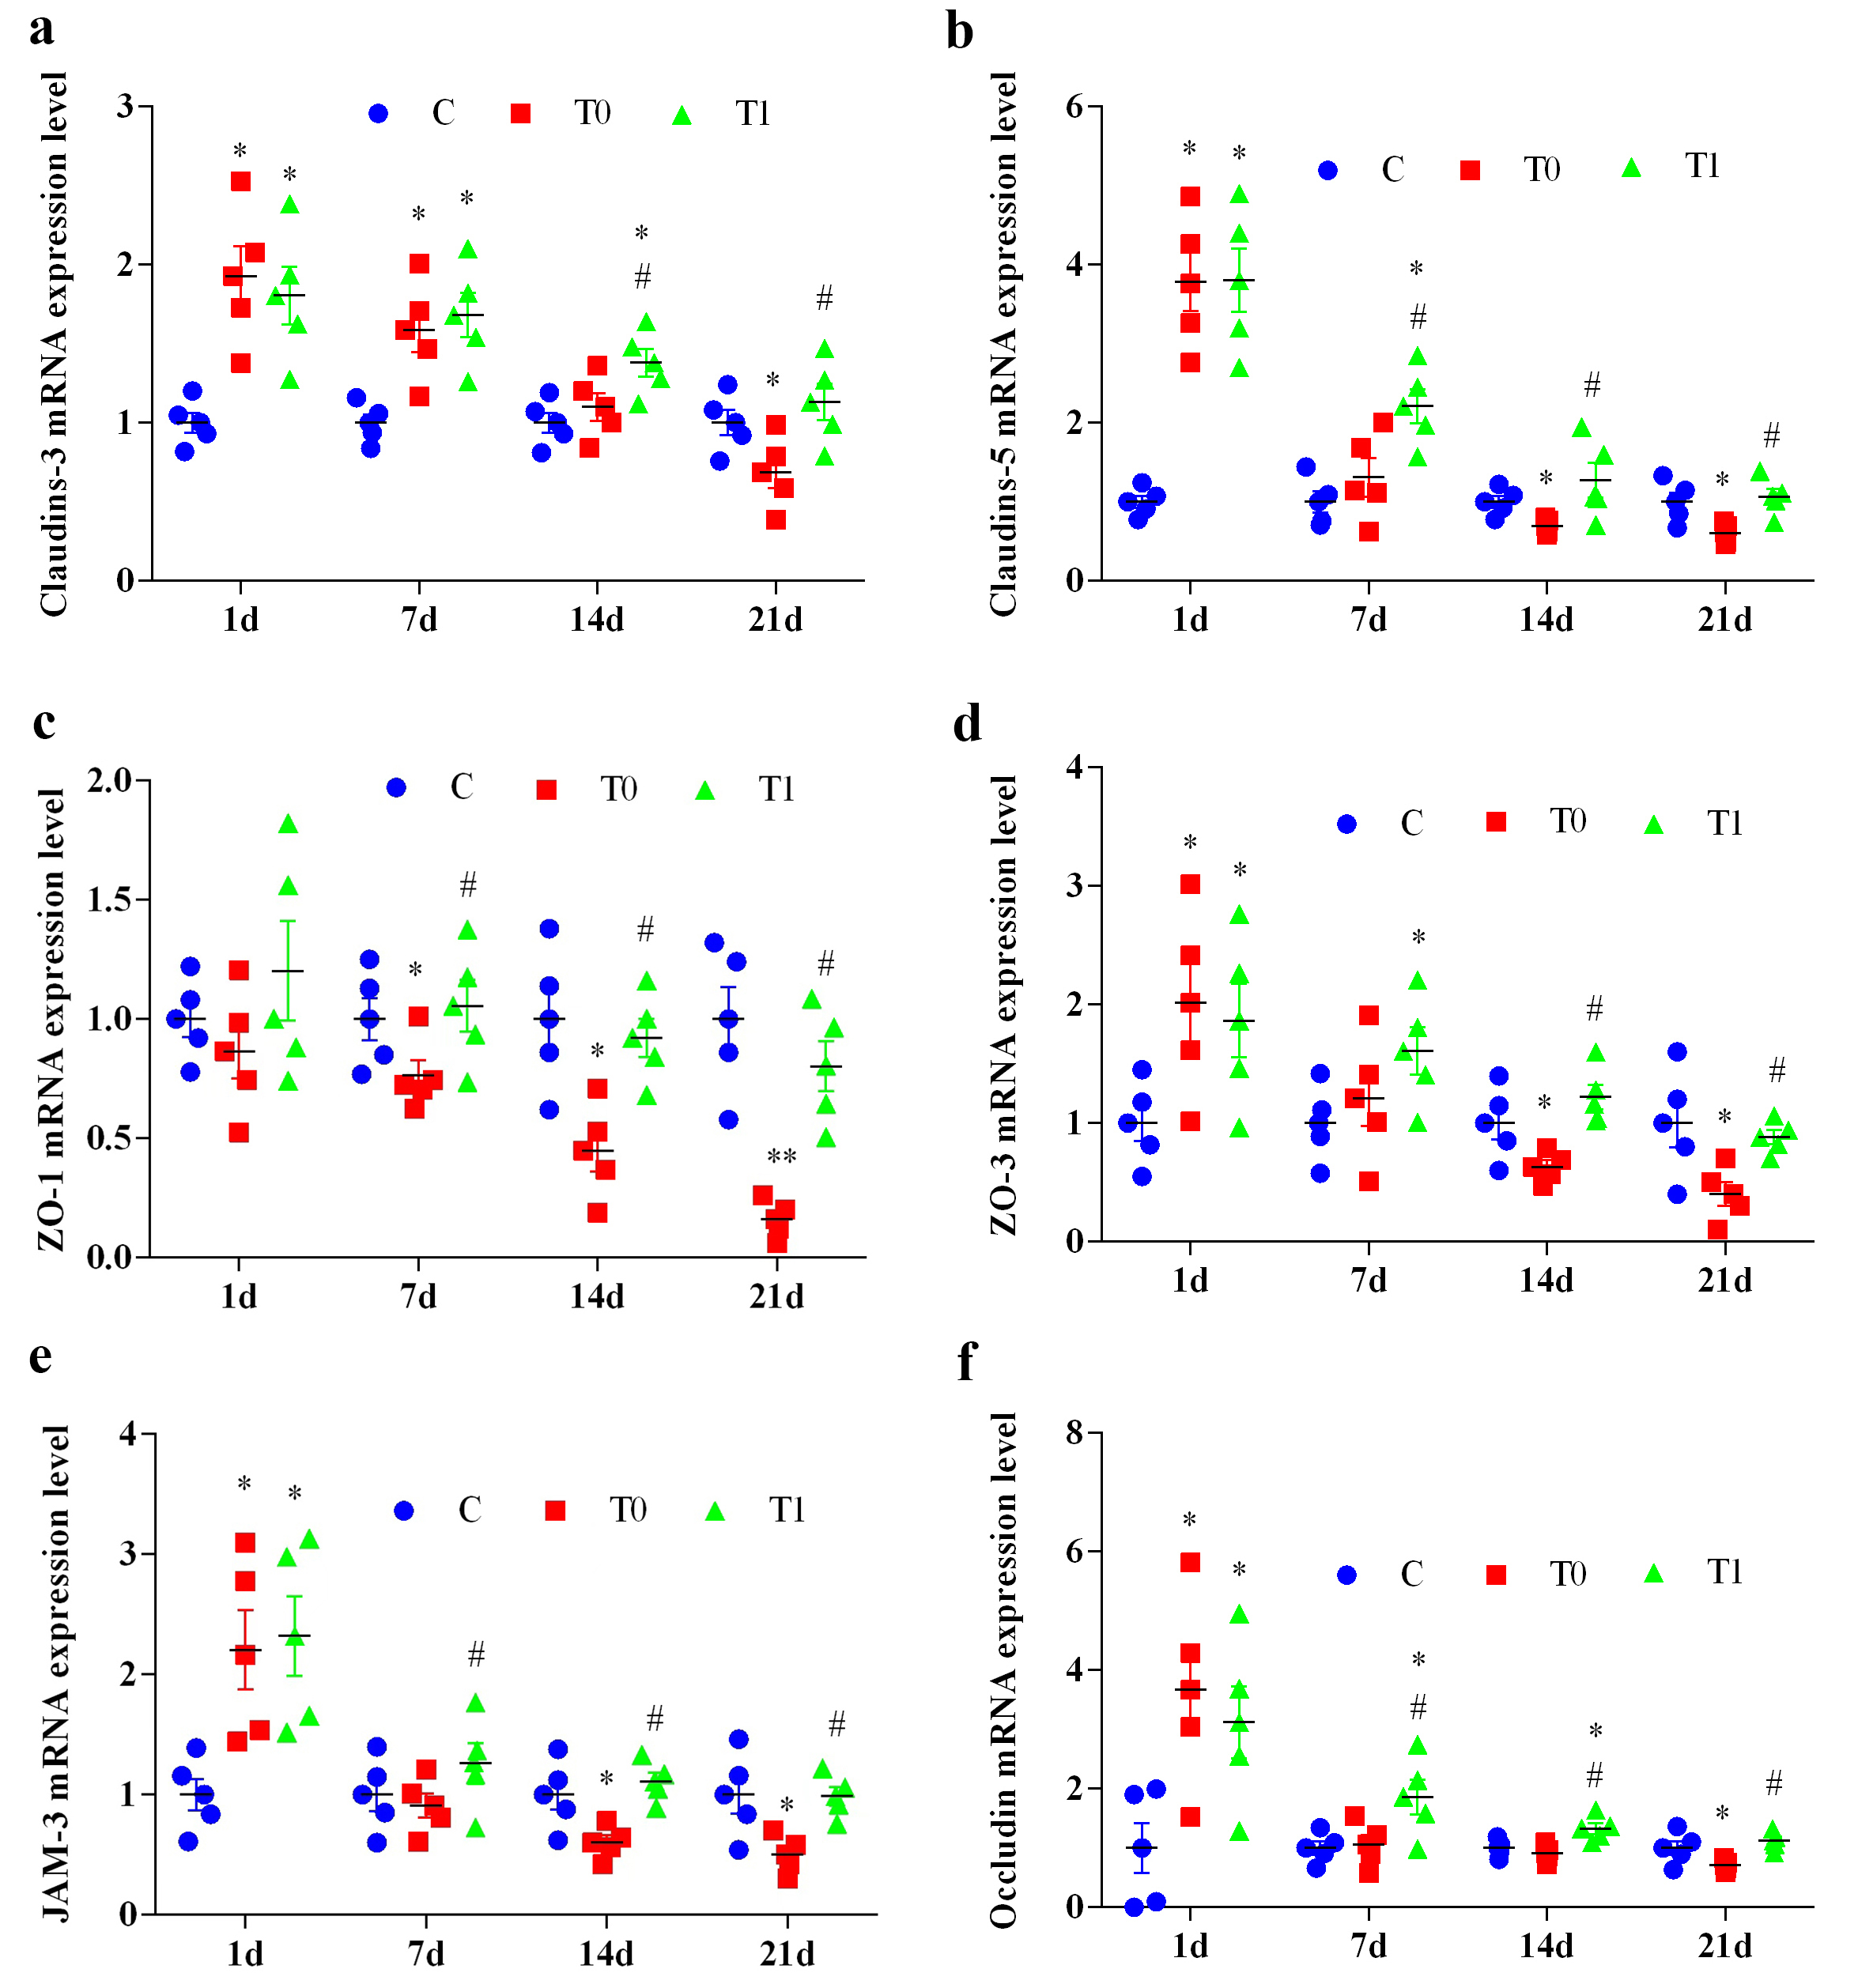 Fig. 7.
The effect of TP on the expression level of key molecules of TJ
in BBB of diabetic mice (n = 5). “a” represents the expression level of
Claudin-3 mRNA, “b” represents the expression level of Claudin-5 mRNA, “c”
represents the expression level of ZO-1 mRNA, “d” represents the expression level
of ZO-3 mRNA, “e” represents the expression level of JAM-3 mRNA, and “f”
represents the expression level of Occludin mRNA. Note: Compared with group C, *
indicates p
Claudin-5 mRNA expression in group T0 increased significantly at 1 day
(p
ZO-1 mRNA expression in group T0 did not differ from group C at 1 day but
decreased significantly or highly significantly at 7, 14 and 21 days (p
ZO-3 mRNA expression in group T0 increased significantly at 1 day (p
JAM-3 mRNA expression in both T0 and T1 groups increased significantly at 1 day
(p
Occludin mRNA expression in group T0 increased significantly at 1 day
(p
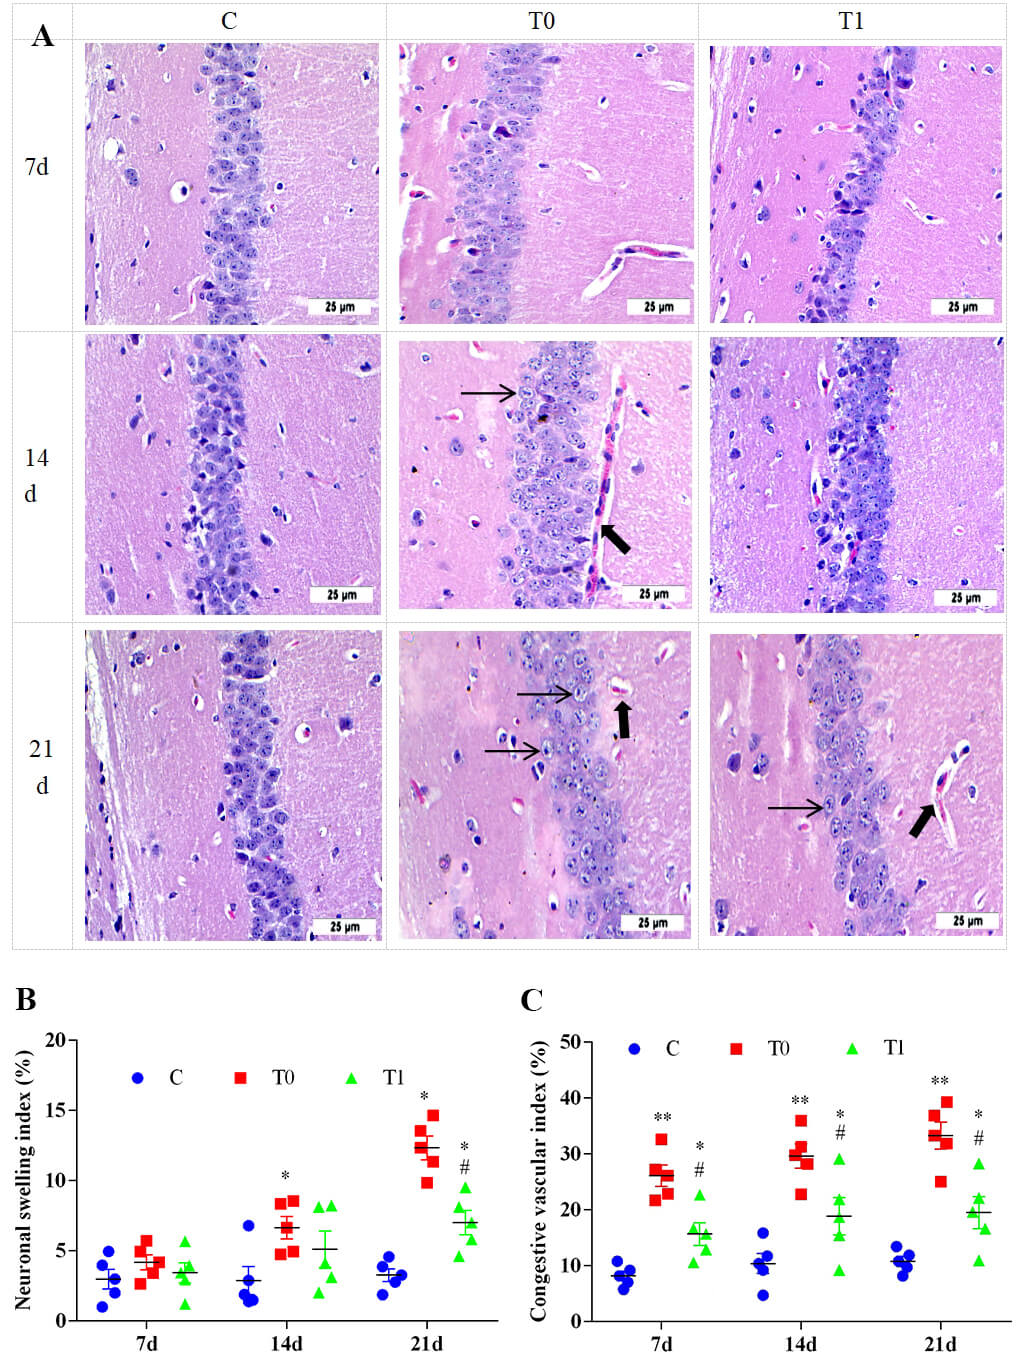
H&E staining showed pronounced histological changes in the hippocampus of group
T0 compared with group C. Early lesions were observed from CA1 to CA4, with CA1
being most severely affected. At 7 and 14 days, capillary congestion and neuronal
structural damage were evident in group T0, with swelling of pyramidal neuron
nuclei and cytoplasm. At 21 days, neuronal arrangement became disordered,
capillary congestion worsened, and the Virchow–Robin space widened. Some neurons
showed lighter cytoplasmic staining and became rounded and swollen. In group T1,
the Virchow–Robin space was narrower at 21 days, and neuronal swelling was
significantly reduced compared with group T0 (Fig. 8A). As shown in Fig. 8B,C, the neuronal swelling index in group T0 increased significantly at 14
and 21 days (p
 Fig. 8.
The effect of TP on the histological structure of the
hippocampus in DM mice, n = 5. Note: (A) H&E staining were used to analyze the
pathological changes of hippocampal tissue. “➞” indicates that the capillaries
were congested and the spaces were enlarged. “➡” indicates the swelling of
neurons. (B) Semi-quantitative analysis of neuronal swelling index. (C)
Semi-quantitative analysis of vascular congestion index. Compared with group C, *
indicates p
Toluidine blue staining showed no obvious neuronal changes in the CA1 region at
1 and 7 days in group T0. At 14 and 21 days, neurons became rounded and swollen,
and Nissl substance decreased significantly. Compared with group T0, Nissl
substance in group T1 increased significantly at 14 and 21 days (Fig. 9A). As
shown in Fig. 9B, grey values of Nissl substance were significantly higher in
group T0 at 14 and 21 days (p
 Fig. 9.
The effect of TP on the content of Nissl substance in neurons of
the CA1 region in the hippocampus of mice, n = 5. Note: (A) Toluidine blue staining. “➡” indicates neurons in which the Nissl substance in the cytoplasm has decreased
or disappeared. (B) Semi-quantitative analysis of changes in Nissl substances in
neurons. Compared with group C, * indicates p
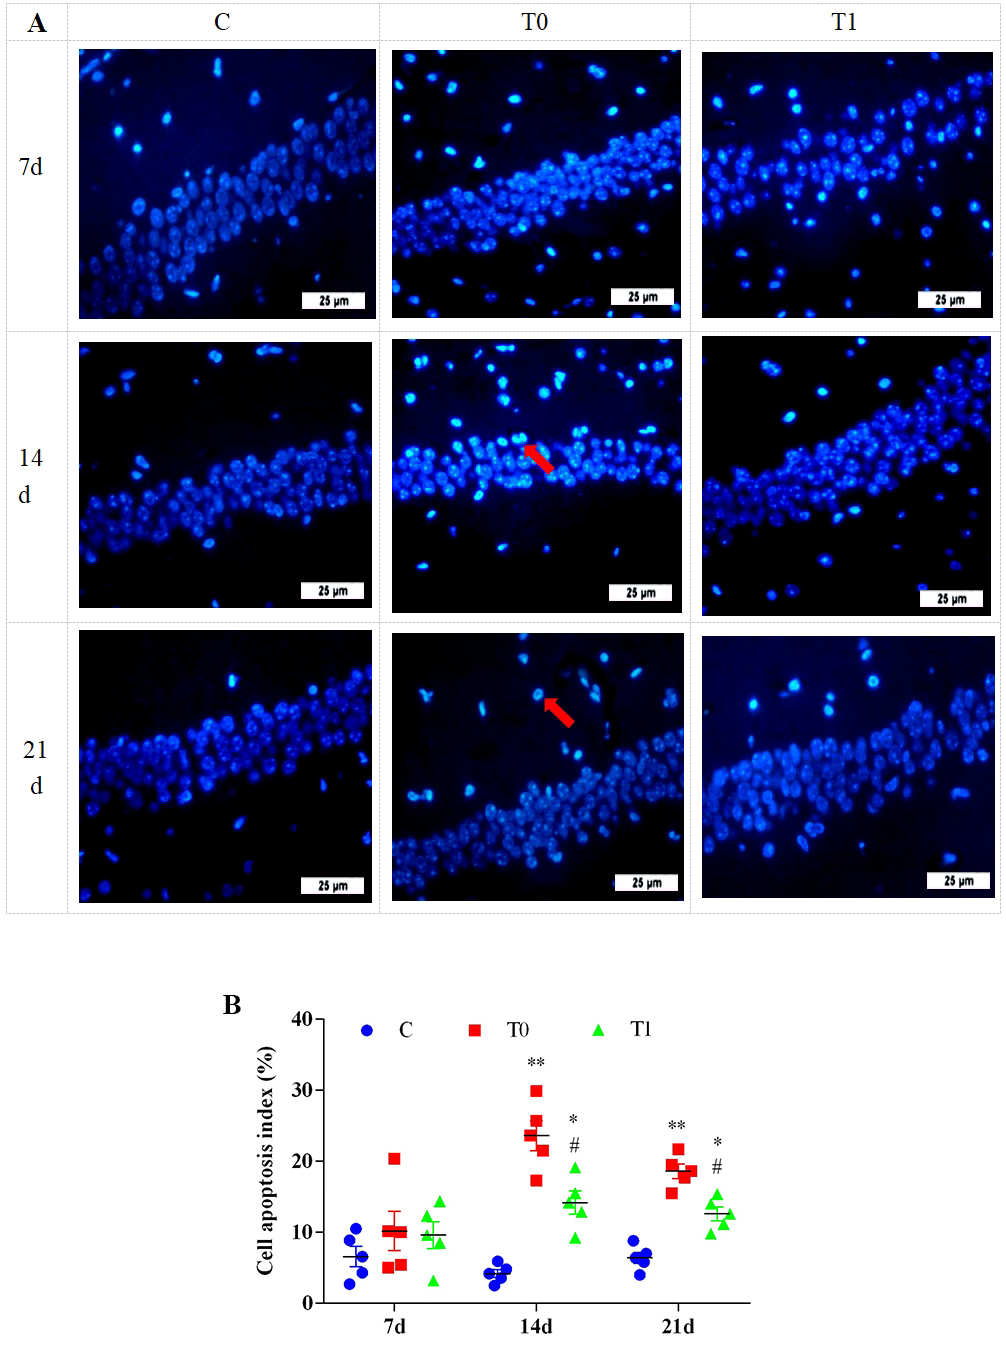
Hoechst 33342 staining showed no significant differences in apoptotic cells
between groups at 1 and 7 days. At 14 and 21 days, apoptotic cells increased
significantly in endothelial and glial cells in group T0. In group T1, apoptotic
cells in the CA1 region were significantly reduced at both time points (Fig. 10A). As shown in Fig. 10B, the apoptotic index was significantly or highly
significantly elevated in groups T0 and T1 at 14 and 21 days (p
 Fig. 10.
The effect of TP on apoptosis of hippocampal cells in DM mice, n = 5.
Note: (A) Hoechst 33342 staining was used to analyze the pathological changes of
hippocampal tissue. “
The hippocampus is essential for learning and memory and is highly susceptible to neuronal damage caused by hyperglycaemia, which affects CNS function. The BBB is a cerebrovascular barrier formed by ECs through continuous intercellular TJs, sealing intercellular contact and protecting neurons from circulating factors to maintain a regulated CNS environment. Numerous studies report that persistent hyperglycaemia in diabetes damages the hippocampus, disrupts BBB integrity, and enables harmful circulating substances to enter the brain, leading to neurological complications [19, 20].
Previous studies show that green tea significantly improves fasting blood
glucose, glycosylated haemoglobin and insulin resistance in type II diabetes
[21]. Green or black tea alleviates polyuria, polydipsia, hyperglycaemia and
other diabetic symptoms in db/db mice by upregulating kidney water reabsorption
proteins, including protein kinase C-
The interaction between AGEs and RAGE contributes to BBB dysfunction.
Hyperglycaemia in DM elevates RAGE levels, increases ROS production, activates
the NF-
Oxidative stress is a physiological response induced by adverse internal or
external stimuli. Excessive production of ROS and reactive nitrogen species (RNS)
exceeds the body’s clearance capacity, disrupts redox homeostasis and leads to an
imbalance between oxidative and antioxidative processes. Malondialdehyde (MDA), a
final product of lipid peroxidation, is an indicator of lipid peroxidation
severity and oxidative stress. Studies report that MDA levels in the hippocampus
of type 2 diabetic mice are significantly higher than in normal mice, whereas SOD
activity is significantly reduced and inflammatory cytokines such as
IL-1
Chronic peripheral inflammation induced by persistent hyperglycaemia can
activate inflammatory signalling within the CNS, disrupt neuronal structure and
function in the hippocampus and contribute to cognitive impairment and
behavioural abnormalities. IL-1
P-gp is an essential transmembrane transport protein that exports exogenous substances such as drugs and toxins out of cells, thereby influencing drug absorption, distribution and metabolism. In this study, P-gp expression initially increased and then declined during early diabetes. After TP treatment, P-gp expression increased significantly. Early diabetic stress may transiently stimulate P-gp expression as a protective response, consistent with earlier work [10]. As hyperglycaemic injury progressed, P-gp expression declined. TP upregulated P-gp expression, which may enhance the removal of harmful substances and protect brain tissue more effectively.
Glucose transporters (Glut proteins) regulate glucose uptake across membranes. Glut1 is expressed in vascular ECs and astrocytes [34], where it transports glucose across the BBB and into astrocytes for glycolysis. Glut1 has a high affinity for glucose and functions cooperatively with Glut3 to deliver glucose from the CNS interstitial fluid to neurons. Normal Glut1 function is essential for brain glucose uptake and utilisation [35]. Glut1 supports basal glucose uptake, whereas Glut4 mediates insulin-responsive glucose transport in peripheral tissues. Green Tea (GT) and EGCG increase Glut4 expression and reduce insulin resistance [36]. Reduced Glut1 expression impairs glucose transport and utilisation and contributes to brain energy deficiency. In vivo studies show that Glut1 levels decrease significantly in the hippocampus of mildly obese type 2 diabetic mice, accompanied by cognitive impairment [37]. In vitro, high-glucose exposure decreases Glut1 membrane expression in astrocytes, limiting glucose entry, reducing ATP production and impairing cognitive-related cellular functions [38]. In this study, Glut1 expression increased early in diabetes, then declined as injury progressed. TP treatment significantly increased Glut1 expression. Early diabetic stress may induce compensatory Glut1 expression to improve glucose uptake and mitigate initial metabolic disturbances. As hyperglycaemia persists, Glut1 expression decreases. TP enhanced Glut1 mRNA expression, reduced brain tissue damage and supported glucose transport and utilisation, consistent with its effects on Glut4 [35, 36].
In this study, RAGE protein expression exhibited a significant or highly
significant positive correlation with P38, NF-
Impaired BBB integrity is associated with reduced TJ proteins and inflammation
in brain microvessels and neural tissue. Studies show that diabetes-induced PKC
activation, overexpression of growth factors and intensified oxidative stress
contribute to endothelial dysfunction [39]. EGCG, as a water-soluble compound,
reduces A
Hippocampal tissue consists mainly of neurons (pyramidal and granule cells) and glial cells, forming an extensive synaptic network. STZ-induced DM reduces hippocampal cell proliferation and survival [46]. H&E and Nissl staining reveal neuronal loss in diabetic mice [47]. Previous studies show that apoptosis increases in T2DM and db/db mice [48], with elevated pro-apoptotic proteins and reduced anti-apoptotic and synaptic proteins [49]. EGCG promotes proliferation, migration and angiogenesis of endothelial progenitor cells and inhibits apoptosis [50]. Green tea prevents hippocampal neuronal apoptosis in diabetic rats by inhibiting the JNK/MLCK pathway and improves cognitive function [15]. EGCG also reduces oxidative and nitrosative stress induced by long-term alcohol exposure, increases glutathione (GSH) and enhances antioxidant enzyme activity, improving pathological alterations in the cerebral cortex, cerebellum, and hippocampus [51]. In this study, hippocampal capillaries in group T0 were congested at 7 days. By day 14, cytoplasmic staining became lighter, neurons appeared rounded and swollen, and vascular spaces widened. By day 21, Nissl substance decreased markedly, and apoptosis was increased in glial cells and ECs, consistent with previous studies [48, 49]. TP treatment reduced neuronal swelling, narrowed perivascular gaps, lowered apoptosis and increased Nissl substance. These results indicate that hippocampal pathology initiates as early as day 7 after diabetes induction and worsens over time. TP markedly attenuated tissue injury, consistent with earlier findings [15, 50, 51].
This study has several limitations. First, this study was only conducted in early-stage diabetic mice, and the long-term effects of TP on hippocampal structure and BBB integrity remain to be further explored. Second, the protective mechanism was verified mainly at the mRNA and protein expression levels; further in-depth experiments such as gene intervention or pathway blockade are still needed to confirm the causal relationship. Third, this is a preclinical animal study, and the results cannot be directly extrapolated to human clinical applications without further verification.
By decreasing the levels of AGEs, RAGE, P38 and phosphorylated NF-
The datasets used and analyzed during the current study are available from the corresponding author on reasonable request.
ZX: Conceptualization, data management, formal analysis, investigation, methodology, writing – original draft. YL: Data management, investigation, methodology, validation, writing – original draft. YY: Conceptualization, funding acquisition, project management, supervision, validation, writing, review and editing. All authors read and approved the final manuscript. All authors have participated sufficiently in the work and agreed to be accountable for all aspects of the work.
All animal procedures were approved by the Scientific Ethics Committee of Henan Institute of Science and Technology (License No. LLSC2021034). The research was conducted in accordance with the “National Institutes of Health Guidelines for the Care and Use of Laboratory Animals”. The research plan has been reviewed and approved by the Institutional Animal Care and Use Committee (IACUC) within the institution.
Not applicable.
This research was supported by the Henan Provincial Science and Technology Research Project (No.232102310480).
The authors declare no conflict of interest.
References
Publisher’s Note: IMR Press stays neutral with regard to jurisdictional claims in published maps and institutional affiliations.