
 , Xuanyi Dong 1, Biao Tang 1,3,*
1 Key Laboratory of Vascular Biology and Translational Medicine, Hunan University of Chinese Medicine, 410208 Changsha, Hunan, China
2 Department of Hearing and Speech Sciences, School of Medicine and Health, Guangzhou Xinhua University, 510520 Guangzhou, Guangdong, China
3 Department of Neurology, People’s Hospital of Ningxiang City, Hunan University of Chinese Medicine, 410600 Changsha, Hunan, China
Abstract
Protein p62 interacts with Kelch-like ECH-associated protein 1 (Keap1) competitively, triggering the oxidative stress response mediated by NF-E2-related factor 2 (Nrf2) and preventing ferroptosis in SH-SY5Y cells. Emerging evidence implicates that this regulatory axis may confer neuroprotection against cerebral ischemia-reperfusion injury (CIRI). The current investigation was designed to elucidate whether the p62/Keap1/Nrf2 signaling pathway contributes to the amelioration of CIRI through modulation of ferroptosis.
In SH-SY5Y cells, we used an oxygen-glucose deprivation/reperfusion (OGD/R) paradigm. In Sprague–Dawley rats, we used a middle cerebral artery occlusion/reperfusion (MCAO/R) model. Through these models, we investigated the effects of p62/Keap1/Nrf2 pathway activation. Additionally, we used in vitro experiments to analyze ferroptosis markers, cell damage, and the expression of pathway proteins. We injected the p62-overexpressing lentivirus into SH-SY5Y cells and the lateral ventricle of rats subjected to MCAO/R. Finally, we investigated the effects of an Nrf2 activator and a ferroptosis inhibitor.
Nrf2 negatively regulated OGD/R-triggered ferroptosis in SH-SY5Y cells by increasing glutathione peroxidase 4 (GPX4) expression and decreasing acyl-CoA synthetase long-chain family member 4 (ACSL4) levels. p62 overexpression in cells enhanced the interaction between Keap1 and p62, activating Nrf2 and protecting against OGD/R–triggered ferroptosis. Activating the p62/Keap1/Nrf2 signaling pathway in vivo reduced the brain injury area, decreased neuromotor functional impairment, and decreased the expression of ferroptosis markers in rats.
Activation of the p62/Keap1/Nrf2 signaling pathway reduces ferroptosis and alleviates CIRI. This protective mechanism provides novel directions for investigating the pathological mechanisms of CIRI.
Keywords
- nuclear factor erythroid 2-related factor 2
- Kelch-like ECH-associated protein 1
- sequestosome 1
- ferroptosis
- brain ischemia-reperfusion injury
- oxidative stress
- p62/Keap1/Nrf2 pathway
Accounting for approximately 60–70% of all cerebrovascular events, ischemic stroke remains a leading global contributor to long-term disability and mortality, a situation compounded by the limited availability of efficacious therapeutic interventions [1]. Timely restoration of blood supply to the ischemic area is the most common treatment strategy; however, this reperfusion paradoxically initiates a cascade of pathological events, culminating in further neuronal injury, resulting in cerebral ischemia-reperfusion injury (CIRI), which involves apoptosis, pyroptosis, programmed necrosis, and ferroptosis [2, 3].
Ferroptosis is an iron-dependent form of regulated cell death triggered by lethal lipid peroxidation. It predominantly occurs in neurons during CIRI and is linked to antioxidant pathways, lipid metabolism, and iron metabolism [4, 5]. Targeting ferroptosis may preserve neuronal integrity and functional outcomes following ischemic insult.
NF-E2-related factor 2 (Nrf2) prevents iron overload through the upregulation of ferritin and ferroportin, therefore playing a crucial role in ferroptosis regulation. It increases the expression of the glutathione peroxidase 4 (GPX4) and antioxidants glutathione (GSH), thereby inhibiting ferroptosis by disrupting the acyl-CoA synthetase long-chain family member 4 (ACSL4)-mediated lipid metabolism pathway [6, 7, 8, 9]. Under physiological conditions, Nrf2 is mostly isolated in the cytoplasm and its activity is negatively regulated by Kelch-like ECH-associated protein 1 (Keap1). This protein-protein interaction triggers Keap1-mediated Nrf2 ubiquitination, which in turn promotes the recognition and degradation of this transcription factor by the proteasome [10]. However, under oxidative stress conditions, the SQSTM1/p62 (hereinafter referred to as p62) protein competitively binds to Kelch-like ECH-related protein 1 (Keap1) and isolates it. Then, Nrf2 dissociates from the Keap1-Nrf2 complex and translocates into the nucleus [11]. By competitively interacting with Keap1, p62 triggers the Nrf2-dependent antioxidant response and inhibits ferroptosis in 6-OHDA-treated SH-SY5Y cells. These findings have led to the proposal that the p62/Keap1/Nrf2 signaling axis functions as a suppressor of ferroptosis [12, 13]. However, some evidence suggests that this pathway may have additional neuroprotective functions in CIRI. The exact mechanisms by which the p62/Keap1/Nrf2 pathway influences CIRI-related damage via the regulation of ferroptosis remain unclear. Based on the above background, this study was undertaken to adopt the in vitro oxygen-glucose deprivation/reperfusion (OGD/R) cell model and the in vivo middle cerebral artery occlusion/reperfusion (MCAO/R) animal model to respectively simulate the cellular and overall pathological states of CIRI. Our goal was to deeply elucidate the molecular mechanism by which the p62/Keap1/Nrf2 signaling pathway regulates ferroptosis during the CIRI process.
Human neuroblastoma SH-SY5Y cell line was purchased from the Metson Cell Bank (M23SJ3004, MeisenCTCC, Jinhua, Zhejiang, China), with Short Tandem Repeat (STR) identification supplied by its partner Genetic Testing Biotechnology (Service Order No. 230524B; Suzhou, Jiangsu, China). SH-SY5Y cells were cultured in proliferative medium composed of DMEM/F12 (A4192001, Thermo Fisher Scientific, Waltham, MA, USA) supplemented with 1% penicillin-streptomycin (M23SA1004; 100×, MeisenCTCC) and 12% fetal bovine serum (A5256701, Thermo Fisher Scientific). Cells were incubated at 37 °C in a humidified incubator with a 5% CO2. The medium was refreshed every 1–2 days to sustain optimal cell growth. Following seeding, the cells were cultured for 2–3 days to reach appropriate confluence, and the entire experimental workflow was completed within 5–7 days. The SH-SY5Y cells used in this study have been validated and tested for mycoplasma contamination. The test was performed using Hoechst DNA stain (indirect) method, Agar culture (direct) method, PCR-based assay, and the result was negative.
After 24 h of cell seeding, cells that had achieved 30% confluence were added to the culture medium. Transfection with the lentiviral strains LV-p62-OE and LV-OE-Control (H29906 and GL181; Heyuan Biotechnology, Wuhan, Hubei, China), and LV-p62-shRNA and LV-shRNA-Control (69956-11 and CON313; Shanghai Gene Chem Co., Ltd., Shanghai, China) was performed, as directed by the manufacturer. The cell culture medium was changed 16 h post-transfection to encourage growth.
The SH-SY5Y cells were cultured for 2–3 days until reaching approximately 70% confluence before OGD/R induction. Prior to OGD treatment, cells were rinsed with phosphate-buffered solution (PBS) (10010001, Thermo Fisher Scientific) and transferred to serum-free glucose-free DMEM (11966025, Thermo Fisher Scientific) with no additional supplements. The cells were then placed in a tri-gas incubator (51033720, Thermo Fisher Scientific) and cultured for 2 h, with 95% N2 and 5% CO2 to induce OGD. This 2-h OGD duration and subsequent 24-h reoxygenation period are consistent with established protocols [6, 14, 15, 16] and effectively mimic the ischemic-reperfusion pathological microenvironment in cerebral ischemia, inducing ferroptosis and neuronal damage in SH-SY5Y cells that recapitulate in vivo CIRI features. After 2 h of OGD treatment, the culture medium was renewed with complete DMEM/F12, supplemented with 1% penicillin-streptomycin and 12% fetal bovine serum, for full reoxygenation and glucose restoration.
The experiment involved eight groups: treatment details are presented in Table 1. For drug administration, inhibitors and activators were added twice: the first addition was 24 h prior to OGD/R induction, then the second addition was 2 h after OGD/R establishment. Cells in the lentiviral intervention groups were transfected 72 h before OGD/R modeling as previously described.
| Group | Normal culture | OGD/R | 24 h before establishing the OGD/R model and 2 h after establishing the OGD/R model | |||
| tBHQ | ML385 | Fer-1 | RSL3 | |||
| Sham | √ | - | - | - | - | - |
| OGD/R | - | √ | - | - | - | - |
| Ferroptosis inhibitor | - | √ | - | - | 5 µM | - |
| Ferroptosis activator | - | √ | - | - | - | 50 nM |
| Nrf2 activator | - | √ | 40 µM | - | - | - |
| Nrf2 inhibitor | - | √ | - | 20 µM | - | - |
| Nrf2 activator + ferroptosis activator | - | √ | 40 µM | - | - | 50 nM |
| Nrf2 inhibitor + ferroptosis inhibitor | - | √ | - | 20 µM | 5 µM | - |
OGD/R, oxygen-glucose deprivation/reperfusion; tBHQ, tert-butylhydroquinone; RSL3, RAS-selective lethal 3; Nrf2, NF-E2-related factor 2; Fer-1, Ferrostatin-1.
Cells were plated in 96-well plates at 5
Quantification of relative reactive oxygen species (ROS) levels was performed with a ROS assay kit (Cat# 120920210208, 100 assays, Shanghai Beyotime Biotechnology). After capturing images from three random, non-overlapping fields per group, fluorescence levels were analyzed using ImageJ (version 1.54s, NIH, Bethesda, MD, USA) to quantify ROS production, and the values were calculated and normalized to those of the sham group.
The kit of Image-iT® lipid peroxidation (C10445; Thermo Fisher Scientific) was used, following the manufacturer’s protocol, to quantify the relative intracellular lipid peroxidation levels of the cells. In each group, images of three randomly selected non-overlapping fields of view were analyzed using ImageJ software. The green-red fluorescence ratio was used for calibration, and the fluorescence value was calculated relative to that measured in the sham group.
Cells were seeded in 24-well plates. Before subsequent detection, they were fixed with 4% paraformaldehyde (P0099-500mL, Shanghai Beyotime Biotechnology), and blocked with Immunol Staining blocking buffer (P0102; Shanghai Beyotime Biotechnology) at 37 °C for 1 h. Primary antibodies (Nrf2: AF0639; GPX4: DF6701; ACSL4: DF12141; Affinity Biosciences, Cincinnati, OH, USA) were added at a dilution of 1:200 and incubated overnight at 4 °C. Then the secondary antibodies (anti-rabbit FITC: P0186; anti-rabbit Alexa Fluor 555: P0179; Shanghai Beyotime Biotechnology) were added at a 1:200 dilution and incubated for 1 h in the dark at 37 °C, followed by DAPI (P0131; Shanghai Beyotime Biotechnology) staining for 10 min. Images were captured via inverted fluorescence microscope (Axio Vert.A1, Carl Zeiss, Jena, Germany), and target protein fluorescence ratio to DAPI was quantified via ImageJ, normalized to the sham group.
After blocking, slides were co-incubated with p62 (Rabbit; 23214s; Cell Signaling Technology, Danvers, MA, USA) and Keap1 (Mouse; MA5-17106; Thermo Fisher Scientific) primary antibodies diluted 1:100 at 4 °C overnight. Following three rinses with PBS, species-specific fluorophore-conjugated secondary antibodies (FITC-anti-rabbit IgG, Cat. No. S0008, and Cy3-anti-mouse IgG, Cat. No. S0012; Affinity Biosciences; 1:200) were added at a 1:200 dilution. The fluorescence intensities of Keap1 and p62 in the cells were quantified using ImageJ software, and the fluorescence intensity ratio of p62 to Keap1 was estimated.
Cells were rinsed with pre-cooled PBS, lysed with pre-cooled RIPA buffer
(P0013B, Beyotime Biotechnology) (1% Triton X-100, 150 mM NaCl,
50 mM Tris-HCl pH 7.4, 0.1% Sodium Dodecyl Sulfate (SDS), 1 mM
Ethylenediaminetetraacetic Acid (EDTA), 1% sodium deoxycholate, 1
One-hundred and eighty male SPF Sprague–Dawley rats (220–240 g; Hunan Slake Jingda Experimental Animal Co., Ltd, Changsha, Hunan, China) were housed in SPF
facility (12 h light/dark, 25
Rats were randomly allocated into 6 groups: sham, MCAO/R, p62 negative control (LV-p62-NC), p62 overexpression (LV-p62-OE), sulforaphane (Nrf2 activator), and ferrostatin-1 (Fer-1, ferroptosis inhibitor, 5 µM) (HY-100579; MedChemExpress, Monmouth Junction, NJ, USA; 2 mg/kg) groups.
MCAO/R surgery was performed based on a previously established protocol [17]. Rats were anesthetized with 2% pentobarbital sodium (40 mg/kg, i.p.), a 1 cm neck midline incision was made, and right common, external, and internal carotid arteries were exposed. A monofilament (2636A2; Beijing Cinontech, Beijing, China) was inserted via external carotid artery to occlude middle cerebral artery for 2 h, followed by 24 h reperfusion. The sham group underwent neck incision and vessel isolation without occlusion.
Sulforaphane (4478-93-7; MedChemExpress, Monmouth Junction, NJ, USA; 5 mg/kg) was administered intraperitoneally to rats in the corresponding group 20 min following surgery. Fer-1 (HY-100579; MedChemExpress, Monmouth Junction, NJ, USA; 2 mg/kg) was intraperitoneally administered to rats in the Fer-1 group 2 h prior to the operation; equivalent saline volumes were administered to sham and MCAO/R controls.
The Sqstm1 (NM_175843) lentiviral vector was produced and assembled by Shanghai Gene Chem Co., Ltd. (GENE_ID: 113894; carrier name: GV707; component sequence: CMV enhancer-MCS-EF1a-ZsGreen1-T2A-puromycin). Rats were anesthetized with pentobarbital sodium (P3761; Sigma-Aldrich, Merck; 40 mg/kg, i.p.) and fixed in a stereotaxic frame (DW-2000D, Chengdu Techman Software Co., Ltd., Chengdu, Sichuan, China). LV-p62-OE was injected slowly at the injection point (DV = –3.5 to 4.0, ML = +2.0, AP = –1.0) in accordance with the atlas, at 1 µL/min with the Paxinos and Watson Atlas brain maps; the needle remained in position for 10 min. The LV-p62-OE group received a 5 µL injection of p62 lentivirus into the lateral ventricle 3 weeks before surgery, while the LV-Control group received a 5 µL injection of unloaded lentivirus at the same time. p62 lentiviral injection was evaluated 1, 2, and 3 weeks before surgery; 3 weeks was selected as the optimal time point.
The Garcia neurological score was selected as it is a well-validated, widely used tool for rodent cerebral ischemia models, comprehensively evaluating CIRI-related functional domains with high inter-rater reliability to objectively quantify neurological recovery [18].
Following 24 h of reperfusion, Garcia neurological scores were assessed by well-trained investigators who were blinded to the experimental grouping and not involved in subsequent data processing. Details of Garcia neurological function scoring are provided in Table 2.
| Item | Performance | Score |
| Spontaneous activity (Caged rat observation time, 5 min) | The rat actively explores the cage, making contact with at least three sides. | 3 |
| The rat moves within the cage, making contact with at least one side. | 2 | |
| The rat shows minimal, infrequent movement. | 1 | |
| The rat is completely motionless. | 0 | |
| Symmetrical limb extension | Both forelimbs extend symmetrically and fully. | 3 |
| The left forelimb exhibits delayed or sluggish extension. | 2 | |
| The left forelimb shows minimal or no visible extension. | 1 | |
| The left forelimb remains completely immobile. | 0 | |
| Forelimb symmetry (Lift rat tail and observe forelimb movement) | Both forelimbs extend symmetrically when the tail is lifted. | 3 |
| The left forelimb extends less vigorously and to a lesser degree than the right. | 2 | |
| The left forelimb shows only slight movement during extension. | 1 | |
| The left forelimb shows no movement at all. | 0 | |
| Ability to grip and climb cages | The rat demonstrates normal grip strength and climbing ability. | 3 |
| The rat’s grip and climbing are noticeably weaker on the left side. | 2 | |
| The rat is unable to grip or climb effectively. | 1 | |
| The rat shows no attempt to grip or climb. | 0 | |
| Body proprioception and reflexes | Bilateral responses are symmetrical and normal. | 3 |
| Responses are diminished on one side. | 2 | |
| No response is observed on one side. | 1 | |
| No response is observed on either side. | 0 | |
| Response to vibrissae touch | The rat responds symmetrically to stimulation of both sides. | 3 |
| The response is diminished on one side. | 2 | |
| No response is observed on one side. | 1 | |
| No response is observed on either side. | 0 |
Before surgery, all rats underwent open field test training twice daily for 3 days. All animals were placed in the bottom central compartment of the box and monitored for 5 min. To eliminate the scent of the prior animal, the interior of the box was disinfected with 75% alcohol between test subjects. Video recordings were used to measure the overall distance covered by the rat in its horizontal movement and the total number of times it entered the core area.
Brains were harvested post-euthanasia, frozen at –20 °C for 30 min, sectioned into 1 mm coronal slices, incubated in 2,3,5-triphenyltetrazolium chloride (TTC) (BCBP3272V, Sigma-Aldrich, Merck, St. Louis, MO, USA) solution for 30 min, and fixed in 4% paraformaldehyde at 4 °C overnight. Slices were photographed sequentially.
GSH, Fe2+, MDA, and 4-HNE levels were detected using ferrous iron colorimetric assay kit (FU0262ZV0943; Elabscience, Houston, TX, USA), MDA assay kit (A003-1-2, Nanjing Jiancheng Bioengineering Institute, Nanjing, Jiangsu, China), GSH assay kit (A006-2-1, Nanjing Jiancheng Bioengineering Institute), and 4-HNE ELISA kit (H268-1-1; Nanjing Jiancheng Bioengineering Institute) per manufacturers’ instructions. Absorbance was detected via enzyme marker, and contents were calculated accordingly.
Tissues and cells were lysed, proteins were quantified and denatured. 30
µg cell protein and 70 µg tissue protein were loaded onto SDS-PAGE
gels. Nuclear extracts were validated with Lamin B1 (#4777S; Cell Signaling Technology, Danvers, MA, USA; 1:1000), cytoplasmic extracts with
All data are presented as mean
To clarify the statistical comparisons across all figures, the following standardized symbols are used consistently throughout the manuscript:
*p
#p
&p
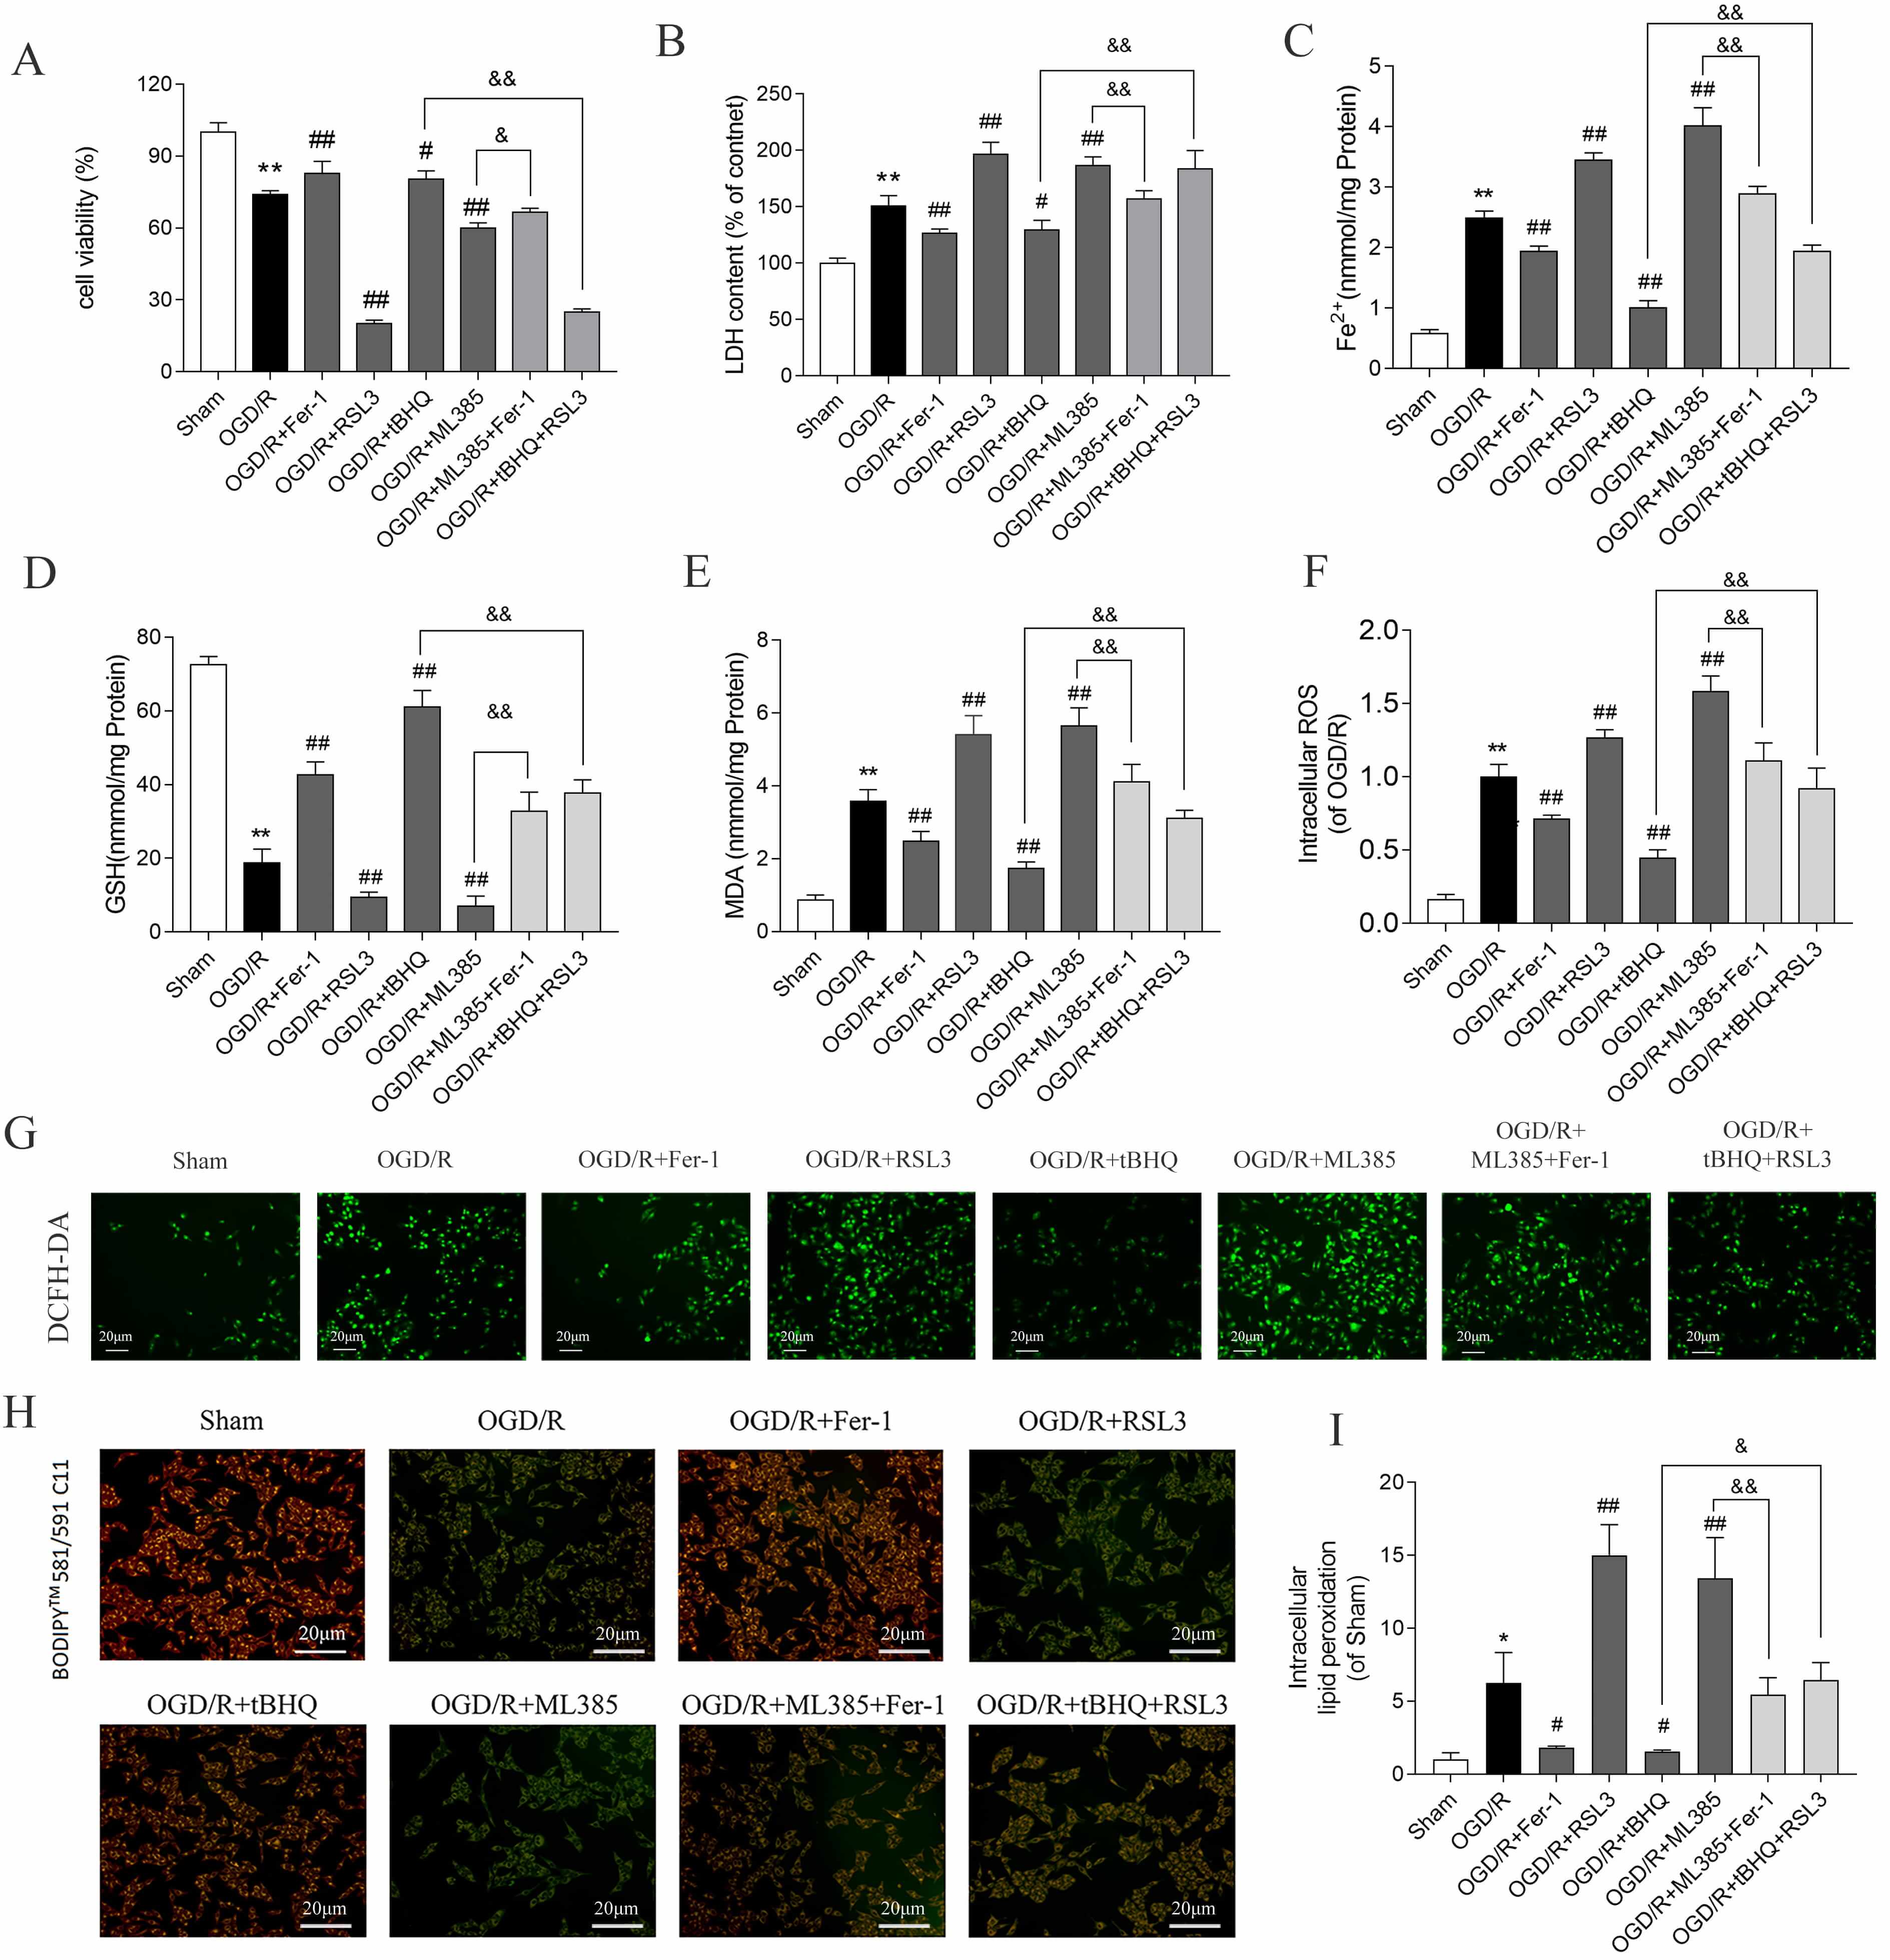
Exposure of SH-SY5Y cells to OGD/R followed by reperfusion markedly diminished cell viability (Fig. 1A), concomitant with elevated lactate dehydrogenase release (Fig. 1B) and intracellular Fe2+ accumulation (Fig. 1C). Additionally, GSH levels were decreased (Fig. 1D), while those of MDA, ROS, and lipid peroxidation increased (Fig. 1E–I). Administering the ferroptosis inhibitor ferrostatin-1 (Fer-1, 5 µM) and the ferroptosis activator RAS-selective lethal 3 (RSL3, 50 nM) produced the opposite effects, indicating that OGD/R triggered ferroptosis in SH-SY5Y cells.
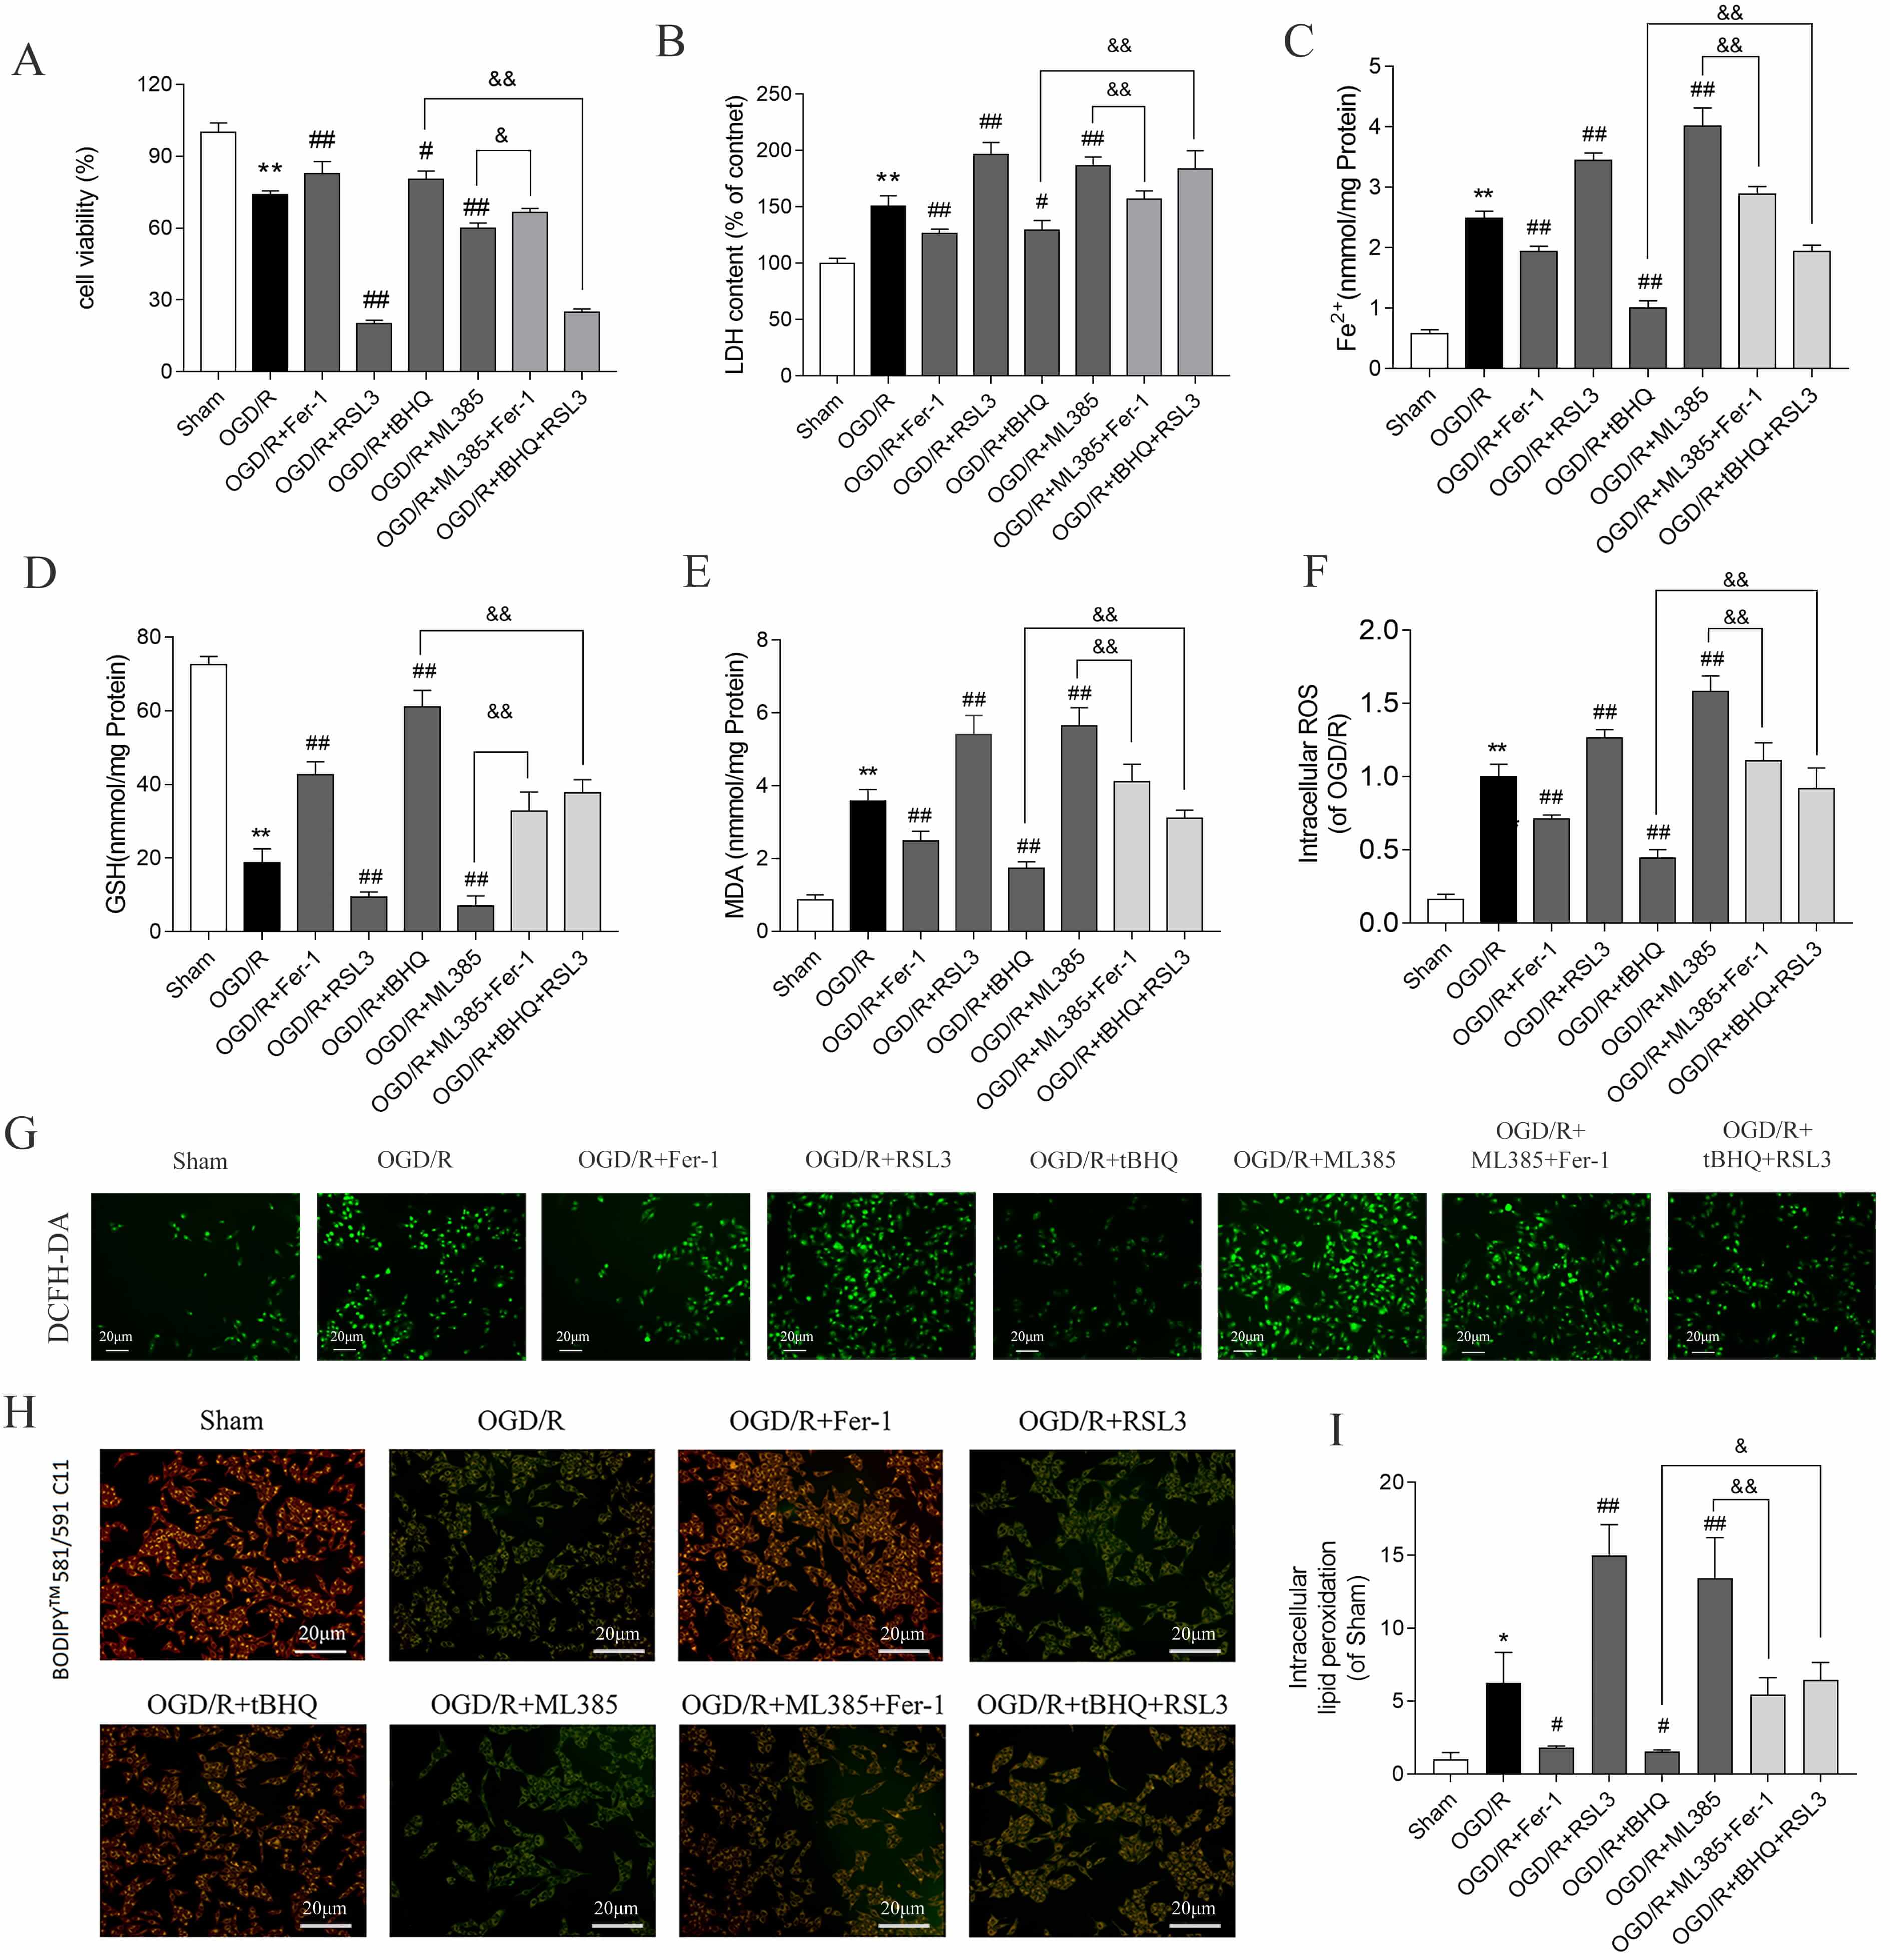 Fig. 1.
Nrf2 inhibits OGD/R-induced ferroptosis of SH-SY5Y cells. (A)
Cell viability and (B) LDH release levels. Data are presented as mean
Pharmacological activation of Nrf2 with tert-butylhydroquinone (tBHQ, 40 µM) (HY-100489, MedChemExpress, Monmouth Junction) markedly enhanced cell survival and glutathione content, concomitant with diminished LDH release, Fe2+ accumulation, MDA generation, ROS production, and lipid peroxidation relative to OGD/R controls. Conversely, administration of the Nrf2 antagonist ML385 (20 µM) (HY-100523, MedChemExpress, Monmouth Junction) elicited opposing effects across all measured parameters (Fig. 1A–I), implicating Nrf2 as a negative regulator of ferroptotic cascades in this cellular model.
Notably, the ferroptosis inducer RSL3 partially attenuated the cytoprotective effects of tBHQ, whereas the ferroptosis inhibitor ferrostatin-1 partially abrogated the exacerbated injury phenotype resulting from ML385 treatment. These observations collectively support the notion that Nrf2 confers protection against OGD/R-induced neuronal injury through suppression of ferroptotic execution.
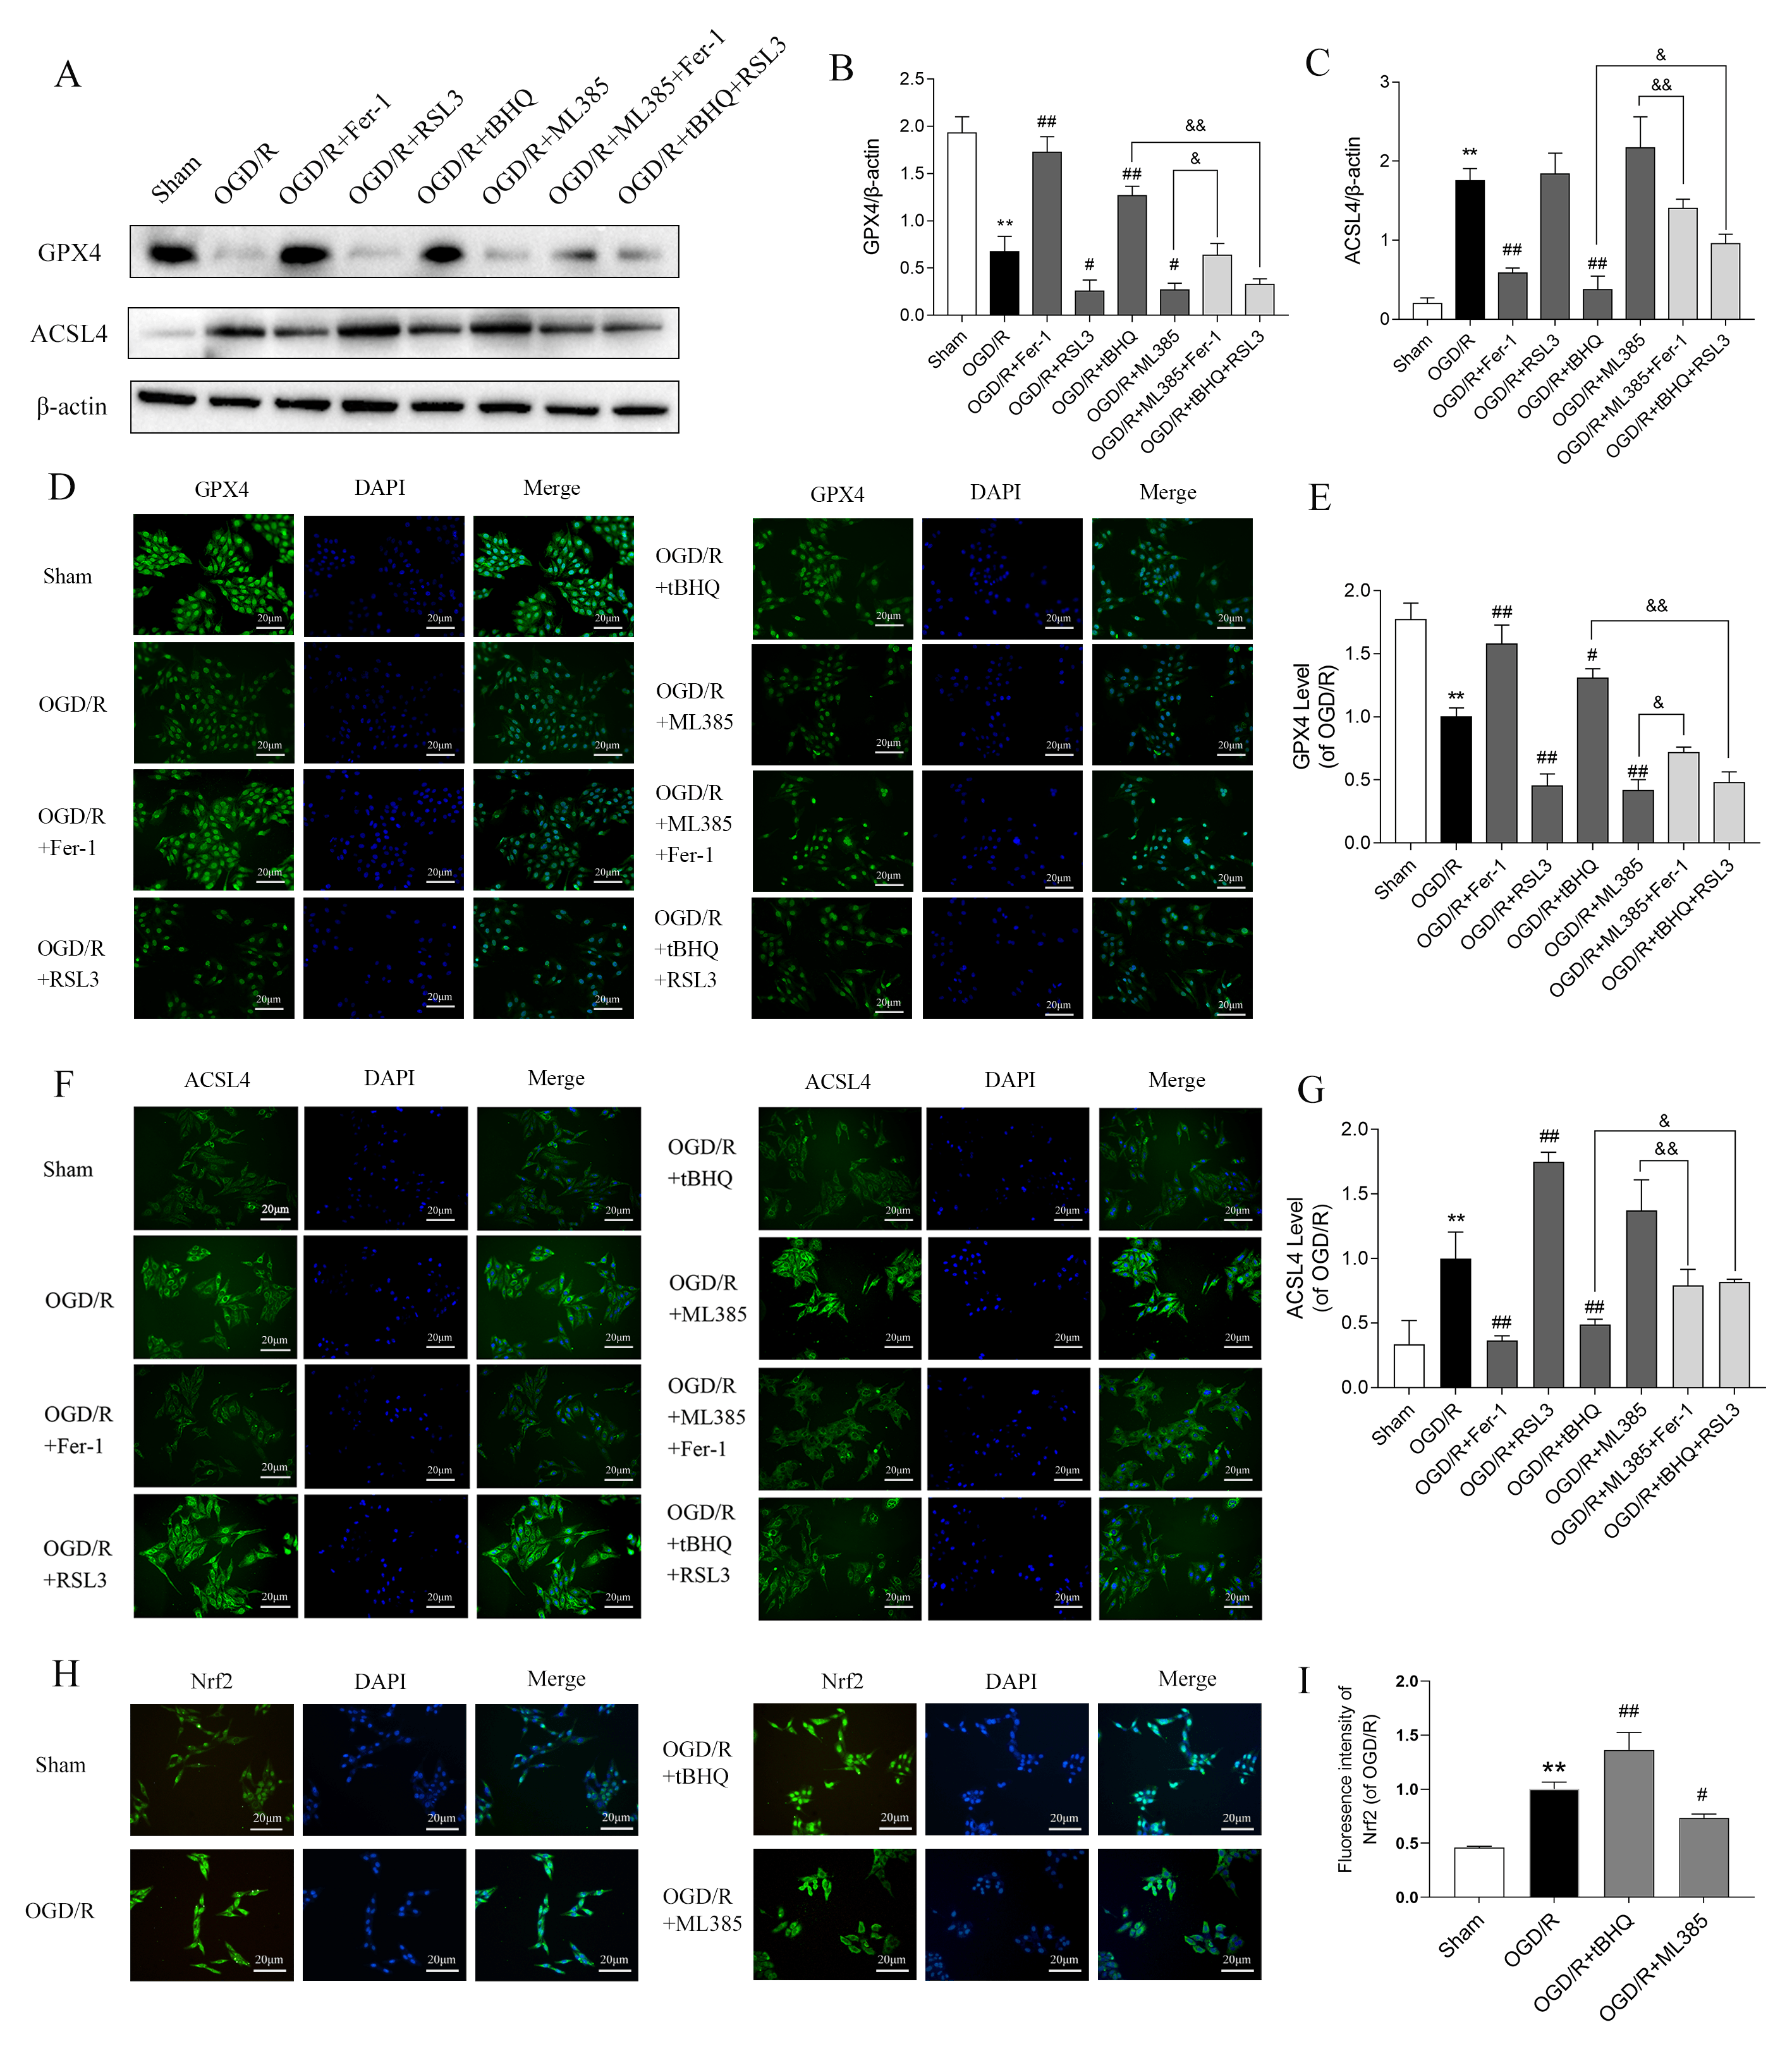
To further explore the mechanism by which Nrf2 modulates ferroptosis under OGD/R, we studied the key regulatory proteins level involved in ferroptosis. OGD/R treatment resulted in a remarkable reduction in GPX4 protein expression and a concomitant elevation in ACSL4 protein levels in SH-SY5Y cells, as shown by WB and immunofluorescence measurements. However, Fer-1 (5 µM) and RSL3 (50 nM) (HY-100218A, MedChemExpress, Monmouth Junction, NJ, USA) counteracted and intensified these alterations, respectively. Following treatment with tBHQ (40 µM), ACSL4 levels were decreased and GPX4 levels increased. In contrast, treatment with ML385 (20 µM) had the opposite effects. Furthermore, the combination of ML385 + Fer-1 and tBHQ + RSL3 attenuated these effects (Fig. 2A–G). The original western blotting images can be found in the Supplementary Materials.
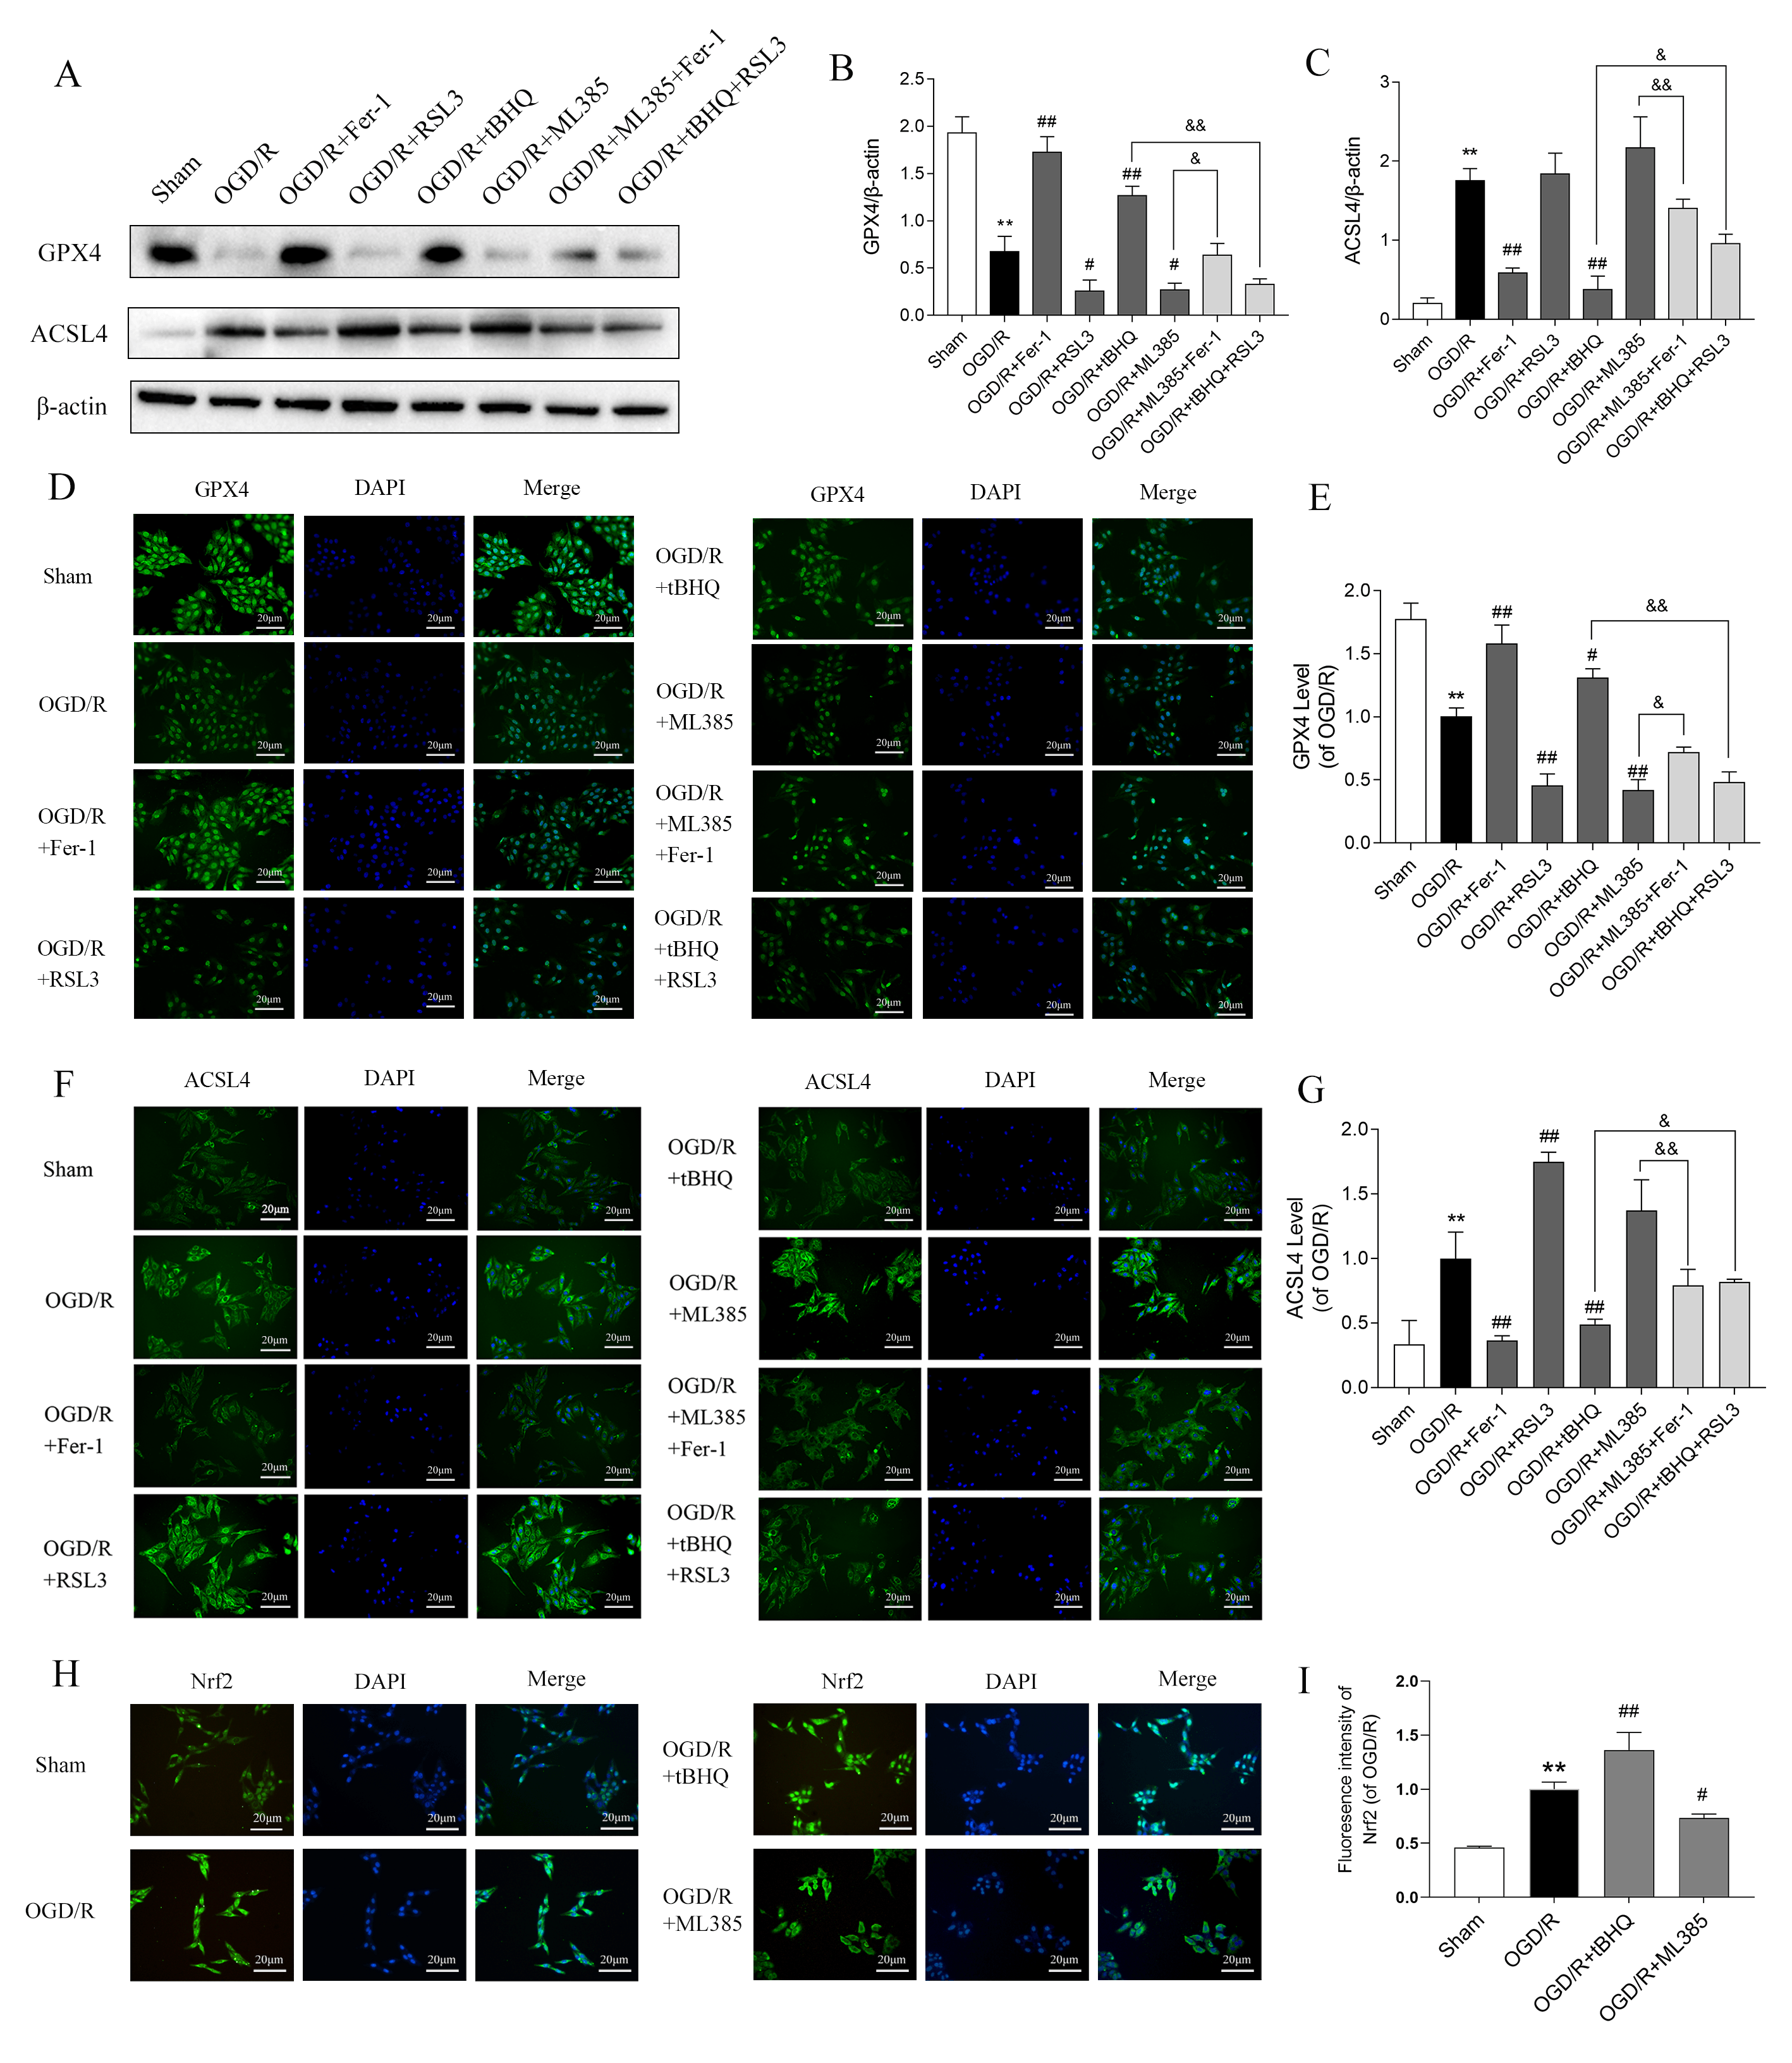 Fig. 2.
Effect of Nrf2 on ferroptosis-related protein levels in
SH-SY5Y cells treated with OGD/R. (A) Western blotting was performed to detect
the expression levels of GPX4 and ACSL4 (n = 3). (B,C) Quantitative analysis of
GPX4 and ACSL4 expression, normalized to the internal control
Through a series of biological processes including nuclear translocation, interaction with antioxidant response elements, activation of downstream antioxidant gene transcription, and regulation of critical proteins implicated in ferroptosis, Nrf2 inhibits ferroptosis and attenuates cellular injury. Therefore, in the OGD/R model, we performed immunofluorescence staining to analyze the nuclear translocation of Nrf2. The findings revealed that OGD/R promoted the nuclear translocation of Nrf2. This was further intensified by tBHQ treatment, but inhibited by ML385 (Fig. 2H,I). Together, these findings indicate that Nrf2 inhibits ferroptosis in OGD/R-treated SH-SY5Y cells by up-regulating GPX4 and down-regulating ACSL4 after entering the nucleus.
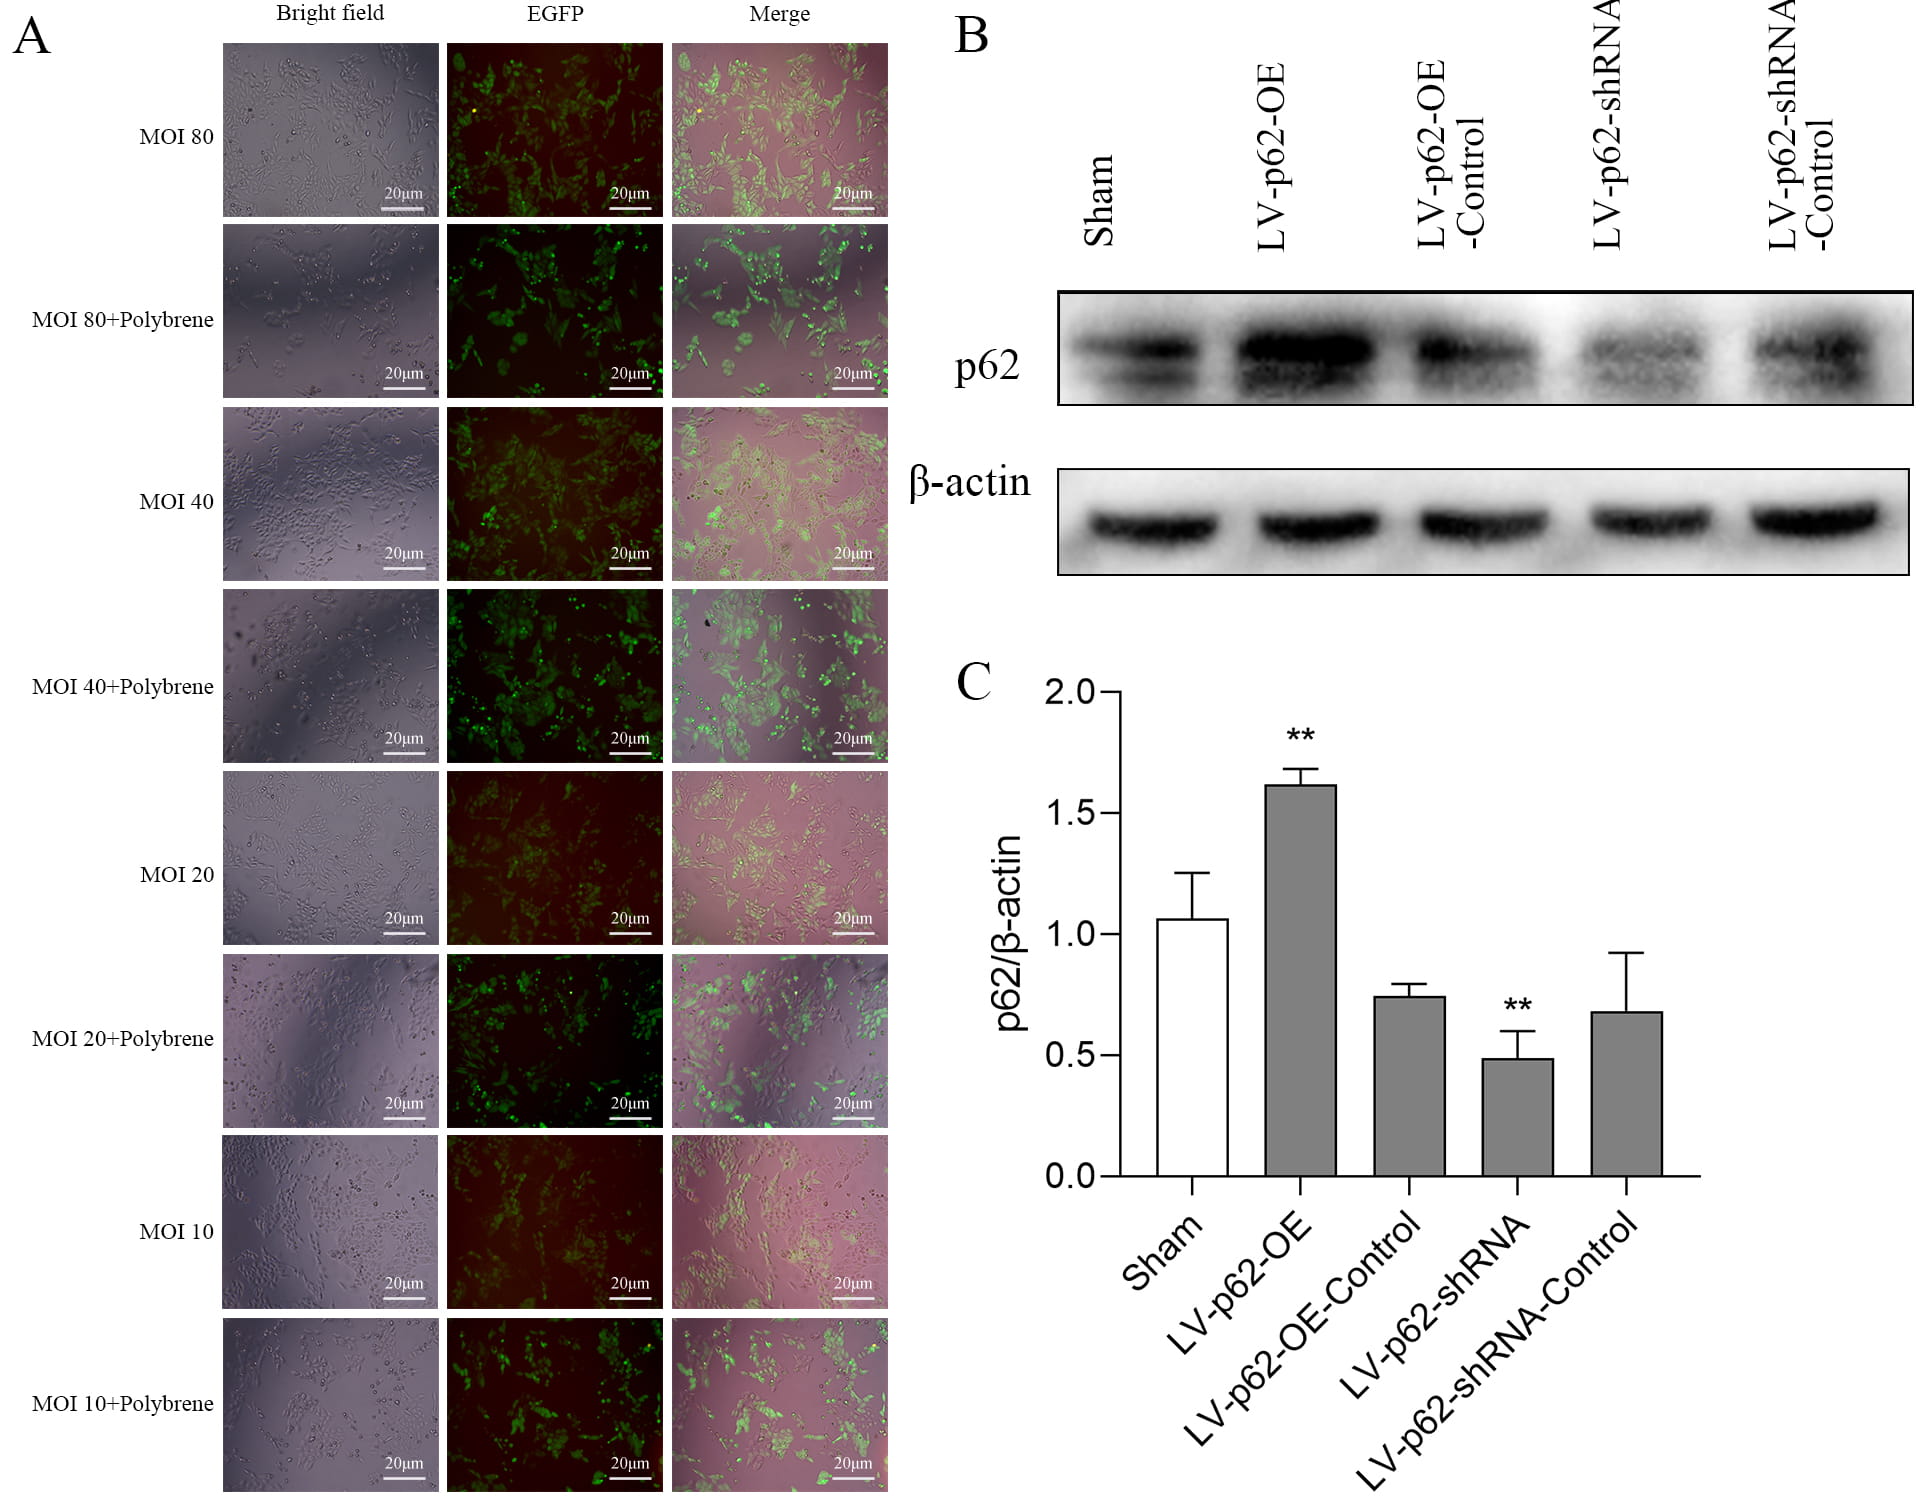
Based on the fluorescence images of the lentivirus (LV)-infected cells, our multiplicity of infection (MOI) pre-experimental data, and previous findings [16], LV-p62-OE with MOI = 40 and LV-p62-shRNA with MOI = 20 were selected as optimal conditions for infection efficiency (Fig. 3A). The significant overexpression of p62 by LV-p62-OE and the knockdown efficiency of p62 by LV-p62-shRNA were confirmed via immunofluorescence and Western blotting (Fig. 3A–C).
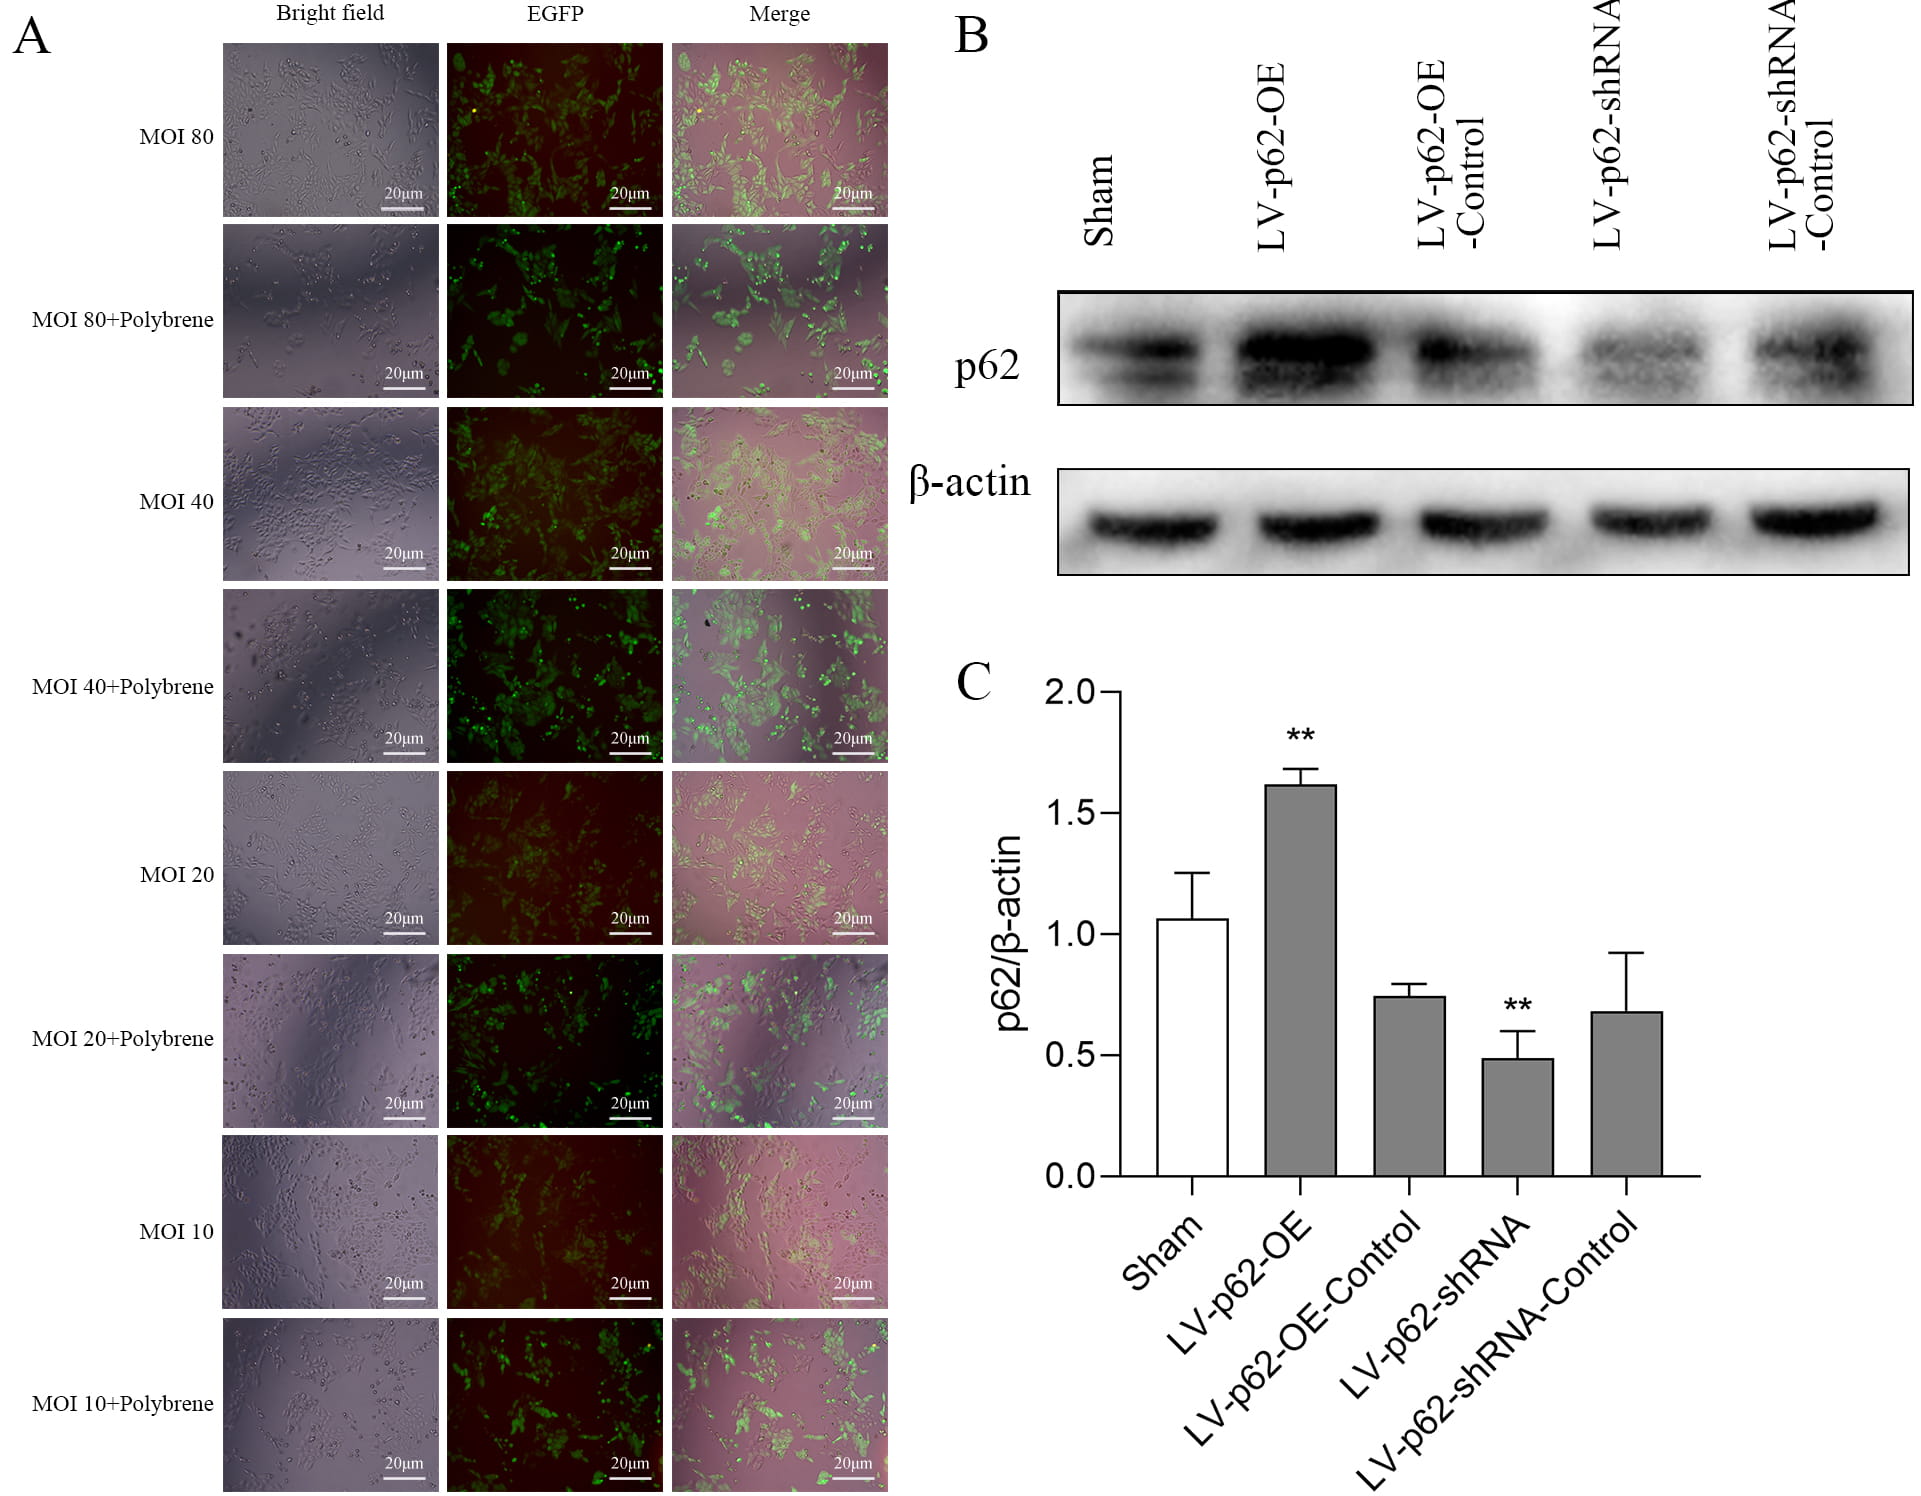 Fig. 3.
Validation of p62 lentivirus transfection of SH-SY5Y
cells. (A) EGFP autofluorescence in SH-SY5Y cells after lentiviral transfection
with p62 with different MOIs for 72 h. (B) Protein expression of p62 detected
using western blotting. (C) Quantitative analysis of p62 protein expression
levels, normalized to the internal control
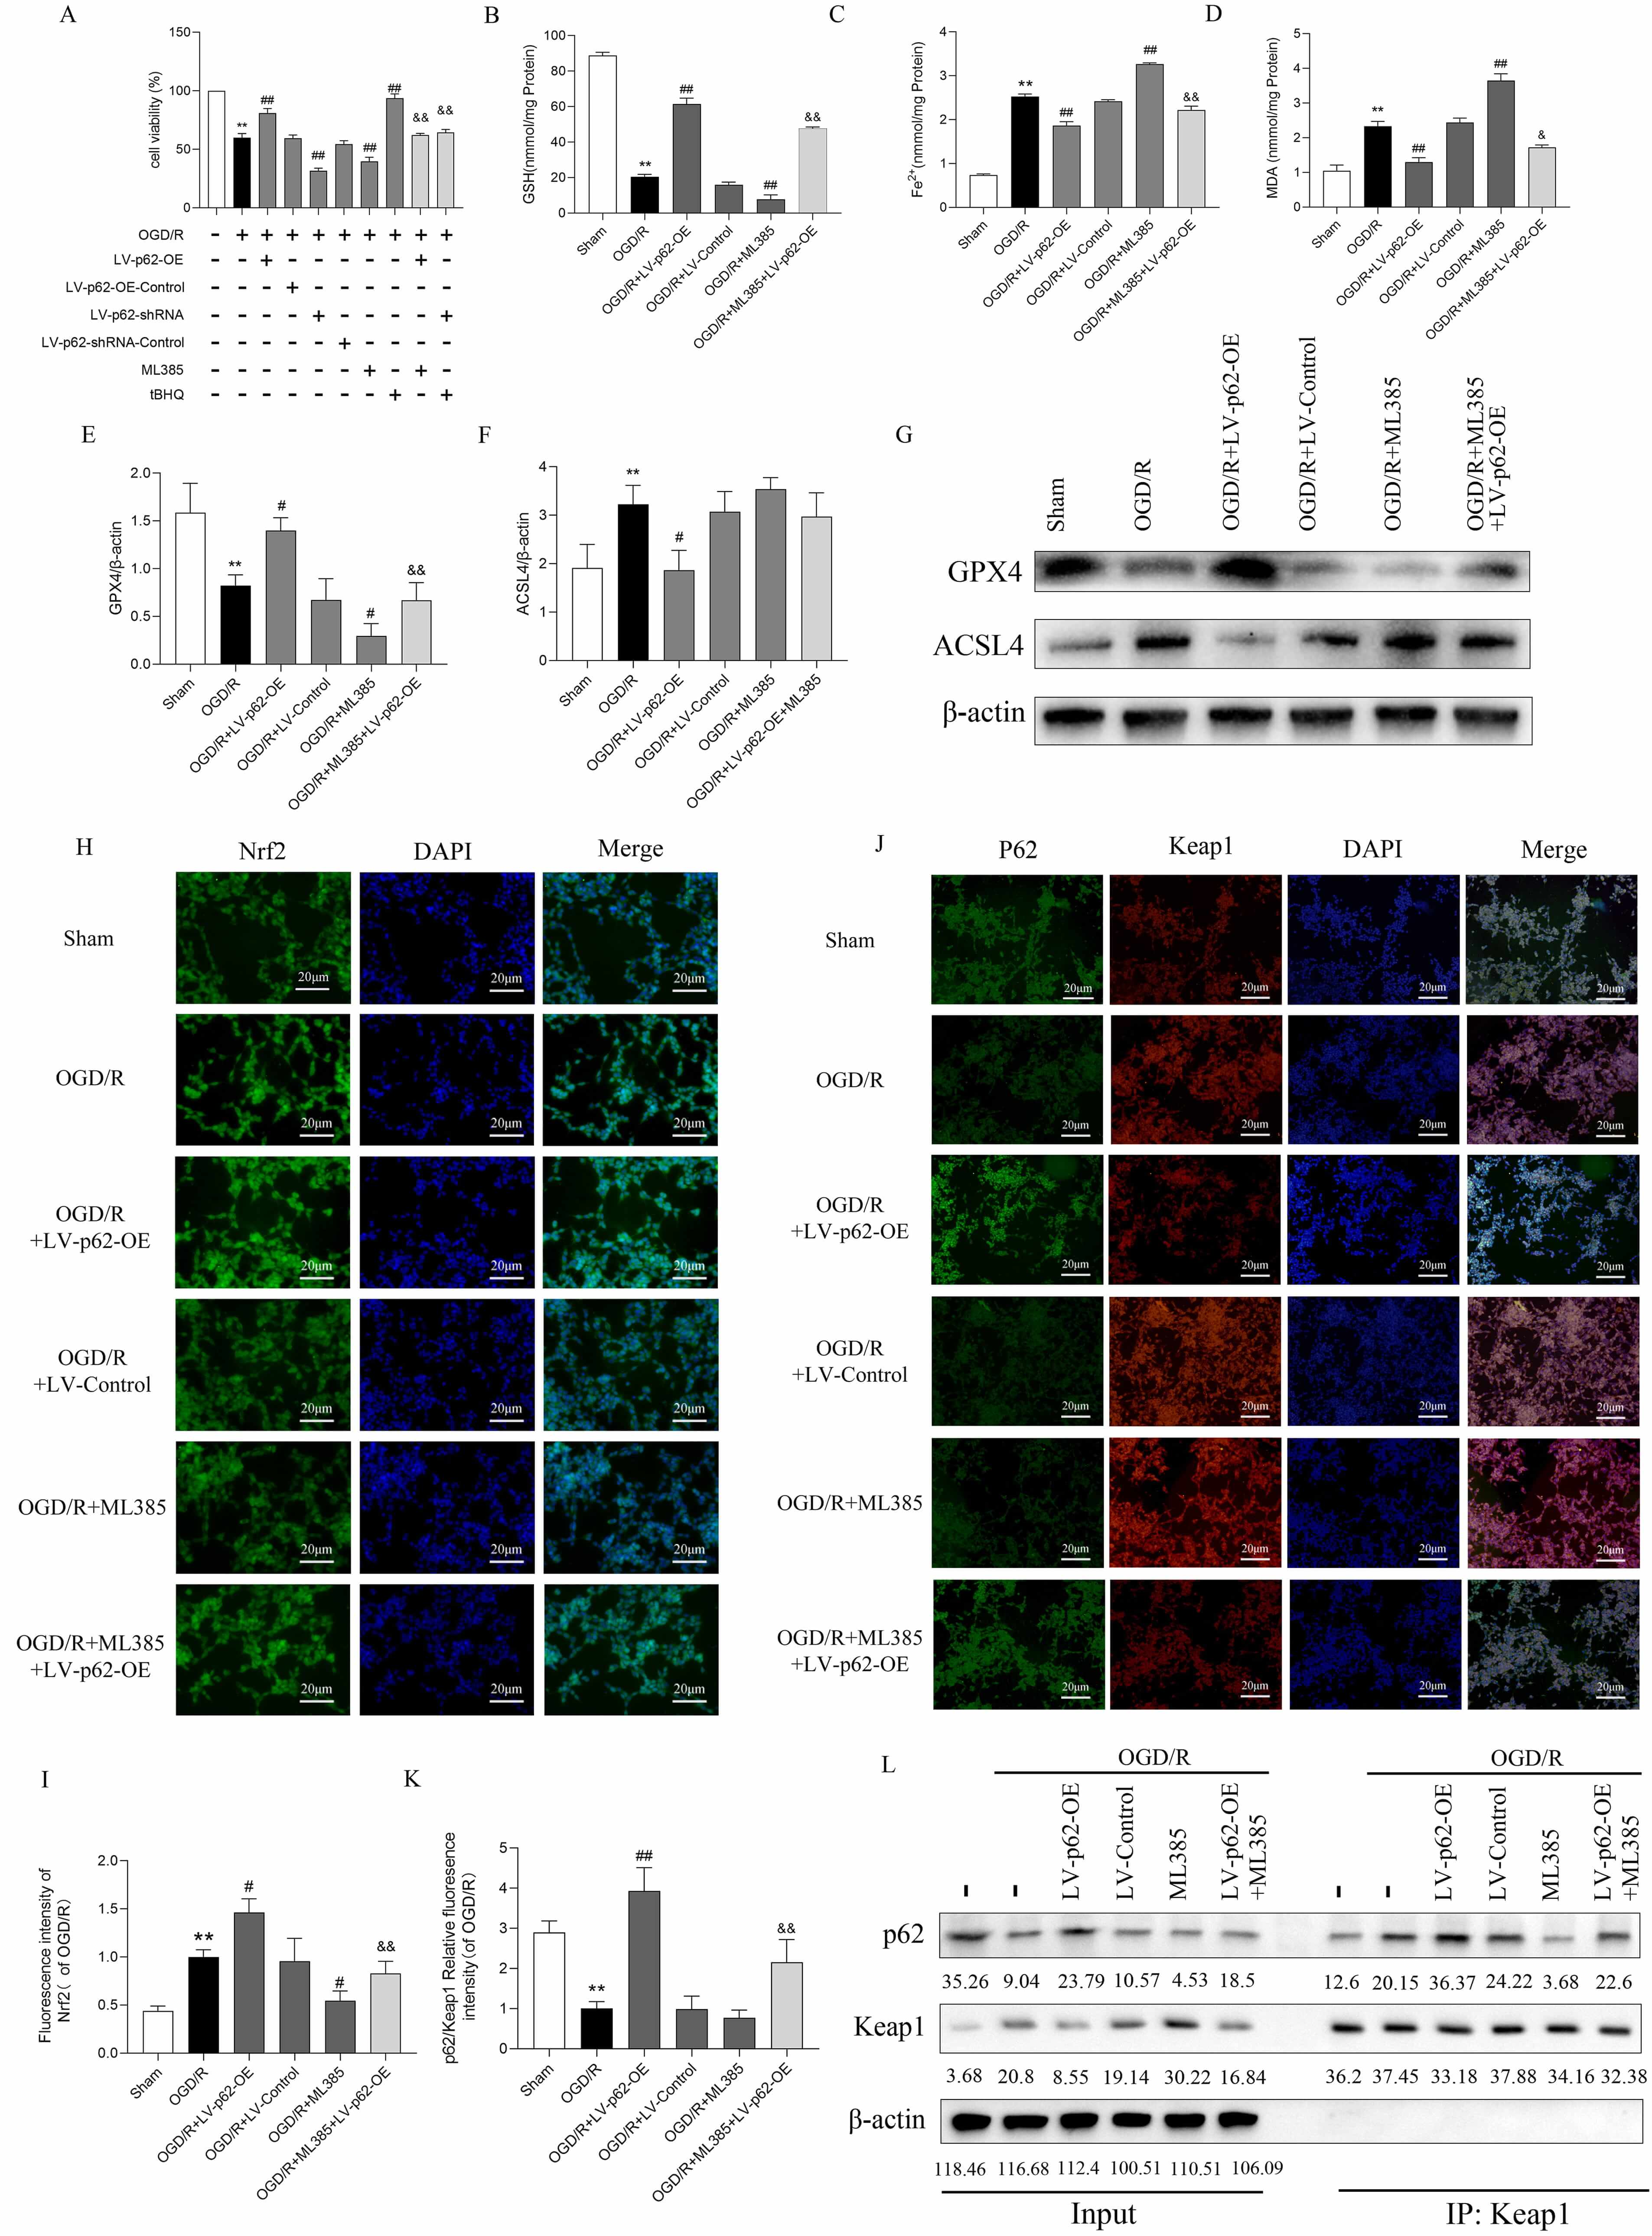
Some research [12, 13] has demonstrated that p62 interacts with Keap1 directly to control the synthesis of Nrf2 in response to oxidative stress. Consequently, we investigated whether p62 inhibits ferroptosis by activating Nrf2, which helps reduce damage. Cell viability assays revealed that LV-p62-OE and tBHQ (40 µM) increased cell viability after OGD/R treatment, while LV-p62-shRNA and ML385 (20 µM) diminished it (Fig. 4A). Additionally, treatment with ML385 and tBHQ partially counteracted the effects of LV-p62-OE and LV-p62-shRNA, respectively. LV-p62-OE enhanced intracellular GSH and GPX4 levels and decreased Fe2+, MDA, and ACSL4 levels after OGD/R, while ML385 (20 µM) had the opposite effects. Further, treatment with ML385 partially blocked the effects of LV-p62-OE, suggesting that Nrf2 mediated the influence of p62 in the p62/Nrf2/Keap1 pathway and that overexpression of p62 inhibited ferroptosis by controlling Nrf2 after OGD/R (Fig. 4B–G).
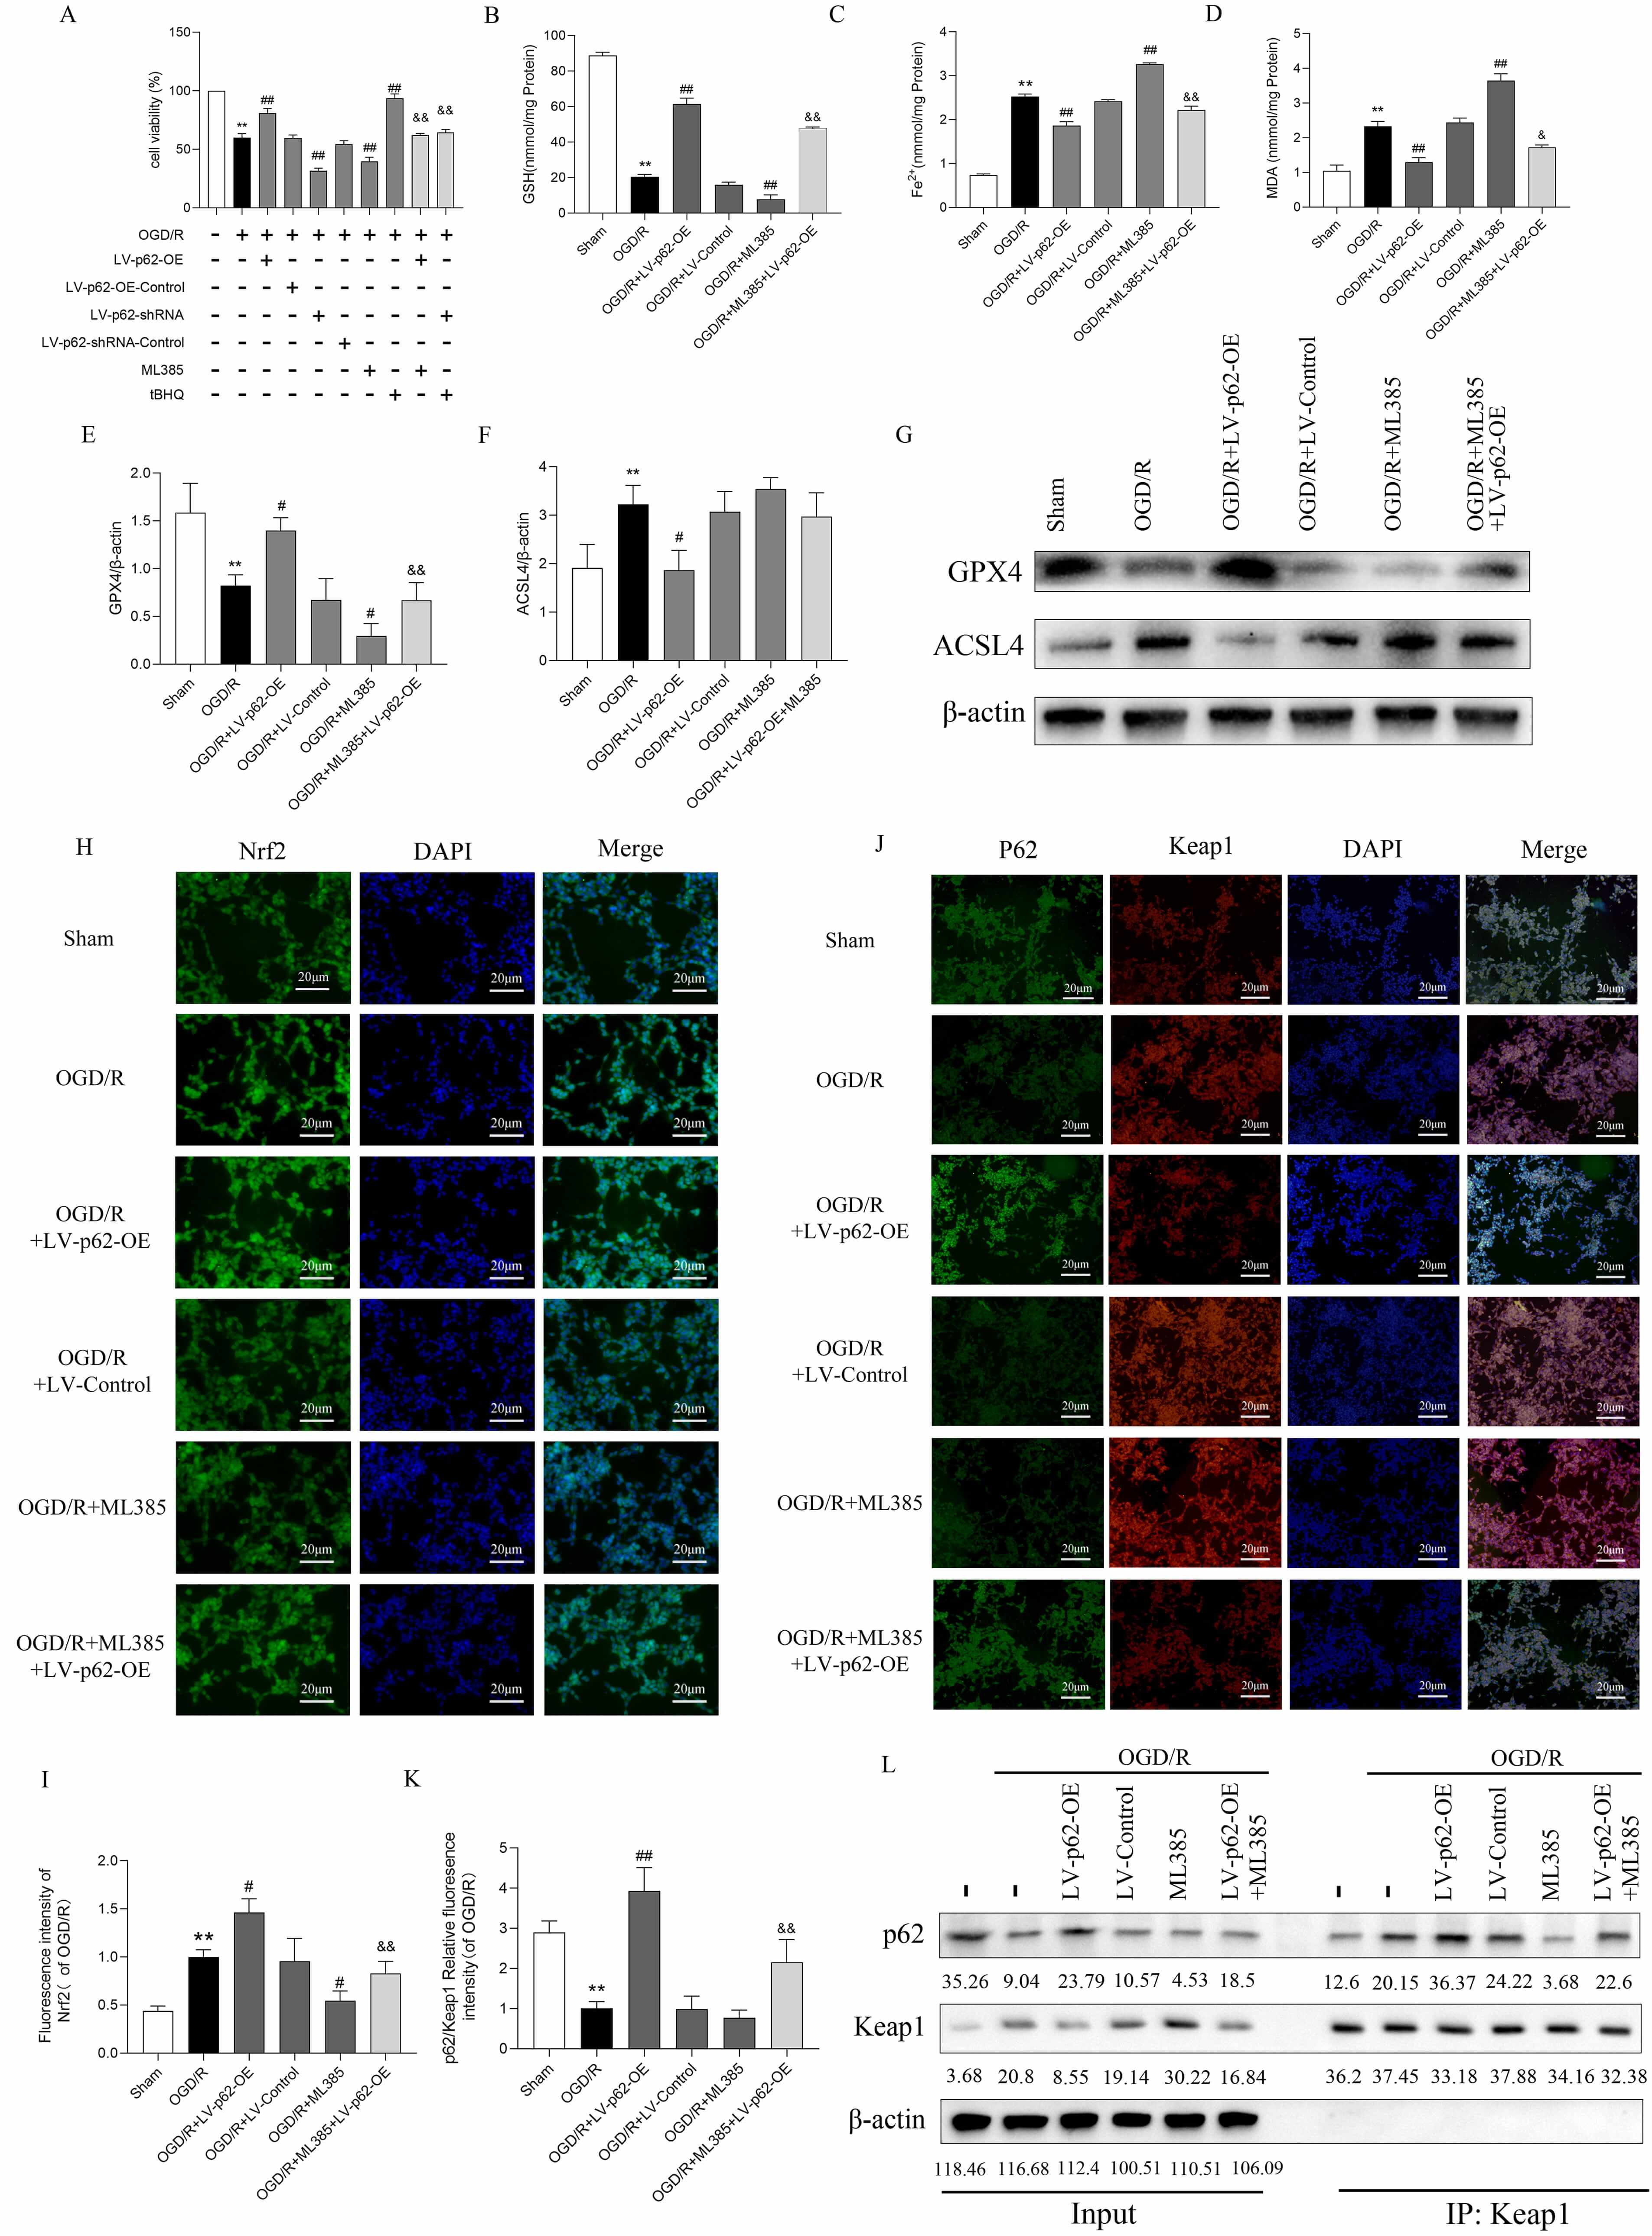 Fig. 4.
p62 interacts with Keap1 to activate Nrf2 and inhibit
ferroptosis. (A) Cell viability. Values are shown as mean
Next, we explored the possible interaction between p62 and Keap1, as well as the consequent activation of Nrf2. Immunofluorescence results revealed that the nuclear translocation of Nrf2 following OGD/R was markedly enhanced after LV-p62-OE transfection and notably reduced by ML385 treatment (Fig. 4H,I). Furthermore, immunofluorescence double staining revealed a decrease in p62 expression following OGD/R, along with a reduced fluorescence intensity ratio of p62 to Keap1. In contrast, the fluorescence ratio of p62 relative to Keap1 was significantly increased following LV-p62-OE transfection (Fig. 4J,K), suggesting that overexpression of p62 promoted its binding to Keap1 following OGD/R.
Co-immunoprecipitation (Co-IP) experiments demonstrated an enhanced association between p62 and Keap1 after OGD/R, which was intensified further after LV-p62-OE transfection (Fig. 4L). Conversely, ML385 suppressed the interaction between Keap1 and p62 and reversed the effects of LV-p62-OE. Overexpression of p62 may activate Nrf2 via binding to Keap1, thereby suppressing ferroptosis and thus mitigating cell injury; Nrf2 may mediate the activity of p62 through a positive feedback loop of the p62/Keap1/Nrf2 signaling pathway. These findings show that p62 overexpression promotes p62 binding to Keap1, activating Nrf2, which inhibits cellular ferroptosis.
To investigate how the p62/Keap1/Nrf2 pathway regulate ferroptosis in rats with CIRI, an MCAO/R animal model was established. This pathway was activated by the intraperitoneal injection of Fer-1 and sulforaphane, and injection of LV-p62-OE into the lateral ventricle.
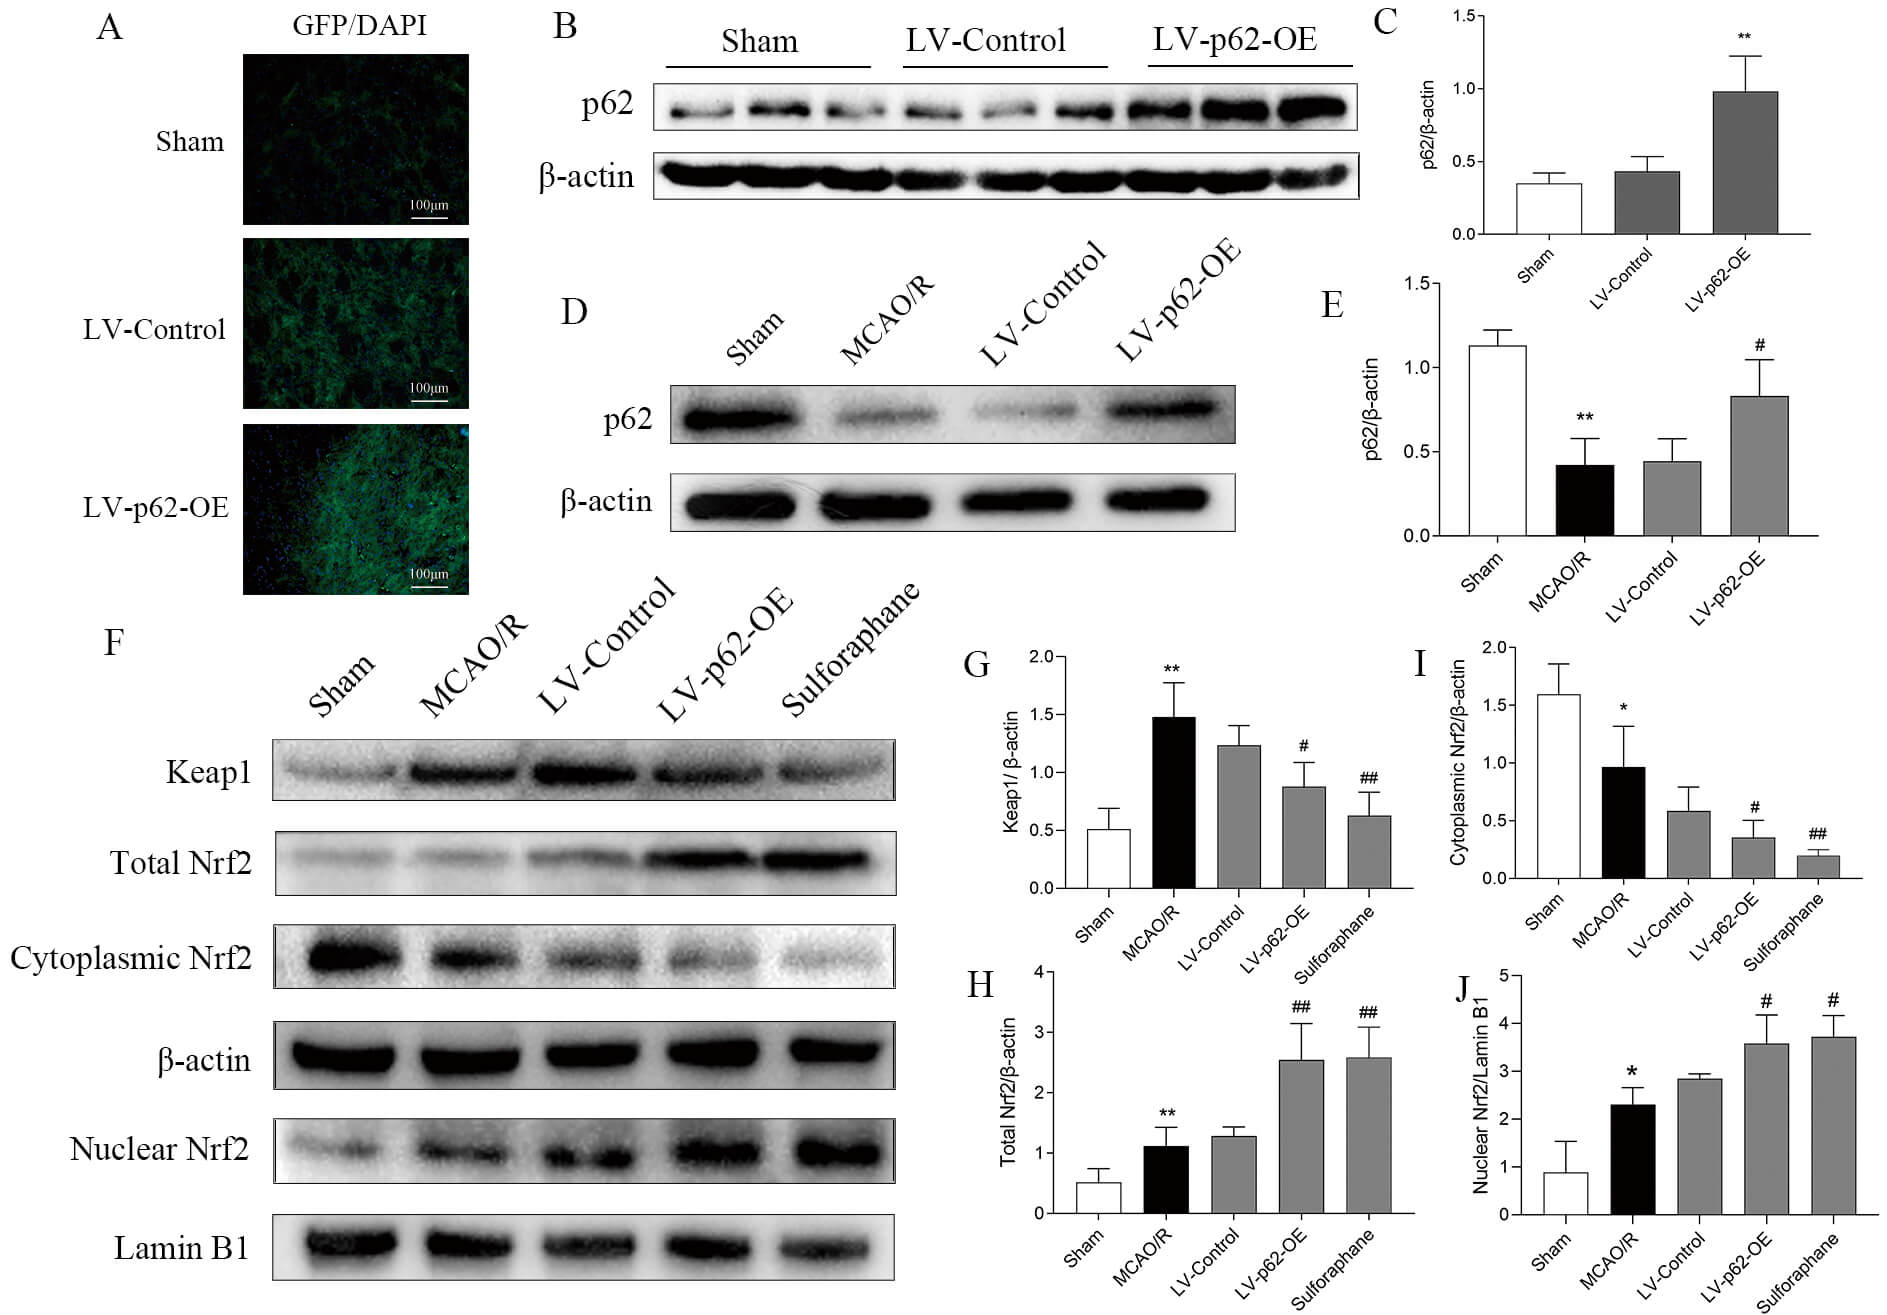
Western blotting and immunofluorescence revealed a marked increase in p62 protein expression levels in the brain tissue of SD rats following LV-p62-OE transfection (Fig. 5A–C). Protein expression analysis revealed that MCAO/R decreased levels of cytoplasmic Nrf2 and p62 and increased those of Keap1 and total Nrf2. Conversely, LV-p62-OE transfection and treatment with sulforaphane resulted in elevated expression of total Nrf2 and p62, along with decreased expression of Keap1 and cytoplasmic Nrf2 (Fig. 5D–J). These findings corroborate the outcomes of the in vitro experiments and reveal that p62 overexpression can boost the p62/Keap1/Nrf2 pathway.
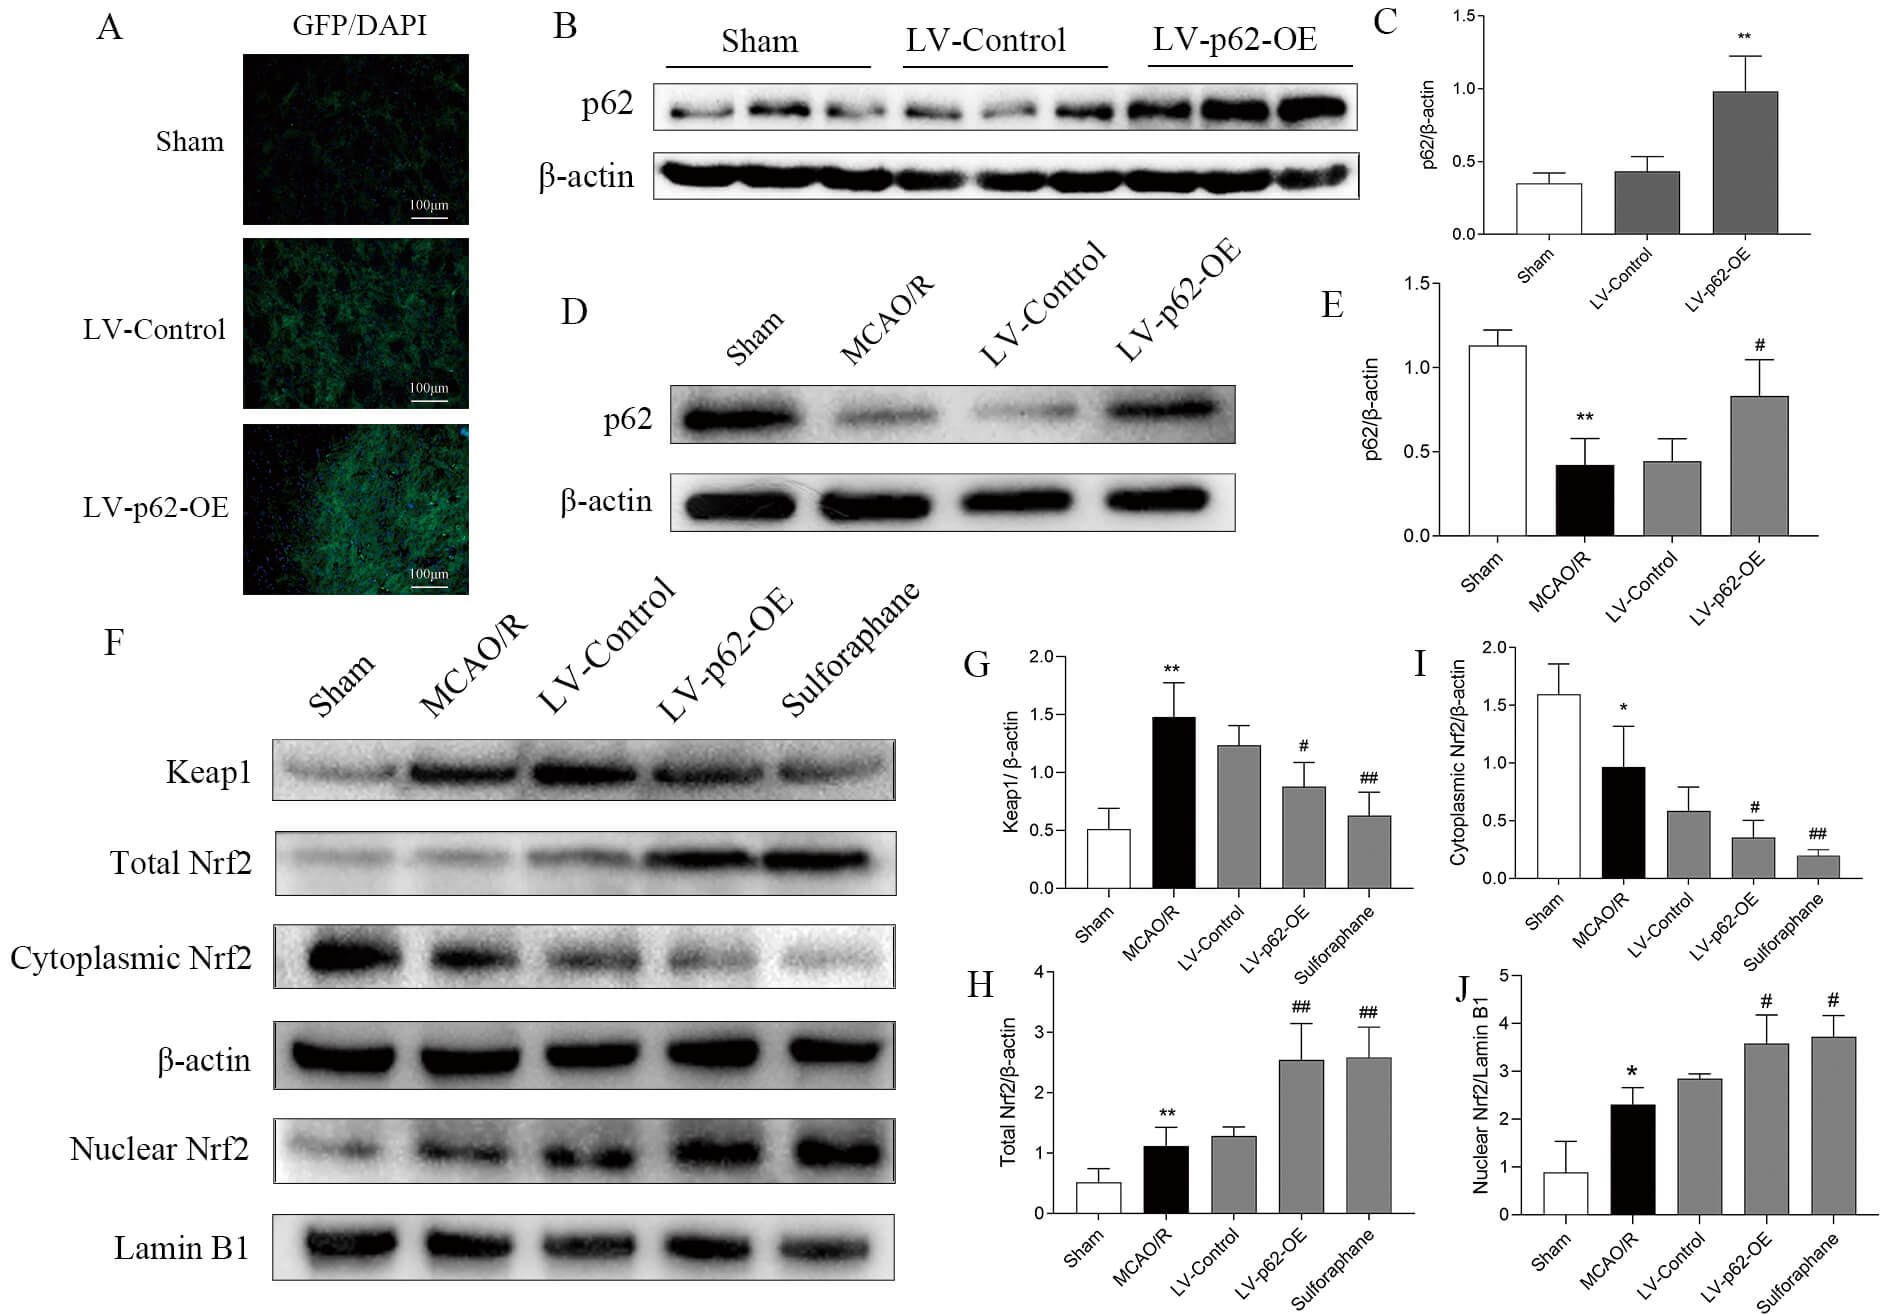 Fig. 5.
Effect of MCAO/R and sulforaphane, and LV-p62-OE treatment on the p62/Keap1/Nrf2 pathway. (A) Representative images of lentivirus
autofluorescence captured three weeks after the transfection of LV-p62-OE into
the lateral ventricle. (B) Expression of p62 after transfection as detected by
western blotting. (C) Quantitative analysis of p62 relative to
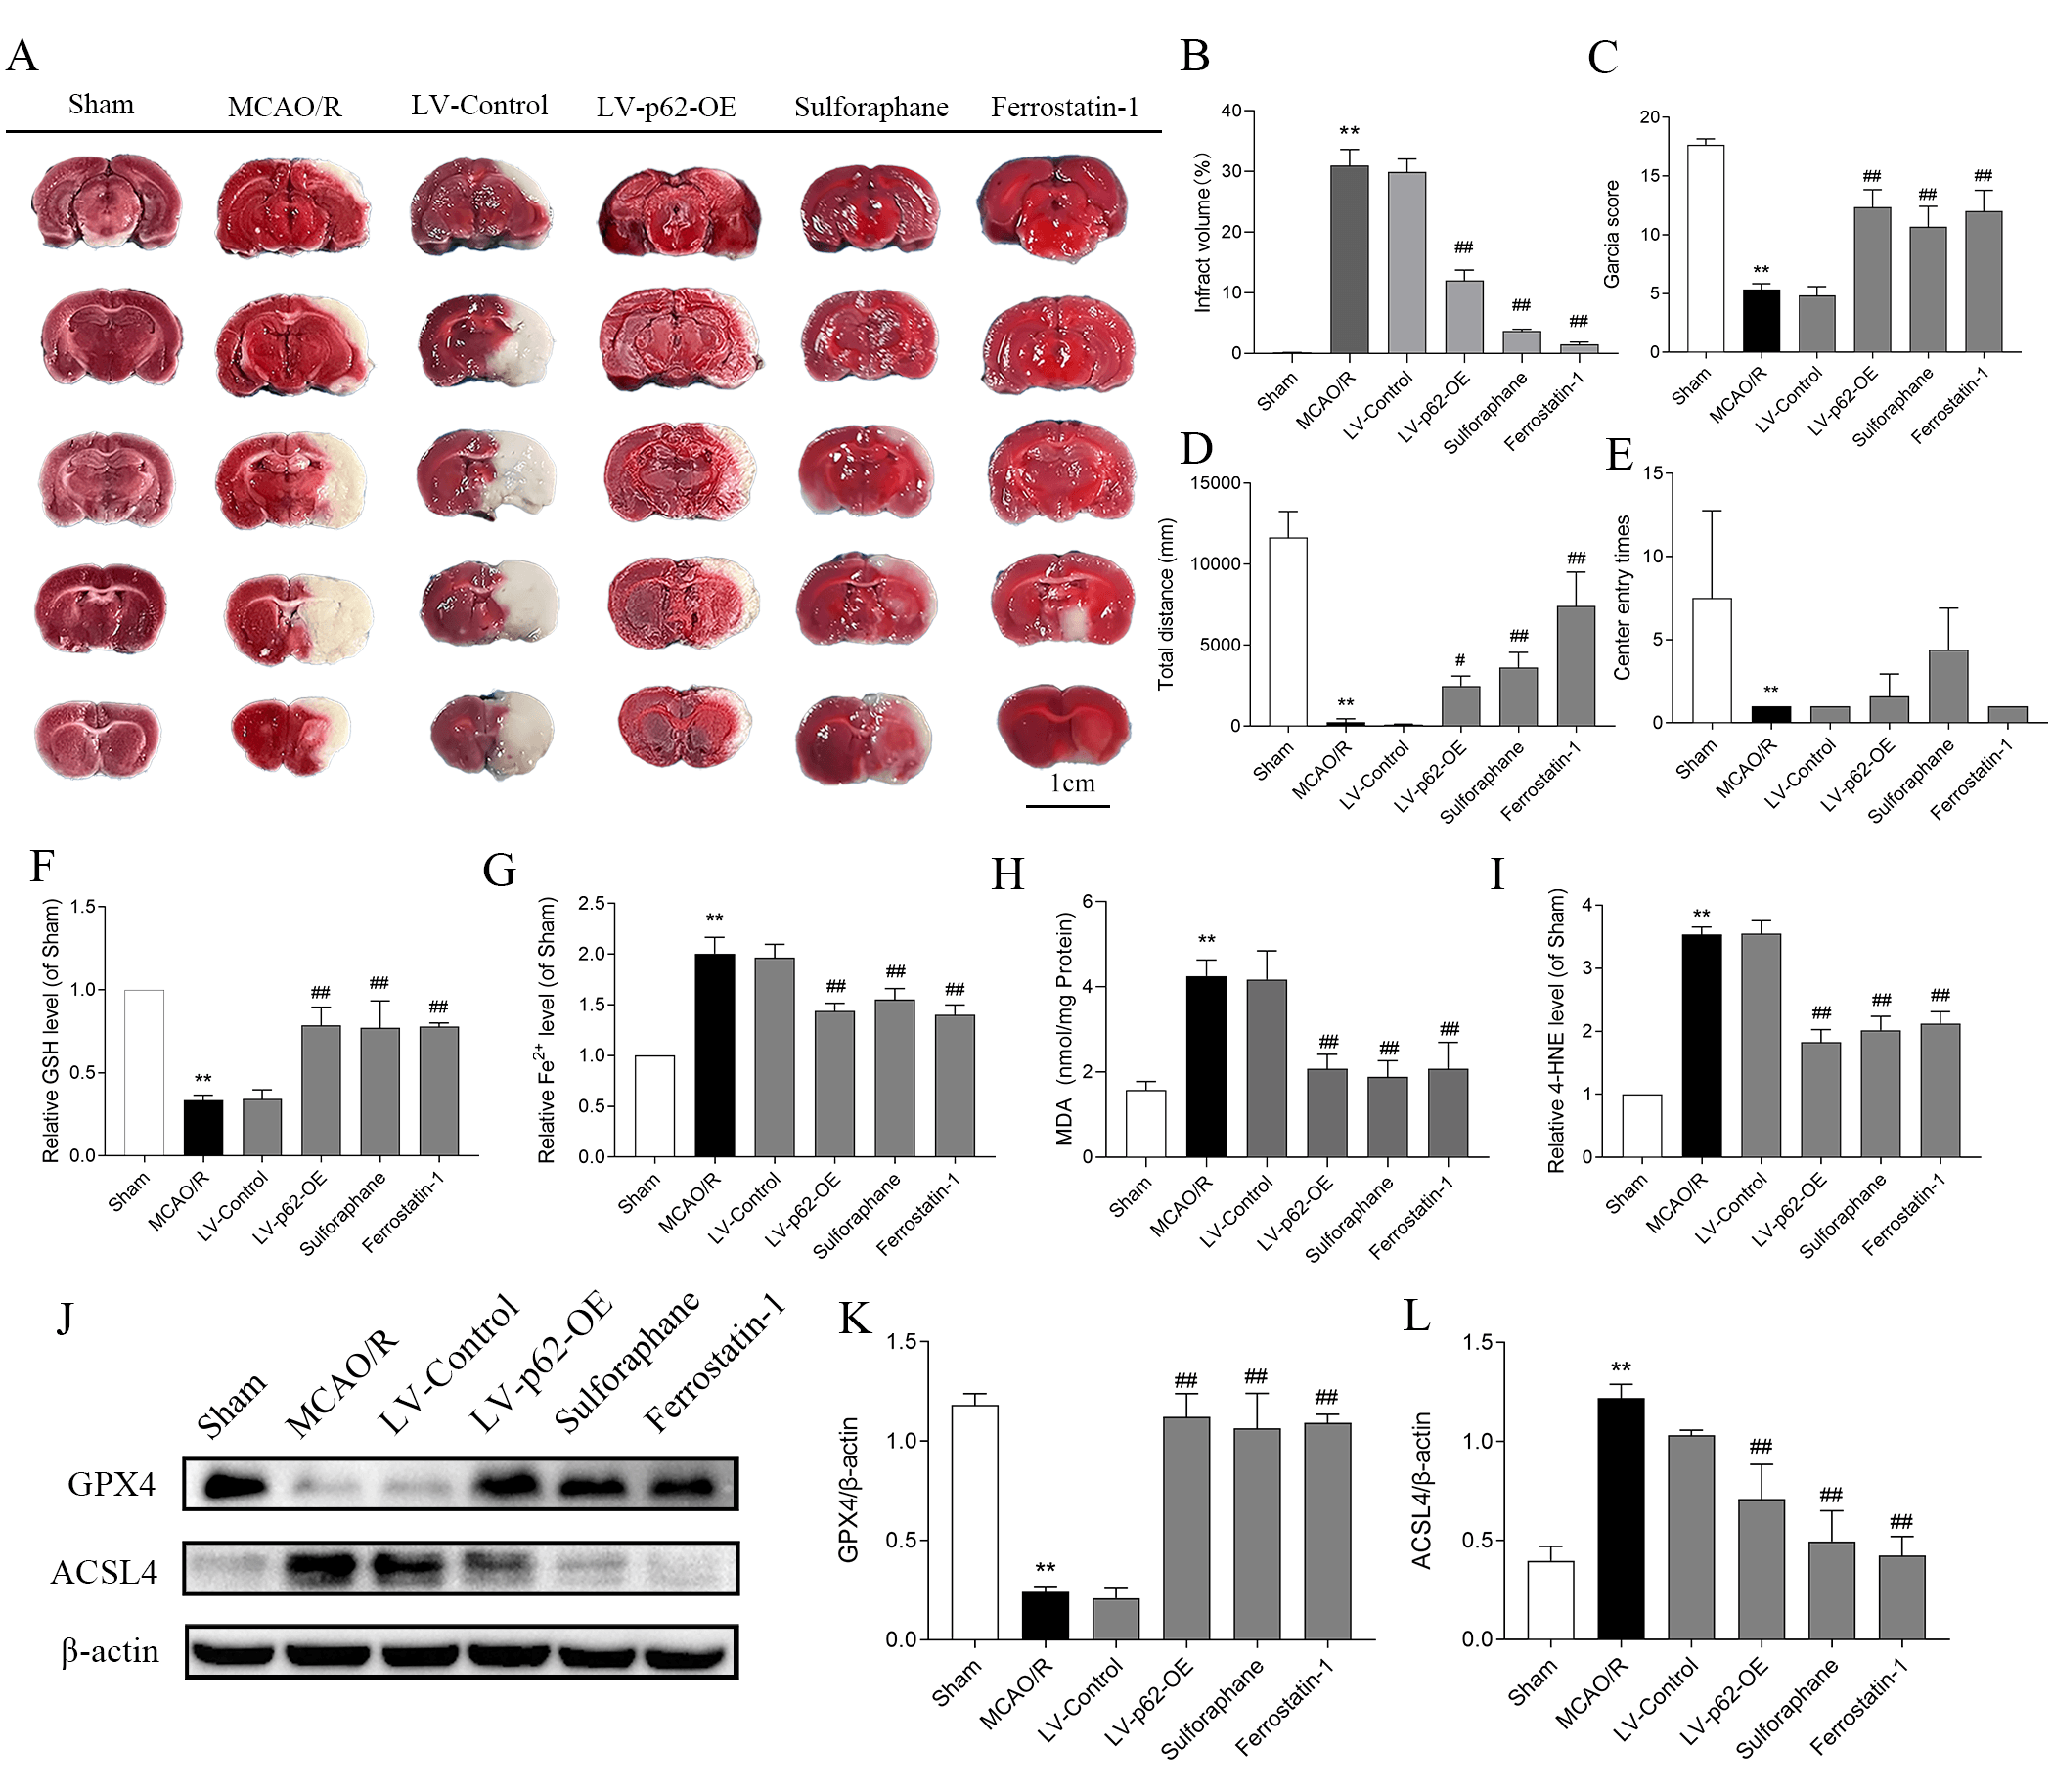
Following treatment with MCAO/R in the brain injury test, TTC staining showed large white infarcts in the right region of the coronal section of the rat brains (Fig. 6A,B). Garcia neurological function scores declined dramatically, and the total distances traveled by rats in the open field experiments decreased. Fewer entries into the central area were also recorded. In contrast, interventions involving LV-p62-OE, sulforaphane, and Fer-1 led to a substantial decrease in TTC infarct size, together with improvements in both the Garcia score and total distance traveled (Fig. 6C–E). The activation of the p62/Keap1/Nrf2 pathway may, therefore, improve neurological dysfunction and attenuate CIRI in rats.
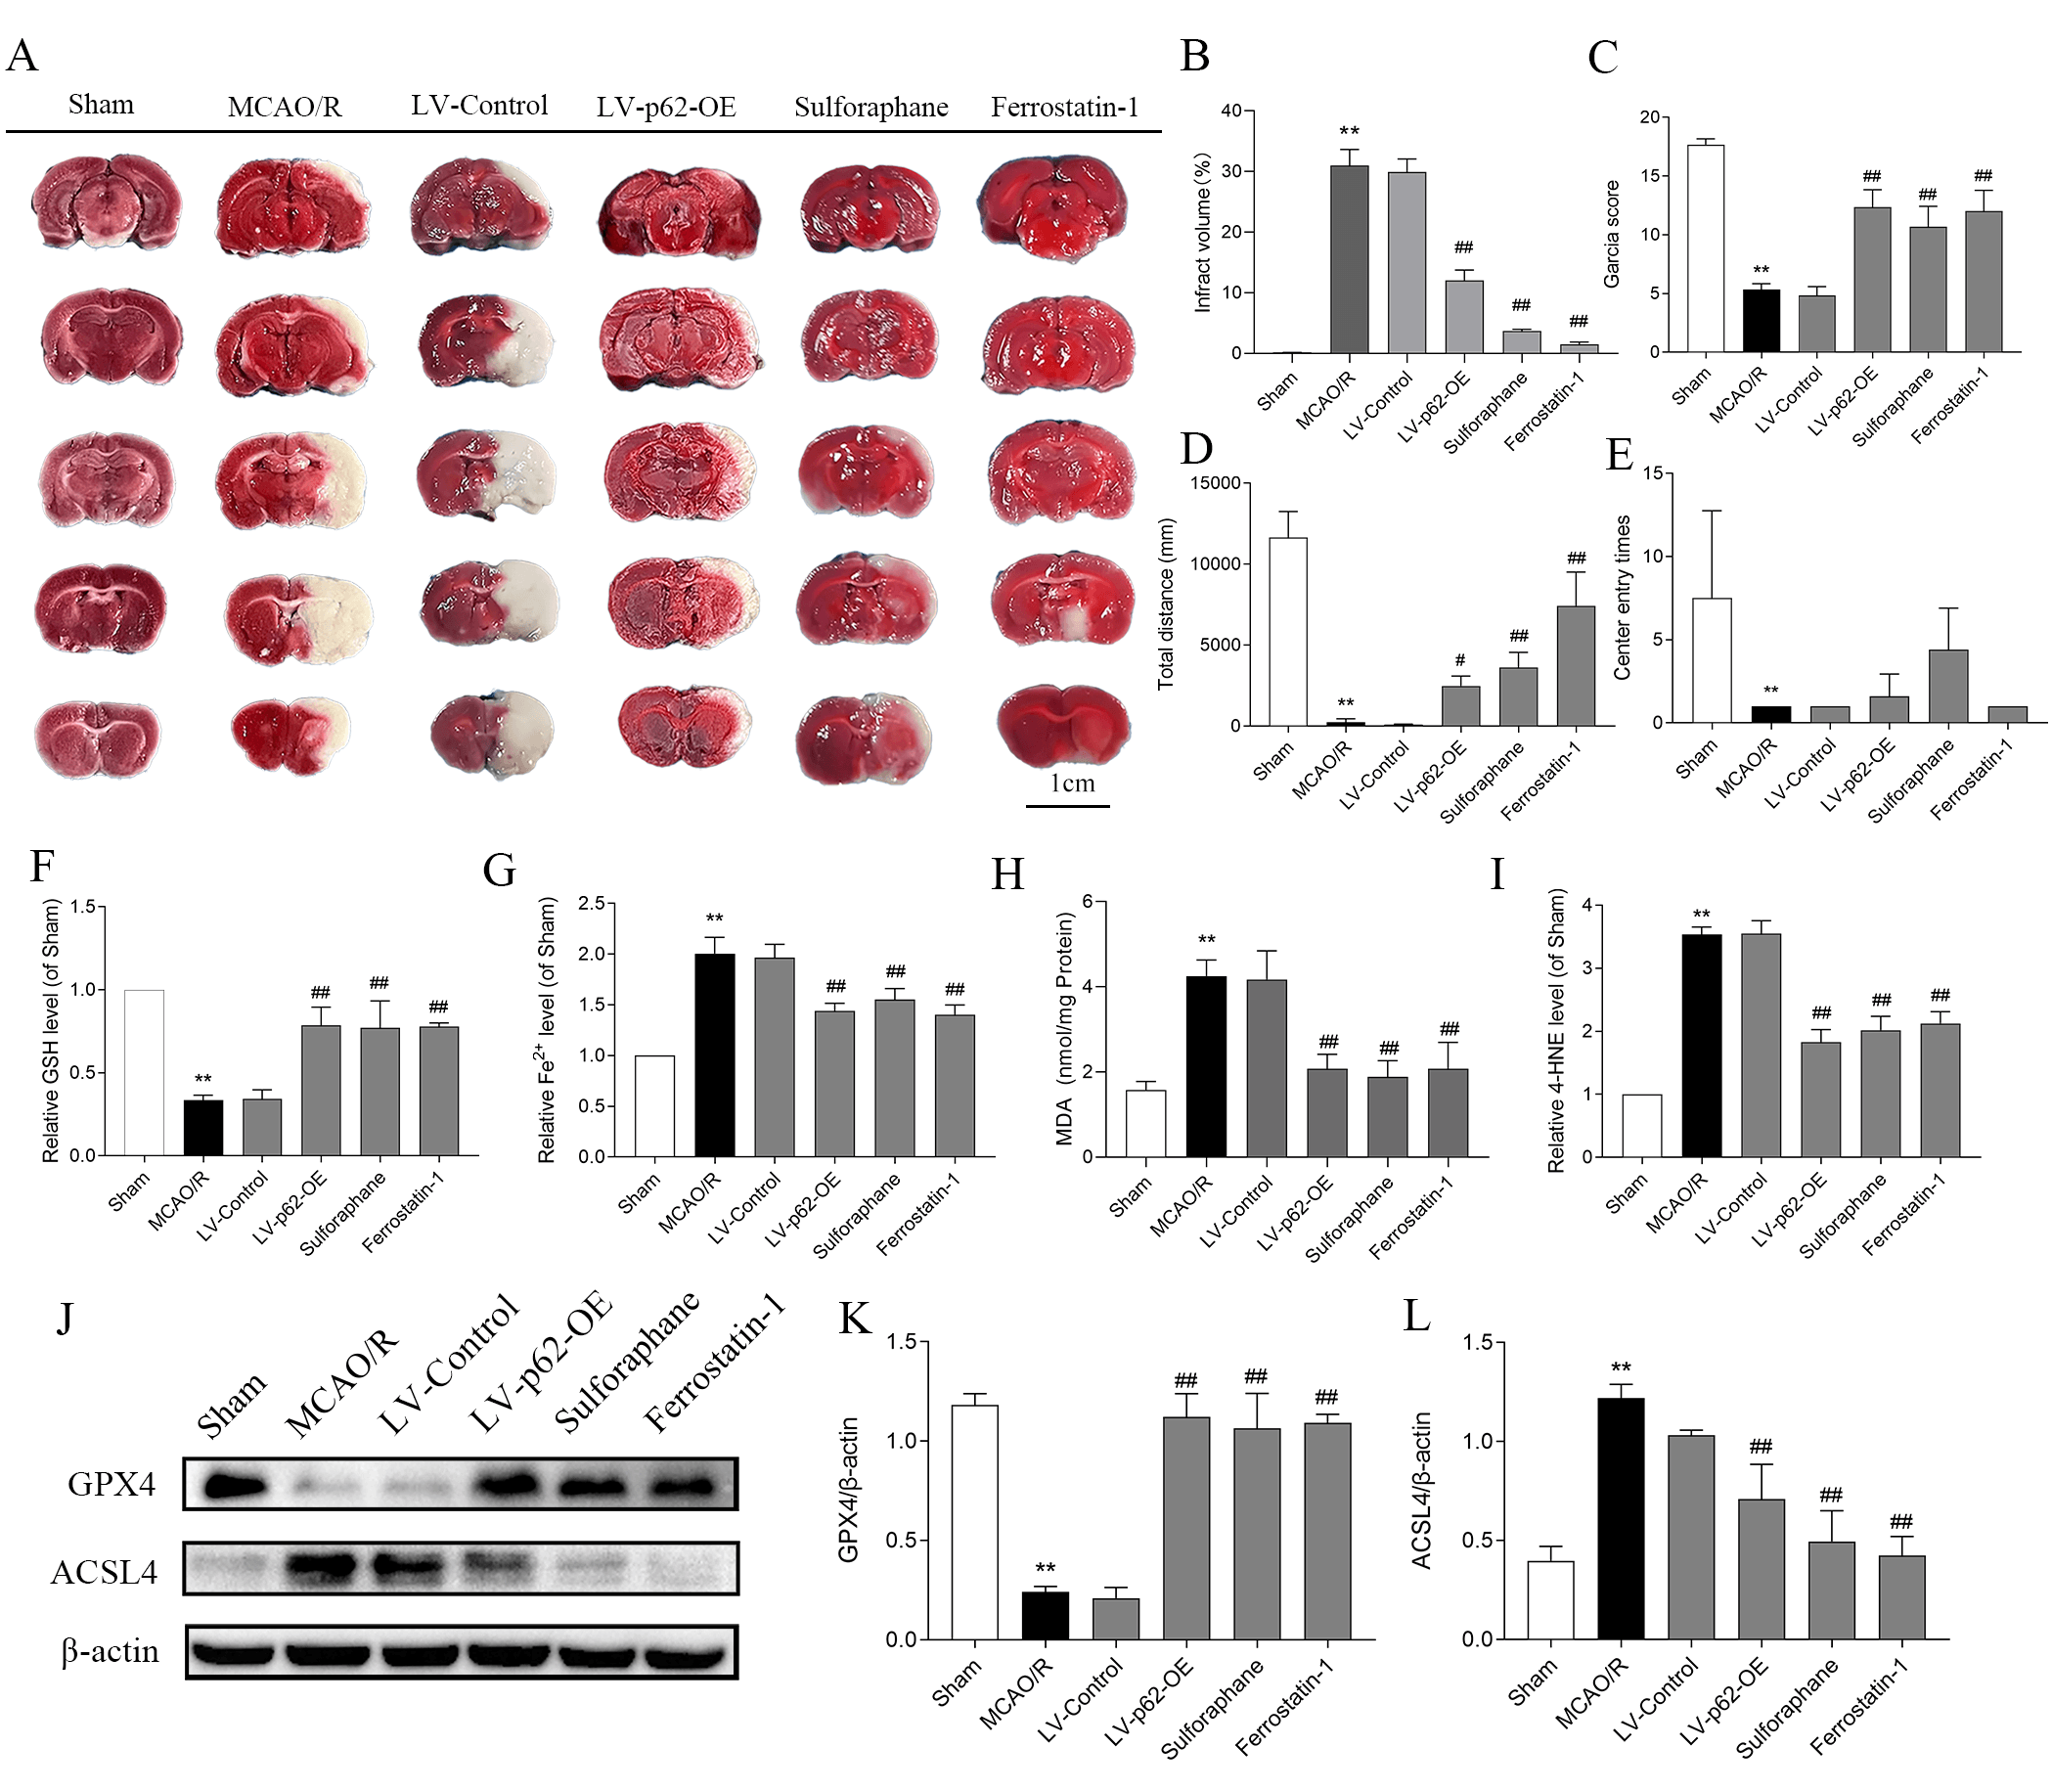 Fig. 6.
Activation of the p62/Keap1/Nrf2 pathway inhibits ferroptosis and alleviates cerebral ischemia-reperfusion injury in rats. (A)
2,3,5-triphenyltetrazolium chloride staining detects infarcts in the brain
slices; the white area indicates the infarct area. (B) Quantitative analysis of cerebral infarction volume (n = 3). (C) Garcianeural function score. Values are shown as mean
Finally, in the ferroptosis assay, GSH and GPX4 levels were reduced dramatically after MCAO/R, while Fe2+, MDA, 4-HNE, and ACSL4 levels increased. These effects were reversed by LV-p62-OE, sulforaphane, and Fer-1 (Fig. 6F–L), suggesting that activation of the p62/Keap1/Nrf2 pathway is capable of inhibiting ferroptosis and mitigating cellular damage.
In summary, p62 overexpression activated the pathway, suppressed ferroptosis in rat brain tissue following MCAO/R, and lessened brain injury.
These findings demonstrate that activating the p62/Keap1/Nrf2 pathway inhibited ferroptosis and reduced SH-SY5Y cell injury in vitro. Furthermore, activating this pathway alleviated CIRI in SD rats in vivo. First, Nrf2 was observed to attenuate OGD/R-induced SH-SY5Y cell damage through the negative regulation of ferroptosis, by down-regulating ACSL4 and up-regulating GPX4 after nuclear translocation. Second, our cells experiments revealed that p62 overexpression inhibited OGD/R-induced SH-SY5Y cell injury, lipid peroxide accumulation, and iron overload, suggesting that p62 alleviated OGD/R-induced damage in SH-SY5Y cells by suppressing ferroptosis. This occurred through the competitive binding of p62 to Keap1, releasing Nrf2 for nuclear translocation. Third, the in vivo experiments demonstrated that increasing p62 levels activated the pathway, triggering Nrf2 activation and ferroptosis suppression, which alleviated iron overload and antioxidant system imbalance during CIRI. This process helped limit neurological dysfunction and attenuate the degree of brain damage in rats. Both cell culture and animal experiments suggested that activating the p62/Keap1/Nrf2 pathway may prevent ferroptosis and lower CIRI.
Ferroptosis, a regulable form of cell death, is critical to the progression of ischemic organ injury, tumors, and neurodegenerative conditions. Recently, some evidence has revealed that CIRI is induced and worsened by ferroptosis [4, 19]. The iron overload pathway, lipid peroxidation pathway, and GPX4 and GSH antioxidant systems are potential regulatory mechanisms of ferroptosis in CIRI [14, 18, 20, 21]. After CIRI [15, 22, 23], the levels of intracellular lipid peroxidation and iron increase, inducing ferroptosis in neurons. However, deferoxamine and Fer-1 may suppress neuronal ferroptosis in the semi-dark zone around ischemic necrotic brain tissue, thereby improving prognosis. In addition, compounds, such as carvacrylol, cerebrotectin, selenium, and safflower flavonoids, may reduce cerebral ischemic injury by inhibiting ferroptosis [8, 24, 25, 26]. This suggests that ferroptosis, driven by the iron overload and antioxidant imbalance, worsens CIRI, and that its inhibition might mitigate the severity of CIRI.
Nrf2 exerts a pivotal inhibitory effect on ferroptosis. Nrf2 inhibits iron overload by increasing the levels of membrane iron transport proteins and ferritin, enhancing antioxidant effects and promoting the expression of GSH and GPX4 [27]. Additionally, Nrf2 interferes with ferroptosis by blocking ACSL4-controlled lipid metabolic pathways. Nrf2 can attenuate CIRI via anti-oxidative, as well as anti-apoptotic, anti-inflammatory, and pro-angiogenic mechanisms [14, 16, 28, 29]. Our results revealed that OGD/R increased the nuclear translocation of Nrf2 in both cell culture and rat models, and that activators and inhibitors of Nrf2 inhibited and promoted ferroptosis, respectively. In vitro experiments revealed that the regulatory effects of the Nrf2 activator on ferroptosis could be blocked by RSL3, and effects of the Nrf2 inhibitor could be limited by Fer-1. These findings suggest that Nrf2 attenuates CIRI by negatively modulating ferroptosis, highlighting its protective role in CIRI.
It is noteworthy that pentobarbital sodium, the anesthetic used in our in vivo experiments, may contribute to Nrf2-mediated neuroprotection. Previous studies have reported that pentobarbital can upregulate Nrf2 expression in cerebral tissues [30, 31, 32], which may exert a baseline protective effect against ischemia-reperfusion injury by enhancing antioxidant capacity. In our study, all rats were anesthetized with a consistent dose of pentobarbital sodium (40 mg/kg) during MCAO/R surgery and euthanasia, ensuring uniform anesthetic exposure across all groups. This standardized procedure minimizes potential confounding factors arising from variable Nrf2 induction by anesthesia, ensuring the reliability of our results regarding Nrf2’s role in ferroptosis regulation.
Previous studies have shown that activating the p62/Keap1/Nrf2 signaling pathway can protect dopaminergic cells from ferroptosis induced by 6-OHDA [13]. Furthermore, this pathway exhibits neuroprotective effects in CIRI. Under basal physiological state, Nrf2 binds tightly to Keap1 in the cytoplasm and remains in an inhibited state [10]. During oxidative stress, p62 triggers Nrf2 activation by competitive interaction with Keap1, preventing its binding to Nrf2. Accordingly, in our experiments, we observed that, p62 activation led to alterations in ferroptosis and cell damage, and affected the interaction between p62 and Keap1. To directly verify their interaction in our model, we performed immunofluorescence double staining and co-immunoprecipitation (Co-IP) assays. The experiments showed that p62 overexpression was associated with activation of the p62/Keap1/Nrf2 pathway and inhibited both OGD/R- and MCAO/R-induced ferroptosis. Specifically, p62 overexpression was accompanied by reversal of elevated ACSL4 and reduced GPX4 expression levels, amelioration of key ferroptosis indicators following OGD/R and MCAO/R, and increased the nuclear translocation of Nrf2, which ultimately ameliorated cellular damage and brain injury. Moreover, the inhibition of ferroptosis by p62 overexpression was reversed by Nrf2 inhibition, suggesting that p62 inhibited ferroptosis and reduced injury by promoting Nrf2 nuclear activation. However, caution when interpreting these results is warranted. Although the current findings support an association between activation of the p62/Keap1/Nrf2 axis and reduced ferroptosis, they remain insufficient to establish that direct p62–Keap1 competitive binding constitutes the sole or necessary mechanism underlying the observed protective effects. Immunofluorescence double staining and Co-IP assays showed that p62 overexpression promoted the association between p62 and Keap1 after MCAO/R, which was associated with activation of Nrf2 and consequent suppression of cellular ferroptosis. In contrast, ML385 was shown to suppress the interaction between p62 and Keap1, and this inhibition was reversed by p62 overexpression. Thus, we proposed the hypothesis of the existence of a positive feedback loop between p62 and Nrf2. Nrf2 boosts p62 expression under conditions of oxidative stress by directly binding to its promoter antioxidant response element [32]. This may explain why ML385 inhibited the interaction between p62 and Keap1, an effect reversed by p62 overexpression, which also reversed the suppression of Nrf2 expression by ML385.
A limitation of the study is its reliance on cell models and animal experiments, which may not fully recapitulate the physiological environment in humans. The specific mechanisms underlying the regulation of ferroptosis by the p62/Keap1/Nrf2 pathway, therefore, require further exploration, particularly in clinical contexts. Furthermore, this study did not examine the classical ultrastructural characteristics of ferroptosis via transmission electron microscopy (TEM); instead, our characterization of ferroptosis was primarily based on widely validated biochemical and molecular markers, including iron accumulation, lipid peroxidation, and GPX4/ACSL4 regulation. More importantly, our current in vitro experiments have confirmed that the Nrf2 inhibitor can partially block the protective effects mediated by p62. However, direct in vivo validation of the pathway-level necessity of Nrf2 is still lacking. Our future studies will focus on clarifying this necessity through combinatorial genetic approaches, such as Nrf2 knockout rats combined with p62 overexpression, to directly verify whether p62-mediated neuroprotection in vivo is dependent on Nrf2.
Our findings indicate that activation of the p62/Keap1/Nrf2 signaling cascade suppresses ferroptosis and mitigates CIRI. Targeting this pathway to counteract ferroptosis could represent an innovative and attractive therapeutic approach for the treatment of CIRI. Further research is warranted to explore the clinical translational potential of this pathway in humans, evaluating its efficacy in preventing ferroptosis-related disorders such as ischemic damage.
ACSL4, acyl-CoA synthetase long-chain family member 4; DCFH-DA, dichloro-dihydro-fluorescein diacetate; Fer-1, ferrostatin-1; GPX4, glutathione peroxidase 4; GSH, glutathione; LDH, lactate dehydrogenase; MCAO/R, middle cerebral artery occlusion/reperfusion; MDA, malondialdehyde; MOI, multiplicity of infection; Nrf2, NF-E2-related factor 2; OGD/R, oxygen-glucose deprivation/reperfusion; ROS, reactive oxygen species; RSL3, RAS-selective lethal 3; tBHQ, tert-butylhydroquinone.
All data reported in this paper will also be shared by the lead contact upon request.
Conceptualization: CL; Methodology: CL, XD, and BT; Investigation: CL and XD; Formal analysis: XD; Visualization: CL; Writing—original draft: CL; Writing—review and editing: CL, XD; Supervision: BT; Resources: BT; Project administration: BT; Funding acquisition: BT. All authors contributed to editorial changes in the manuscript. All authors read and approved the final manuscript. All authors have participated sufficiently in the work and agreed to be accountable for all aspects of the work.
The study was approved by the Animal Ethics Committee of Hunan University of Chinese Medicine (approval number: HNUCM21-2309-39), which strictly adheres to the principles outlined in the Basel Declaration. After the experiments, the animals were sacrificed using humane methods, following the American Veterinary Medical Association Guidelines for the Euthanasia of Animals: 2020 Edition. The study was conducted in accordance with the NIH Guide for the Care and Use of Laboratory Animals.
Not applicable.
This work was supported by the Hunan Provincial Natural Science Foundation of China [Grant/Award Number: 2025JJ90026], Hunan Provincial Health and Family Planning Commission Project (B202303079716). Hunan Provincial Postgraduate Innovation Foundation (Grant numbers CX20220822 and QL2023021), and Hunan University of Chinese Medicine Undergraduate Research Innovation Fund (Grant number 2023BKS071). The funders were not involved in the study design, data collection, manuscript drafting, or decision to submit for publication.
The authors declare no conflicts of interest.
Supplementary material associated with this article can be found, in the online version, at https://doi.org/10.31083/JIN48011.
References
Publisher’s Note: IMR Press stays neutral with regard to jurisdictional claims in published maps and institutional affiliations.