


 , Jian Zhang 3,†, Yayuan Liu 4, Xuemei Quan 5, Qiong Yin 2, Liya Pan 2, Zhijian Liang 1,*
1 Department of Neurology, First Affiliated Hospital of Guangxi Medical University, 530021 Nanning, Guangxi, China
2 Department of Neurology, Fourth Affiliated Hospital of Guangxi Medical University, 545000 Liuzhou, Guangxi, China
3 Department of Neurology, Second Affiliated Hospital of Guangxi Medical University, 530007 Nanning, Guangxi, China
4 Department of Neurology, The Affiliated Minzu Hospital of Guangxi Medical University, 530000 Nanning, Guangxi, China
5 Department of Neurology, The People’s Hospital of Guangxi Zhuang Autonomous Region, Institute of Brain and Mental Diseases, Guangxi Academy of Medical Sciences, 530021 Nanning, Guangxi, China
†These authors contributed equally.
Abstract
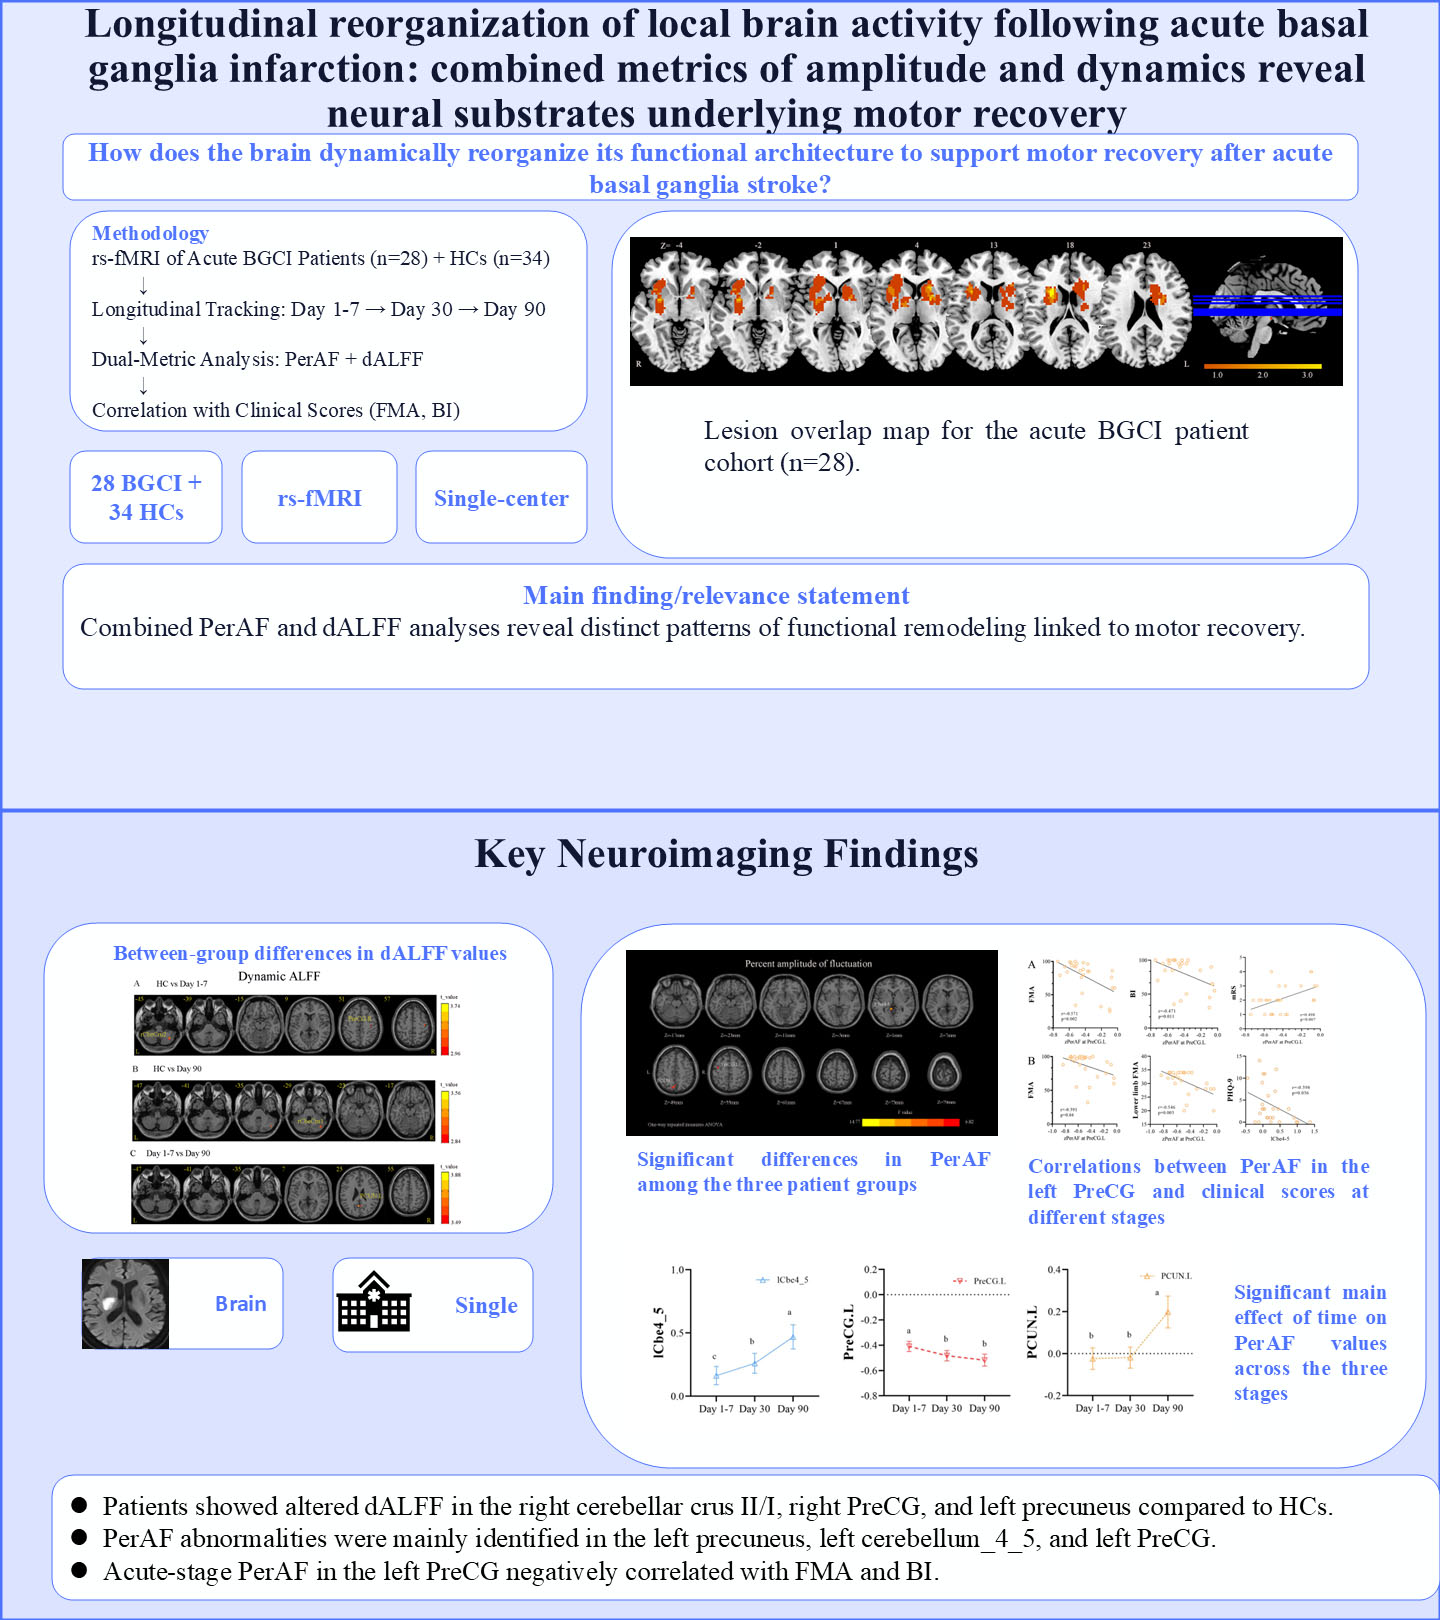
In this study, we focused on exploring long-term trends and the clinical relevance of brain remodeling in acute basal ganglia cerebral infarction (BGCI) using percent amplitude of fluctuation (PerAF) and dynamic amplitude of low-frequency fluctuation (dALFF) from resting-state functional magnetic resonance imaging (rs-fMRI).
rs-fMRI data were acquired from 28 acute BGCI patients and 34 healthy controls (HCs), with patient follow-ups conducted during the acute (days 1–7), early convalescent (day 30), and mid-convalescent (day 90) stages. One-way repeated-measures analysis of variance (ANOVA) was used to evaluate temporal changes in PerAF, while two-sample t-tests compared dALFF values between patient groups (days 1–7 and 90) and HCs. Pearson or Spearman correlation analysis was applied to examine relationships between significant neuroimaging metrics and clinical scores, including Fugl-Meyer Assessment (FMA) and Barthel Index (BI).
PerAF abnormalities were mainly identified in the left precuneus, left cerebellum_4_5, and left precentral gyrus (PreCG). The cerebellar region exhibited a linear increase in PerAF over time. Patients showed altered dALFF in the right cerebellar crus II/I, right PreCG, and left precuneus compared with HCs. Acute-stage PerAF in the left PreCG negatively correlated with FMA and BI. In early and mid-convalescence, PerAF values in the left PreCG were further correlated with motor and lower-limb functional scores.
Combined PerAF and dALFF analyses reveal distinctive patterns of dynamic brain functional remodeling following acute BGCI. These changes are closely associated with motor and daily living recovery, indicating that functional reorganization may represent a key neural mechanism supporting rehabilitation.
Graphical Abstract
Keywords
- stroke
- ischemic stroke
- cerebral infarction
- functional magnetic resonance imaging
Stroke is a major public health concern in China, characterized by high rates of morbidity, disability, mortality, and recurrence, along with substantial economic burden [1]. It remains the leading cause of death and long-term disability among Chinese adults [2]. Acute basal ganglia cerebral infarction (BGCI), a common stroke subtype involving lesions in the basal ganglia, often leads to motor deficits, impaired higher cognitive function, and emotional-behavioral abnormalities, severely affecting patients’ ability to live independently [3]. Motor impairment is the most frequent cause of post-stroke disability, yet motor recovery varies considerably among individuals [4]. These behavioral deficits may stem not only from localized tissue damage but also from disruptions in functional brain networks [5].
Recent advances in neuroimaging have advanced the understanding of brain function after stroke. Resting-state functional magnetic resonance imaging (rs-fMRI) has been widely used to investigate functional abnormalities in stroke patients, helping to reveal underlying mechanisms of recovery [6]. rs-fMRI captures low-frequency spontaneous neural activity via blood oxygenation level-dependent (BOLD) signals. Many studies have focused on functional connectivity within or between networks—such as the motor network and other functional systems—in stroke patients [7, 8]. Fewer studies have examined local spontaneous brain activity, which is essential for a comprehensive understanding of post-stroke neurophysiological changes.
One common metric for assessing spontaneous regional brain activity is the amplitude of low-frequency fluctuation (ALFF), which quantifies the power of BOLD oscillations within the 0.01–0.08 Hz frequency band and is thought to reflect the intensity of local neural activity [9]. ALFF alterations in specific brain regions have been linked to motor impairment severity in acute stroke, suggesting its utility in evaluating brain tissue viability after ischemic injury [10].
However, ALFF is sensitive to the scale of the BOLD signal, limiting its applicability in group-level analyses. To overcome this limitation, the percent amplitude of fluctuation (PerAF) has been proposed as a scale-independent alternative suitable for cross-group comparisons [11]. PerAF has shown promise in neuropsychiatric disorders such as Alzheimer’s disease, where increased PerAF in frontal and temporal regions has provided insights into disease mechanisms [12]. Such results enhance investigators’ understanding of the underlying neural mechanisms of Alzheimer’s disease and may also contribute to its further exploration [12]. Nevertheless, until now, PerAF has not been applied to study dynamic brain changes during stroke recovery.
Moreover, conventional analyses often assume signal stationarity, overlooking the dynamic nature of brain activity. The dynamic amplitude of low-frequency fluctuation (dALFF) approach addresses this by using sliding windows to capture temporal variability in local neural activity, offering a more nuanced view of brain dynamics [13]. Although dALFF has been used in subacute stroke populations [14], its application in acute BGCI patients across multiple recovery phases remains unexplored.
In this prospective longitudinal study, a homogeneous cohort of acute BGCI patients was recruited, and rs-fMRI scans were performed at multiple time points to investigate temporal changes in PerAF and dALFF across acute, early convalescent, and mid-convalescent stages. It was hypothesized that distinct patterns of motor and cognitive recovery would be reflected in spatiotemporal alterations of local brain activity, thus providing new insights into the dynamic process of post-stroke neural remodeling.
A total of 36 patients with first-episode acute BGCI and 37 age- and
gender-matched healthy controls (HCs) were enrolled between March 2022 and
December 2023. The HC group (mean age 53.51
Patient inclusion criteria included: (a) First-onset unilateral acute BGCI,
confirmed by both neurologist and radiologist; (b) Age between 18 and 80 years;
(c) Magnetic resonance imaging (MRI) scan performed within seven days after stroke onset; (d) National Institute of Health Stroke Scale (NIHSS) score between
0 and 16 (mild to moderate acute basal ganglia infarction patients); and (e)
Right-handedness. Exclusion criteria included: (a) Severe aphasia, hearing or
visual impairment preventing clinical assessment; (b) Other neurological
conditions such as cerebral hemorrhage, multiple infarcts, leukoaraiosis,
migraine, epilepsy, or psychiatric disorders; (c) MRI contraindications; and (d)
Excessive head motion (
| Characteristics | Day 1–7 (n = 28) | Day 90 (n = 28) | HCs (n = 34) | p-value | ||
| Gender, male | 22 (78.6) | 22 (78.6) | 27 (79.4) | 0.007 | 0.936 a | |
| Age, years | 56.14 |
56.14 |
53.51 |
0.875 | 0.385 b | |
| Educational level, years | 12 (9.75–15) | 12 (9.75–15) | 12 (9–15) | 0.001 | 0.990 c | |
| High risk factor | ||||||
| Hypertension | 15 | 15 | NA | NA | ||
| Diabetes | 4 | 4 | NA | NA | ||
| Hyperlipidemia | 3 | 3 | NA | NA | ||
| Smoking | 10 | 10 | NA | NA | ||
| Drinking | 11 | 11 | NA | NA | ||
| Clinical examinations | ||||||
| NIHSS | 3 (2–5) | 0 (0–1) | NA | –4.561 | 0.001 c* | |
| FMA-total | 85.5 (64–95.5) | 99 (90.75–100.00) | NA | –3.353 | 0.001 c* | |
| UL-FMA | 57.50 (37.75–63.75) | 65.0 (60.5–66.0) | NA | –3.159 | ||
| DL-FMA | 29.5 (24.25–33.75) | 34.0 (30.5–34.0) | NA | –3.054 | 0.002 c* | |
| MoCA | 26 (14.25–27) | 26 (20.25–29) | NA | –1.498 | 0.134 c | |
| BI | 92.5 (65.0–100.0) | 100 (100–100) | NA | –4.188 | ||
| mRS | 2 (1–3) | 1 (0–1) | NA | –4.915 | ||
| PHQ-9 | 4.0 (2.0–10.5) | 1.5 (0.25–5.5) | NA | –2.013 | 0.02 c* | |
| HAMD | 5 (2–13.75) | 1.0 (0.25–8.75) | NA | –2.046 | 0.041 c* | |
Note: Values are expressed as the mean
This prospective cohort study compared acute BGCI patients with HCs. All patients underwent MRI within seven days post-stroke, while HCs were scanned concurrently. Follow-up assessments—including clinical motor, cognitive, and emotional evaluations, together with rs-fMRI—were conducted at 30 and 90 days after onset. Study endpoints were patient death or loss to follow-up.
Patients received standardized treatment according to the 2018 Chinese Guidelines for the Diagnosis and Treatment of Acute Ischemic Stroke. Acute inpatient rehabilitation was provided for 7–14 days by a multidisciplinary team. After discharge, rehabilitation continued through community medical centers, consistent with American Heart Association/American Stroke Association (AHA/ASA) guidelines for adult stroke rehabilitation [15].
This study was approved by the medical ethics committee of the First Affiliated Hospital of Guangxi Medical University and written informed consent was obtained for all participants.
All neuropsychological assessments were administered by trained therapists.
Patients with BGCI were evaluated using NIHSS and the Barthel Index (BI) to
assess stroke severity and neurological deficits, and the Fugl-Meyer Assessment
(FMA) was used to quantify motor impairment [16, 17]. All participants underwent
comprehensive cognitive testing, which included the modified Rankin Scale (mRS).
Moreover, depressive symptoms in all subjects were measured with the 17-item
Hamilton Depression Rating Scale and the Patient Health Questionnaire‑9 (PHQ-9)
[18, 19, 20]. To ensure the consistency and reliability of clinical ratings,
inter-rater reliability was assessed for all continuous/ordinal scale scores
using the Intraclass Correlation Coefficient (ICC). The ICC was calculated based
on a two-way random-effects model for absolute agreement [ICC (2,1)], implemented
with the psych package in R, using pairwise complete observations. ICC values
were interpreted as follows:
Acute BGCI patients underwent three MRI scans at 1–7 days, 30- and 90-day post-stroke/enrollment; The control group received one scan. Scans were acquired with a 3T MRI scanner (SIEMENS MAGNETOM Prisma; Siemens Healthineers, Erlangen, Bavaria, Germany) using a 64-channel coil in the First Affiliated Hospital of Guangxi Medical University.
The rs-fMRI data were acquired using a gradient-echo-planar imaging sequence
with the following parameters: repetition time/echo time (TR/TE) = 2000/35 msec,
thickness = 3 mm, field of view (FOV) = 240
Lesions were manually segmented using MRIcron software (version 1.2.20211006, https://www.nitrc.org/projects/mricron/) on individual structural images. Following spatial normalization to the Montreal Neurological Institute (MNI) space, all patient lesion masks were superimposed. The individual lesion masks were averaged and combined with a template to produce the lesion overlap map depicted in Fig. 1. In the case of right basal ganglia lesions (n = 18), images were flipped along the midsagittal plane. In this way, all lesions were located in the left hemisphere, thereby ignoring effects specific to the left or right hemisphere. A lesion overlap image was then constructed for all BGCI participants.
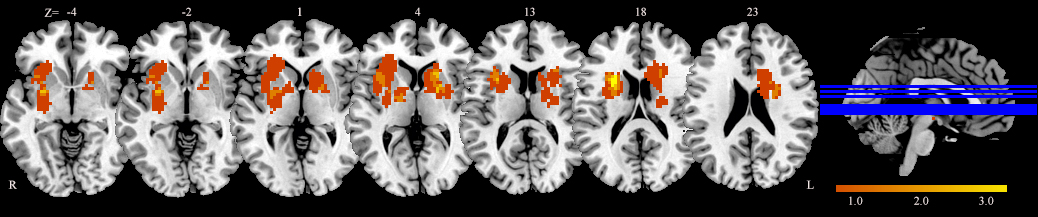 Fig. 1.
Lesion overlap map for the acute BGCI patient cohort (n = 28). Lesion maps from patients with right- and left-sided injuries were normalized to a standard MNI brain template. The color bar represents the percentage of patients with a lesion in each voxel. MNI, Montreal Neurological Institute.
The rs-fMRI data were preprocessed using the Statistical Parametric Mapping
software package (SPM12, Wellcome Trust Centre for Neuroimaging, London, UK;
https://www.fil.ion.ucl.ac.uk/spm/software/spm12/) and Resting-State fMRI Data
Analysis Toolkit plus (RESTplus V1.27, http://restfmri.net/forum/restplus) [21],
implemented in MATLAB (version R2018a, MathWorks, Inc., Natick, MA, USA).
Briefly, the following steps were performed: (1) The first ten volumes of each
functional image were removed to allow for signal equilibration and subject
adaptation to the environment. (2) The other 176 volumes were adjusted to account
for the time delay in acquiring slices. (3) Head motion was corrected by
performing realignment. To minimize noise effects on the signal due to head
movement, participants with head motion exceeding 2.0 mm in maximum displacement
or 2.0° in angular rotation were excluded from the study. (4)
Normalization. The realigned images were spatially normalized to the MNI space
and resampled with a voxel size of 3
PerAF quantifies the magnitude of resting-state BOLD fluctuations relative to the mean signal intensity of the time series. PerAF analysis was performed using RESTplus V1.27 (http://restfmri.net/forum/restplus), a toolbox based on SPM and Data Processing Assistant for Resting-State fMRI, on preprocessed fMRI data in the conventional frequency band (0.01–0.08 Hz). The resulting PerAF value of each voxel was then scaled by the global mean PerAF to generate mean-scaled PerAF maps, and further standardized by dividing by the standard deviation to produce z-scored PerAF (zPerAF) maps, which were subsequently used for statistical analyses.
dALFF analysis was performed using the Temporal Dynamic Analysis toolbox (RESTplus V1.27, http://restfmri.net/forum/restplus), which employs a Hamming based sliding window approach. For each subject, the full BOLD time series was divided into overlapping windows of 50 TRs (100 s) with a step size of 1 TR (2 s), resulting in 127 windows per subject. Within each window, ALFF was computed and then converted to z-scores by voxel-wise standardization [25]. The dALFF metric was defined as the variance of these z-scored ALFF values across all windows for each voxel. The resulting dALFF maps were spatially smoothed to improve the signal-to-noise ratio. To assess the robustness of findings, sensitivity analyses were conducted using alternative window lengths of 30 TRs and 100 TRs.
Statistical analyses were performed using SPSS 26.0 (IBM, Armonk, NY, USA).
Continuous variables were tested for normality with the Kolmogorov–Smirnov test.
Mean
For PerAF analysis, one-way repeated measure analysis of variance was conducted
to examine temporal changes across the three time points (day 7, 30, and 90),
with the within-subject factor being time. Post-hoc Bonferroni tests were applied
where main effects were significant. Trends over time were assessed for
linearity. Analyses were corrected using Gaussian random field (GRF) theory at
cluster-level p
Two-sample t-tests were used to assess differences in dALFF between
acute (day 7), mid-convalescent (day 90), and HC groups, accounting for age, sex,
education, and head motion as covariates. GRF correction was applied
(cluster-level p
Finally, Pearson or Spearman correlation analyses were used to evaluate associations between PerAF/dALFF values in significant clusters and clinical measures.
A total of 28 patients and 34 HCs were included in the final analysis. Demographic and clinical details are summarized in Table 1. No significant differences were found between patients and HCs in terms of gender, age, or education level. The inter-rater reliability of all clinical scale scores was assessed using the ICC. ICC values were calculated based on a two-way random-effects model for absolute agreement. Results indicated good to excellent reliability across scales. Complete results are provided in Supplementary Table 1.
Frame-wise displacement was computed for each participant to assess potential confounding effects of head motion on PerAF and dALFF. Participants exceeding a maximum displacement of 2.0 mm or 2.0° of rotation were excluded from the analysis.
One-way repeated measure ANOVAs were performed in the conventional frequency
band (0.01–0.08 Hz) and revealed significant zPerAF differences among the three
patient time points (day 1–7, day 30, and day 90) in the left precuneus
(PCUN.L), left precentral gyrus (PreCG.L), and left cerebellar lobules 4–5
(Cbe4_5) (uncorrected p
| Frequency band | Regions (AAL) | MNI coordinate (mm) | Cluster size | Peak F value | Effect size ( | ||
| X | Y | Z | |||||
| 0.01–0.08 Hz | lCbe4_5 | –6 | –42 | 0 | 11 | 14.76 | 0.01 |
| PCUN.L | –6 | –69 | 48 | 10 | 8.80 | 0.06 | |
| PreCG.L | –36 | –3 | 57 | 10 | 6.82 | 0.14 | |
Note: AAL, Anatomical Automatic Labeling; lCbe4_5, left cerebellar lobules 4–5;
PCUN.L, left precuneus; PreCG.L, left precentral gyrus;
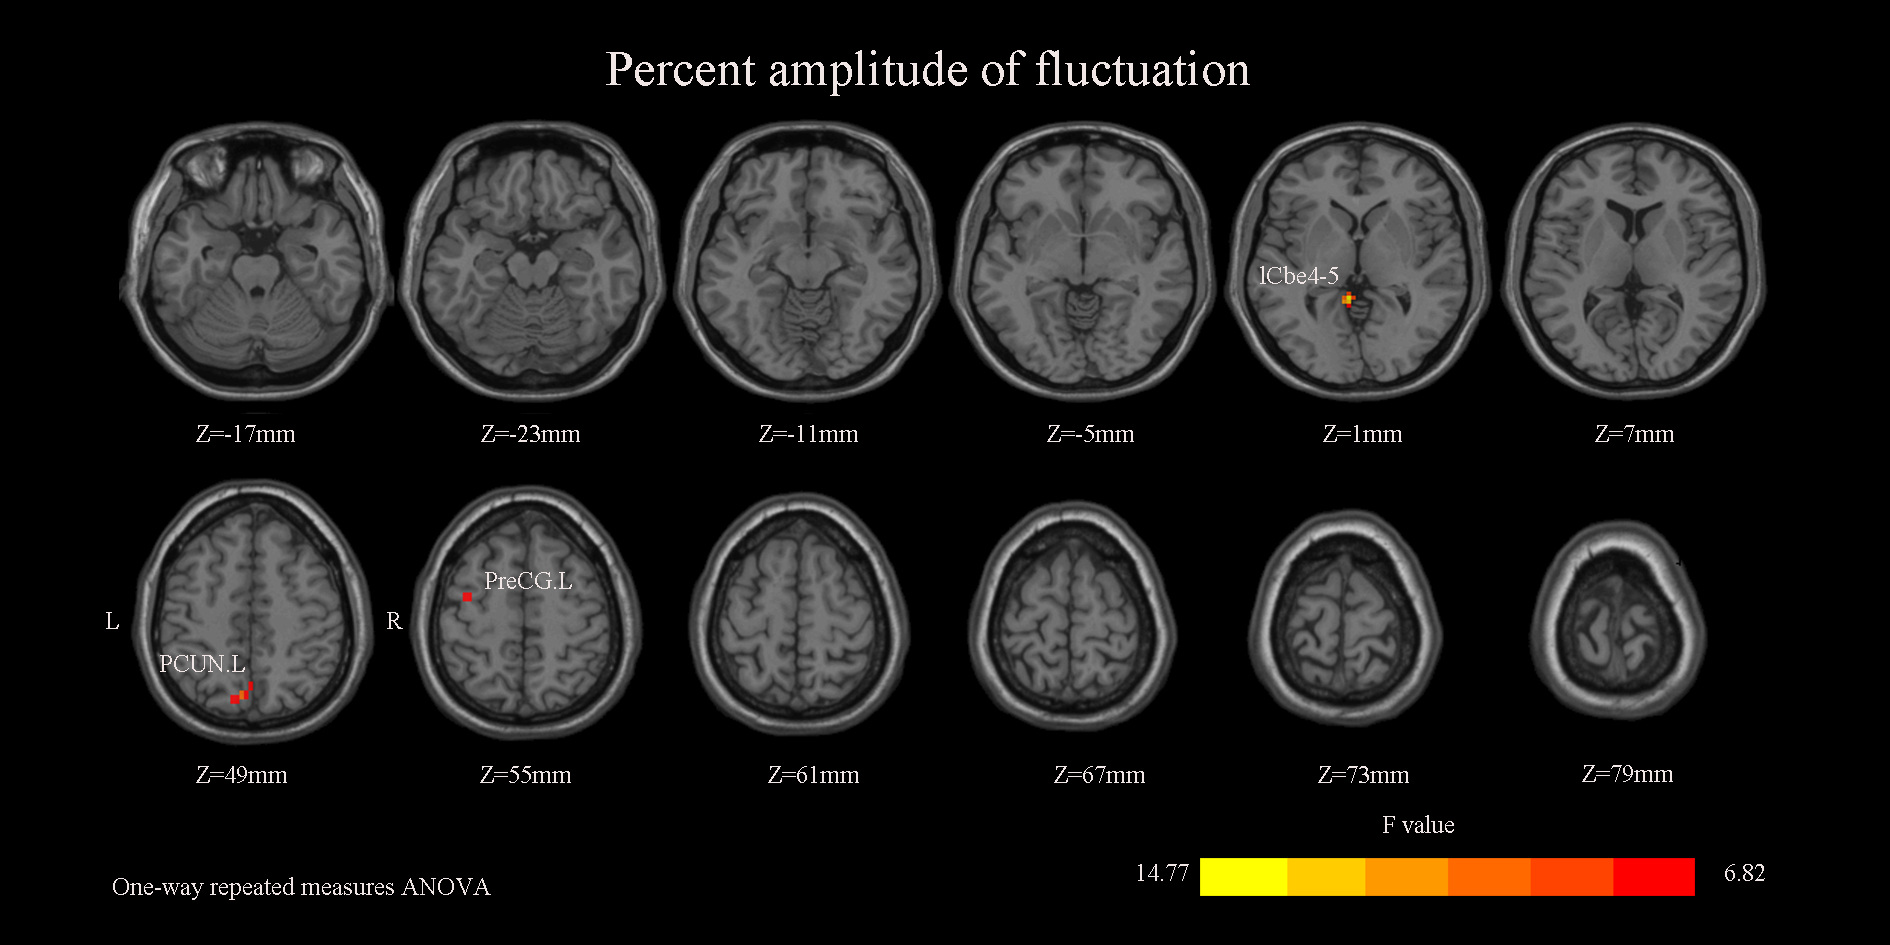 Fig. 2.
Significant differences in zPerAF among the three patient groups. Brain regions exhibiting significant main effects of group on PerAF include the lCbe4_5, PCUN.L, and PreCG.L. The color bar represents the F-statistic values from the one-way ANOVA. zPerAF, z-scored percent amplitude of fluctuation; ANOVA, analysis of variance.
A 6-mm spherical region of interest (ROI) was centered on the peak coordinate of each significant cluster to extract zPerAF values. Subsequent ANOVA showed a significant main effect of time in each ROI. Specifically, zPerAF in the left Cbe4_5 exhibited a significant increasing trend over time, whereas zPerAF in the PreCG.L decreased significantly. zPerAF in the PCUN.L was significantly elevated at day 90 compared to earlier time points (Fig. 3).
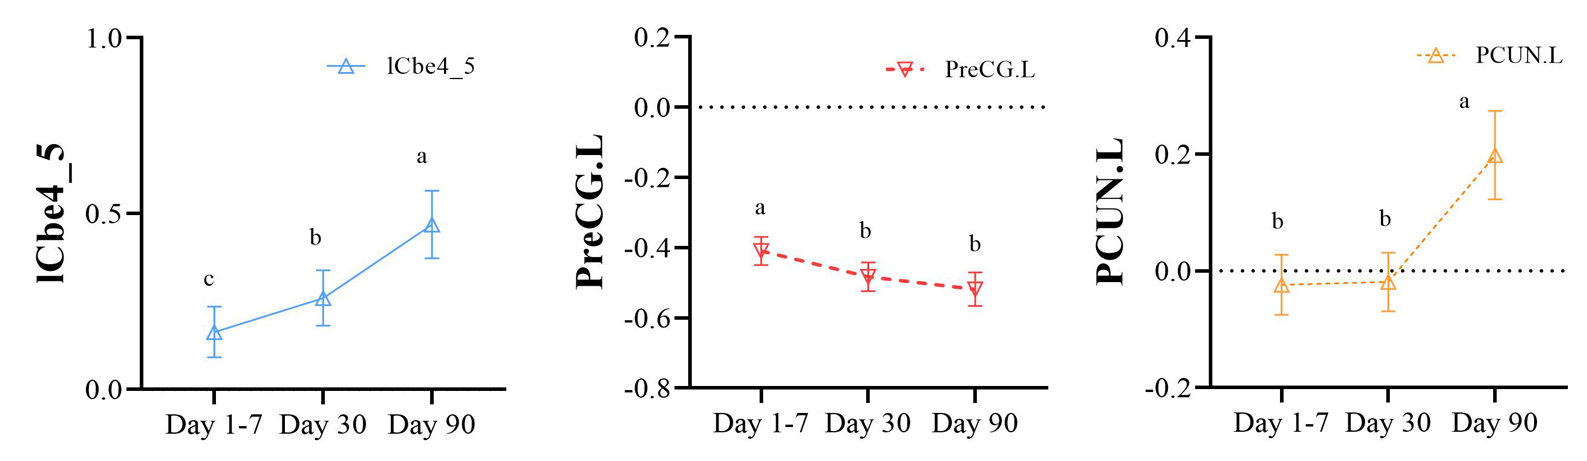 Fig. 3.
Significant main effect of time on zPerAF values across the three stages. Regions showing a significant main effect of time include lCbe4_5, PCUN.L, and PreCG.L. Here, a, b, and c refer to the “letter-based labeling method” in statistics, which is used to indicate the significance of differences between different time points.
Pairwise comparisons indicated that, relative to the day 30 group, the day 1–7 group showed higher zPerAF in the left dorsolateral superior frontal gyrus (SFGdor.L), right superior parietal gyrus (SPG.R), and right supplementary motor area (SMA.R). Compared to the day 90 group, the day 30 group exhibited lower zPerAF in the left vermis 4–5 (Ver4_5.L) and PCUN.L (Supplementary Table 2 and Supplementary Fig. 1).
In acute-stage patients (day 1–7), zPerAF in the PreCG.L showed a moderate negative correlation with FMA scores (r = –0.571, p = 0.002), indicating that higher zPerAF was associated with greater motor impairment, and a positive correlation with mRS scores (r = 0.498, p = 0.007; Supplementary Table 2 and Fig. 4A). At day 30, PreCG.L zPerAF was negatively correlated with total FMA (r = –0.391, p = 0.040) and lower-limb FMA scores (r = –0.546, p = 0.003; Supplementary Table 2 and Fig. 4B). By day 90, PreCG.L zPerAF remained negatively correlated with lower-limb FMA and BI scores (r = –0.474, p = 0.010; Supplementary Table 3 and Supplementary Fig. 2). No significant correlations were observed between clinical scores and zPerAF in either the PCUN.L or Cbe4_5.L.
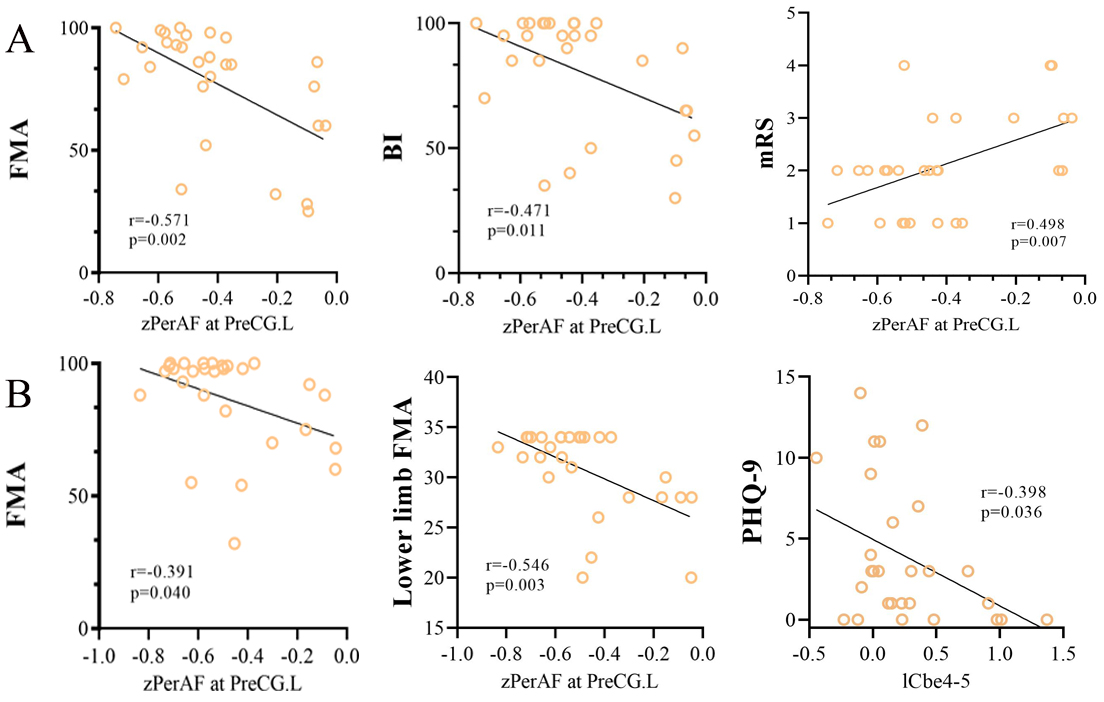 Fig. 4.
Correlations between zPerAF in the PreCG.L and clinical scores at different stages. (A) In the acute stage (Day 1–7), zPerAF in the PreCG.L showed a moderate negative correlation with the FMA score and a positive correlation with the mRS score. (B) In the early convalescent stage (Day 30), zPerAF in the PreCG.L was negatively correlated with both the total FMA and lower limb FMA scores.
Primary dALFF analyses used a sliding window of 50 TRs (100 s). Compared to
HCs, patients at day 1–7 and day 90 showed abnormal dALFF mainly in the right
cerebellar Crus II and Crus I, right precentral gyrus (PreCG.R) and PCUN.L (GRF-corrected, cluster-level
p
| Regions (AAL) | MNI coordinate (mm) | Cluster size | Peak T value | Effect size (Cohen’s d) | |||
| X | Y | Z | |||||
| HCs vs Day 1–7 | |||||||
| rCbeCru 2 | 39 | –63 | –45 | 9 | 3.46 | 0.88 | |
| PreCG.R | 42 | –18 | 60 | 10 | 2.96 | 0.75 | |
| HCs vs Day 90 | |||||||
| rCbeCru 1 | 45 | –72 | –36 | 14 | 3.19 | 0.81 | |
| PCUN.L | –3 | –63 | 66 | 31 | 3.32 | 0.85 | |
| Day 1–7 vs Day 90 | |||||||
| lCbeCru 1 | –54 | –51 | –36 | 10 | 3.63 | 0.93 | |
| PCUN.L | –3 | –60 | 27 | 13 | 3.59 | 0.92 | |
| IPL.L | –51 | –27 | 48 | 11 | –3.30 | 0.84 | |
Note: dALFF, dynamic amplitude of low-frequency fluctuation; Day 1–7, Acute BGCI group; Day 90, Mid-convalescent groups; PreCG.R, right precentral gyrus; rCbeCru 2, Right Cerebelum_Crus 2; rCbeCru 1, Right Cerebelum_Crus 1; lCbeCru 1, Left Cerebelum_Crus 1; IPL.L, Inferior parietal, but supramarginal and angular gyri.
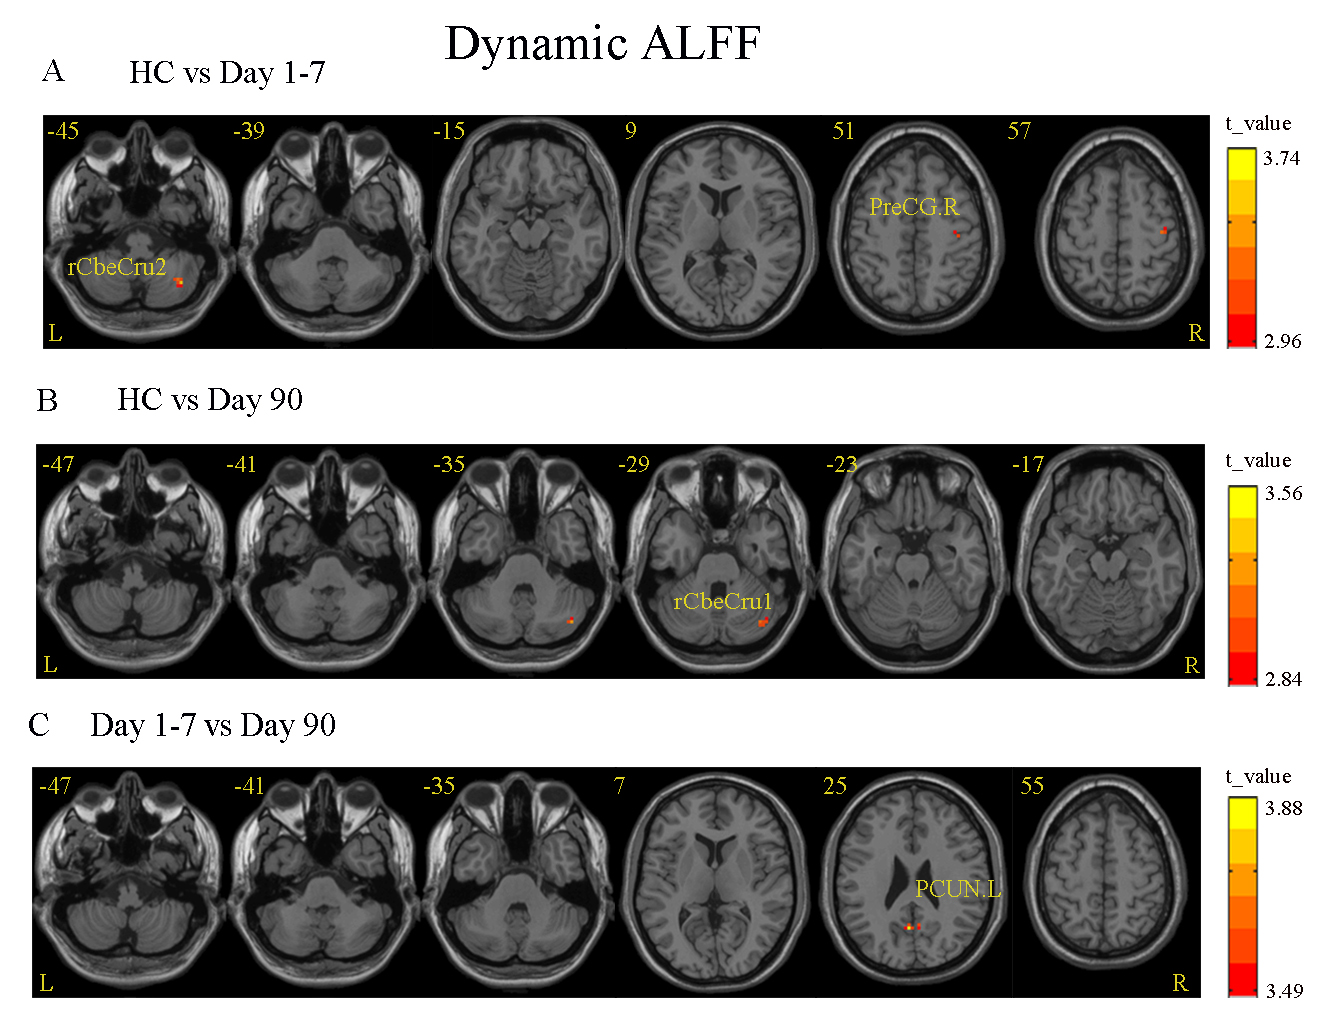 Fig. 5.
Between-group differences in dALFF values. (A) Acute stage (Day 1–7) vs. HCs: Significant differences were found in the rCbeCru2 and the right precentral gyrus. (B) Mid-convalescent stage (Day 90) vs. HC: A significant difference was localized to the right precentral gyrus (rCbeCru1). (C) Acute stage (Day 1–7) vs. Mid-convalescent stage (Day 90): A significant difference was identified in PCUN.L. Color bar indicates t-value scale for all comparisons.
Sensitivity analyses using a 30-TR window yielded consistent results. However, dALFF maps derived from a 100-TR window did not survive GRF correction and are not reported. Results for the 30-TR window are provided in Supplementary Table 4 and Supplementary Fig. 3.
Pearson or Spearman correlation analyses between dALFF values and clinical scores (NIHSS, FMA, BI, Montreal Cognitive Assessment [MoCA], and modified Rankin Scale) were conducted for all window sizes. Contrary to expectations, no significant correlations were found between abnormal dALFF and clinical measures.
rs-fMRI was chosen as the core tool for its unique advantages: It is non-invasive and suited to longitudinal tracking, enabling repeated measurements across recovery stages without biological risks, while uniquely capturing spontaneous low-frequency neural activity to reflect intrinsic brain function and functional reorganization (even in structurally intact regions) that other imaging methodologies like structural MRI or Positron Emission Tomography (PET) fail to fully reveal [26]. This longitudinal study investigated functional brain remodeling in patients with acute BGCI by combining PerAF and dALFF analyses of rs-fMRI data. To the authors’ knowledge, this is the first study to apply both methods to track neural changes over a three-month period following cerebral infarction. Findings indicate that while PerAF and dALFF capture distinct aspects of brain activity, they provide complementary insights. dALFF results were robust using a 50-TR (100 s) window with 1-TR (2 s) steps. Both methods revealed longitudinal alterations in cortical and cerebellar regions across acute (day 1–7), early convalescent (day 30), and mid-convalescent (day 90) stages, with several changes significantly correlating with clinical scores. These regions span key functional networks—default mode network (DMN), frontoparietal network (FPN), motor network, and cerebellar network—shedding light on functional reorganization after BGCI.
PerAF reflects voxel-wise BOLD signal variability. It allowed time-dependent PerAF changes to be observed across networks: PerAF in left cerebellar lobules 4–5 (lCbe4_5) increased linearly from acute to mid-convalescent phases, whereas PerAF in the left PreCG decreased significantly by the mid-convalescent stage. PerAF in the PCUN.L was notably elevated at day 90.
Schoch et al. [27] found that the anterior cerebellum, specifically lobules IV–V (Cbe4_5), is involved in upper limb locomotion. The cerebellum is anatomically and functionally interconnected with the basal ganglia and cerebral cortex [28]. This cerebellar–cortical loop is integral to motor planning, execution, and higher cognitive and emotional functions [29]. Previous electrophysiological study has shown that Purkinje cells in anterior cerebellar lobules IV–V are activated during arm movement in macaques [30]. Recent research also suggests that gray matter volume changes in this region are associated with motor and cognitive function in patients with multiple system atrophy [31]. The findings highlight the influential role of the anterior cerebellum in motor reorganization. Our observation of a linear increase in lCbe4_5 PerAF suggests enhanced synchronization of neural activity in this region, possibly reflecting compensatory plasticity following BGCI. This implies that left anterior cerebellar lobules IV-V may contribute to motor recovery after basal ganglia infarction. Therapies targeting motor areas, such as transcranial magnetic stimulation, have been reported to improve motor function in acute stroke patients and may be a promising avenue for future intervention in BGCI.
In this study, PerAF in the PreCG.L decreased significantly by the mid-convalescent phase compared to the acute phase, while PerAF in the PCUN.L increased notably by day 90. These findings illustrate how basal ganglia injury affects neural activity in distant regions. PreCG and PCUN belong to the sensorimotor network (SMN) and DMN, respectively. The SMN, which includes pre- and postcentral gyri, shows decreased functional connectivity over time in Parkinson’s disease patients, correlated with motor impairment [32]. PreCG.L is a primary motor control center, and disruption of its connections can lead to motor deficits [33]. The decrease in left PreCG PerAF was negatively correlated with upper limb FMA and BI scores, suggesting that reduced local BOLD signal is associated with better neurological recovery at three months. This indicates that PerAF changes in the PreCG.L are linked to functional remodeling in BGCI patients.
Alternatively, stroke patients typically exhibit reduced DMN activity and lower functional connectivity in the precuneus and other regions compared to healthy controls [34]. Similarly, here it was found that PerAF in the PCUN.L (a DMN node) was significantly lower in the acute phase than in early and mid-convalescent phases. The DMN exhibits high activity during rest and is involved in emotional regulation, self-awareness, and sustained attention [35]. The precuneus is a central DMN hub, and its dysfunction is considered an early marker of cognitive impairment [36]. Thus, the observed changes in PCUN.L PerAF may represent a neuroimaging correlate of post-stroke cognitive changes.
Notably, the observed brain functional remodeling is likely a synergistic effect of intrinsic neuroplasticity (e.g., synaptic reorganization, compensatory network recruitment) and standardized neurorehabilitation received by patients, as structured rehabilitation therapies are known to modulate neuroplasticity and guide adaptive functional reorganization [37, 38].
Further, a positive correlation between PHQ-9 scores (assessing depressive symptoms) and PerAF was observed in the lCbe4_5 (r = 0.398, p = 0.036). This may reflect that enhanced neural synchronization in lCbe4_5—originally interpreted as compensatory plasticity for motor recovery—could also be associated with unresolved depressive symptoms, suggesting a dual involvement of this region in motor and emotional remodeling after basal ganglia infarction.
Two-sample t-tests based on dALFF revealed significant differences among acute patients, mid-convalescent patients, and HCs. Dynamic activity in the right Crus II was significantly reduced in BGCI patients during the acute and mid-convalescent phases compared to controls, consistent with previous findings [39]. The right Crus II is functionally connected to the FPN and DMN and is activated during cognitive tasks [40, 41]. As motor recovery involves relearning motor skills, Crus II may support this process after stroke [42]. In this study, reduced dALFF in right Crus II was observed at both 30-TR and 50-TR windows, suggesting it has a role in motor recovery in BGCI patients. The 100-TR window results did not survive GRF correction, likely due to excessive window width smoothing of temporal dynamics. The lack of correlation between dALFF values and clinical scores may be due to the small number of significant voxels or limited sample size.
This study has several limitations. First, the sample size was relatively small. Future studies should explore frequency-specific changes in larger cohorts of acute BGCI patients. Second, the inclusion of predominantly mild-to-moderate stroke patients limits the generalizability of the findings to the broader stroke population. Although infarct distribution was similar between groups, lesion locations varied between the left and right basal ganglia, which may influence network topology. Future studies should enroll patients with more homogeneous infarct locations. Third, although a longitudinal design was used, the three-month follow-up period was relatively short. An extended follow-up would help further investigate the relationship between functional network dynamics and stroke recovery. Fourth, although the lesions were primarily located in the basal ganglia, distant from DMN nodes, variations in infarct location may still affect functional network measures. Fifth, baseline NIHSS score was not included as a control variable in the correlation analysis between PerAF and clinical functional scores, considering the study’s focus on the strong intrinsic correlation between baseline NIHSS score and clinical outcome scores. Future studies are warranted to comprehensively explore the potential confounding or mediating role of baseline NIHSS score in this relationship. Finally, although demographic and motion confounders were adjusted for, differences in medical history—including unmeasured vascular risks—may affect between-group comparisons and require cautious interpretation.
This study demonstrates that acute BGCI leads to altered spontaneous neural activity in regions including the left Cbe4_5, left PreCG, left PCUN, and right Crus II, as measured by PerAF and dALFF. Notably, the left Cbe4_5 emerges as a key node in cognitive-motor recovery networks, with its dynamic PerAF changes linked to both motor improvement and emotional regulation [43]. These changes are associated with motor and cognitive performance at three months, suggesting they reflect adaptive brain remodeling underlying functional recovery. The cortical–basal ganglia–cerebellar circuit, particularly the cerebellum as a promising target for NIBS techniques, may represent a direction for neuromodulation therapies in BGCI, meriting further investigation [44, 45].
From a translational perspective, our findings support the potential use of PerAF/dALFF patterns as imaging-based stratification biomarkers. For instance, patients showing early elevation of PerAF in the left Cbe4_5 with subsequent normalization may represent a subgroup with better adaptive plasticity and motor recovery. Conversely, persistent hyperactivity in the left PreCG may indicate maladaptive reorganization associated with poorer outcomes. Such stratification could help tailor neuromodulation therapies, such as cerebellar non-invasive brain stimulation, to patients most likely to benefit.
Furthermore, the cortical–basal ganglia–cerebellar circuit—particularly the cerebellum—represents a promising target for neuromodulation in BGCI. Future studies should explore whether baseline PerAF/dALFF profiles can predict response to interventions such as repetitive transcranial magnetic stimulation or transcranial direct current stimulation, thereby advancing toward personalized neurorehabilitation.
Despite the longitudinal insights provided by PerAF and dALFF in capturing post-stroke brain dynamics, the present study was not designed to evaluate their diagnostic classification performance. Future studies with larger, independent cohorts should employ machine learning approaches—such as support vector machine (SVM) or other pattern recognition methods—to examine whether PerAF/dALFF patterns can reliably stratify patients into recovery subtypes or predict therapeutic response. Such efforts would help translate these dynamic neuroimaging markers toward personalized prognosis and intervention planning in stroke rehabilitation.
In summary, our work not only highlights key neural correlates of recovery but also provides a framework for imaging-guided patient stratification and circuit-targeted therapy design, moving closer to precision medicine in stroke rehabilitation.
The datasets supporting the findings of this study, including processed neuroimaging metrics and clinical assessment scores, are available within the article and its supplementary materials. Additional raw data (e.g., de-identified resting-state fMRI data) are available from the corresponding author upon reasonable request.
Conceptualization, SJC and JZ; methodology, YYL; software, SJC and JZ; validation, SJC and JZ; formal analysis, YYL and XMQ; investigation and interpretation of data for the work, QY; visualization and resources, LYP; data curation, LYP; writing—original draft preparation, SJC; writing—review and editing, and design of the work: ZJL; visualization, SJC; supervision, ZJL; project administration, ZJL; funding acquisition, SJC, JZ and ZJL. All authors contributed to editorial changes in the manuscript. All authors read and approved the final manuscript. All authors have participated sufficiently in the work and agreed to be accountable for all aspects of the work.
Studies involving human patients were reviewed and approved by the First Affiliated Hospital of Guangxi Medical University Review Board (Reference Number: 2021 (KY-E-184)). All procedures were performed in accordance with the ethical standards of the Declaration of Helsinki. Informed consent was obtained from all subjects involved in the study.
We thank the Hangzhou NaoHai Technology Laboratory for the technical support provided by its scientific research platform in this study.
This study was supported by grants from the National Natural Science Foundation of China (82260243, 82560240). Additional support was provided by the Guangxi Natural Science Foundation (2025GXNSFAA069038) and the Liuzhou Science and Technology Bureau (2024YB0103A014).
The authors declare no conflicts of interest.
Supplementary material associated with this article can be found, in the online version, at https://doi.org/10.31083/JIN47725.
References
Publisher’s Note: IMR Press stays neutral with regard to jurisdictional claims in published maps and institutional affiliations.