


 , Fan Yang 1,†, Hanlin Zhang 1, Jiangyan Liu 1,*
1 Department of Nuclear Medicine, The Second Hospital & Clinical Medical School, Lanzhou University, 730030 Lanzhou, Gansu, China
†These authors contributed equally.
Abstract
Temporal lobe epilepsy (TLE) is increasingly recognized as a dysfunction of the brain network. However, the topological alterations of the metabolic brain network underlying impaired awareness seizures (IAS) remain unclear. In this study, we aimed to characterize metabolic network reorganization in patients with TLE and IAS (TLE-IAS) and to preliminarily investigate the specificity of these alterations by comparing the results with those of patients with TLE and aware seizures (AS).
This retrospective study included a total of 193 TLE-IAS patients, 30 patients with TLE-AS, and 193 controls. Metabolic brain networks were constructed for all groups, and nonparametric permutation testing was applied to compare group differences in graph-theoretical metrics and hub node distribution.
Compared with controls, both TLE patient groups exhibited globally weakened metabolic connectivity. Graph-theoretical analysis revealed that both groups demonstrated significant increases in characteristic path length and significant decreases in clustering coefficient (Cp). Furthermore, the TLE-AS group showed a significant decrease in local efficiency compared with controls. No statistically significant differences were found between the two patient groups across the four graph-theoretical parameters. Hub analysis revealed a convergent reorganization in both groups involving loss of default mode network hubs and a limbic/paralimbic shift, with the TLE-IAS group showing more limbic hubs, while the TLE-AS group exhibited more primary auditory hubs.
This study revealed alterations in graph-theoretical parameters and hub distribution in patients with TLE-IAS and TLE-AS. These findings provide preliminary metabolic imaging evidence for the neural substrates underlying impaired awareness in TLE.
Keywords
- epilepsy
- temporal lobe
- positron emission tomography
- neural pathways
Epilepsy is a chronic brain disorder marked by recurrent, unprovoked seizures [1]. Based on awareness per the 2017 International League Against Epilepsy (ILAE) classification, focal seizures are categorized as focal impaired awareness seizures (IAS) and focal aware seizures (AS) [2]. IAS are characterized by diminished awareness, manifested as reduced overall arousal and responsiveness. AS refer to the patient’s ability to remain conscious of both self and environment during an epileptic seizure, even if motor responsiveness is impaired. Although IAS increases the risk of accidental injuries such as traffic accidents, drowning, and falls in patients, its mechanism remains unclear at present [3]. Temporal lobe epilepsy (TLE), the most common form of focal epilepsy, is frequently associated with IAS.
To investigate functional connectivity, methods such as correlation, coherence, or component analysis [4] are typically applied to functional neuroimaging data [e.g., electroencephalography (EEG), magnetoencephalography (MEG), functional magnetic resonance imaging (fMRI), or positron emission tomography (PET)]. It is a conceptual class comprising multiple distinct members [5]. Metabolic connectivity, defined as a set of statistical interrelationships in metabolic values (primarily measured by PET) between different brain regions, is considered a specific form of functional connectivity [6]. PET is a noninvasive modality that quantitatively measures cerebral glucose levels using radiotracers such as 18F-fluorodeoxyglucose (18F-FDG) [7], where the signals are generated by the coupling between synaptic transmission and local glucose consumption [8]. Therefore, the correlation of glucose uptake between different brain regions can reflect the strength of their functional connectivity. In magnetic resonance imaging (MRI)-negative epilepsy patients, PET can sensitively identify epileptogenic zones and abnormal metabolic networks, serving as an important noninvasive adjunct for localizing epileptogenic foci and guiding clinical management [9].
Epilepsy is caused by brain network dysfunction. Brain network analysis methods, which are widely applied to study neurodevelopmental and neurodegenerative disorders, are important tools in epilepsy research [10, 11]. Numerous studies have demonstrated that during ictal and interictal periods, the propagation of abnormal discharges significantly alters whole-brain functional connectivity, resulting in network dysfunction [12, 13, 14]. Graph theory-based network analysis can be used to effectively quantify such network abnormalities [15, 16]. Regarding the mechanisms underlying impaired awareness in epilepsy, Bartolomei and Naccache [17] postulated the “global workspace theory” and noted that fronto-parietal associative cortices are key factors in severe awareness alterations during seizures. Additionally, Yu and Blumenfeld [18] proposed the network inhibition hypothesis to describe impaired awareness in TLE, suggesting that TLE disrupts the upper brain stem-diencephalic activating systems, leading to decreased activity or inhibition of the fronto-parietal association cortex. Previous studies using diverse technical approaches have implicated potential neural substrates in TLE-IAS. On the one hand, diffusion tensor imaging studies indicate that the thalamus and upper brainstem may play critical roles in epileptic patients with impaired awareness [19]. On the other hand, Campora et al. [20] used stereo-EEG to demonstrate that TLE-IAS involves hippocampal activity at all points during seizures. However, how static metabolic networks specifically manifest the differences between TLE-IAS and TLE-AS has not yet been systematically investigated.
Current PET research on TLE-IAS primarily focuses on alterations in regional metabolic patterns [21], overlooking the critical comparison with TLE-AS patients. Notably, the maintenance of consciousness relies on the integrated functioning of whole-brain networks [22]. Therefore, localized metabolic analyses, coupled with the lack of comparative data with TLE-AS patients, are inadequate to elucidate the specific network-level mechanisms underlying impaired awareness. To this end, this study aims to construct metabolic brain networks for patients with TLE-IAS or TLE-AS and controls. The subsequent quantitative analyses of graph-theoretical properties and hub distributions are designed to characterize the specific network reorganization patterns in TLE-IAS, thereby elucidating the neural basis of impaired awareness.
This retrospective study included patients with TLE-IAS or TLE-AS who underwent cerebral 18F-FDG PET/computed tomography (CT) examinations at the Department of Nuclear Medicine, Lanzhou University Second Hospital, between January 2018 and January 2025.
The inclusion criteria were as follows: patients aged between 6 and 65 years; complete clinical data with a documented history of impaired awareness seizures (i.e., reduced responsiveness to verbal commands during seizures or inability to recall the ictal episode) or aware seizures; a confirmed clinical diagnosis of TLE; and no seizures occurring within 24 hours before or during the PET scan. The exclusion criteria included: indeterminate seizure type; MRI evidence of major structural abnormalities, such as encephalitis, cerebral infarction, intracerebral hemorrhage, cerebrovascular malformation, or intracranial tumor (except hippocampal sclerosis); prior intracranial surgery; severe metabolic disorders; or neuropsychiatric illness.
Based on these criteria, 30 patients with TLE-AS and 193 patients with TLE-IAS were enrolled. The control group consisted of 193 individuals, who were matched to the TLE-IAS group for age and sex. All controls underwent PET/CT during the same period and had no history of central nervous system diseases (e.g., healthy subjects or patients with non-neurological disorders). We systematically collected demographic data (age, sex), clinical characteristics (onset age and duration of seizures), and brain MRI findings for all enrolled patients.
All PET/CT scans were performed using a Discovery 690 scanner (GE Healthcare,
Waukesha, WI, USA). For patients with epilepsy, the scans were performed during an
interictal period, which was confirmed by continuous clinical observation for at
least 24 hours before and throughout the PET scanning procedure. All subjects
fasted for at least 6 hours before the examination, ensuring fasting blood
glucose levels between 3.9 and 6.3 mmol/L. Subsequently, 2.96–5.55 MBq/kg of
18F-FDG was administered intravenously, followed by a 40–60 minute rest
period in a quiet, dimly lit room for all participants. PET/CT imaging was then
performed in the supine position. Brain PET acquisition lasted 5 minutes per bed
position. A low-dose CT scan was first acquired using the following parameters:
slice thickness, 3.75 mm; tube current, 50–220 mA; tube voltage, 120 kV; and
matrix size, 512
Image preprocessing was conducted using Statistical Parametric Mapping (SPM12,
Wellcome Trust Centre for Neuroimaging, London, UK) running on MATLAB R2022a
(MathWorks, Natick, MA, USA). After converting the DICOM-format PET images into
NIfTI format, the origin coordinates were manually adjusted. All individual PET
images were then spatially normalized to the Montreal Neurological Institute
(MNI) PET template provided in SPM12 and resampled to a voxel size of 2
The PET metabolic brain networks were constructed and analyzed as follows. Preprocessed PET images from the TLE-IAS, TLE-AS, and control groups were parcellated into regions of interest using the Automated Anatomical Labeling 90 atlas. This divided the whole brain into 90 anatomical regions that served as network nodes. The standardized uptake value (SUV) of each region was calculated. The cerebellum—which exhibits relatively stable glucose metabolism—was used as a reference region to obtain the standardized uptake value ratio (SUVR) for each region [23, 24].
At the group level, Pearson correlation coefficients between all pairs of the 90
brain regions (retaining only positive correlations) were computed separately for
the TLE-IAS, TLE-AS, and control groups, generating three 90
Subsequently, global and nodal network metrics were computed using GRETNA 2.0 (https://www.nitrc.org/projects/gretna/), including characteristic path length (Lp), clustering coefficient (Cp), global efficiency (Eg), local efficiency (Eloc), and betweenness centrality (Bc) [26, 27]. Hub nodes were identified as those with a normalized betweenness centrality (Bc/mean Bc) greater than 2 and statistically significant according to permutation testing [28, 29]. Visualization of hub node distributions was performed using BrainNet Viewer (https://www.nitrc.org/projects/bnv/) [30].
Statistical analyses were performed using SPSS 25.0 (IBM Corp., Armonk, NY,
USA) and MATLAB R2022a. Continuous variables following a normal
distribution were presented as mean
No significant differences in demographic or clinical characteristics (age, sex,
onset age of seizure, duration of seizure, and MRI findings) were found between
the TLE-AS group and the other two groups (all p
| Characteristics | Control group (n = 193) | TLE-IAS group (n = 193) | TLE-AS group (n = 30) | p | |
| Age (years, Mean |
24.0 (15.0, 33.0) | 24.0 (15.0, 33.0) | 16.0 (12.0, 35.0) | 0.286 | |
| Sex | 0.919 | ||||
| Male | 101 (52.3%) | 101 (52.3%) | 16 (53.3%) | ||
| Female | 92 (47.7%) | 92 (47.7%) | 14 (46.7%) | ||
| Onset age of seizure (years) | - | 14.0 (8.8, 26.0) | 13.0 (9.0, 23.0) | 0.673 | |
| Duration of seizure (years) | - | 5.0 (1.0, 10.2) | 2.5 (1.0, 8.0) | 0.126 | |
| MRI | 0.835 | ||||
| Positive | - | 126 (65.3%) | 19 (63.3%) | ||
| Negative | - | 67 (34.7%) | 11 (36.7%) | ||
p-values represent comparisons between the TLE-AS and TLE-IAS groups. Sex:
Metabolic connectivity matrices for the TLE-IAS and control groups were constructed by calculating Pearson correlation coefficients of glucose metabolism across all brain regions (Fig. 1). The interregional metabolic connections of both groups were visualized, with the color bar representing correlation strength. The TLE-IAS and TLE-AS groups tended to exhibit weaker metabolic connectivity compared to the control group, suggesting reduced interregional coordination of glucose metabolism. Additionally, we generated metabolic connectivity difference matrices comparing each patient group (TLE-IAS and TLE-AS) with the control group to visualize alterations (Supplementary Fig. 1).
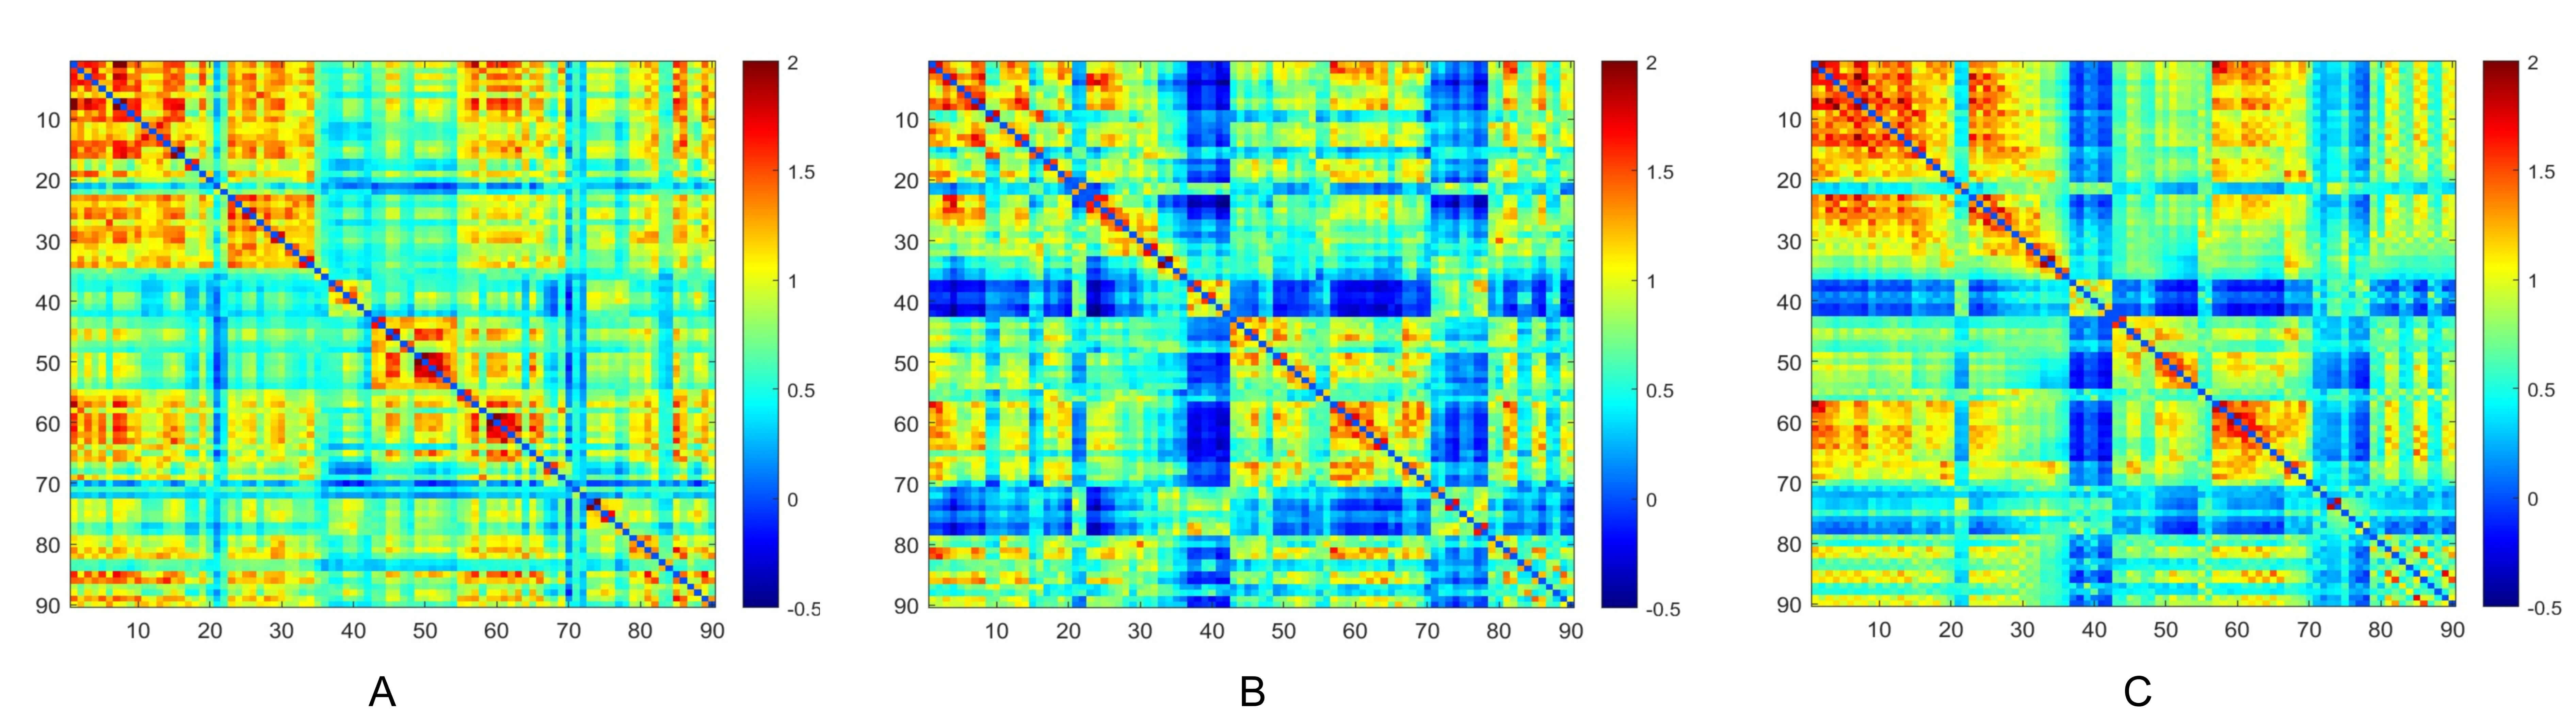 Fig. 1.
Metabolic connectivity matrices of brain networks in the three groups. (A) Control group, (B) TLE-AS, and (C) TLE-IAS groups. TLE-AS, temporal lobe epilepsy-aware seizures; TLE-IAS, temporal lobe epilepsy-impaired awareness seizures.
Within the sparsity range of 0.25–0.75, graph-theoretical analysis of the
metabolic networks revealed alterations in global and local properties across all
groups. Compared with the control group, the TLE-IAS group exhibited
significantly increased Lp and decreased Cp, with no significant differences in
Eg and Eloc (Fig. 2). After FDR correction for each sparsity level, significant
between-group differences were observed for Lp at certain sparsity levels
(0.47–0.52, 0.58–0.75) (pFDR ranging from 0.044 to 0.048, mean
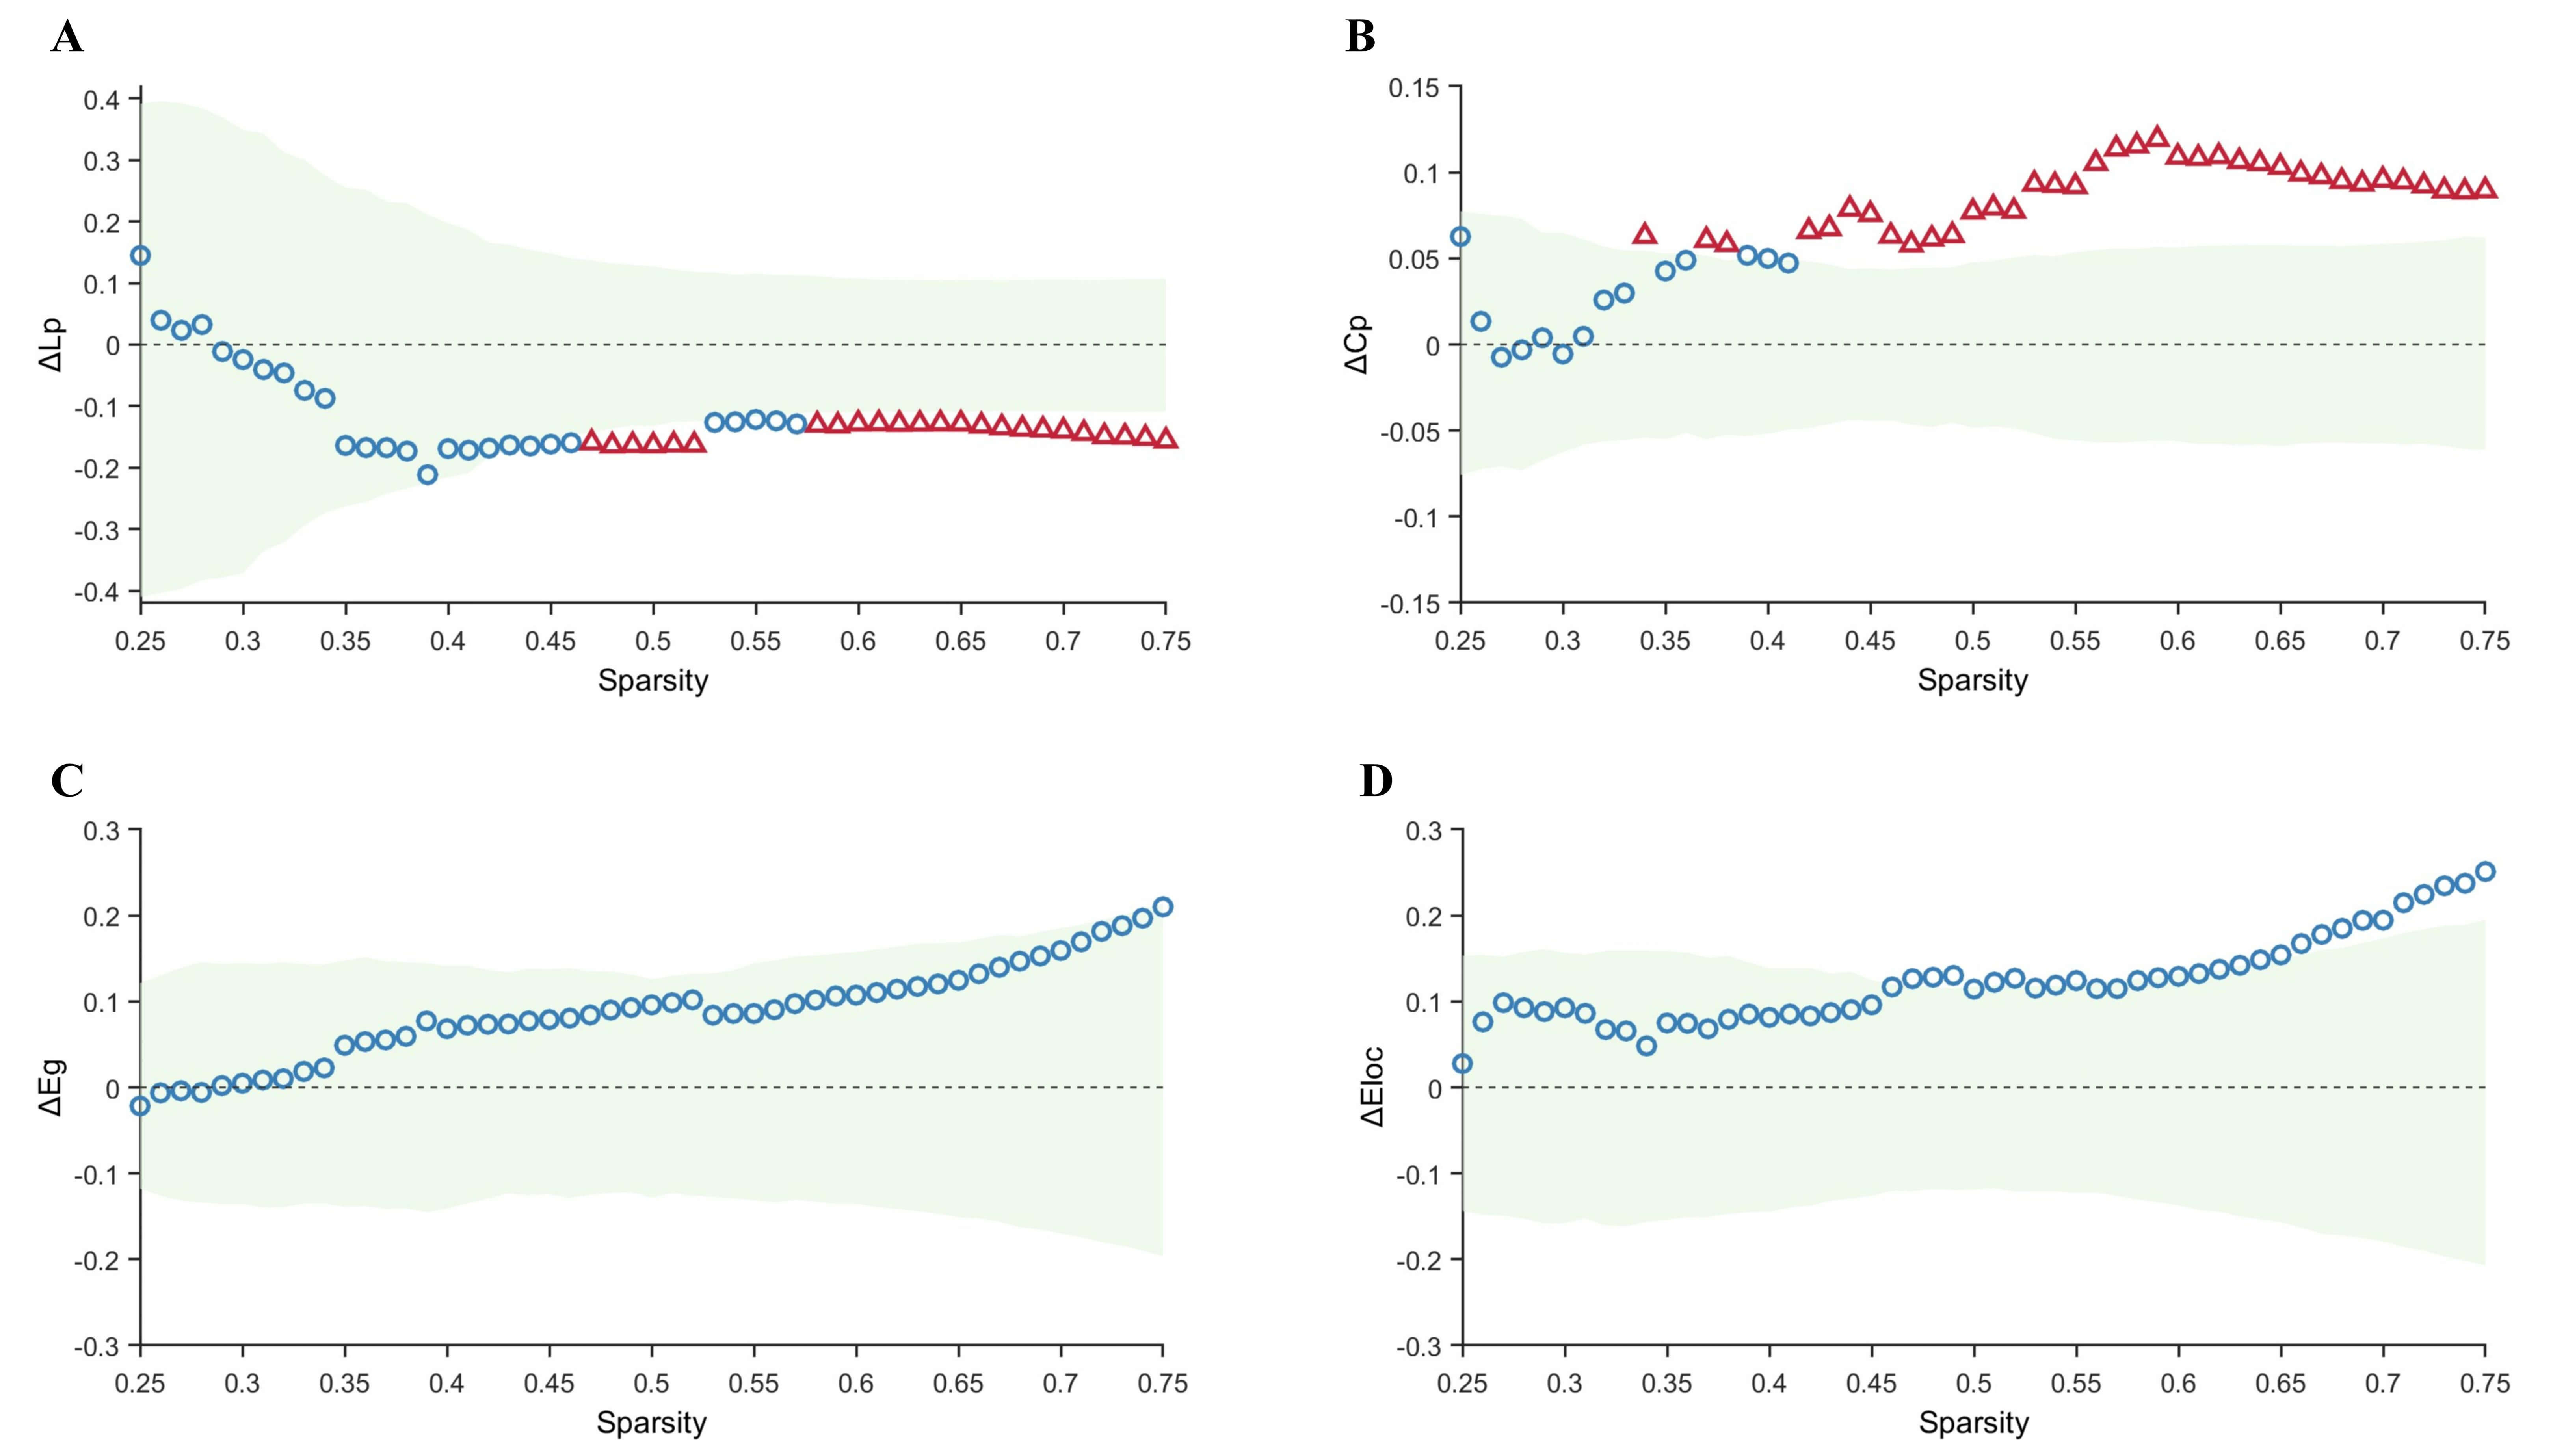 Fig. 2.
Comparison of graph-theoretical metrics between the control and
TLE-IAS groups. (A–D) Differences and confidence intervals of Lp, Cp, Eg, and
Eloc values between the control group and the TLE-IAS group within the sparsity
range of 0.25–0.75. The green area represents the 95% CI, red triangles
represent significant between-group differences at each sparsity level
(pFDR
Compared with the control group, the TLE-AS group exhibited significantly
increased Lp and significantly decreased Cp and Eloc values, without any
significant difference in Eg (Fig. 3). Sensitivity analysis using bootstrap
resampling (1000 iterations) confirmed the robustness of these differences. The
95% confidence intervals (CI) for the area under the difference curve were
[0.0061, 0.0350] for Lp, [0.0401, 0.1220] for Cp, and [0.1800, 0.4972] for Eloc,
indicating stable overall intergroup differences. Furthermore, after FDR
correction across sparsity levels, Lp and Eloc showed significant intergroup
differences throughout the entire sparsity range (pFDR ranges:
0.012–0.021 and 0.032–0.037, respectively; with mean
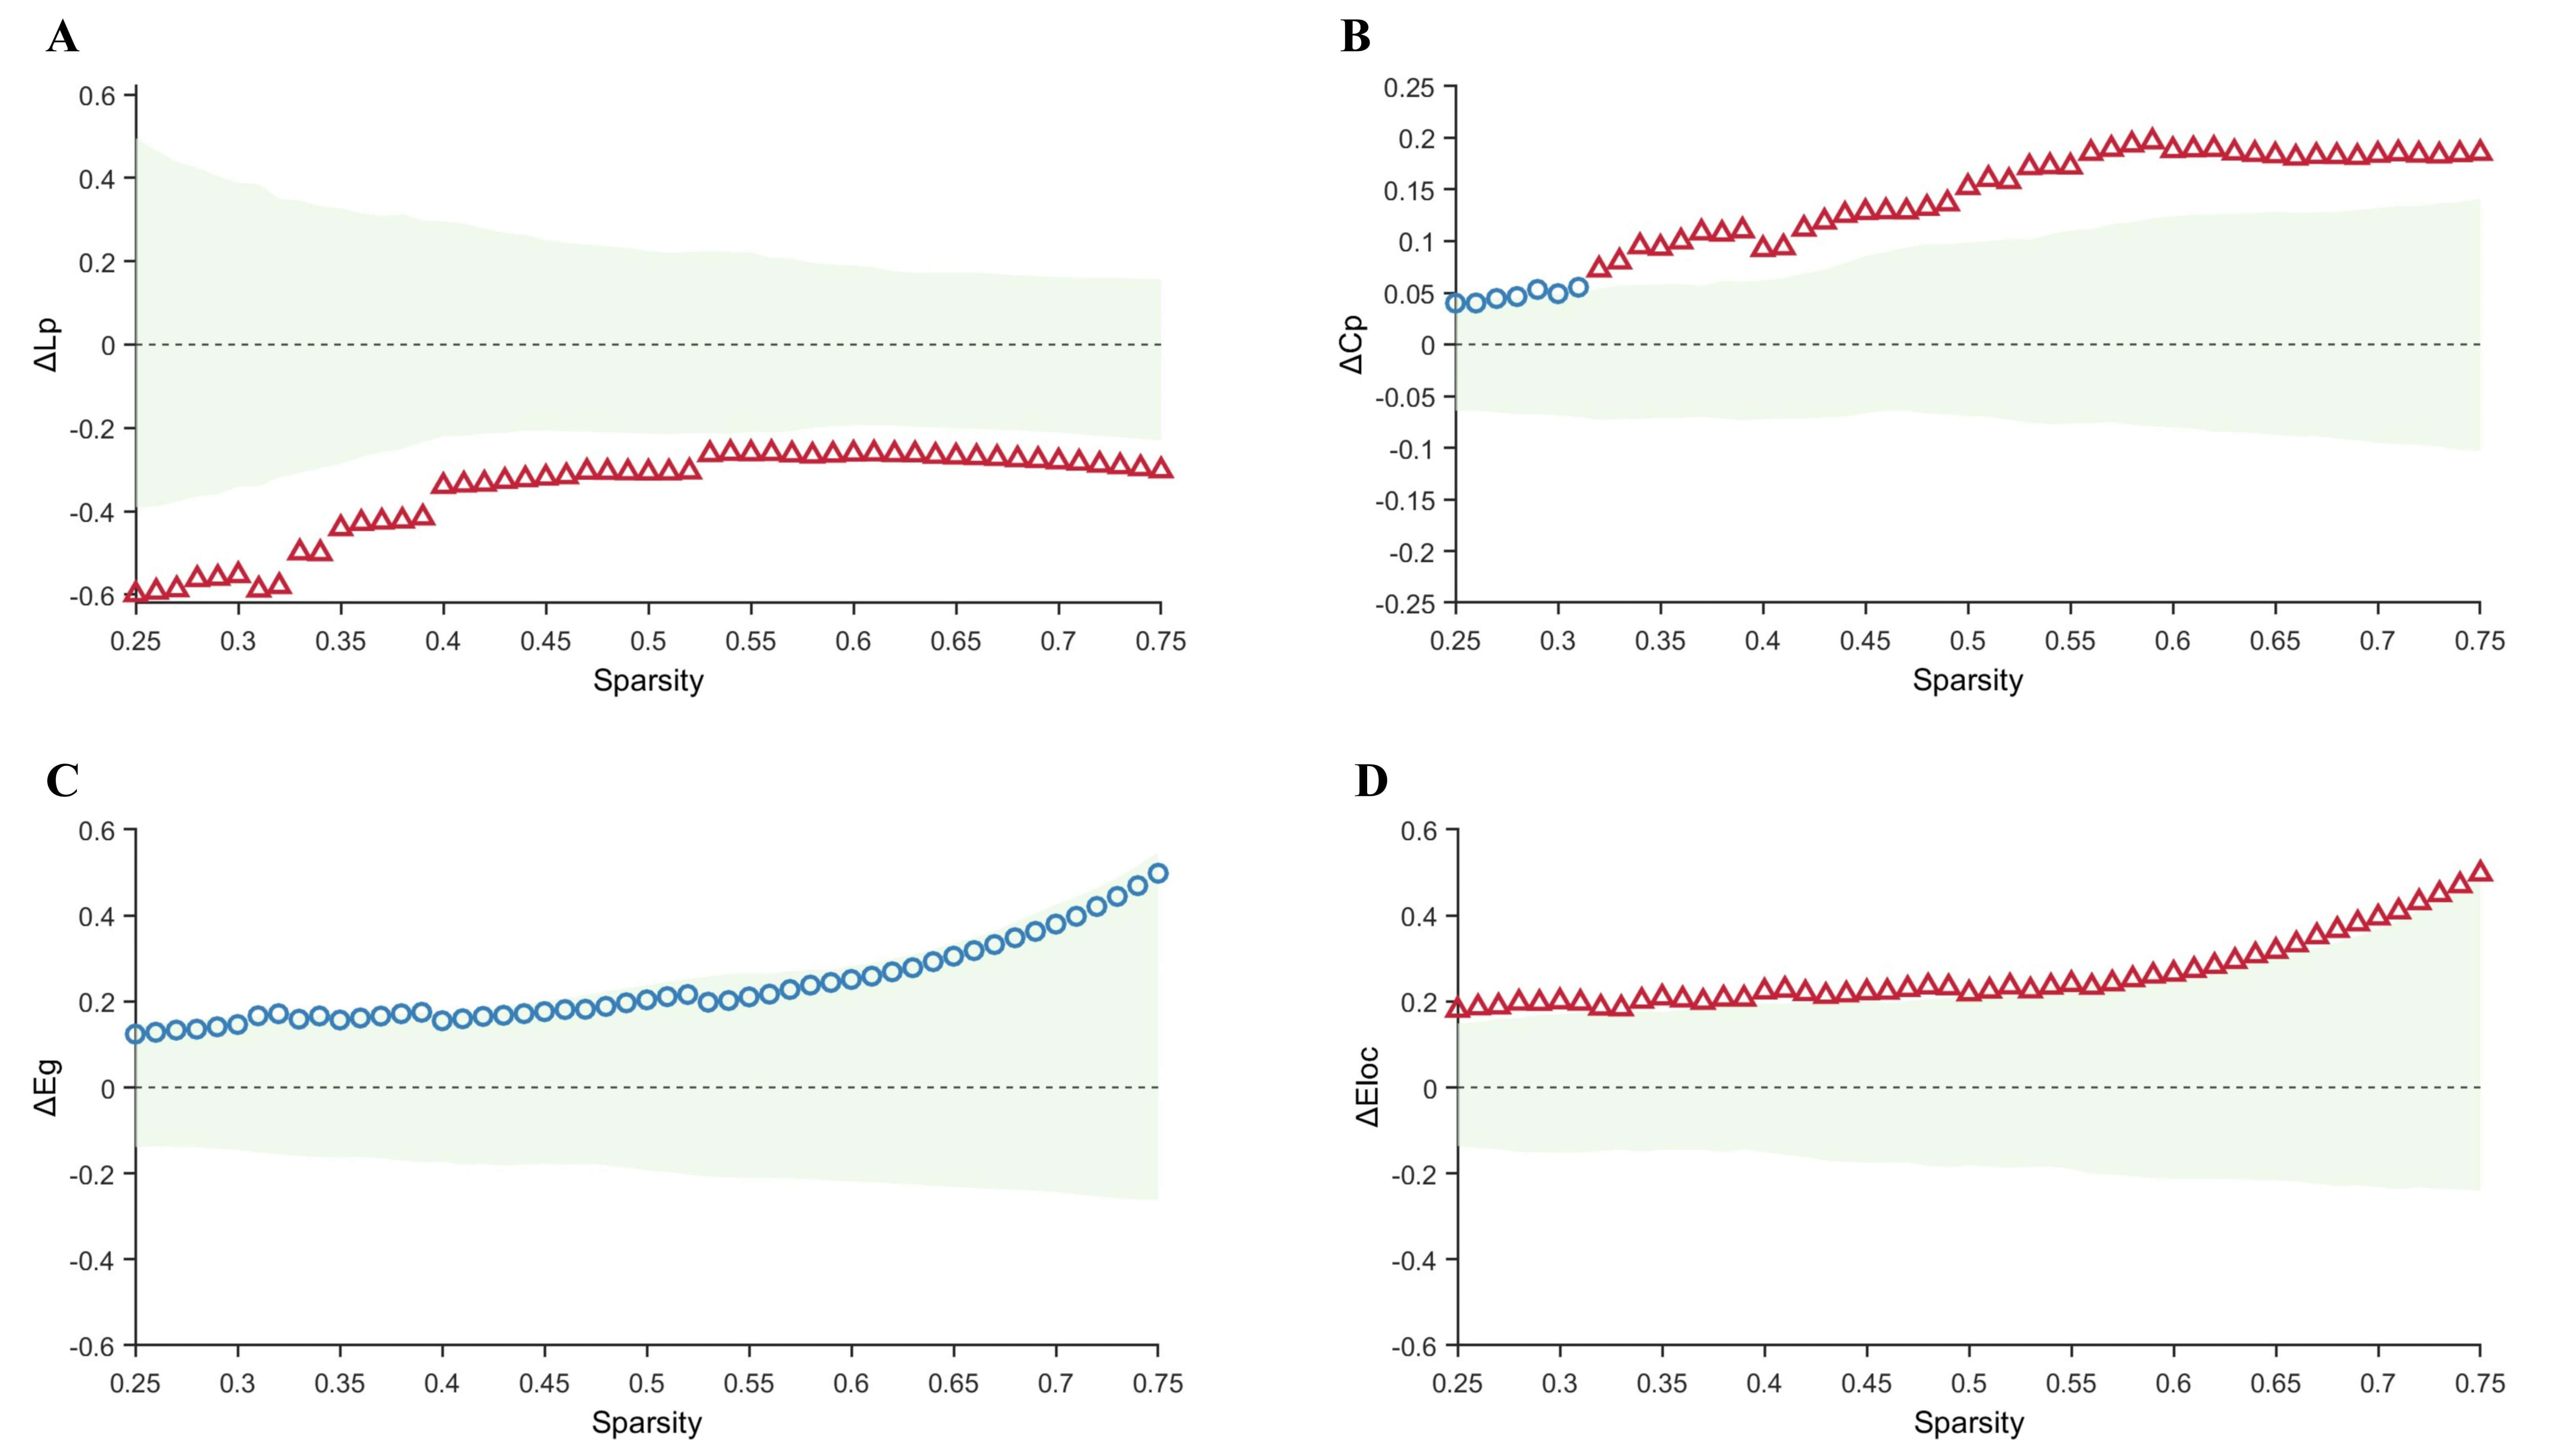 Fig. 3.
Comparison of graph-theoretical metrics between the control and
TLE-AS groups. (A–D) Differences and confidence intervals of Lp, Cp, Eg, and
Eloc values between the control group and the TLE-AS group within the sparsity
range of 0.25–0.75. The green area represents the 95% CI, red triangles
represent significant between-group differences at each sparsity level
(pFDR
Direct comparison between the TLE-AS and TLE-IAS groups revealed no statistically significant intergroup differences in Lp, Cp, Eg, or Eloc (Fig. 4).
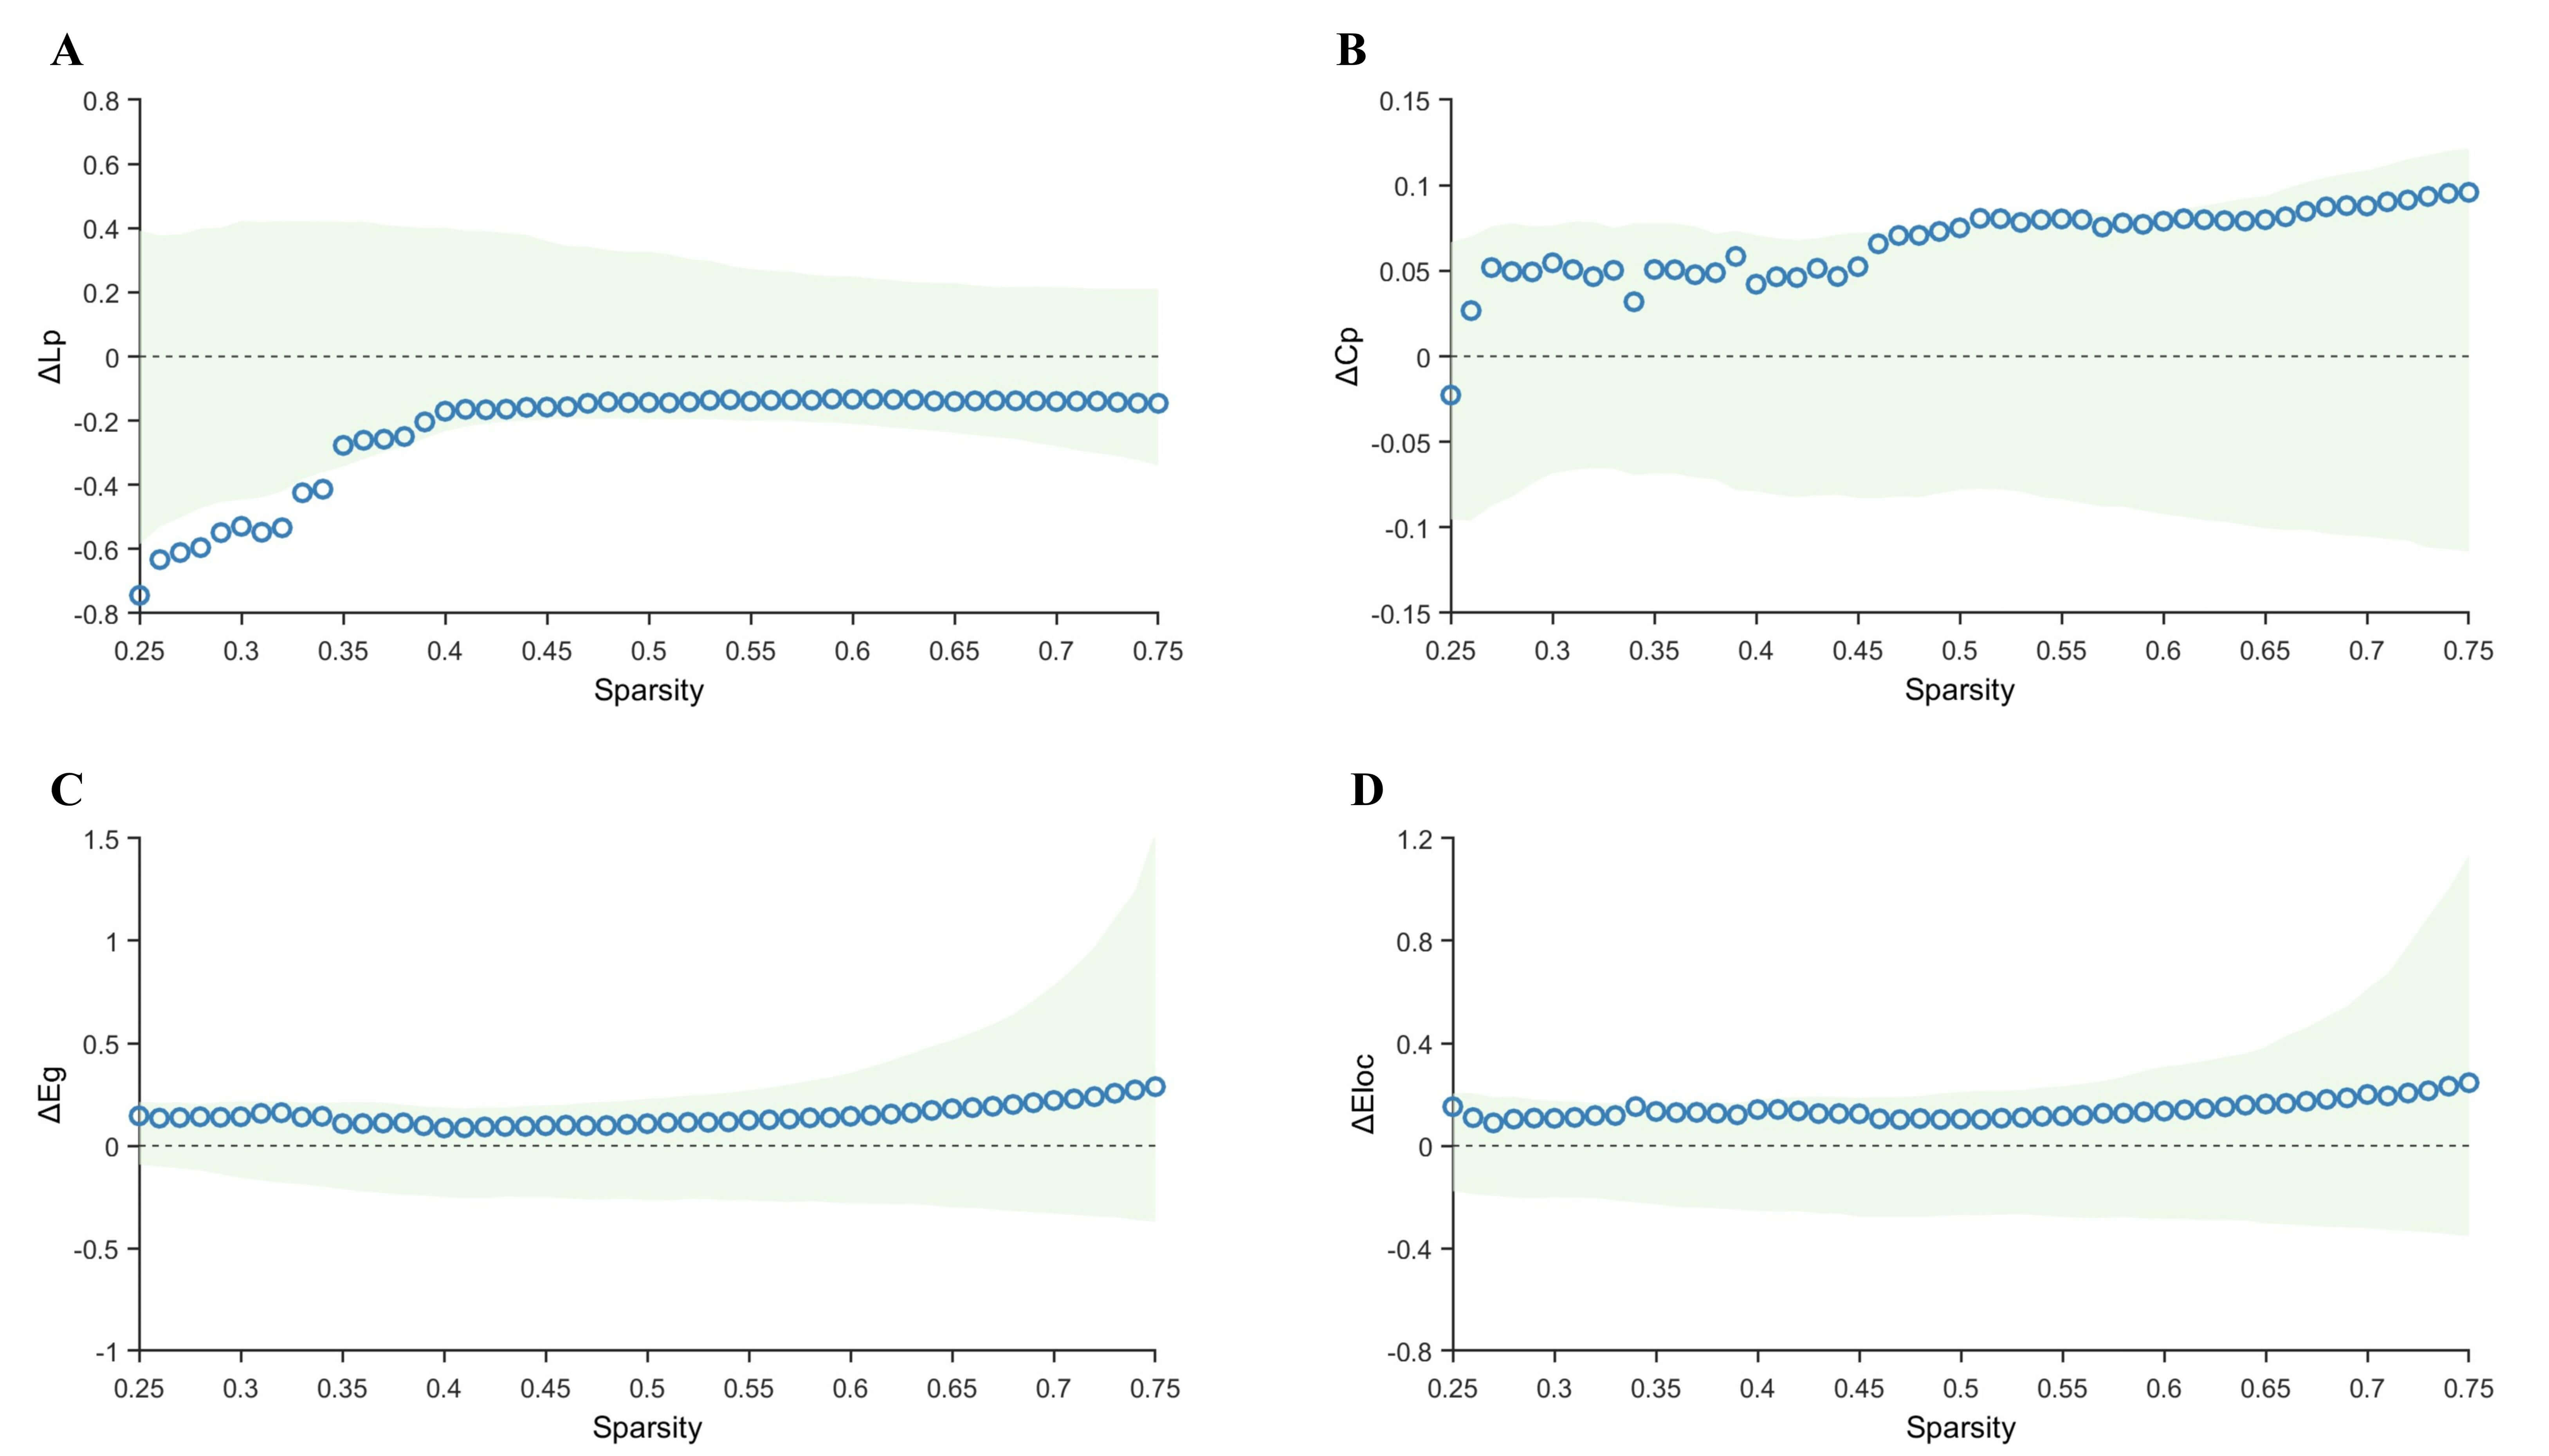 Fig. 4.
Comparison of graph-theoretical metrics between the TLE-AS and
TLE-IAS groups. (A–D) Differences and confidence intervals of Lp, Cp, Eg, and
Eloc values between the TLE-AS and the TLE-IAS group within the sparsity range of
0.25–0.75. The green area represents the 95% CI, red triangles represent
significant between-group differences at each sparsity level (pFDR
Hub nodes, characterized by high centrality, play a key role in information integration and relay within brain networks. In this study, hub nodes were defined at the group level as nodes with Bc values greater than twice the mean Bc and surviving permutation testing.
To compare the hub nodes, a common sparsity threshold of 0.48 was applied,
defined as the minimum value ensuring a global efficiency
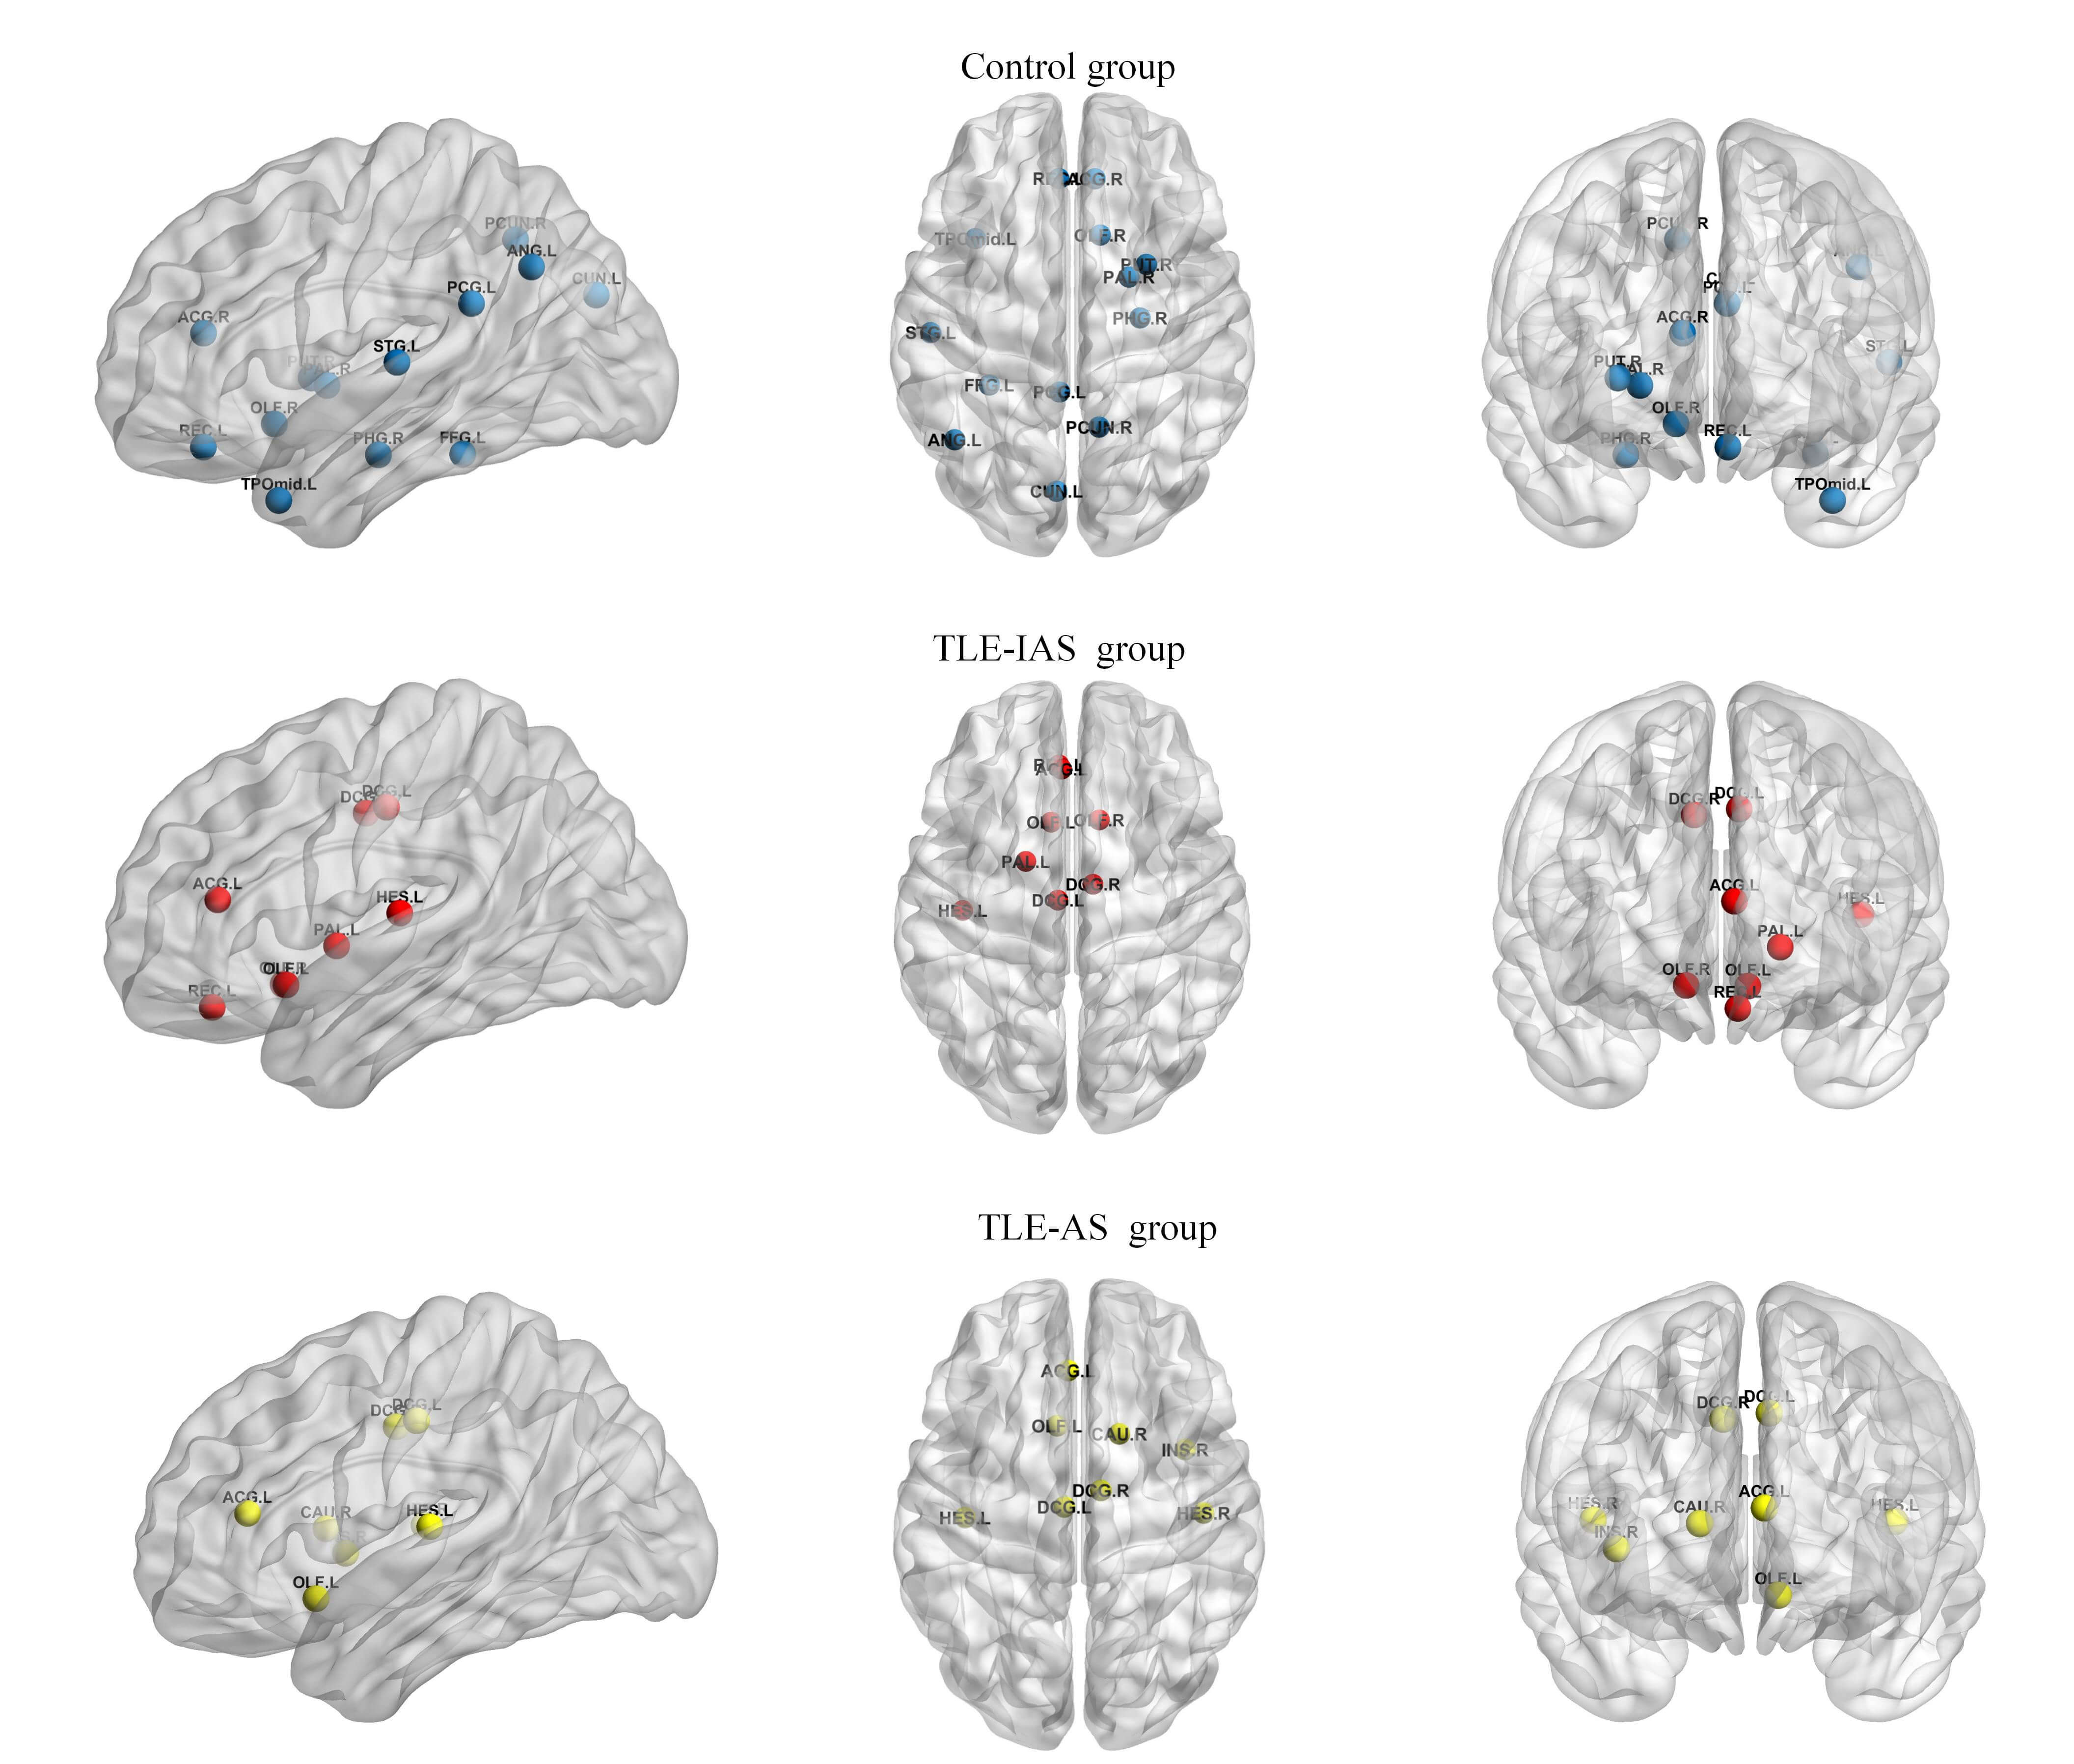 Fig. 5.
Hub nodes in the control, TLE-IAS, and TLE-AS groups. Blue, red, and yellow spheres represent hub nodes in the control, TLE-IAS, and TLE-AS groups, respectively.
| Brain Region | Abbreviation | Functional classification | Control Group | TLE-IAS Group | TLE-AS Group |
| Olfactory cortex, left | OLF.L | Limbic | - | ✓ | ✓ |
| Olfactory cortex, right | OLF.R | Limbic | ✓ | ✓ | - |
| Gyrus rectus, left | REC.L | Paralimbic | ✓ | ✓ | - |
| Anterior cingulate and paracingulate gyri, left | ACG.L | Paralimbic | - | ✓ | ✓ |
| Anterior cingulate and paracingulate gyri, right | ACG.R | Paralimbic | ✓ | - | - |
| Median cingulate and paracingulate gyri, left | DCG.L | Paralimbic | - | ✓ | ✓ |
| Median cingulate and paracingulate gyri, right | DCG.R | Paralimbic | - | ✓ | ✓ |
| Posterior cingulate gyrus, left | PCG.L | Paralimbic | ✓ | - | - |
| Insula, right | INS.R | Paralimbic | - | - | ✓ |
| Parahippocampal gyrus, right | PHG.R | Paralimbic | ✓ | - | - |
| Temporal pole: middle temporal gyrus, left | TPOmid.L | Paralimbic | ✓ | - | - |
| Caudate nucleus, right | CAU.R | Subcortical | - | - | ✓ |
| Putamen, right | PUT.R | Subcortical | ✓ | - | - |
| Pallidum, left | PAL.L | Subcortical | - | ✓ | - |
| Pallidum, right | PAL.R | Subcortical | ✓ | - | - |
| Cuneus, left | CUN.L | Association | ✓ | - | - |
| Fusiform gyrus, left | FFG.L | Association | ✓ | - | - |
| Angular gyrus, left | ANG.L | Association | ✓ | - | - |
| Precuneus, right | PCUN.R | Association | ✓ | - | - |
| Superior temporal gyrus, left | STG.L | Association | ✓ | - | - |
| Heschl gyrus, left | HES.L | Primary/Auditory | - | ✓ | ✓ |
| Heschl gyrus, right | HES.R | Primary/Auditory | - | - | ✓ |
Check marks (✓) indicate brain regions identified as hub nodes.
Compared with the control group, both TLE patient groups exhibited a consistent loss of hub nodes in the default mode network and a widespread reduction of hubs in other higher-order association cortices. Concurrently, the overall hub distribution shifted toward limbic and paralimbic regions, accompanied by the emergence of new hub nodes in the primary auditory cortex. Additionally, differences in hub composition were observed between both patient groups: the TLE-IAS group exhibited two limbic hubs compared to one in the TLE-AS group, while the TLE-AS group had two primary auditory hubs compared to one in the TLE-IAS group.
This study used 18F-FDG PET to construct metabolic brain networks. To our knowledge, for the first time, we systematically compared the global topological properties and hub node distributions between TLE-AS and TLE-IAS patients. The main findings can be summarized as follows: both patient groups exhibited reduced network efficiency and a widespread loss of hub nodes in the default mode network and higher-order association cortices. However, key differences were observed in hub reorganization patterns between both patient groups: the TLE-IAS group had a greater number of hubs within the limbic system, whereas the TLE-AS group had more hubs in the primary auditory cortex (with a bilateral distribution).
Recently, awareness during epileptic seizures has attracted growing research interest [31, 32]. According to the ILAE, awareness is assessed based primarily on postictal recall, excluding responsiveness, since patients may be aware but unable to respond due to behavioral arrest [2]. However, Contreras et al. [33] found that most clinicians assess both ictal responsiveness and postictal recall when classifying focal seizures. Therefore, consistent with previous studies [21, 34], we defined impaired awareness seizures as those involving reduced responsiveness to verbal questions, inability to follow commands, or failure to recall ictal experiences.
PET-based analysis of the metabolic brain network offers high robustness and reproducibility [25], partly due to its independence from neurovascular coupling and the whole-brain coverage provided by 18F-FDG PET. This study revealed that compared to controls, both patient groups exhibited widespread disturbances in metabolic connectivity, suggesting impaired large-scale functional coherence in TLE. Graph-theoretic analysis further demonstrated that both patients with TLE-IAS and TLE-AS shared a similar pattern of network impairment, characterized by increased Lp and decreased Cp, reflecting longer communication distances and reduced local integration efficiency. These findings align with previous studies on brain networks in epilepsy [35, 36, 37].
Notably, a direct comparison between the TLE-IAS and TLE-AS groups revealed no significant differences in any of the four graph-theoretical parameters. This suggests that the overall severity of network impairment at the topological level is similar in both patient groups. This pattern differs from the weakening of network connectivity reported in patients with pharmacologically induced unconsciousness. A plausible explanation is that the chronic and widespread network damage caused by TLE may constitute a dominant pathological background, masking the more subtle or state-specific topological changes related to varying degrees of awareness. Additionally, since all imaging data were acquired during the interictal period, dynamic network alterations directly driven by impaired awareness may be less pronounced than those seen in pharmacological models. Therefore, future studies should aim to identify awareness-sensitive topological properties and subnetworks [38], or incorporate multimodal recordings (e.g., ictal EEG) to capture dynamic changes in brain networks.
Hub nodes, which concentrate numerous shortest paths, are critical for efficient information exchange in the brain. First, compared with the control group, the TLE-IAS and TLE-AS groups exhibited a similar pattern of network reorganization, including the loss of hub nodes in the default mode network and the superior parietal cortex, with hub distribution converging toward the limbic and paralimbic systems. This finding is consistent with previous studies reporting weakened connectivity or functional abnormalities in default mode networks across multiple epilepsy subtypes [39, 40]. Furthermore, it corroborates earlier observations that in patients with TLE, the hub nodes predominantly exist in the paralimbic/limbic systems [41], supporting Bonilha et al.’s proposed reorganization [42] of limbic regions in TLE. This study also revealed a reduction in hub nodes within the subcortical basal ganglia region across both patient groups (only 1 retained versus 2 in controls), consistent with previous reports showing diminished node strength in this area among epileptics [43]. Regarding the newly identified hub nodes in the primary auditory cortex across both patient groups, we propose that their emergence may compensate for reduced whole-brain integration efficiency and the loss of hub nodes in higher association cortices or may relate to the frequent auditory aura symptoms observed in patients with TLE. Based on the above discussion of the similar pattern in TLE, we propose a preliminary hypothesis that this pattern may facilitate the propagation of epileptic discharges through the limbic/paralimbic system. Further, compensatory alterations in the primary auditory cortex may indicate abnormal discharges in this region during seizures, potentially contributing to auditory auras and other abnormal perceptions. Future studies should further examine the relationship between auditory cortex hub formation and specific clinical symptoms by including a subgroup of patients with auditory aura or by integrating seizure-period EEG data.
The difference in hub distribution between the TLE-IAS and TLE-AS groups provides preliminary insights into the neural substrates underlying their distinct awareness states. Compared to the TLE-IAS group, which exhibited only one additional hub in the primary auditory cortex, the TLE-AS group showed two new hubs in the bilateral primary auditory cortex (HES.L and HES.R), which may provide the neural network foundation for maintaining basic awareness and sensory processing during epileptic seizures. Moreover, compared to the control and TLE-AS groups, the TLE-IAS group exhibited a higher number of hub nodes in the limbic system. This might be due to an accumulation of pathological states. However, whether this difference is directly related to impaired awareness or attributable to epileptic burden remains unclear. Future studies should validate this finding by controlling for key variables, such as seizure frequency and medication use, or expanding the sample size of patients with TLE-AS. Recently, two major hypotheses have been proposed to explain impaired awareness during seizures: the “network inhibition hypothesis” [18] and the “global workspace theory” [17], which collectively highlight the importance of the frontal cortex in the awareness system. However, in contrast to these theories, we observed that REC.L, a hub node in the prefrontal cortex, was specifically lost in the TLE-AS group, whereas it was present in both the control and TLE-IAS groups. Given the limitations of the current cross-sectional study design, the specific mechanisms underlying this phenomenon are difficult to fully explain. To avoid overinterpretation, we present this finding here as a critical observation, warranting targeted experimental designs to underscore its exact significance.
This study has several limitations. First, the sample size of the TLE-AS group is relatively small, mainly due to the low prevalence of TLE-AS in clinical settings and limited PET/CT utilization in this subgroup. Although bootstrap resampling was applied to improve robustness, future studies should aim to expand this cohort to strengthen the conclusions. Second, the network analysis was conducted at the group level, potentially overlooking individual variability. In the future, individualized network approaches, such as those based on Kullback–Leibler divergence, can be adopted to capture subject-specific topological profiles. Third, given the radiation exposure associated with PET/CT, control subjects were recruited from patients without neuropsychiatric conditions rather than healthy volunteers. Even with careful age- and sex-matching, unmeasured confounders may persist. Fourth, although the broad age range (6–65 years) was similar to that of some related studies and showed no statistically significant intergroup differences, developmental differences in the brain metabolic network between children and adults might introduce confounding effects. Finally, owing to the retrospective nature of the study, several clinically relevant variables (e.g., seizure side, medication regimen, seizure frequency, and surgical pathological or stereo-electroencephalography findings) were not systematically controlled. These factors might preclude precise localization of the seizure onset zone for causal inference and may introduce variability in metabolic network patterns, which should be accounted for in future prospective designs.
This study reveals distinct patterns of metabolic brain network reorganization in TLE-IAS and TLE-AS. Graph-theoretic analysis revealed that both patient groups exhibited weaker global metabolic connectivity and lower network efficiency than the controls. Regarding hub node distribution, both groups demonstrated loss of hub nodes in the default mode network and the superior parietal cortex, with distribution shifting toward the limbic/paralimbic system. Compared to the TLE-AS group, the TLE-IAS group showed no significant differences in graph theory parameters. However, the hub nodes in the TLE-IAS group were more prevalent in the limbic system, whereas they were primarily found in the primary auditory cortex in the TLE-AS group. These findings provide novel metabolic imaging-based evidence for understanding the neural basis of impaired awareness in TLE and establish a theoretical framework for future targeted interventions. Future studies should validate these network characteristics through balanced patient cohorts and prospective designs, translating them into practical tools for clinical precision diagnosis and treatment stratification.
The datasets used and analyzed in the present study are available upon request from the corresponding author.
JX and JL designed the research study. JX and FY performed the research. FY provided help and advice on visualization. HZ analyzed the data. JX and FY wrote the manuscript. JL provided project administration and funding acquisition. All authors contributed to editorial changes in the manuscript. All authors read and approved the final manuscript. All authors have participated sufficiently in the work and agreed to be accountable for all aspects of the work.
The study was conducted in accordance with the Declaration of Helsinki. The research protocol was approved by the Ethics Committee of Medical Ethics Experts of the Second Hospital of Lanzhou University (Ethic Approval Number: 2025A-141), and all of the participants provided signed informed consent.
The authors thank all the participants for their assistance and cooperation with our study.
This research was funded by the Joint Funds of the Science and Technology Program of Gansu Province (Grant No. 24JRRA922) and the Science and Technology Program of Gansu Province (Grant No. 23ZDFA003).
The authors declare no conflict of interest.
During the preparation of this work, the authors utilized DeepSeek for spelling and grammar checks and employed ChatGPT-5.0 for English language polishing. After using these tools, the authors reviewed and edited the content as necessary and take full responsibility for the publication’s content.
Supplementary material associated with this article can be found, in the online version, at https://doi.org/10.31083/JIN47320.
References
Publisher’s Note: IMR Press stays neutral with regard to jurisdictional claims in published maps and institutional affiliations.