


 , José Antonio González 1,*
1 The Rowett Institute, School of Medicine, Medical Sciences and Nutrition, University of Aberdeen, Foresterhill, Aberdeen AB25 2ZD Scotland, UK
Abstract
The ability to measure drinking behaviour in laboratory animals is fundamental for neuroscience and metabolic research. In particular, the analysis of lick microstructure is an important tool for studying ingestive behaviour, motivation, and food preference. To capture lick microstructure, sensors capable of detecting licks in animals with a time resolution of only a few milliseconds are required.
We designed a lick sensor that can be used with standard drinking bottles and does not require modifications to animal cages. It can be used in any experimental arena and with one or more drinking bottles simultaneously. Moreover, this lickometer reports lick events in real time and is thus suitable for driving additional laboratory hardware for real-time loop-control experiments. Our design is publicly available.
To validate our lick sensor we measured licks in mice offered water or sucrose drinks. Our sensor captured the same features of licking behaviour that have been reported before for these conditions using alternative lick sensors.
The lick sensor described here is reliable while being easy to build and less expensive than known alternatives. It also facilitates the integration of lick measurements with other laboratory instruments in real time. This sensor lowers the barrier to implementing lick-sensing instrumentation in the laboratory which will be of benefit for research in neuroscience and metabolism.
Keywords
- lick microstructure
- open-source hardware
- instrumentation
- lick sensor
- behavioural neuroscience
The ability to quantify drinking behaviour in laboratory animals has been an essential part of behavioural and metabolic research for decades [1, 2, 3]. Often, the focus is on measuring the volume of liquid intake over relatively long periods of time (hours or days), which can provide essential information about, e.g., degrees of thirst or caloric intake. In other cases, however, it is important to be able to characterise lick-by-lick the precise timing of fluid intake rather than the exact volume consumed, because licking patterns can be a useful measure of ingestive behaviour [1, 4, 5, 6]. This requires the ability to quantify licking with a temporal resolution of milliseconds. Such ability is particularly important for experiments where licking is assessed in combination with recordings of fast changes in cellular activity, e.g., in vivo electrophysiology [7] or photometry [8], in order to investigate correlates between neural activity and behaviour.
Instruments for measuring licks (as opposed to volume of liquid intake) are commonly termed lick sensors or lickometers. Several manufacturers of scientific equipment offer lickometers for research. Often, however, these commercial lickometers can only be used in conjunction with proprietary hardware and software. For example, some commercially-available lickometers are designed to only fit predetermined, proprietary animal cages, and require specific control and data acquisition hardware and software supplied by the same manufacturer. This not only increases costs dramatically but can also be a barrier to using lick sensors in combination with additional laboratory instruments.
To increase flexibility and reduce costs, several researchers have proposed lick sensor designs that can be implemented in the lab using a few electronic components [9, 10, 11, 12, 13, 14]. These designs have in common that the animal is part of an electrical circuit that is completed with every lick, the tongue acting effectively as a switch: licks are detected by the opening and closing of the electrical circuit (Fig. 1A) [15]. One disadvantage of this design is that the experimental arena must be modified to include conductive material on the floor, on top of which the animal must stand when licking in order to complete the electrical circuit (Fig. 1A). Moreover, the data recorded by these methods is often an analog signal (i.e., voltage oscillations) that require a degree of post-processing, e.g., thresholding the signal to extract the licking events (Fig. 1B) [9, 14], and this is unsuitable for real-time experimental loop-control.
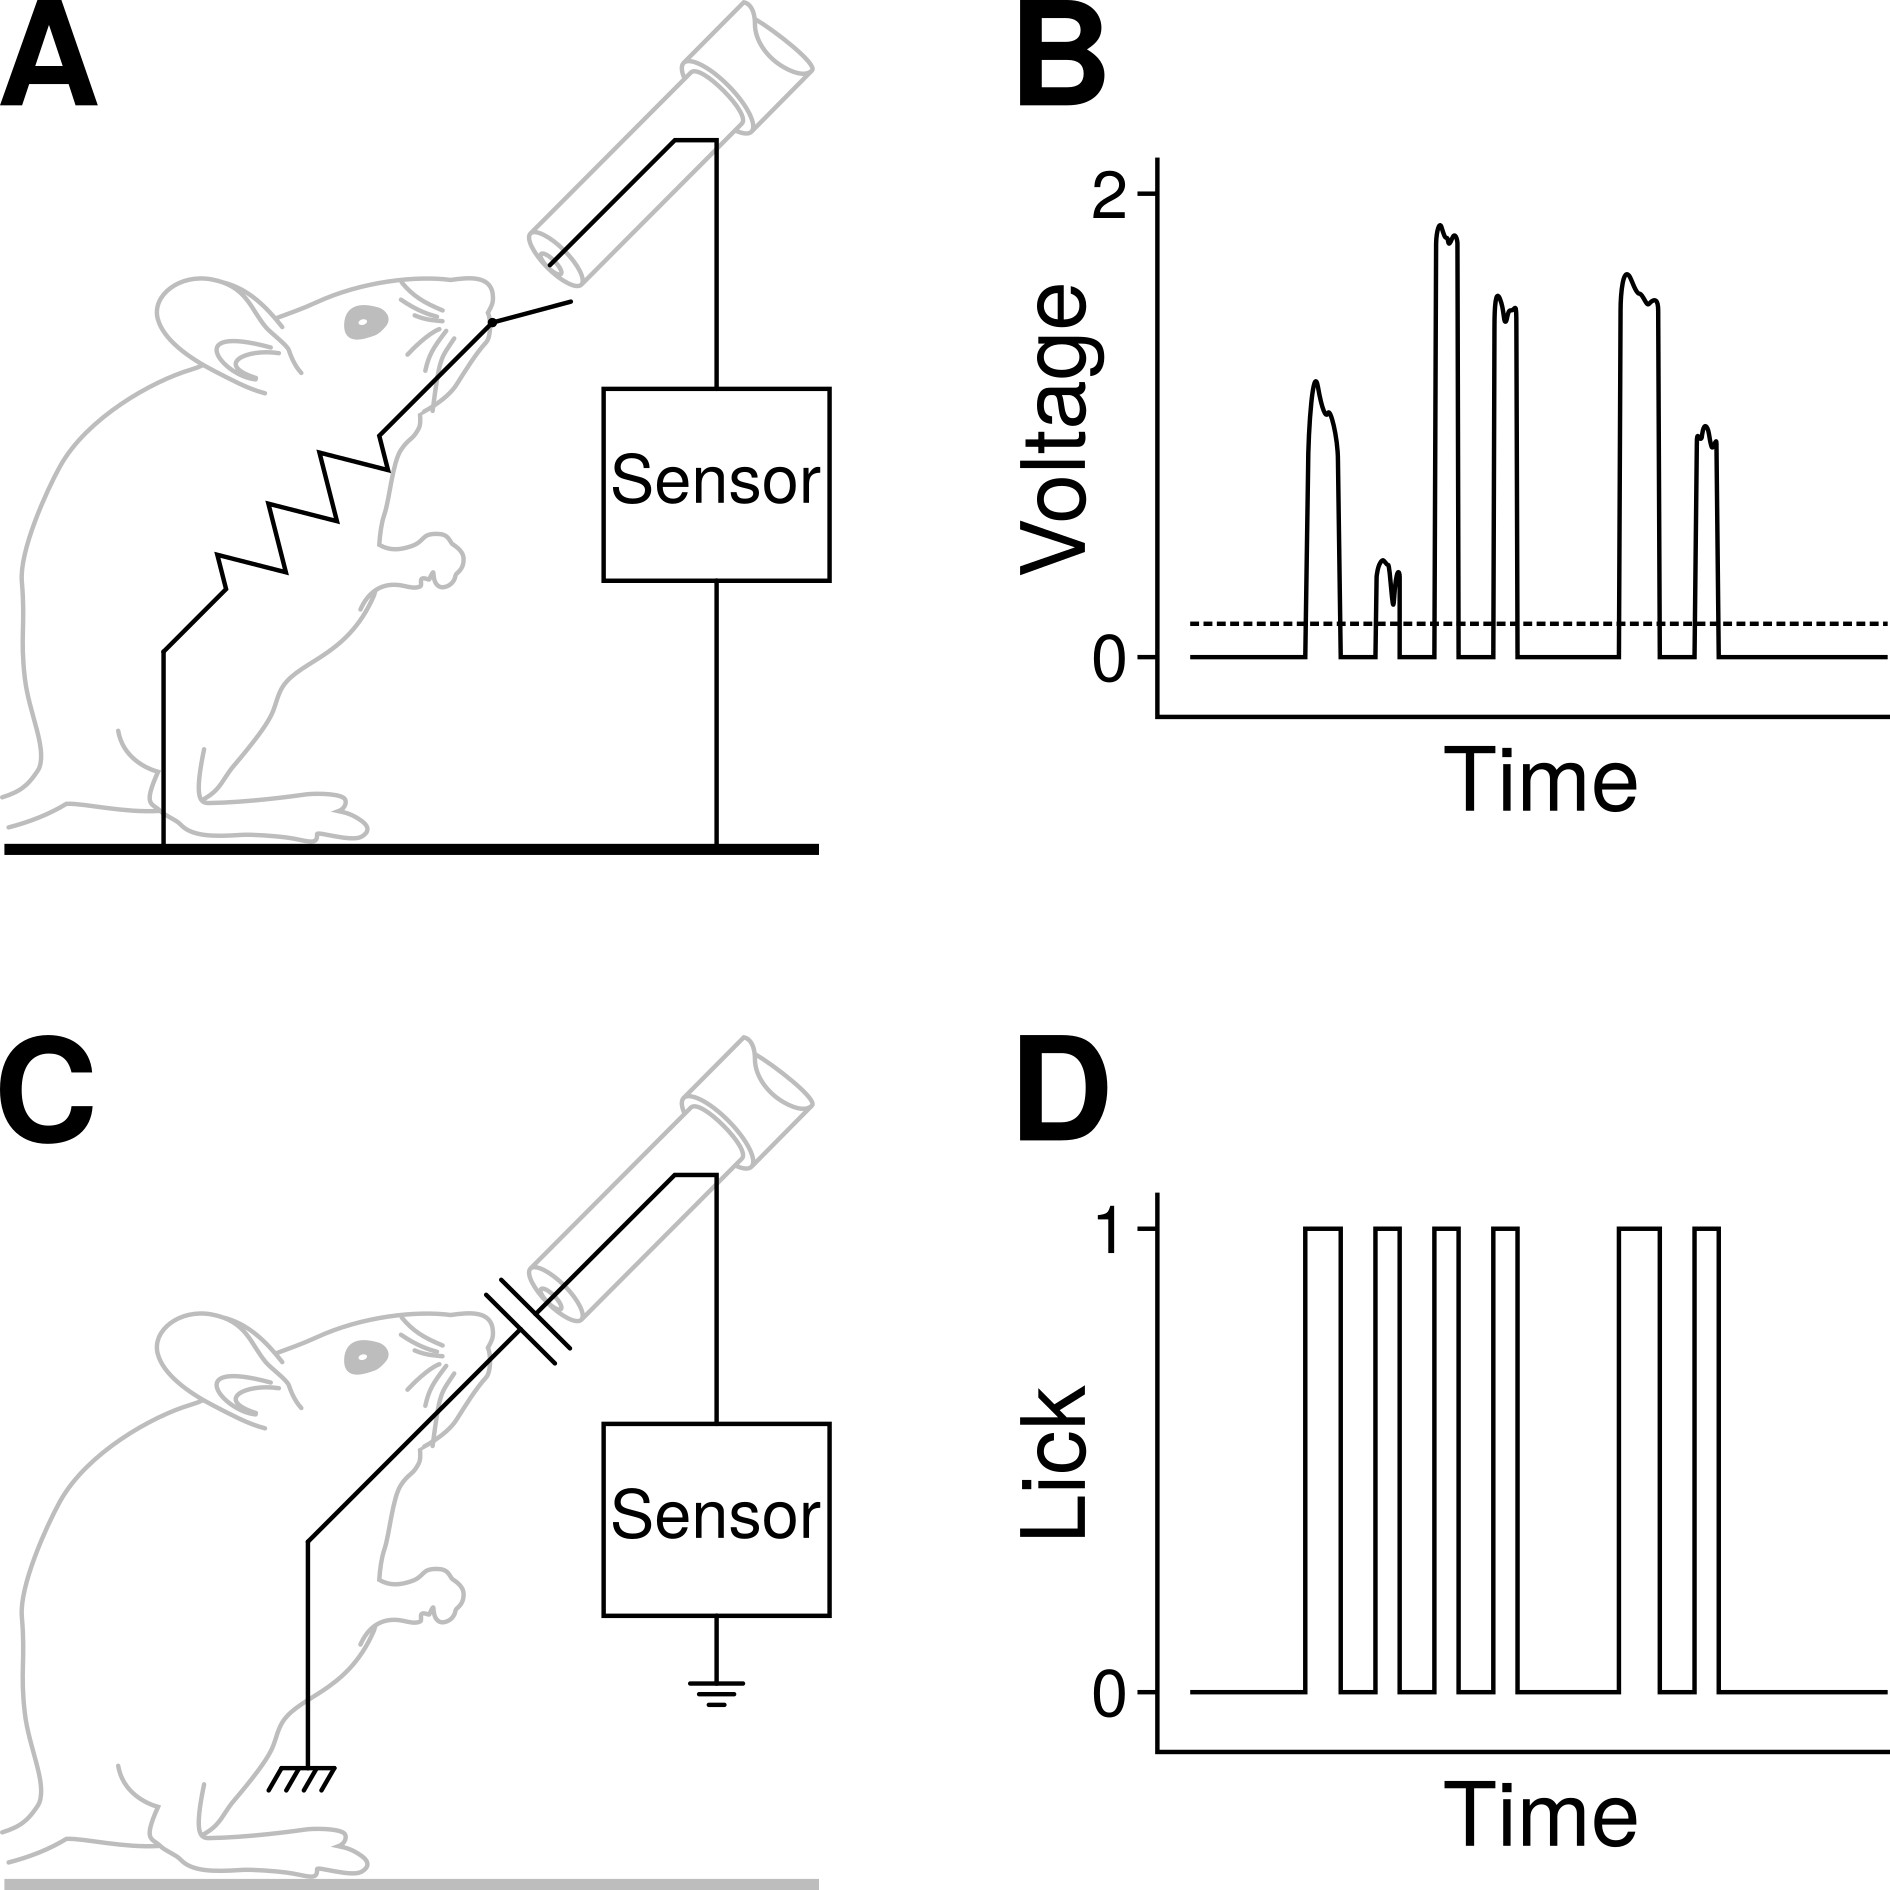 Fig. 1.
Advantages of capacitive lick sensors. (A) Many of the lick sensors currently available detect licks when the tongue of the animal, acting like a switch, closes an electrical circuit. To be able to complete the circuit, the animal must stand on a conductive platform (e.g., a metal grid) connected to the lick detection circuit. (B) Often, the output of these sensors is an analogue signal that requires some degree of postprocessing, e.g., setting a threshold (dashed line) to detect licks. (C) With capacitive sensors, the animal is not an integral part of the lick-detection circuit: no metal surfaces are required on the cage floor so the setup is simpler and more flexible. Physical contact with the spout induces changes in capacitance in the sensor’s circuit [16] and this is recorded as a lick event. (D) Lick events with a capacitive lick sensor are detected as on/off, binary events (i.e., a digital signal) in real time. Lick data is thus immediately available, and can potentially be used for, e.g., controlling an LED for in vivo optogenetics. LED, light-emitting diode.
Here, we describe an alternative, easy-to-build lick sensor that does not require modifications to the experimental arena (Fig. 1C, Ref. [16]), can be used with standard water bottles or drinking spouts, and detects licks in real time with millisecond precision. This system, based on off-the-shelf capacitive touch sensors, is inexpensive and easy to construct, can be connected to a variety of data acquisition systems, and can be used for real-time control of additional hardware such as light-emitting diodes (LEDs) for in vivo optogenetics.
Our lick sensing setup requires very few components. It consists of one or more standard drinking bottles for rodents, an off-the-shelf capacitive touch sensor, and a microcontroller to configure the sensor and read the data from it (Fig. 2). Lick data can be recorded with any laboratory data acquisition hardware and/or a computer.
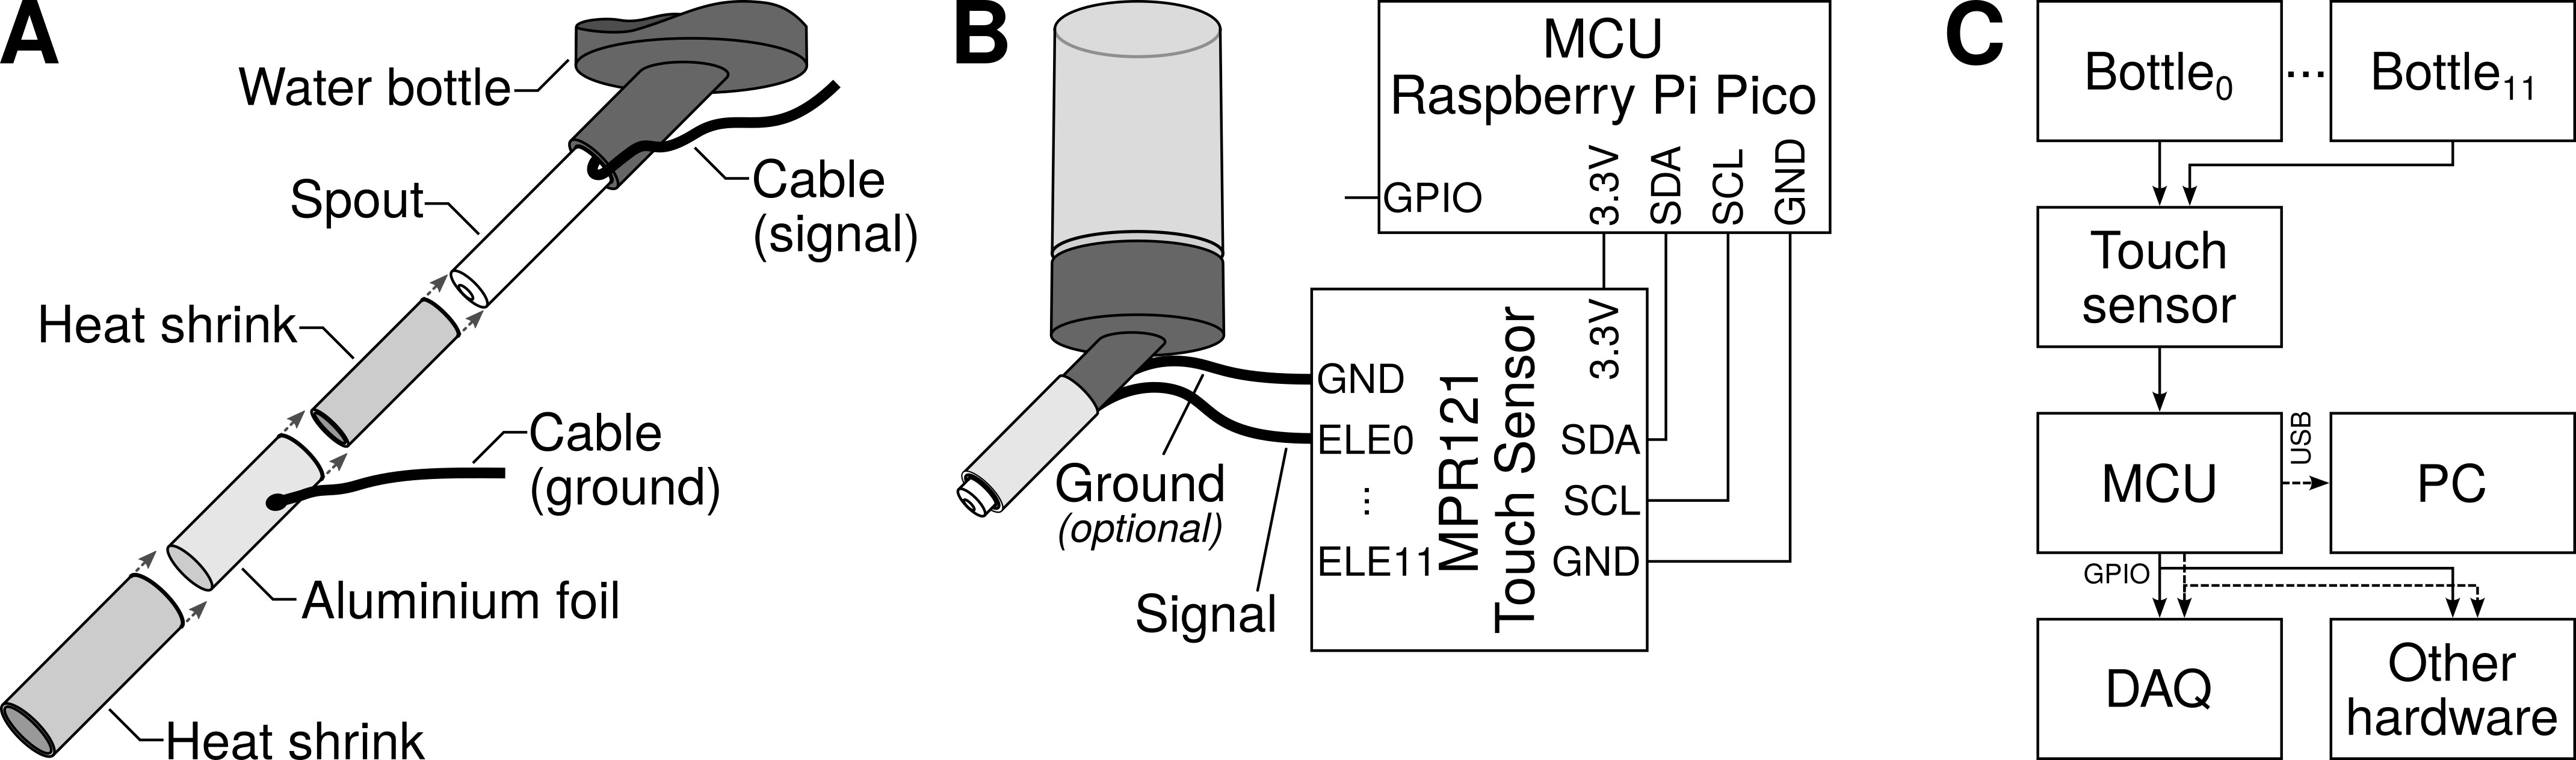 Fig. 2.
Summary of lick sensor construction and operation. (A) A capacitive lick sensor requires only one connection (signal cable) to the (metallic) spout of the drinking bottle. Optionally, to reduce noise and decrease the possibility of detecting false positives, the spout can be shielded with foil connected to a second cable (ground). (B) Diagram illustrating the connections between components. The signal cable from the spout is connected to any one of the touch-detecting input channels (keys or electrodes) in the capacitive touch sensor. The touch sensor is then connected to the microcontroller unit (MCU) with four cables: two for power (3.3V and GND), and two (SDA and SCL) for I2C serial communication. The output is read from one of the MCU’s general-purpose input/output (GPIO) pins. (C) More than one bottle can be connected to one touch sensor. Lick data is read by the MCU, and this can be recorded by any standard data acquisition (DAQ) system, it can be used for real-time control of additional hardware, and/or it can be sent to a personal computer (PC) for storage. GND, Ground pin; SDA, Data pin; SCL, Clock pin; I2C, Inter-Integrated Circuit; ELE, Electrode.
Any standard drinking bottle should work equally well with this lickometer. We used bottles for pet rodents (Crystal Deluxe Mini Bottle 75 mL, Classic Pet Products, Caldex Holdings Limited, Halifax, West Yorkshire, UK, cat. num. 0190) obtained from a local pet shop. One end of the signal cable (26 AWG (American Wire Gauge) stranded-core wire, although any standard hook-up wire should work) was inserted between the end of the spout closest to the bottle and its plastic housing (Fig. 2A). As this space is tight, there was no need to solder the cable to the spout to achieve electrical contact between the two.
Optionally, to decrease the chances of noise, the spout may be shielded. For this, the spout is covered in heat shrink, leaving only the tip exposed. Then, the heat shrink is in turn surrounded by a piece of aluminium foil to which a grounding cable is soldered, and the foil is then covered by a second layer of heat shrink (Fig. 2A). The foil and ground cable must not make contact with the spout or signal cable. We did not conduct formal tests to evaluate shielding because in our hands this feature was not necessary. Whether shielding is needed or not has to be assessed in each lab by trial-and-error as this need will depend on the specific lab environment.
We used a capacitive touch sensor module from Adafruit (product ID 1982; Adafruit Industries, LLC, Brooklyn, NY, USA), which is based on the MPR121 capacitive touch sensor controller from NXP Semiconductors (Eindhoven, Netherlands) (While NXP has discontinued the MPR121, the sensor is still available from Flip Electronics, see https://www.flipelectronics.com/Product/MPR121QR2-53295. Moreover, breakout boards using the MPR121 touch sensor are widely available online from several manufacturers, including Adafruit, MikroElektronika, and Seeed Studio). This sensor has 12 touch-detecting channels (also known as keys or electrodes). That means that it is possible to connect up to 12 drinking bottles to one single sensor, thus allowing to acquire data simultaneously from up to this many bottles.
Configuration of the touch sensor is achieved with the microcontroller unit (see https://github.com/antgon/lick-sensor-for-rodents for examples of how to do this), and there are several parameters that can be tuned, e.g., thresholds for touch detection, etc. (see MPR121 data sheet and application notes, available at https://www.nxp.com/products/MPR121, for details). We found, however, that modifying the MPR121 parameters was seldom needed; we used the MPR121 default factory settings for the experiments reported below.
Our choice of microcontroller was a Raspberry Pi Pico (Raspberry Pi Ltd, Cambridge, Cambridgeshire, UK) microcontroller board. The microcontroller interfaces with the MPR121 touch sensor using the standard Inter-Integrated Circuit (I2C) serial communication protocol. This requires only 4 cables, as illustrated in Fig. 2B. Power is supplied to the microcontroller with a battery or a USB cable.
The Raspberry Pi Pico can be programmed in MicroPython or in C. We chose the latter, and we developed a C library for using the Raspberry Pi Pico with the MPR121 sensor, available at https://github.com/antgon/pico-mpr121.
In its simplest configuration, the lickometer consists of a single drink bottle connected to the first electrode in the touch sensor (Fig. 2B). The microcontroller reads the sensor at regular intervals and sends the (digital) data to one of its general-purpose input/output (GPIO) pins. A data acquisition system connected to this pin records the data. The signal at the GPIO can also be used to control additional hardware in real time, for example a LED for optogenetics.
It is possible to acquire licking information from up to twelve drink bottles simultaneously using only one touch sensor (Fig. 2C). In this case, the microcontroller is programmed to route the data from each bottle to different GPIO pins, which again are connected to data acquisition hardware to record the data.
Alternatively, the microcontroller can be programmed to detect lick events; that is, instead of sending a continuous stream of on/off sensor values (Fig. 3A) to GPIO pins, the microcontroller detects the time at the onset of each lick and sends the timestamp to a connected computer. The computer saves these timestamps to a text file. The advantage of this method is that the resulting file is smaller and can be analysed without the need to further process the data. This method, however, is not compatible with real-time loop-control of additional hardware.
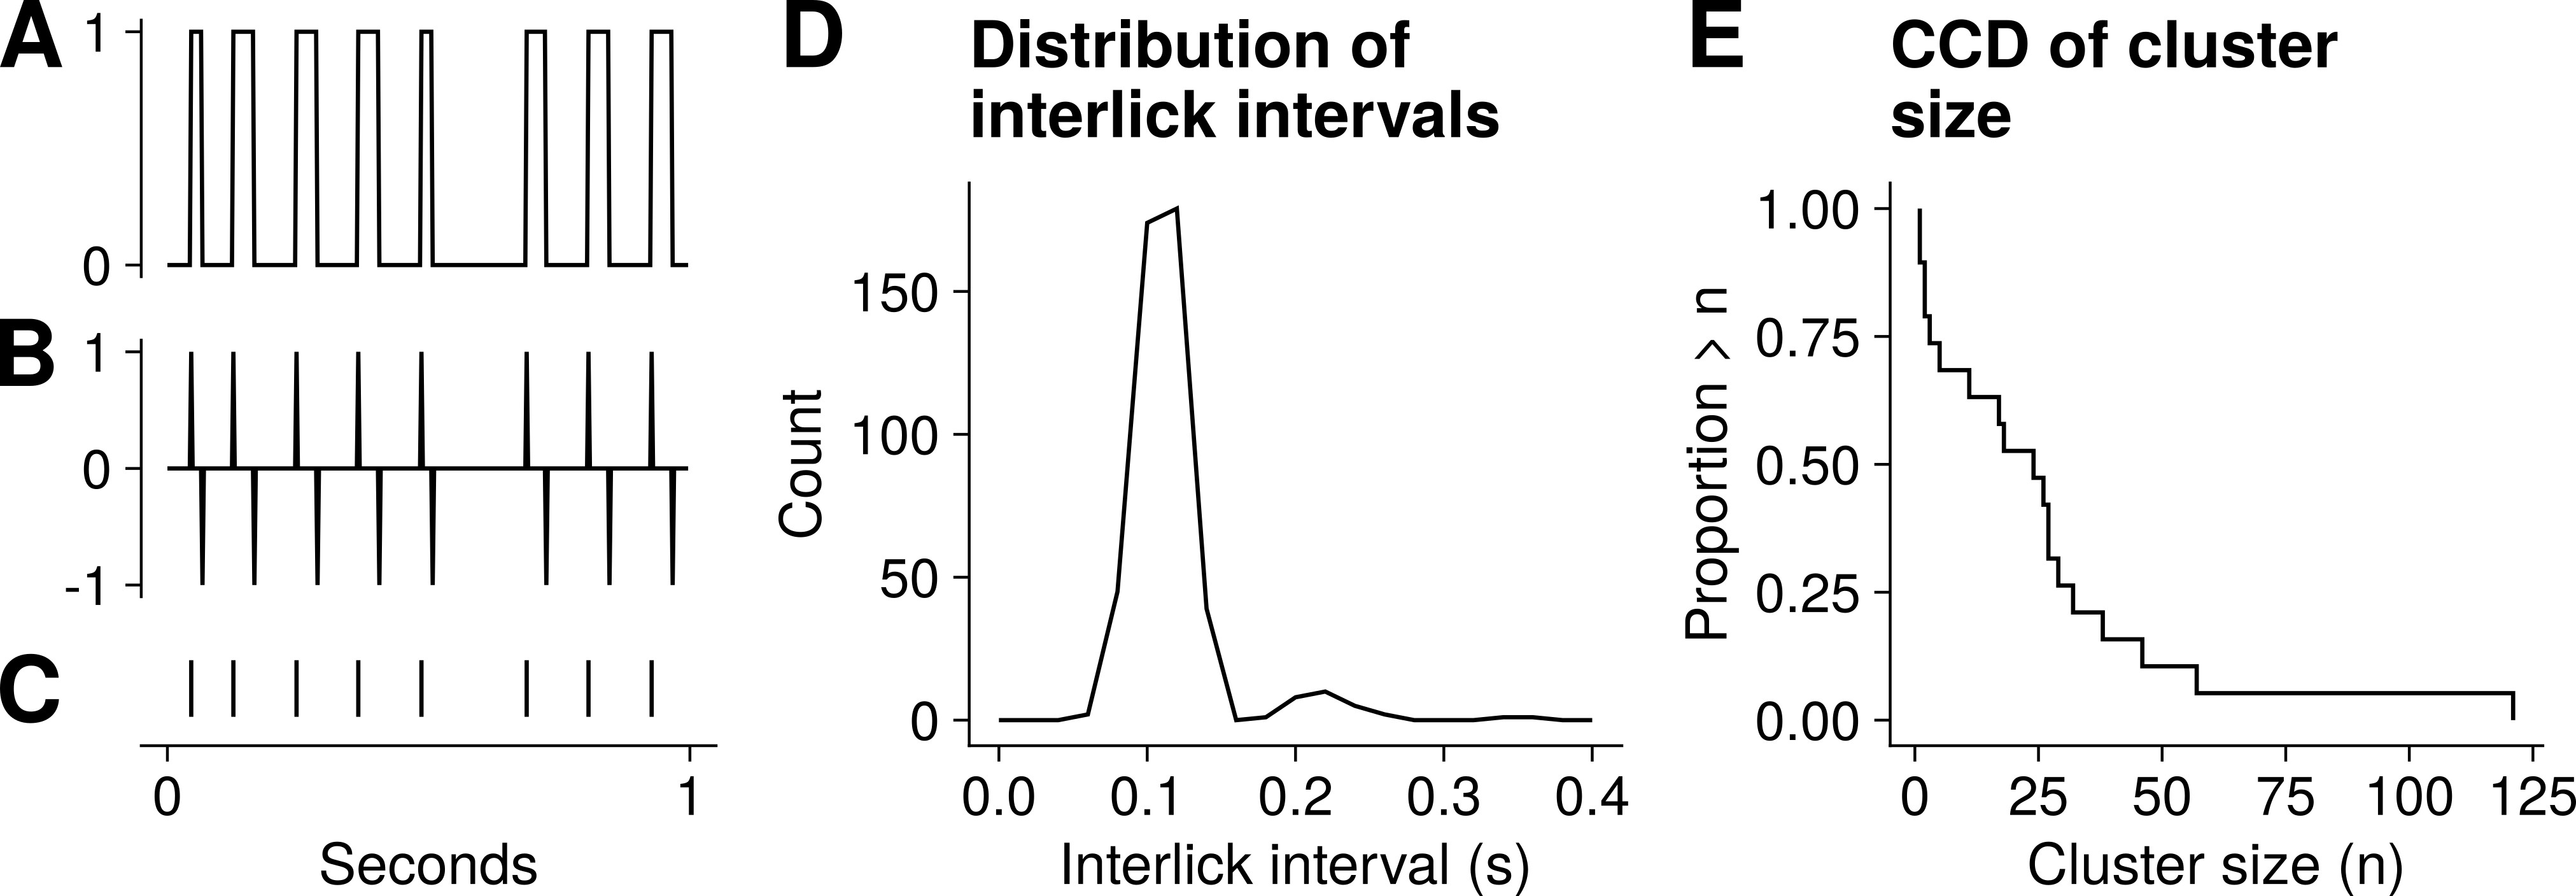 Fig. 3.
Representative example of lick data. (A) One-second trace of data obtained during a 20-minute lick session. The data consists of 0s and 1s, with 1s indicating the period of contact with the lick sensor. (B) Successive differences of vector in A. (C) Lick events, obtained from the vector in B. (D) Distribution of interlick intervals for a 20-minute lick session for one animal. (E) Complementary cumulative distribution (CCD) of cluster size from the same session.
Examples of how to connect the touch sensor and configure the microcontroller for each of these scenarios are provided on the online repository associated with this manuscript (https://github.com/antgon/lick-sensor-for-rodents).
To validate our lick sensor we carried out two independent experiments. In Experiment 1 we recorded licking behaviour in mice presented with one of two sucrose solutions (5% or 20% sucrose) on separate occasions, whereas in Experiment 2 we recorded licking behaviour in mice who had simultaneous access to water and 2% sucrose. If the lick sensor is reliable and works as expected, analysis of licking in these experiments should match what is already known about licking behaviour in mice under similar experimental scenarios.
We used five male C57BL/6 mice, 4 months old (Experiment 1), and five female neuropeptide Y-Cre mice (Jax strain #027851, The Jackson Laboratory, Bar Harbor, ME, USA, maintained on a C57BL/6 background), 7 months old (Experiment 2). The animals were housed at 22 °C to 24 °C with a 12-hour light/12-hour dark cycle, and provided with standard mouse chow and water ad libitum, unless otherwise noted. All experimental procedures were performed in accordance with the UK Animals (Scientific Procedures) Act 1986 and the University of Aberdeen Ethical Review Committee (ERC21-22:06) approval.
For Experiment 1, the mice were provided with a bottle of 5% sucrose solution (made in drinking water) in place of their regular water at random intervals for a short time (1–2 h) each day for a week to avoid neophobia. The mice were also acclimated to the testing chamber three times so they knew where the sucrose solution was. Licking behaviour was recorded for 20 minutes at each of 2 test days per animal: on day one a 5% (0.15 M) sucrose solution was used, whereas on day two a 20% (0.58 M) sucrose solution was used. Mice had a 5-day break between the two testing days. One of our trials failed and thus the results reported below from these experiments are based on a total of n = 9 recordings.
For Experiment 2, mice had one bottle of water and one of 2% sucrose (0.06 M) placed in their home cage the day before the experiment. On the morning of the experiment the animals were moved into individual cages with 2 drinking bottles, one containing water and the other one 2% sucrose, and licking behaviour was recorded for 3 hours.
For Experiment 1 we used a single drinking bottle (Fig. 2B), and programmed the Raspberry Pi Pico microcontroller to sample the touch sensor and send the information to a GPIO pin once every 20 ms (i.e., 50 Hz sampling frequency). In rodents, contact duration between the tongue and drinking spout is about 70 ms, and interlick intervals are greater than about 100 ms [3]. Thus, this is a reasonable sampling speed to ensure that no lick events are lost. If, however, a different sampling rate was required, this can easily be adjusted, and the GitHub repository associated with this manuscript contains examples that illustrate how to do that.
A data acquisition system connected to the microcontroller (Fig. 2C) with a BNC cable was used for digitising (372 Hz) and storing the lick data for offline analysis (Fig. 3). We used this method involving digital input/output pins because we were interested in testing the sensor in a configuration that allows for real-time loop-control of additional hardware. For example, a LED for optogenetics could be driven directly by this digital output from the lick sensor.
The purpose of Experiment 2 was to test the lick sensor in a configuration where several drink bottles from different animal cages are monitored simultaneously. We connected 10 drink bottles (5 animals individually housed, 2 bottles per cage) to an equal number of electrodes on the touch sensor. The microcontroller was programmed to poll all electrodes simultaneously every 20 ms. As soon as any lick events were detected the microcontroller sent their timestamps to a Raspberry Pi 4 computer connected with a universal serial bus (USB) cable. In this configuration there is no need for a data acquisition system because the lick event timestamps are saved directly to a text file in the host computer.
Raw lick data from Experiment 1 consisted of a trace (vector) of 0 s and 1 s, with 1s representing licking episodes (Fig. 3A). Lick events (time at the onset of each lick) were obtained by calculating the successive differences of this raw data vector (Fig. 3B) and taking the timestamp where these differences equalled 1 (Fig. 3C). Data from Experiment 2 did not require post-processing because they were acquired directly as lick events.
From lick events, two fundamental parameters can be calculated to study the microstructure of licking [4]: interlick intervals, which are the time intervals between successive lick events, and clusters, defined as groups of lick events separated by more than 500 ms. Cluster size refers to the number of lick events in each cluster. The data were analysed and plotted with R version (4.5.1, R Foundation for Statistical Computing, Vienna, Austria) [17].
We recorded licks in mice with access to one of two sucrose solutions (5% sucrose or 20% sucrose) on separate sessions for a total of n = 9, 20-minute long recordings. A second group of mice had access to both water and 2% sucrose drinks on the same session, and in these mice licks were recorded for 3 hours for a total of n = 5 recordings. Lick events were used for calculating interlick intervals and lick clusters (Fig. 3).
Licking in rodents is rhythmic and occurs at a regular rate of about 8 to 10 Hz, depending on the strain [18, 19, 20]. As a first step towards validating our lick sensor we quantified lick frequency. Mean lick frequency ranged from 8.6 to 9.9 Hz across all 9 sessions in Experiment 1, and from 7.1 to 9.7 Hz across the 5 sessions in Experiment 2. The observed distributions of interlick intervals (Figs. 4A,5A) were as described previously [5, 20].
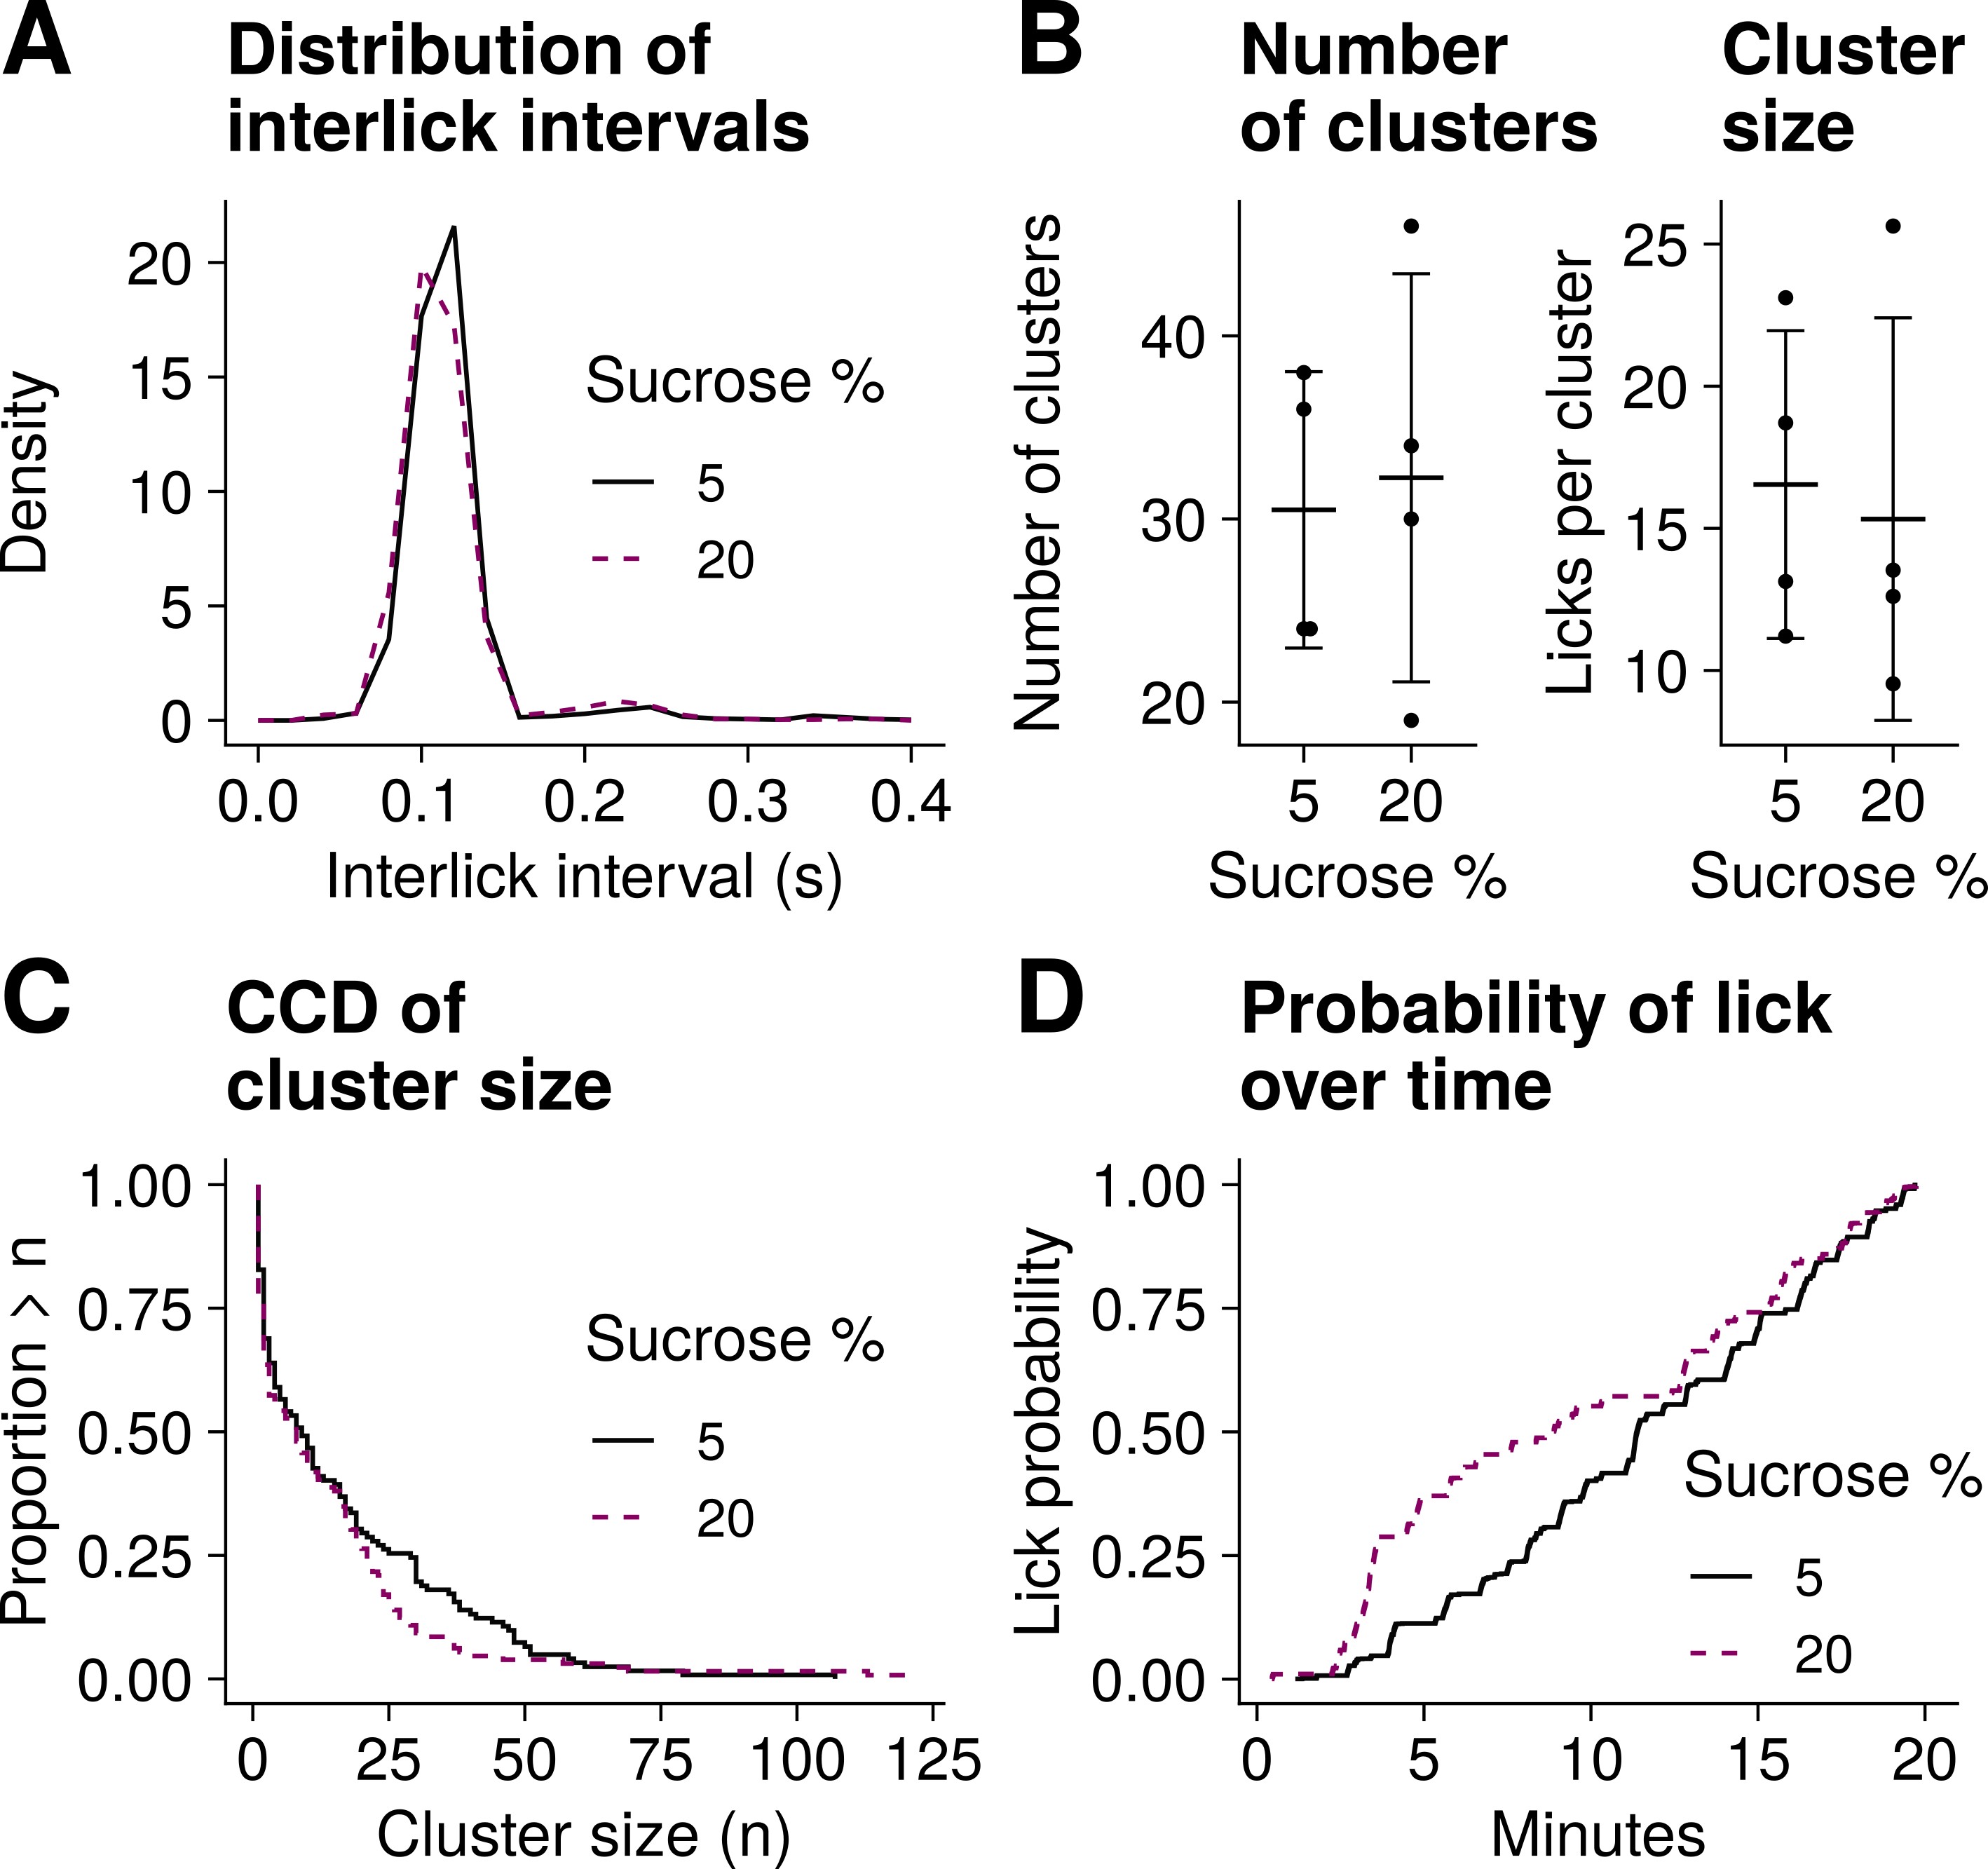 Fig. 4.
Lick microstructure analysis for Experiment 1. Data from five male mice with access to a 5% sucrose or 20% sucrose drink (one drink per recording, n = 9 recordings). (A) Distribution of interlick intervals. (B) Mean of number of clusters and mean of cluster size. The whiskers represent SD. (C) Complementary cumulative distribution (CCD) of cluster size. (D) Cumulative probability of lick over time. The animals were more likely to lick for sucrose 20% than sucrose 5% during the first half but not the second half of the session.
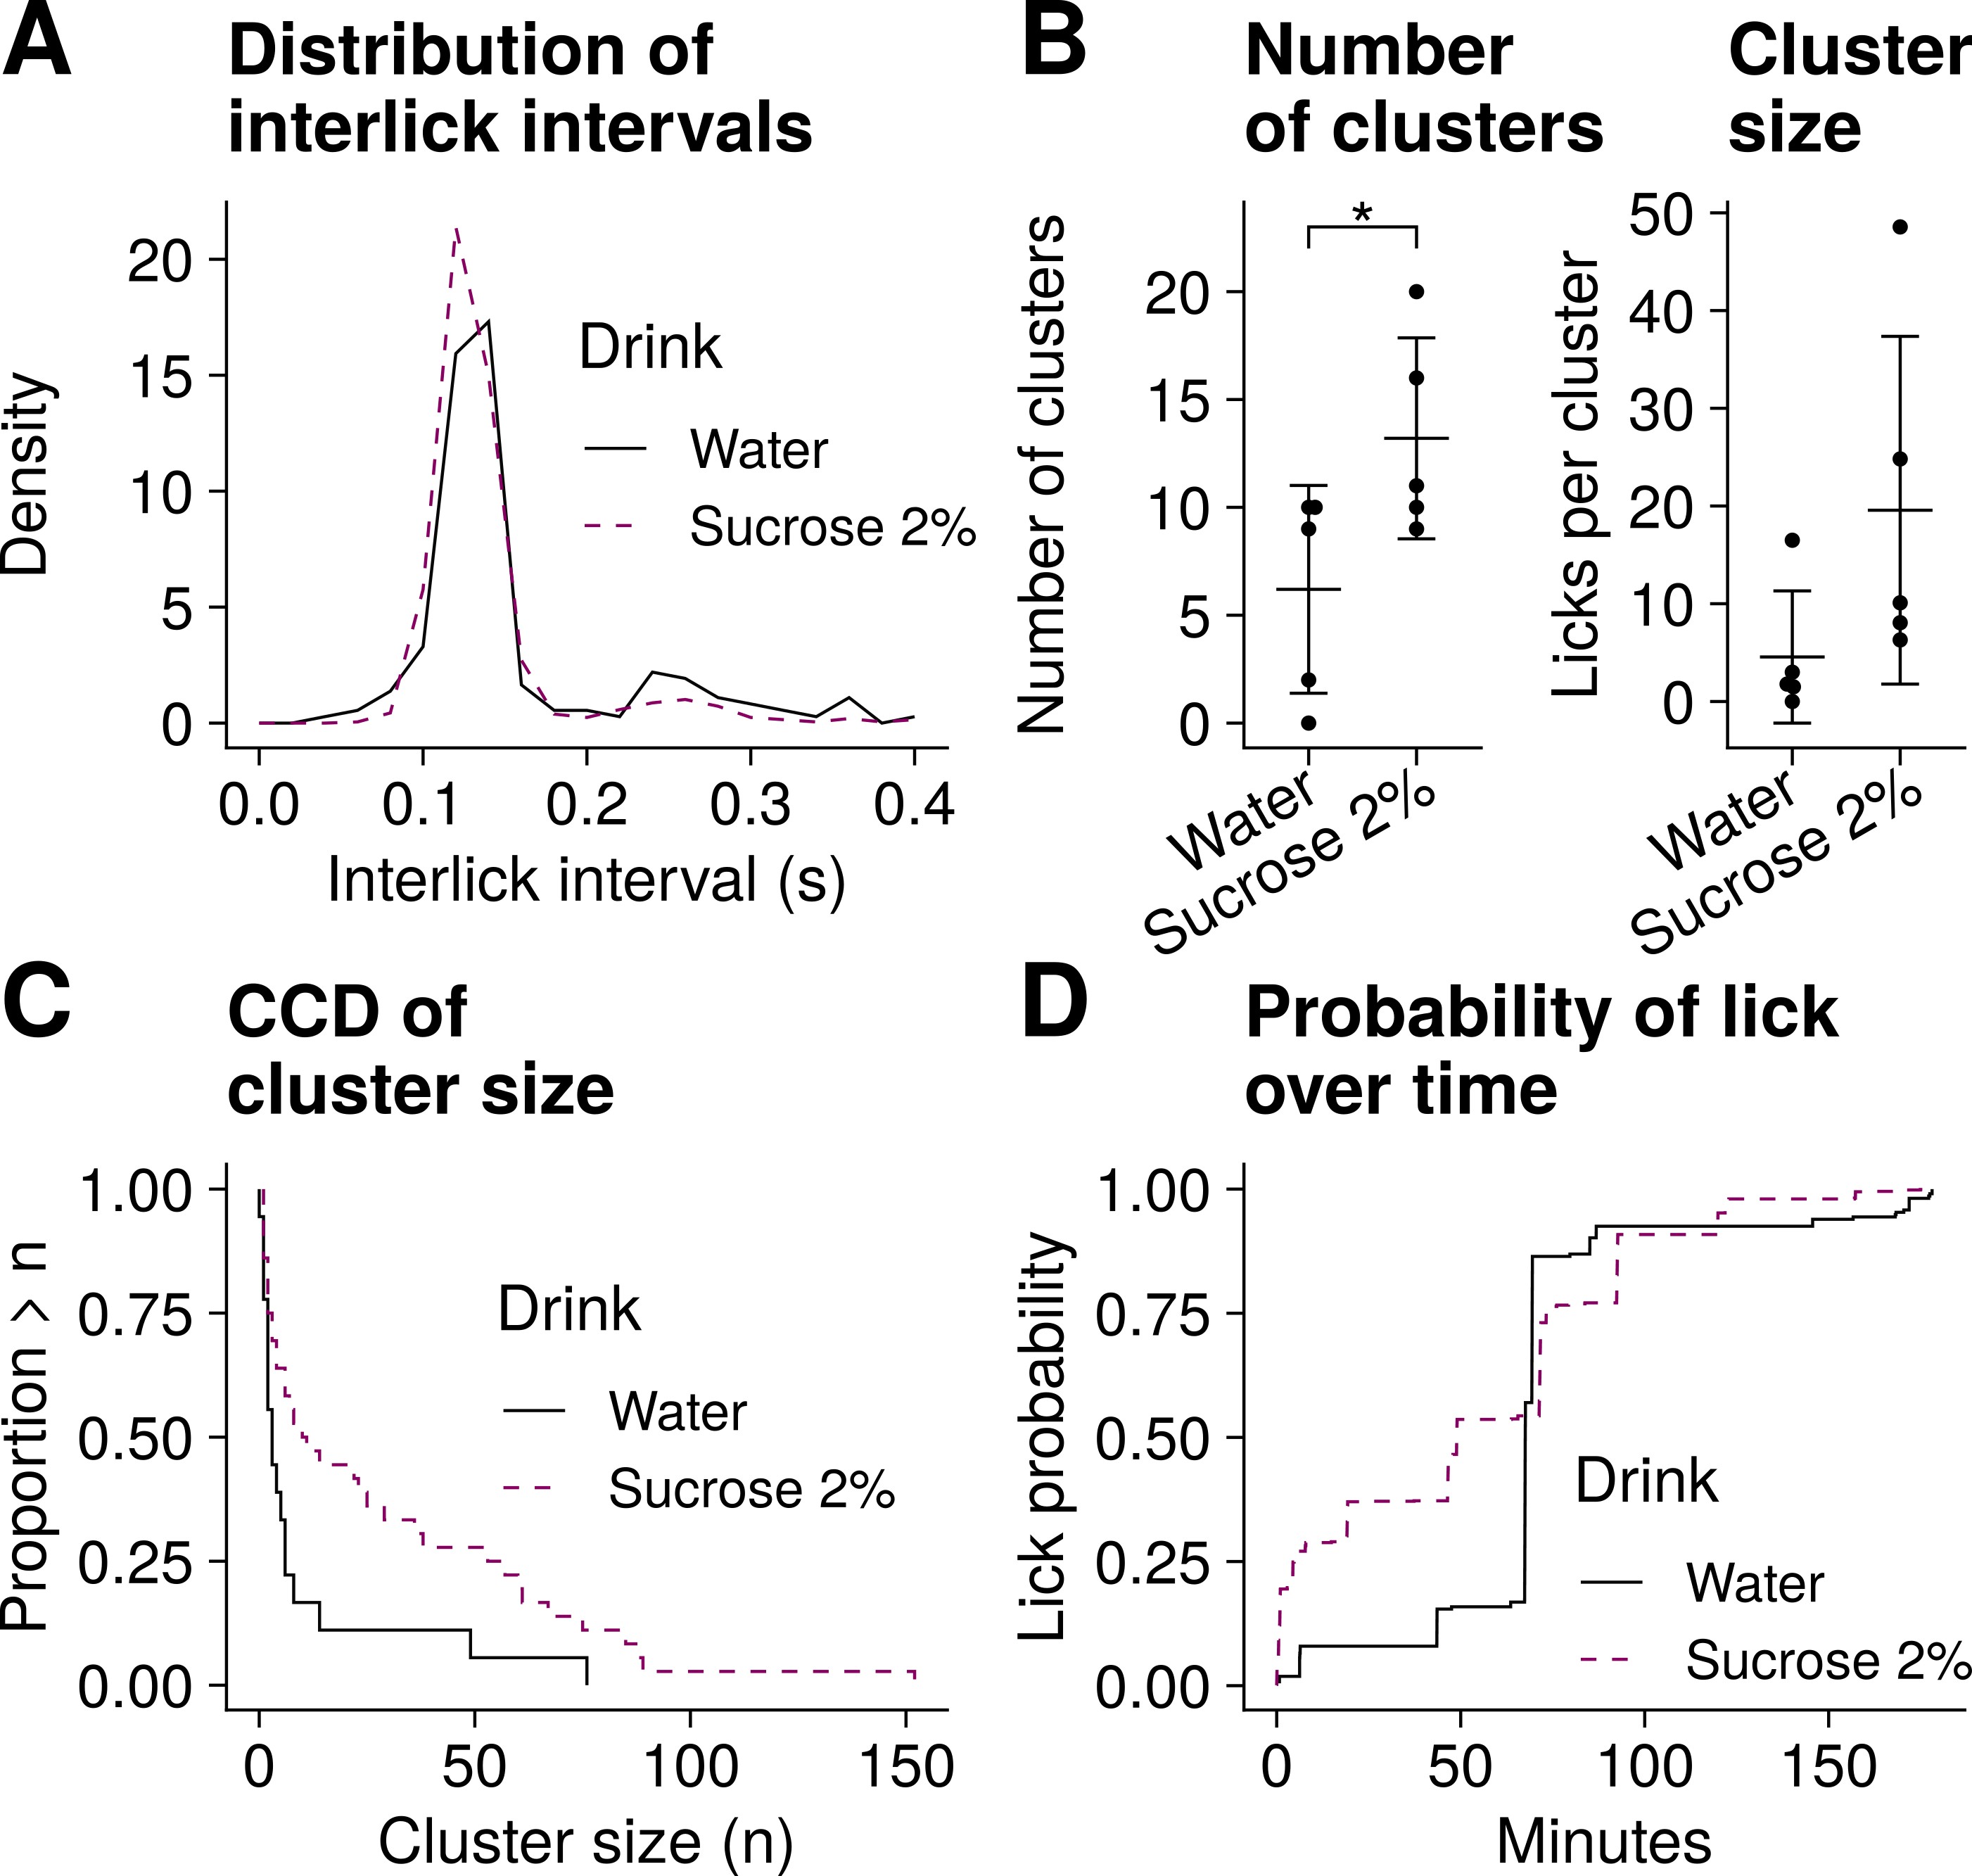 Fig. 5.
Lick microstructure analysis for Experiment 2. Data from five female mice with access to both water and 2% sucrose (two drinks per trial, n = 5 trials). (A) Distribution of interlick intervals. (B) Mean of number of clusters and mean of cluster size. The whiskers represent SD. *p = 0.03, paired t test. (C) Complementary cumulative distribution (CCD) of cluster size. (D) Cumulative probability of lick over time. The animals were more likely to lick for sucrose than water during the first hour of the session.
We then calculated the mean primary interlick interval, defined by St John et al. [19] as “the average interlick interval of interlick intervals shorter than 160 ms”. When the two sucrose conditions tested in Experiment 1 were compared, mean (standard deviation, SD) primary interlick interval was 110 (5) milliseconds for 5% sucrose (n = 5 recordings), and 107 (6) milliseconds for 20% sucrose (n = 4). For Experiment 2, the mean (SD) primary interlick interval was 121 (16) milliseconds for water (n = 5), and 124 (6) milliseconds for 2% sucrose (n = 5). These values were very similar to those reported before for B6 mice [19].
There were no significant differences in mean primary interlick intervals between the two sucrose conditions in Experiment 1 (5% sucrose vs. 20% sucrose, Wilcoxon signed rank exact test on paired samples, V = 10, p = 0.125), or between the two drinks in Experiment 2 (water vs. 2% sucrose, Wilcoxon signed rank exact test on paired samples, V = 4, p = 0.875). This is in line with previous reports showing that lick frequency tends to remain relatively constant across different experimental conditions (e.g., drink palatability or water deprivation) [19, 20].
We defined clusters as groups of lick events separated by more than 500 ms [4]. Important insight into intake behaviour can be gained from measuring how many clusters are in each experimental session (number of clusters), and how many licks are in each cluster (cluster size).
The mean (SD) number of clusters recorded in Experiment 1 was 30.5 (7.5) for 5% sucrose and 32.2 (11.1) for 20% sucrose (Fig. 4B). There was no indication that the number of clusters in these animals was different with each of the solutions tested (t(3) = 0.47, p = 0.67, paired t test). By contrast, the number of clusters observed in Experiment 2 was greater for 2% sucrose (mean = 13.2, SD = 4.7) than water (mean = 6.2, SD = 4.8); t(4) = 3.3, p = 0.03, paired t test (Fig. 5B). The number of clusters reflects post-ingestive feedback [6]. The different recording times across experiments may help explain why post-ingestive feedback effects were evident in Experiment 2 but not in Experiment 1.
In Experiment 1, the size of clusters recorded with 5% sucrose drink (mean = 16.5, SD = 5.4 licks per cluster) was similar to that recorded with 20% sucrose drink (mean = 15.3, SD = 7.1 licks per cluster); t(3) = 0.34, p = 0.76, paired t test (Fig. 4B). These observations match those reported before, where cluster size did not change significantly with 5 or 20% sucrose solutions in C57 mice [18]. It should be noted that each sucrose solution in Experiment 1 was tested on separate sessions, and the lowest concentration was always tested first. This could have introduced potential confounds.
In Experiment 2 we observed a tendency for a greater number of licks per cluster with 2% sucrose (mean = 19.6, SD = 17.8 licks per cluster) compared to water (mean = 4.6, SD = 6.8 licks per cluster); t(4) = 2.68, p = 0.06, paired t test (Fig. 5B). The shift to the right in the 2% sucrose curve illustrated in Fig. 5C supports these observations. Cluster size is a measure of palatability [4, 6]. Thus the differences in cluster size suggest that, unsurprisingly, animals in this group found the sweet drink more palatable that plain water.
Finally, we quantified the probability over time of licking for any of the solutions tested. We observed that mice in Experiment 1 were more likely to lick for the sweeter solution only during the first 10 minutes or so of the trial (Fig. 4D). It has been reported that the initial number of licks can be greater with a sweeter, more palatable solution [6], but transient changes in licking of this kind do not necessarily translate into overall differences in number of licks [18]. Our observations are consistent with these previous findings.
The animals in Experiment 2 were more likely to lick for 2% sucrose solution than water during the first hour of the session. In fact these mice did not lick much for either drink after this initial hour (Fig. 5D).
Lick microstructure is an important measure of intake behaviour, and it is particularly useful for studying food preference and motivation [1, 4]. To analyse lick microstructure it is necessary to record the precise timing of licks. This can be achieved with lick sensors (lickometers) [3]. Here, we described and validated a lick sensor for rodents that can be built in the lab easily with few off-the-shelf components.
The interest in measuring lick patterns has led several researchers to propose different lick sensor implementations. Early designs involved complex electronic circuits [1, 10, 11, 12, 21] that detect licks based on the completion of an electrical circuit (Fig. 1A). For this to happen the animals must stand on a conductive platform connected to the main circuit, thus requiring specific adjustments to the experimental cages. In addition, some lick-sensing systems also demand custom drink bottles. Moreover, lick sensors that rely on the completion of electrical circuits often capture data in the form of analog signals that need additional post-processing steps to isolate lick events [9]. This approach is not suitable for lick detection in real time.
By contrast, the sensor described here can be used with standard drinking bottles and does not require specific modifications to the cages. As a result, animal behaviour can be studied in the home environment, and since no novel bottles are introduced into this environment, no training of the animals is necessary before the experiments can commence. It is possible with our lickometer to detect lick events in real time (Fig. 1C,D) which can be useful for controlling additional laboratory hardware if required. In parallel, these lick events can be stored to a computer for analysis of lick microstructure, and this makes our design flexible.
The sensor described here works by detecting the changes in capacitance that occur when the tongue of the animal touches the drinking bottle (Fig. 1C). While capacitance-based lick sensors have been described before [22, 23], those early designs consist of elaborate electronic circuits that can be difficult to construct and operate. More recently, simpler capacitive lick sensors built with only a microcontroller and a few resistors have been described [24]. In contrast to those lick sensors, ours utilises off-the-shelf touch-sensing integrated circuits to detect changes in capacitance (Fig. 2), which offer important advantages. Touch-sensing integrated circuits are easy to use and configure, and include filters to make touch detection more reliable. They also calibrate automatically, which means that they can compensate for drifts in capacitance that can occur over time, and can be used in different environments or conditions with little need to make manual adjustments when these conditions change. Finally, a single touch-sensing integrated circuit can be used for detecting licks from many connected drink bottles at the same time.
Touch-sensing integrated circuits have become widely available in recent years because they form the basis for human interfaces to many consumer products such as touch screens. Touch sensing technology has become reliable, inexpensive, and simple to use, making it easy to adapt these integrated circuits for touch-detection tasks in the research laboratory. In fact, in a recent paper, Petersen et al. [25] describe a capacitance-based lick-sensing setup that follows very similar principles to those we present here. This corroborates that lickometers designed with off- the-shelf capacitance sensors are a reliable and simple alternative to commercially-available lick sensors. One important difference, however, between the system by Petersen et al. [25] and the one described here is that theirs requires custom 3D-printed drink bottles and bottle holders, which complicates the implementation and limits their setup to placing 2 bottles per cage. Moreover, their system is not designed to provide real-time lick signals for loop-control of external equipment (although it should be possible to adapt their system for that purpose).
Capacitive sensors like the one used here detect touch by measuring the charge-discharge time of a capacitor, then digitally filtering the data (see the MPR121 data sheets, available at https://www.nxp.com/products/MPR121, for details). This necessarily introduces a small time delay between the touch event and its detection. With the default settings, the typical response time of the MPR121 is 16 ms. This delay is likely short enough to be of little relevance for the purposes of lick detection. It is possible, however, to modify the MPR121 settings to decrease this value if necessary.
To validate our lick sensor we carried out two independent sets of experiments in mice. Our analysis of lick microstructure from data recorded during these experiments (Figs. 4,5) matches what is already known about licking behaviour in mice tested under similar conditions. Thus, lick frequency and its counterpart interlick intervals were within the range previously reported and, as others have found [18, 19, 20], did not change significantly with the different drinks tested. This demonstrates that our lick sensor is capable of performing at least as well as commercially-available sensors used by others.
Our analysis of lick clusters also mirrored previous findings under similar experimental conditions [18, 20]. It is interesting to note that previous reports of cluster size in mice vary widely. For example, lick clusters in C57 mice drinking water have been found to consist of as little as 4 licks per cluster [18] or as many as 40 or more licks per cluster [19, 20]. This suggests that cluster size should not be used to compare lick microstructure across different studies. Instead, cluster size is likely a measure only useful for comparing different conditions within the same study. This is evident here, where cluster size in Experiment 1 (Fig. 4B) cannot be compared directly to that from Experiment 2 (Fig. 5B) likely because of the different experimental designs. Finally, differences in cluster size observed across and within our two experiments may also be a reflection of the different training schemas implemented. Our animals in the two experiments experienced sucrose drinks for dissimilar periods of time before the experiments commenced. This may be relevant because it has been reported that the degree of previous exposure to sucrose drinks can affect the number of clusters measured during experiments [26], perhaps mediated by learning processes.
We described an open-source lick sensor for behavioural experiments in rodents that is inexpensive, reliable, and easy to build. It is flexible, because it can be used with any standard drinking bottles (up to 12 bottles per sensor; a second sensor can be added for 24 bottles), and does not require specific modifications to the animal cage or experimental arena. This latter characteristic means that licking behaviour can be monitored in more naturalistic (e.g., home cage) environments. Finally, lick events detected with this sensor can be stored for future analysis or, importantly, they can be used for real-time loop-control of additional laboratory instruments. The sensor described here therefore lowers the barrier to implementing a wider range of experiments involving lick behaviour, which should be of great benefit for neuroscience and metabolism research.
Diagrams, code, and detailed instructions for building and operating the lick sensor can be found at https://github.com/antgon/lick-sensor-for-rodents. A C library for using the Raspberry Pi Pico microcontroller with the MPR121 touch sensor is available at https://github.com/antgon/pico-mpr121. Data from behavioural experiments is available on request.
JAG conceived the project, designed and built the lick sensor, carried out animal experiments, analysed data, and wrote the manuscript. YM contributed to designing and performing animal experiments. Both authors contributed to editorial changes in the manuscript, and read and approved the final version of the manuscript. Both authors have participated sufficiently in the work and agreed to be accountable for all aspects of the work.
All experimental procedures were performed in accordance with the UK Animals (Scientific Procedures) Act 1986 and the University of Aberdeen Ethical Review Committee (ERC21-22:06) approval, and complied with the ARRIVE 2.0 guidelines.
The authors would like to thank Jenna Hunter and Giuseppe D’Agostino (University of Manchester) for their assistance with animal experiments.
Research funded by the Biotechnology and Biological Sciences Research Council (BBSRC), UK (grant BB/V010557/1 to J.A.G.).
The authors declare no conflict of interest.
References
Publisher’s Note: IMR Press stays neutral with regard to jurisdictional claims in published maps and institutional affiliations.