

 , Tanya Deneva 3, Maria-Florance Kitova 4, Lyudmila Kitova 1,2,5, Kristina Stoyanova 5,*
 , Iliana Petrova 6, Drozdstoy Stoyanov 5,7
1 Section of Cardiology, First Department of Internal Diseases, Medical University of Plovdiv, 4002 Plovdiv, Bulgaria
2 Clinic of Cardiology, “St. George University Hospital”, 4002 Plovdiv, Bulgaria
3 Department of Clinical Laboratory, Faculty of Medicine, Medical University of Plovdiv, 4002 Plovdiv, Bulgaria
4 Faculty of Medicine, Medical University of Plovdiv, 4002 Plovdiv, Bulgaria
5 Research Institute at Medical University of Plovdiv, Medical University of Plovdiv and Strategic Program for Innovations and Research Development of the Medical University-Plovdiv, Translational and Computational Neuroscience Group 3.2.4, 4002 Plovdiv, Bulgaria
6 National Heart Hospital, 1309 Sofia, Bulgaria
7 Department of Psychiatry and Medical Psychology, Faculty of Medicine, Medical University Plovdiv, 4002 Plovdiv, Bulgaria
Abstract
Obesity and depression have a bidirectional relationship. Previous work has shown that obesity increases the risk of depression, while atypical depression can elevate the risk of obesity. This study aimed to investigate the associations between anthropometric markers, lipid and insulin resistance biomarkers, inflammatory cytokines, and adipokines with depressive symptom severity in individuals with newly diagnosed metabolic syndrome (MetS).
88 treatment-naïve adults with newly identified MetS, without known coronary artery disease, were included. Clinical assessments comprised anthropometric measures, while laboratory analyses measured lipid metabolism markers, insulin resistance indicators, inflammatory cytokines, and adipokines. Depressive symptom severity was assessed using the von Zerssen Depression Scale (DS), validated for the Bulgarian population. To explore latent structures within biomarker domains, principal component analyses (PCA) were performed. Associations between depressive symptoms and biomarkers were then examined in two steps: first, using linear regression with PCA-derived component scores, and second, through hierarchical multiple regression focusing on selected individual biomarkers, controlling for covariates such as age and gender.
PCA identified distinct latent structures within anthropometric, lipid, insulin resistance, and cytokine domains, though regression analyses using PCA-derived component scores did not yield significant associations with depressive symptoms (all p > 0.050). Hierarchical multiple regression with selected biomarkers showed that lower low-density lipoprotein cholesterol (LDLc)/Apolipoprotein B (ApoB) ratios were consistently associated with higher depressive symptom severity (Model 1: β = –0.332, p = 0.011; Model 2: β = –0.326, p = 0.012; Model 3: β = –0.319, p = 0.013), while higher interleukin-6 (IL-6) levels were independently linked to greater symptom severity (Model 1: β = 0.217, p = 0.052; Model 3: β = 0.230, p = 0.033). ApoB/apolipoprotein A1 (ApoA1) ratios and age showed weaker or non-significant effects.
LDLc/ApoB ratio and IL-6 levels are independently associated with depressive symptom severity in newly diagnosed MetS, highlighting their potential as clinically relevant biomarkers. These findings highlight perspectives for integrating lipid and inflammatory profiles in the assessment of depression risk within MetS populations.
Keywords
- metabolic syndrome (MetS)
- depression
- LDLc/ApoB ratio
- interleukin-6 (IL-6)
- lipid biomarkers
- hierarchical multiple linear regression
Metabolic syndrome (MetS) is one of the socially significant diseases, the frequency of which increases with every year with the latest data showing that every sixth person in Europe has MetS [1]. The syndrome incorporate a number of cardio-vascular risk factors such as visceral obesity, hyperglycemia, hypertension and hypertriglyceridemia. The global burden of obesity and the associated health implications have increased 2.5 fold in the last 30 years [2]. Furthermore, the global prevalence of depression is increasing hastily and has been foreseen to be the second cause of death worldwide by 2030 [3, 4]. A sedentary lifestyle and an unhealthy diet are the most important factors that lead to the development of MetS in patients with depression, in comparison to those without depression [5].
The common pathophysiological mechanism that play a role in MetS and depression are numerous. It is common for depressed patients to have reduced physical activity which can lead to a calory excess and obesity, with the latter inducing metabolic changes that are the basis for developing MetS. Finally, these changes give opportunity for the development of diabetes and cardio-vascular disease [6, 7]. For a long time data, pertaining to the link between depression and MetS, was controversial [8, 9, 10, 11, 12, 13]. In 2021, Moradi et al. [14] with their systematic overview and meta analysis showed convincing results that there is a link between depression and MetS. Individuals with MetS have a higher tendency to exhibit symptoms of depression, than those without MetS [14]. A meta analysis depicted the prevalence of MetS in patients with depression [15].
Significant associations exist among major depressive disorder (MDD), metabolic syndrome (MetS), and cardiovascular disorders (CVD) [16, 17, 18, 19, 20]. This could be linked to the disturbances in the lipid profile, proinflammatory markers and insulin resistance. The latter increase the risk of type 2 diabetes, arterial hypertension, cardio-vascular disease and diabetes (obesity-related late-life diabetes) [21]. The comorbidity of MetS with mood disorders associates with a more intricate affective presentation, diminished recovery prospects, and an elevated incidence of episodes and suicide attempts [22, 23, 24, 25].
Data from literature shows that MetS and depression are associated with a high atherogenicity with the latter being linked to a high Castelli risk index 1 (ratio of total cholesterol (TC) to high density lipoprotein cholesterol (HDLc), or an elevated atherogenic index of plasma (AIP), which assesses the ratio of triglycerides (TG) to HDLc [16, 17, 18, 26, 27, 28]. Data shows that the role of HDLc in depression increases in significance at lower plasma levels which also affects the atherogenic indices [17, 18, 29]. Apolipoprotein A1 (ApoA1) is a crucial protein that facilitates the protective and antioxidant functions of HDL [30, 31, 32].
There is a positive correlation between depression and proatherogenic lipids and lipoproteins. This includes low density lipoprotein cholesterol (LDLc), TG, and ApoB [16, 17, 18, 27, 28, 33]. ApoB is the most precise marker for evaluating atherogenic dyslipidemia, which is present in MetS [34, 35, 36]. Apolipoprotein A1 (ApoA1) is a crucial protein that facilitates the protective and antioxidant functions of HDL [30, 31, 32]. An increase ApoB/ApoA ratio has a more accurate evaluation of atherogenicity than LDLc, non-HDLc, and lipid ratios [37]. In a state of dysfunction the adipocyte of the visceral adipose tissue have a adiponectin/leptin ratio of less than 1. In a hypertrophied state adipose tissue can secrete proinflammatory markers which can target the brain, heart, kidneys and vessels [38].
The above mentioned metabolic abnormalities induce a systemic proinflammatory milieu that can not only lead to the well known cardio-vascular complications but has also been described to predispose to the development of various psychological disorders. There is data that suggest that inflammation is another critical determinant of depressive symptoms in individuals with MetS [39].
In their study Meng et al. [40] discovered that chronic
inflammation may play a critical role in linking MetS to depression, underscoring
the importance of integrated management strategies targeting both metabolic and
mental health. Inflammatory markers mediated 26.79% of the MetS-depression
relationship, with C-reactive protein (CRP) contributing the largest proportion
(17.24%) [40]. In a meta analysis, done by Haapakoski et al. [41], a
strong correlation was found between IL-6, CRP and major depression, while the
role of TNF-
Maes et al. [42] describe that the presence of MetS in outpatient MDD considerably activates immune profiles with neurotoxic potential. The interplay in MDD-MetS changes cytokine levels thus worsening symptoms. MetS exacerbates the immunoneurotoxicity in MDD, which demonstrates the central role of the metabolic factors [42]. This data confirms the published 30 years ago overview and hypothesis by the author that major depression may be accompanied by systemic immune activation or an inflammatory response with involvement of phagocytic (monocytes, neutrophils) cells, T cell activation, B cell proliferation, an “acute” phase response with increased plasma levels of positive and decreased levels of negative acute phase proteins, higher autoantibody (antinuclear, antiphospholipid) titers, increased prostaglandin secretion, disorders in exopeptidase enzymes, such as dipeptidyl peptidase IV, and increased production of interleukin (IL)-1 beta and IL-6 by peripheral blood mononuclear cells. It is hypothesized that increased monocytic production of interleukins (IL-1 beta and IL-6) in severe depression may constitute key phenomena underlying the various aspects of the immune and “acute” phase response [43].
In summary, the link between obesity and depression is a bidirectional one. Al-Khatib et al. [44] thoroughly present that obesity was shown to increase the risk of depression, while atypical depression increased the risk of obesity. Based on the established link between MetS and depression, our aim is to examine the associations between depressive symptoms and a broad range of metabolic, inflammatory, and standard cardiovascular risk markers in individuals with newly diagnosed MetS. To address this knowledge gap, we evaluate the link between anthropometric markers, lipid markers, and markers of insulin resistance, cytokines, inflammatory markers and adipokines in patients with newly diagnosed metabolic syndrome and different grading of depression.
Our leading hypothesis is that depressive symptoms are associated with pro-inflammatory and lipid metabolism biomarkers in patients with MetS.
The study was conducted in Bulgaria, a country with the shortest life expectancy in the European Union [45], using data from outpatients at the Clinic of Cardiology, St. George University Hospital, Plovdiv. Patients meeting the International Diabetes Federation (IDF) criteria for metabolic syndrome (MetS) were recruited between September 2023 and September 2024 as part of a project funded by the Medical University of Plovdiv (DPDP-09/2023) [46]. Eligible participants were treatment-naïve adults with newly diagnosed MetS and without coronary artery disease (e.g., myocardial infarction, stroke, occlusions). To reduce confounding, individuals with chronic renal, hepatic, respiratory, cardiac, or thyroid disease, cancer, pregnancy, electrolyte imbalance, recent infections, or taking medications affecting electrocardiographic repolarization were excluded. Of the 546 obese individuals screened, 304 did not have MetS, while 242 met the criteria for MetS. 88 participants completed comprehensive clinical, anthropometric, and laboratory assessments and self-reported depressive symptoms using the Detlev von Zerssen Depression Scale. The patient selection algorithm is presented in Fig. 1.
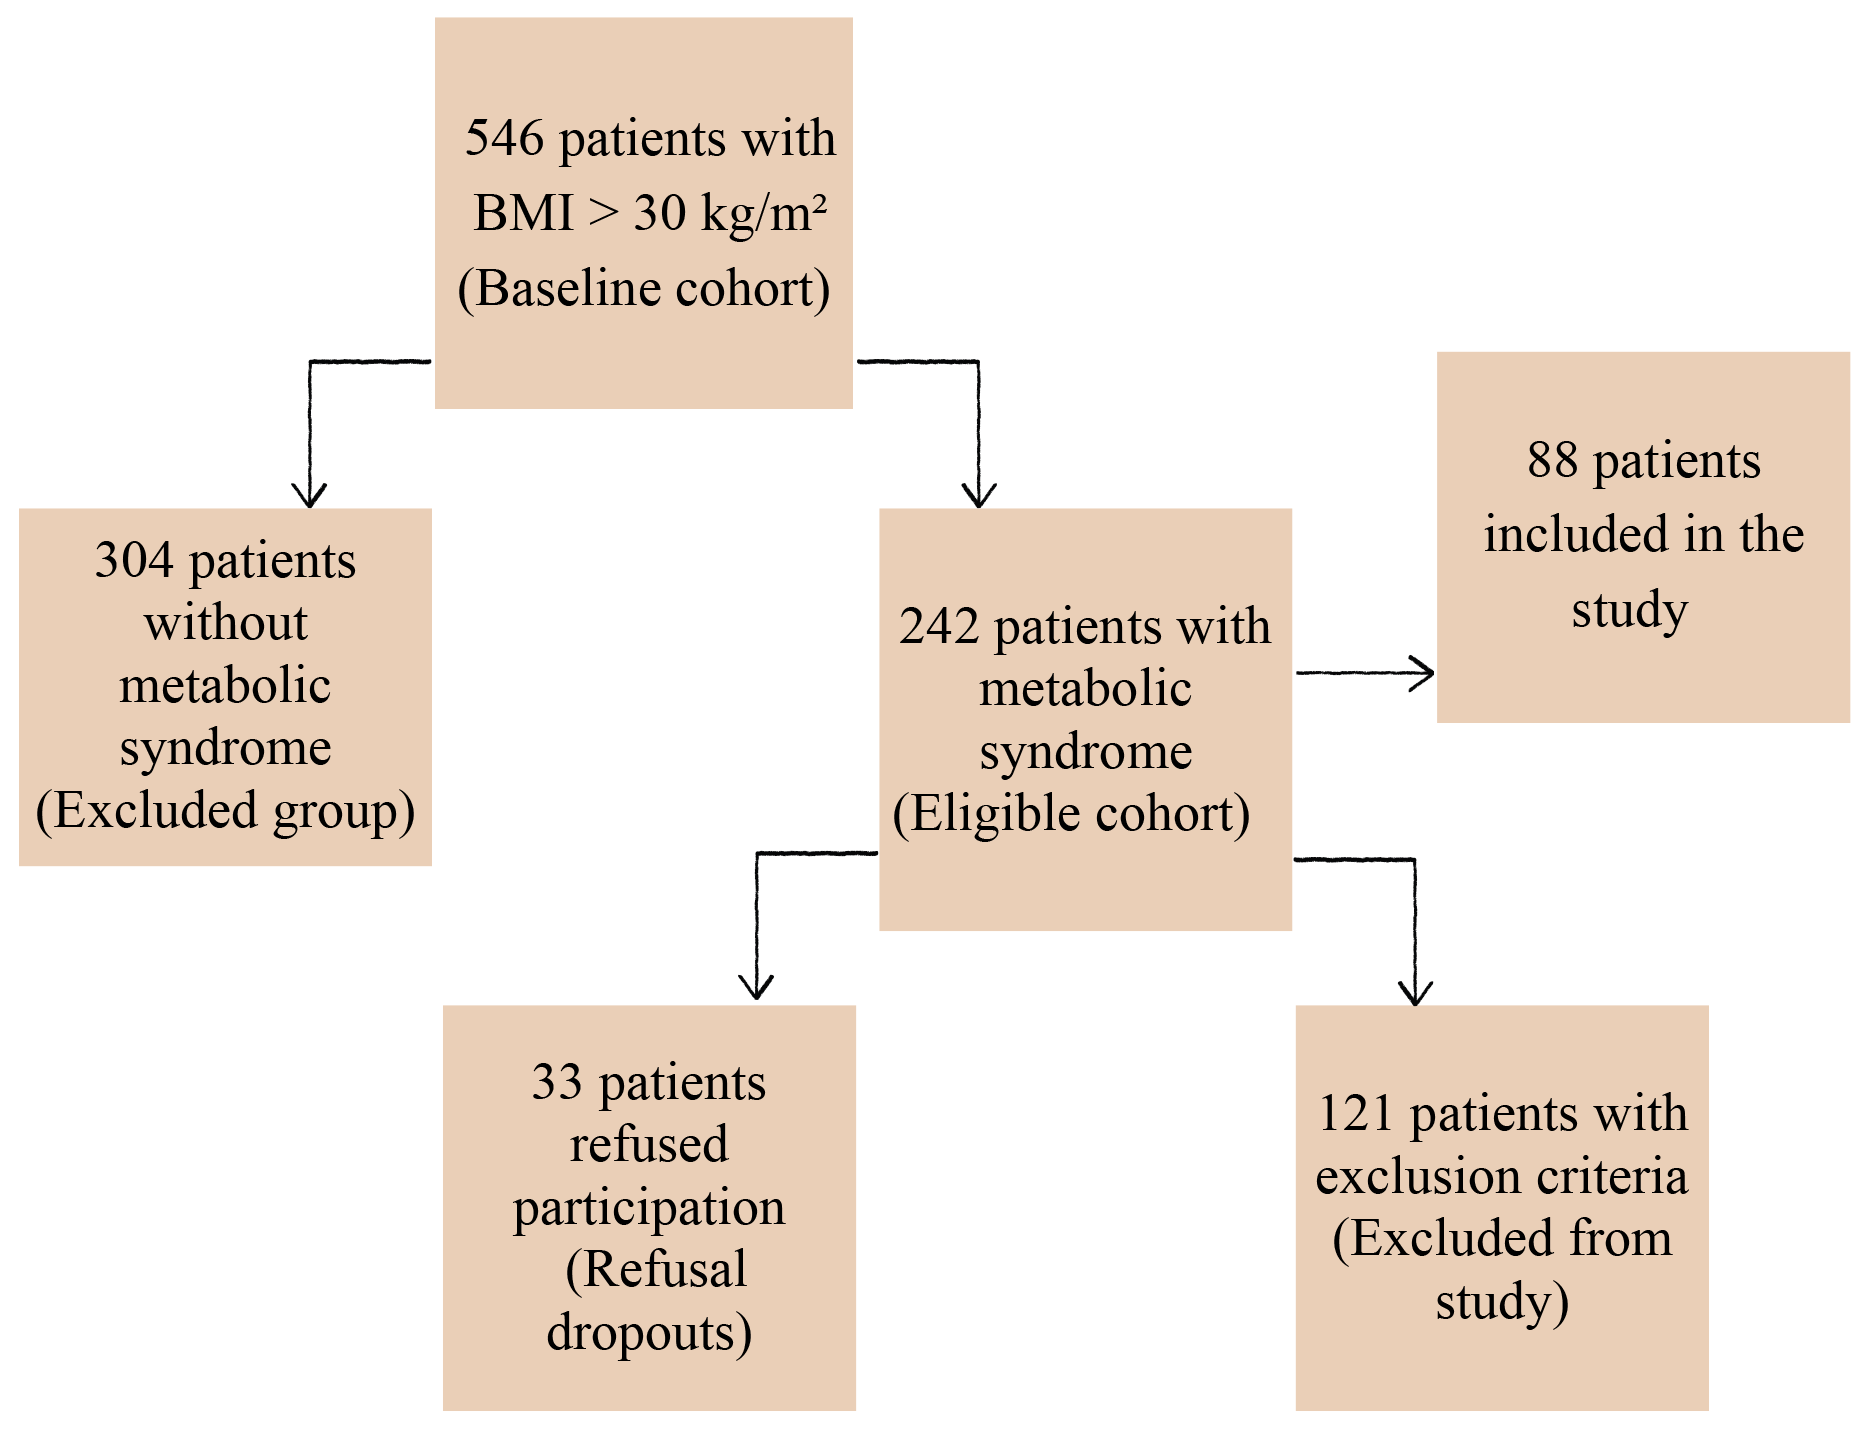 Fig. 1.
Patient selection algorithm. BMI, body mass index.
The diagnosis of MetS was based on the criteria by the International Diabetic
Federation [46]. Presence of obesity defined as waist circumference in men above
94 cm and in women above 80 cm or body mass index (BMI) above 30 with at least
two more criteria: triglycerides
Anthropometric measures included body mass index (BMI), waist-to-hip ratio (WHR), total body fat (BF%), and visceral fat (VF%), assessed at the Department of Physiology, Medical University of Plovdiv. BMI was calculated from barefoot weight and height in light clothing (kg/m2). WHR was derived from waist circumference measured midway between the last palpable rib and iliac crest, and hip circumference [48]. BF% and VF% were estimated via multifrequency bioelectrical impedance analysis using an InBody270 analyser (InBody 270., Ltd., Seoul, Republic of Korea), which provides estimates comparable with dual-energy X-ray absorptiometry [49].
Laboratory assessments at the Central Clinic Laboratory of St. George University Hospital included:
Blood counts (hemoglobin, erythrocytes, leukocytes, platelets), insulin resistance markers (blood sugar, immunoreactive insulin, HOMA index, glycated hemoglobin, total cholesterol, triglycerides (TG), HDLc, LDLc, non-HDLc, apolipoprotein-A1, apolipoprotein-B), thyroid hormones (TSH, FT3, FT4), which served to fulfil the exclusion criteria and determine the severity of METS, were examined. The studies were conducted in the Central Institute Clinical Laboratory of the St. George University Hospital - Plovdiv. Accordingly, hematological analyses (leukocytes, erythrocytes, platelets; determination of hemoglobin concentration, haematocrit) were performed on an automatic hematological analyser Advia 2120 (Siemens Healthineers, Erlangen, Germany). Serum biochemical parameters were examined on a clinical chemistry analyser AU 480 (Beckman Coulter, Brea, CA, USA) using original prograMetS with conventional analytical principles of the methods used. Hormonal studies: principle of the analyses: competitive immunochemical analysis of the chemiluminescent principle (CLIA) on an immunological analyser Access 2, Beckman Coulter, HDLc, LDLc, apolipoprotein B/apolipoprotein A1 ratio (ApoB/ApoA1), LDLc/HDLc ratio, LDLc/apolipoprotein B ratio (LDLc/ApoB), triglyceride/high-density lipoprotein cholesterol ratio (TG/HDLc), and triglycerides (TG) (see Supplementary Methods).
Insulin resistance indicators: Blood glucose, immunoreactive insulin, glycated hemoglobin (HbA1c), and homeostasis model assessment of insulin resistance (HOMA-IR).
Inflammatory mediators and adipokines
The study’s primary outcomes were proinflammatory cytokines (IL-6,
TNF-
These biomarkers were selected for their relevance to metabolic syndrome and potential links to depressive symptom pathophysiology in newly diagnosed MetS.
To assess depression levels in a sample recruited based on newly diagnosed metabolic syndrome, as previously described, we preferred the von Zerssen Depression Scale (See Supplementary Methods). This scale has been adapted for Bulgarian populations and has also been validated using functional neuroimaging methods [51, 52, 53, 54].
Descriptive statistics (mean, SD, median, skewness, kurtosis) were calculated to
examine variable distributions. Spearman rank correlations were performed to
explore bivariate associations between biomarkers and depressive symptom
severity. PCA was conducted separately for anthropometric, lipid, insulin
resistance, and cytokine/adipokine domains to explore latent structures
(Supplementary Tables 1–6), though PCA-derived component scores were
not significantly associated with depressive symptoms (all p
The study involved a total of 88 individuals with newly diagnosed MetS, with a
mean age of 45.5 years (SD = 6.7). Among them, 37 were women and 51 were men.
Most inflammatory and metabolic biomarkers showed deviations from normality,
consistent with prior observations in populations with newly diagnosed metabolic
syndrome [55]. In particular, IL-6, TNF-
The mean depression score was 28 (Table 1). The majority of the participants have surpassed the clinically significant threshold for depression scores, notwithstanding formal psychiatric diagnosis of depression. It is important to note that the minimum depression score in this sample was 13 (Supplementary Table 1), which—in line with Bulgarian normative data—indicates moderate to elevated depressive symptoms. For comparison, the original average score of patients with clinical depression in German population is 18.6, and range from 11 to 26 [56].
| Variable | Total (N = 88) | ||
| Demographics | |||
| Gender, n (%) | |||
| Women | 37 (42.05) | ||
| Мen | 51 (57.95) | ||
| Age, years | 46 (39.00–51.75) | ||
| DS (Depression score) | 27.95 (5.81) | ||
| Anthropometrics | |||
| BMI, kg/m2 | 38.45 (34.40–44.45) | ||
| BF% | 38.63 (7.98) | ||
| VF% | 20.00 (16.00–20.00) | ||
| WHR | 1.08 (1.04–1.15) | ||
| Lipid metabolism biomarkers | |||
| TCl, mmol/L | 5.79 (1.15) | ||
| HDLc, mmol/L | 1.17 (0.28) | ||
| LDLc, mmol/L | 3.60 (3.00–4.00) | ||
| ApoB/ApoA1 ratio | 0.97 (0.73–1.67) | ||
| LDLc/HDLc ratio | 3.12 (0.97) | ||
| LDLc/ApoB ratio | 2.60 (1.79–3.34) | ||
| TG/HDLc ratio | 2.00 (1.16–3.29) | ||
| TG, mmol/L | 2.60 (1.60–3.30) | ||
| Insulin resistance indicators | |||
| Blood glucose, mmol/L | 5.80 (5.03–6.50) | ||
| Immunoreactive insulin, µIU/mL | 18.38 (13.16–32.92) | ||
| HbA1c | 5.84 (5.47–6.20) | ||
| HOMA-IR | 4.51 (2.99–6.48) | ||
| Immunometabolic biomarkers | |||
| Inflammatory cytokines | |||
| IL-6, pg/mL | 28.50 (13.50–51.28) | ||
| TNF- |
9.80 (5.60–24.90) | ||
| hs-CRP, mg/L | 9.00 (4.00–18.00) | ||
| Adipocytokines | |||
| Adipo_HS, µg/mL | 7.85 (3.52) | ||
| Leptin, ng/mL | 46.50 (27.05–88.65) | ||
| Adipo/Lep ratio | 0.13 (0.08–0.31) | ||
| Visfatin, ng/mL | 5.88 (2.79) | ||
Note. Data are presented as median (interquartile range, IQR) for skewed
variables or mean
The internal consistency assessment of the von Zerssen Depression Scale yielded a satisfactory Cronbach’s alpha coefficient of 0.758 (Supplementary Table 2).
Correlation analyses using Spearman’s rho indicated that depressive symptom
scores (DS) were not significantly correlated with any individual biomarker
(p
To investigate potential underlying latent structures, principal component
analyses (PCA) were conducted separately for anthropometric markers, lipid
metabolism biomarkers, insulin resistance indicators, and cytokines (see
Supplementary Tables 4–6). Regression analyses using the extracted
component scores did not yield significant associations with depressive symptoms
(all p
Hierarchical multiple regression analyses were conducted to examine the
independent associations of selected lipid and inflammatory biomarkers with
depressive symptom severity. In Model 1, age and gender were included as
covariates. LDLc/ApoB ratio was a significant negative predictor (
| Model | Predictor | B | SE | t | p | 95% CI | VIF | R2 | Adj. R2 | |
| 1 | Constant | 39.679 | 6.004 | – | 6.609 | 27.736–51.622 | – | 0.128 | 0.075 | |
| Age | –0.100 | 0.095 | –0.115 | –1.054 | 0.295 | –0.288–0.089 | 1.118 | |||
| Gender | –0.733 | 1.281 | –0.063 | –0.572 | 0.569 | –3.282–1.816 | 1.128 | |||
| LDLc/ApoB | –1.653 | 0.634 | –0.332 | –2.606 | 0.011 | –2.914– –0.391 | 1.525 | |||
| ApoB/ApoA1 | –1.926 | 1.066 | –0.240 | –1.807 | 0.074 | –4.047–0.194 | 1.665 | |||
| IL-6 | 0.014 | 0.007 | 0.217 | 1.973 | 0.052 | 0.000–0.028 | 1.137 | |||
| 2 | Constant | 37.774 | 4.974 | – | 7.593 | 27.880–47.668 | – | 0.125 | 0.083 | |
| Age | –0.088 | 0.092 | –0.101 | –0.954 | 0.343 | –0.270–0.095 | 1.063 | |||
| ApoB/ApoA1 | –1.804 | 1.040 | –0.225 | –1.735 | 0.087 | –3.873–0.264 | 1.598 | |||
| IL-6 | 0.013 | 0.007 | 0.208 | 1.921 | 0.058 | 0.000–0.027 | 1.116 | |||
| LDLc/ApoB | –1.622 | 0.629 | –0.326 | –2.578 | 0.012 | –2.874– –0.371 | 1.514 | |||
| 3 | Constant | 33.752 | 2.640 | – | 12.784 | 28.501–39.002 | – | 0.115 | 0.084 | |
| ApoB/ApoA1 | –1.906 | 1.034 | –0.238 | –1.844 | 0.069 | –3.963–0.150 | 1.581 | |||
| IL-6 | 0.015 | 0.007 | 0.230 | 2.174 | 0.033 | 0.001–0.029 | 1.066 | |||
| LDLc/ApoB | –1.590 | 0.628 | –0.319 | –2.532 | 0.013 | –2.840– –0.341 | 1.510 |
Notes: Covariates: Age and Gender were included to control for demographic effects. 95% CI, 95% confidence interval. F and p-values for overall models: Model 1: F(5, 82) = 2.418, p = 0.043; Model 2: F(4, 83) = 2.965, p = 0.024; Model 3: F(3, 84) = 3.653, p = 0.016. Bold values indicate statistically significant results and corresponding regression coefficients discussed in the text. SE, standard error; VIF, variance inflation factor.
In Model 2, gender was excluded while age was retained as a covariate. LDLc/ApoB
remained a significant negative predictor (
Model 3, which included only the three biomarkers without covariates, confirmed
the robustness of these associations: LDLc/ApoB remained significant (
After adjustment for sex and age, effect sizes increased across models, suggesting that part of the initially observed association reflected shared variance with these covariates [57].
The key premise for this study is that metabolic syndrome and depression are bi-directionally related [44]. One direction is driven by depression, which predisposes to the development of metabolic syndrome, with inactivity and subsequent obesity which are assumed to be main factors leading to metabolic disorders. The other direction is from systemic inflammation and lipid dysregulation which may cause neurotoxic effects in the brain and thereby endogenous depression.
It is critical to consider that the entire recruited population with MetS suffers from various levels of manifested depressive symptoms, which range high above the established range for healthy population. In that context our data processing strategy is focused on severity of depression as an anchoring point.
In our study of individuals with newly diagnosed MetS, lower LDLc/ApoB ratios
were independently associated with depressive symptom severity (Model 3:
In recent years, lipid experts have increasingly established Apolipoprotein-B as a more informative marker for triglyceride-containing fractions of lipoproteins and a secondary target for therapy in metabolic syndrome [34, 35, 36]. Analyses of the LDLc/ApoB ratio in the literature have shown that this ratio is a predictor of cardiovascular and total mortality in the general population [58]. This ratio provides the highest informativeness of the severity of dyslipidemia because it demonstrates a relationship between the main LDL target in lipidology and the atherogenic nature of dyslipidemia, i.e., it also encompasses the residual lipid risk.
There is evidence in the literature about the relationship between proatherogenic lipids such as LDL, HDL, TG, ApoB, ApoB/ApoA1 ratio and their relationship with depression [17, 18, 27, 28, 33]. However, there is limited data on the relationship between LDLc/ApoB ratio and depression. The present results contribute to better explanation of this connection.
Regarding the relationship between depressive symptom severity and dyslipidemia,
our results indicate a trend-level inverse association between the ApoB/ApoA
ratio and depressive symptoms. Specifically, higher ApoB/ApoA1 values were linked
to lower depression scores, with
Literature data confirm that inflammation is a key determinant of depression in
metabolic syndrome (MetS). In our study, interleukin-6 (IL-6) was independently
associated with higher depressive symptom severity (Model 3:
The IL-6 pathways have been identified as potential bio-marker of various medical conditions. The effects that IL-6 depend on which of the two signalling pathways is used and on what kind of tissue. The classical pathway is thought to play a regulatory role while the trans signalling one is implicated in the development of various pathological states [59]. High levels of IL-6 along with other proinflammatory cytokines have been described to remodel the blood-brain barrier (BBB) and lead to a hyperpermeability state. Such hyper permeability states have been described by other authors to be present in MDD. In healthy conditions the BBB’s permeability is kept low by the endothelium, basal membrane and astrocyte end-feet. In a state of chronic low grade inflammation the structural and functional integrity of these components is altered [60].
Proinflammatory cytokines have been described to reduce intercellular tight junction proteins, such as Claudin-5, induce endothelial dysfunction, and reduce endothelial transporter proteins, among other effects. This leads to changes in the cerebrospinal fluid-blood ratio of various molecules, which can cause the accumulation of neurotoxic substances. A reduction of Claudin-5 protein in the endothelium of the hippocampal vasculature has been described, along with astrocyte loss in patients with MDD. A reduction in the number of astrocytes can significantly increase BBB permeability because astrocytes form 99% of the barrier’s surface [60].
Not only systemic but also IL-6 produced by microglia can mitigate the reduction of astrocytes. Shen et al. [61] describe in animal models that elevated levels of extracellular ATP can promote the secretion of IL-6 by microglia and damage astrocytes, though the exact mechanism is not well understood. Experimental models of proinflammatory states with elevated IL-6 have been described to impair the function of the hippocampus and ventral striatum. Dysfunctions in these structures could have a causal effect on the development of depressive symptoms such as anhedonia and apathy [62, 63].
Whether IL-6 has a direct effect on the development of depressive symptoms or simply increases susceptibility is not quite clear. Notably, IL-6 pathways are implicated in other psychiatric conditions, such as schizophrenia [64], which indicates that the causal contribution of this factor is rather non-specific, and it should be interpreted as mediator of general stress-related neuro-immune response [65, 66]. It is associated with both peripheral/systemic immune disturbances which cross the blood-brain barrier and cause neurotoxic effects in mental disorders and as a product from the local pathological activation of microglia, the latter being studied in animal models [67, 68, 69].
This study is based on a sample without healthy control population. Further investigations recruiting healthy controls and patients with MetS without depression are required in order to achieve more advanced interpretation of the current results.
Lower LDLc/ApoB ratios and elevated IL-6 levels are independently associated with greater depressive symptom severity in individuals with newly diagnosed metabolic syndrome. These biomarkers reflect underlying atherogenic and inflammatory processes, offering clinically relevant insights into the neuro-metabolic pathways connecting MetS and depression. Their assessment may help identify individuals at high risk and guide targeted prevention and intervention strategies.
Data and materials from this study are available from the Corresponding author upon reasonable request.
SK, LK, and IP designed the research study. SK, MFK and LK performed the research. DS and KS performed help and advice on the psychological assessment. TD performed the laboratory testing. KS analyzed the data. DS shaped the basic design for looking for a link to depression with the chosen method. DS, SK, LK, KS and IP wrote the manuscript. All authors contributed to editorial changes in the manuscript. All authors read and approved the final manuscript. All authors have participated sufficiently in the work and agreed to be accountable for all aspects of the work.
This study was approved by the Research Ethics Committee of the Medical University-Plovdiv (Protocol No. 22, 31 December 2022). All participants have provided written informed consent. The study was conducted in accordance with the guidelines of the Declaration of Helsinki.
Not applicable.
The project received funding from the Medical University of Plovdiv (DPDP-09/2023).
The authors declare there are no conflicts of interest. Drozdstoy Stoyanov is serving as one of the Guest Editor of this journal. We declare that he had no involvement in the peer review of this article and has no access to information regarding its peer review. Full responsibility for the editorial process for this article was delegated to Bettina Platt.
Supplementary material associated with this article can be found, in the online version, at https://doi.org/10.31083/JIN49628.
References
Publisher’s Note: IMR Press stays neutral with regard to jurisdictional claims in published maps and institutional affiliations.