


 , Juan Tao 2,†, Qiong Dong 1,†, Qiuyue Yu 3, Haichao Wang 1, Ping Li 2, Quan Yuan 2, Aiping Jin 3,*
 , Peng Gao 2,*, Li Gong 3,*
1 Department of Neurology, Shanghai Tenth People’s Hospital, School of Medicine, Tongji University, 200092 Shanghai, China
2 Department of Ophthalmology, Shanghai Tenth People’s Hospital, School of Medicine, Tongji University, 200092 Shanghai, China
3 Department of Neurology, Tongren Hospital, School of Medicine, Shanghai JiaoTong University, 200336 Shanghai, China
†These authors contributed equally.
Abstract
Enlarged perivascular spaces (EPVS) represent a hallmark imaging feature of cerebral small vessel disease. The ocular vasculature is an anatomical extension of cerebral vessels, constituting part of the microvascular system; however, the relationship between ocular vascular characteristics and EPVS remains poorly understood. In this study, we examined the association between ocular vascular parameters and the regional distribution of EPVS in patients with minor stroke.
Patients diagnosed with minor stroke between 2021 and 2024 were prospectively enrolled. Ocular vascular characteristics were assessed using optical coherence tomography angiography (OCTA) and ophthalmic arterial ultrasound (OAU), while 3.0 T magnetic resonance imaging (MRI) was performed to evaluate EPVS in the centrum semiovale (CSO) and basal ganglia (BG). Demographic characteristics, clinical risk factors, neuroimaging findings, and laboratory data were recorded at admission.
A total of 111 participants were enrolled, with a mean age of 65.23 ± 7.62 years; 43.24% were female. At baseline, 43 patients (38.74%) had high CSO-EPVS burden, and 61 (54.95%) had high BG-EPVS burden. In multivariate regression analysis, superficial retinal capillary plexus perifoveal density (odds ratio [OR] = 0.87, p = 0.020) measured by OCTA and diabetes mellitus were independently associated with BG-EPVS, whereas the resistive index of the ophthalmic artery (OR = 1.33, p < 0.001) measured by OAU was independently and positively associated with CSO-EPVS.
Ocular microvascular density was associated with BG-EPVS, whereas ocular vascular elasticity was associated with CSO-EPVS. These findings support the hypothesis that these EPVS subtypes arise from distinct vascular mechanisms – microvascular hypoperfusion versus reduced vascular elasticity.
Keywords
- enlarged perivascular spaces
- optical coherence tomography angiography
- ophthalmic artery
- ultrasonography
- doppler
- microvascular dysfunction
Perivascular spaces (PVS) are fluid-filled compartments that surround penetrating arteries, capillaries, veins, and venules as they extend from the brain surface into the parenchyma. When these spaces become dilated, they are termed enlarged perivascular spaces (EPVS) [1]. EPVS are predominantly located in the basal ganglia (BG) and centrum semiovale (CSO), regions thought to predominantly represent hypertensive microangiopathy and cerebral amyloid angiopathy (CAA), respectively [2]. Age, hypertension, gender, and white matter lesions are more strongly associated with BG-EPVS, whereas arteriosclerosis, smoking, and deep microbleeds are more strongly associated with CSO-EPVS [3, 4, 5], suggesting distinct underlying pathophysiological mechanisms. EPVS typically progress slowly and continuously, making their temporal dynamics challenging to investigate in the general population [6]. Patients with minor stroke may represent an early or relatively mild stage of cerebral small vessel disease (CSVD), with fewer confounding factors such as large-vessel occlusion, cerebral edema, or extensive tissue damage, and are more amenable to recruitment and follow-up. Accordingly, several studies on cerebral small vessel disease have focused on this population [3, 7, 8].
The retina and brain share anatomical, physiological, and embryological similarities in cell types, vasculature, and immune responses [9]. Because the retinal microvasculature shares structural and functional similarities with the cerebral vascular system, alterations in retinal microvascular parameters may provide valuable insights into cerebrovascular and neurodegenerative disorders [10]. Consequently, optical coherence tomography angiography (OCTA) and ophthalmic arterial ultrasound (OAU) may offer a unique perspective on brain function and a range of neurological disorders [11]. Previous study has focused on associations between ocular vascular alterations and Alzheimer’s disease (AD), multiple sclerosis (MS), or various optic neuropathies (ON) [12]. However, evidence regarding the relationship between ocular vascular characteristics and EPVS among patients with minor stroke remains limited. A recent study has investigated the association between retinal vascular alterations and EPVS, indicating that greater severity of retinal arteriosclerosis is linked to increased EPVS burden [13]. Notably, one study found inverse correlations between EPVS grade and number and both the central retinal arteriolar equivalent (CRAE) and the arteriole-to-venule ratio (AVR); however, the precise anatomical locations of the EPVS were not specified [14].
Based on the foregoing considerations, this study aimed to further explore the association between EPVS burden in different brain regions and ocular vascular characteristics in patients with minor stroke.
A prospective observational study was conducted, enrolling all consecutive
patients admitted to Shanghai Tenth People’s Hospital, Tongji University, between
1 January 2021 and 1 January 2024 who met the inclusion criteria for minor
stroke. The inclusion criteria were as follows: patients diagnosed with ischemic
stroke based on computed tomography (CT) or magnetic resonance imaging (MRI),
following the 2013 American Heart Association/American Stroke Association
guidelines; stroke onset within 7 days; age over 18 years; National Institutes of
Health Stroke Scale (NIHSS) score
Brain MRI was performed using a 3.0-T scanner (Magnetom Verio 3.0 T, Siemens
Medical Solutions, Germany) with high-end gradients of 30 mT/m. The imaging
protocol consisted of T1-weighted imaging (T1WI: TR = 140 ms, TE = 2.46 ms, FOV =
38 cm, slice thickness = 6 mm, interslice interval = 1.5 mm, matrix = 320
EPVS were defined as round or linear cerebrospinal fluid–isointense lesions
smaller than 3 mm (hyperintense on T2 and hypointense on T1/FLAIR) following the
path of penetrating arteries. After reviewing all relevant slices, the maximum
number of EPVS observed on one side of the brain was recorded. EPVS burden in the
CSO and BG was visually rated and classified as high or low. Consistent with
prior studies [15, 16], a threshold of
The retinal microvasculature was evaluated using an RTVue XR Avanti
spectral-domain OCT system (Optovue, Inc., Fremont, CA, USA) with integrated
AngioVue software (RTVue‑XR version 2017.1.0.155, Optovue, Inc.) for quantitative
analysis. OCTA was used to scan the central retinal region (6
A 7.5-MHz linear transducer (PLT-704SBT, Canon Medical Systems Corporation, Ōta, Tokyo, Japan) was gently applied transversely to the patient’s closed upper eyelid with conduction gel by a sonographer. Pulsed-wave Doppler (Canon Medical Systems Corporation, Ōta, Tokyo, Japan) was then used to record three to five similar waveforms, with the insonation angle maintained below 20°, a 2-mm sample gate, depth of 3.0–4.5 cm, high-pass filter at 50 Hz, and pulse repetition frequency set at 125 kHz. Color Doppler ultrasonography (Canon Medical Systems Corporation) was used to identify the ophthalmic artery (OA), central retinal artery (CRA), posterior ciliary artery (PCA), and central retinal vein (CRV), and to evaluate the peak systolic velocity (PSV), end-diastolic velocity (EDV), and resistive index (RI) of each artery.
Data were analyzed using SPSS 27.0 for Windows (IBM Corp., Armonk, NY, USA),
with p
Overall, 148 participants meeting the diagnostic criteria for minor stroke were
enrolled in the study; 30 were eliminated due to exclusion criteria and 7
patients had missing OCTA data. Ultimately, 111 individuals (43.24% female) were
included in the final analysis (Fig. 1), with a mean age of 65.23
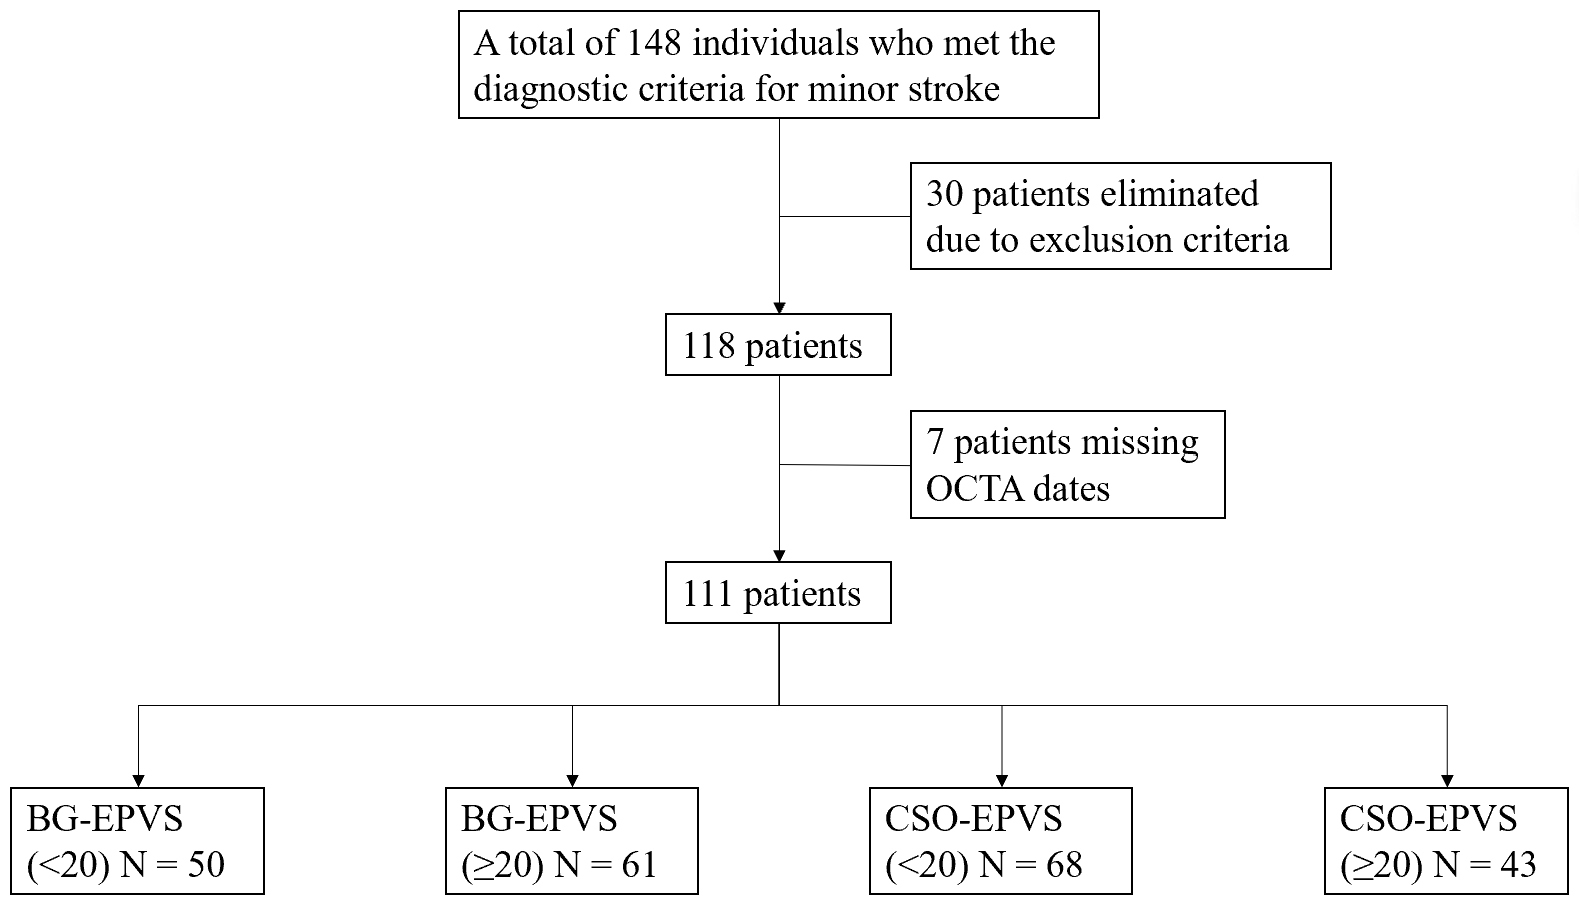 Fig. 1.
Study flow chart. BG, Basal ganglia; EPVS, enlarged perivascular spaces; CSO, centrum semiovale; OCTA, optical coherence tomography angiography.
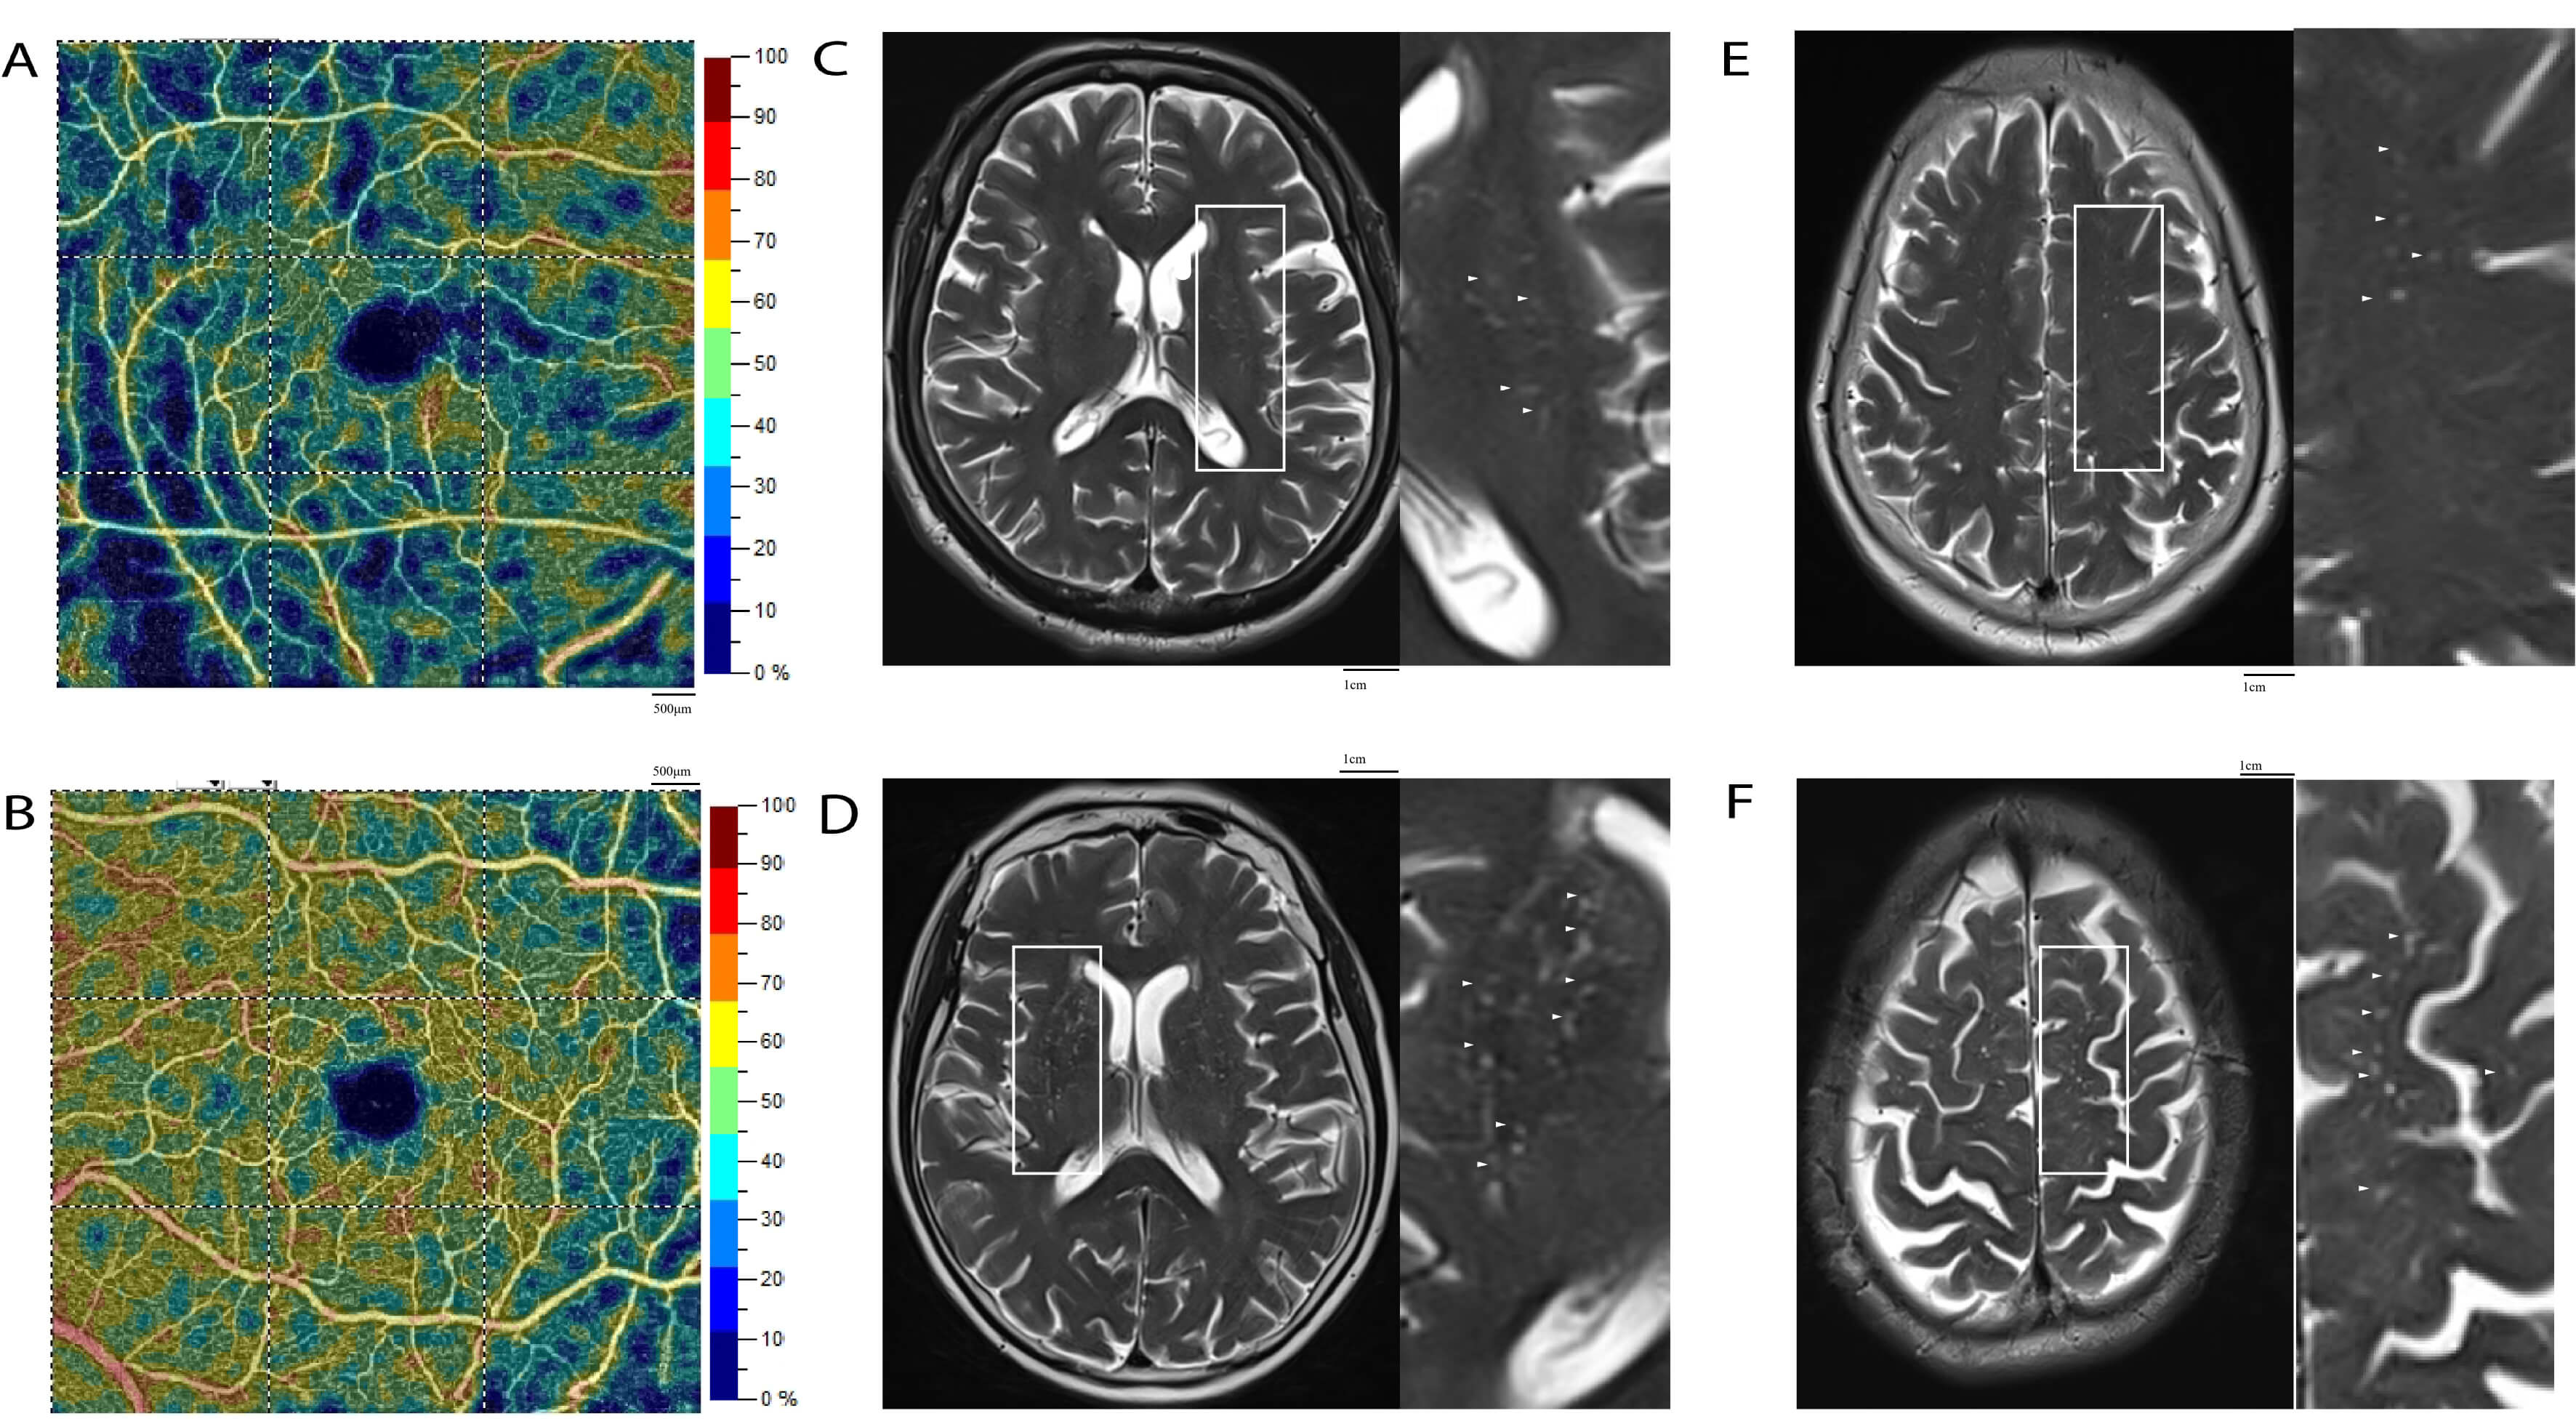 Fig. 2.
Different densities of superficial retinal capillary plexus (SRCP) and different burdens of EPVS. (A) Low SRCP density on OCTA. (B) High SRCP density on OCTA. (C) Low BG-EPVS burden. (D) High BG-EPVS burden. (E) Low CSO-EPVS burden. (F) High CSO-EPVS burden. Scale bars: 500 µm and 1cm in OCTA images (A,B); 1 cm in MRI images (C–F). Annotations: White solid boxes indicate the region of interest (ROI) for a magnified view; small white arrows point to representative EPVS.
| Characteristic | BG-EPVS ( |
BG-EPVS ( |
p value | CSO-EPVS ( |
CSO-EPVS ( |
p value |
| N = 50 | N = 61 | N = 68 | N = 43 | |||
| Age, mean |
63.50 |
66.59 |
0.054 | 64.83 |
65.94 |
0.506 |
| Gender (female) (%) | 28 (56.00) | 20 (32.79) | 0.014* | 35 (51.47) | 13 (30.23) | 0.028* |
| Diabetes mellitus (%) | 16 (32.00) | 35 (57.38) | 0.008* | 29 (42.65) | 22 (51.16) | 0.380 |
| Hypertension (%) | 33 (66.00) | 40 (65.57) | 0.962 | 46 (67.65) | 27 (62.79) | 0.599 |
| History of smoke (%) | 13 (26.00) | 24 (39.34) | 0.138 | 21 (30.88) | 16 (37.21) | 0.491 |
| Recurrent stroke (%) | 17 (34.00) | 23 (37.70) | 0.686 | 25 (36.76) | 15 (34.88) | 0.841 |
| Fazekas pWML score, mean |
1.33 |
1.49 |
0.244 | 1.29 |
1.64 |
0.018* |
| Fazekas dWML score, mean |
0.98 |
1.27 |
0.121 | 1.03 |
1.33 |
0.134 |
| BMI, mean |
24.09 |
24.14 |
0.935 | 24.03 |
24.27 |
0.628 |
Abbreviations: pWML, periventricular white matter lesion; dWML, deep white matter lesion; BMI, body mass index; SD, standard deviation.
*Statistically significant difference (p
A comparison of OCTA examination characteristics between patients with high and
low EPVS burden in the CSO and BG is shown in Table 2. Patients with high BG-EPVS
or CSO-EPVS burden were more likely to have lower retinal microvasculature
density in the macular region, including SRCP parafoveal density, SRCP perifoveal
density, DRCP parafoveal density, and DRCP perifoveal density. Furthermore, high
BG-EPVS burden was significantly associated with low inside disc density (50.43%
vs. 47.58%; p = 0.015) in the optic disc, whereas no significant
difference was found between groups in CSO-EPVS burden (49.70% vs. 47.95%;
p = 0.059). The superficial, deep, and peripapillary RNFL thickness and
FAZ did not differ significantly between subjects with high EPVS burden and those
with low EPVS burden. As shown in Table 3, ophthalmic arterial ultrasound was
performed to determine the RI, PSV, and EDV of three arteries and one vein. High
CSO-EPVS burden was more frequent in patients with high RI of the OA (72.42
| Characteristic | BG-EPVS ( |
BG-EPVS ( |
p value | CSO-EPVS ( |
CSO-EPVS ( |
p value |
| N = 50 | N = 61 | N = 68 | N = 43 | |||
| SRCP ParaFovea density (%) | 52.25 (50.47, 54.64) | 46.65 (39.24, 49.92) | 51.10 (48.68, 54.17) | 46.65 (38.70, 49.92) | ||
| SRCP PeriFovea density (%) | 50.47 (48.50, 51.77) | 46.10 (41.29, 49.14) | 49.95 (46.81, 51.91) | 46.10 (41.29, 49.14) | ||
| DRCP ParaFovea density (%) | 53.42 (51.30, 56.19) | 50.10 (43.88, 54.26) | 52.73 (48.60, 56.08) | 50.18 (44.64, 53.48) | 0.044* | |
| DRCP PeriFovea density (%) | 49.20 (44.26, 52.51) | 46.07 (37.04, 49.44) | 0.001* | 48.34 (43.09, 52.42) | 45.72 (38.74, 48.78) | 0.014* |
| FAZ Area (mm2) | 0.33 (0.27, 0.43) | 0.30 (0.22, 0.44) | 0.576 | 0.32 (0.23, 0.42) | 0.35 (0.24, 0.45) | 0.552 |
| sRNFL (µm) | 102.85 (96.43, 107.93) | 100.90 (87.40, 106.10) | 0.321 | 102.60 (95.10, 107.58) | 100.30 (85.25, 104.70) | 0.205 |
| dRNFL (µm) | 192.15 (186.80, 198.88) | 192.70 (177.60, 204.70) | 0.870 | 192.25 (185.25, 200.28) | 193.70 (178.25, 205.10) | 0.773 |
| pRNFL (µm) | 107.72 (98.97, 119.95) | 108.56 (99.89, 121.40) | 0.770 | 107.72 (97.83, 120.18) | 112.03 (103.99, 121.22) | 0.283 |
| Inside disc density (%) | 50.43 (47.49, 53.37) | 47.58 (44.61, 50.73) | 0.015* | 49.70 (45.60, 53.66) | 47.95 (43.53, 50.82) | 0.059 |
| Peripapillary capillary density (%) | 51.63 (49.67, 53.21) | 51.04 (45.66, 53.66) | 0.672 | 50.98 (47.50, 53.52) | 52.27 (48.68, 53.64) | 0.445 |
Abbreviations: DRCP, deep retinal capillary plexus; FAZ, foveal avascular zone; sRNFL, superficial retinal nerve fiber layer; dRNFL, deep retinal nerve fiber layer; pRNFL, peripapillary retinal nerve fiber layer.
*Statistically significant difference (p
| Characteristic | BG-EPVS ( |
BG-EPVS ( |
p value | CSO-EPVS ( |
CSO-EPVS ( |
p value | |
| N = 50 | N = 61 | N = 68 | N = 43 | ||||
| OA | |||||||
| RI, mean |
73.65 |
73.12 |
0.617 | 72.42 |
74.92 |
0.024* | |
| PSV (cm/s) | 43.25 (37.63, 48.88) | 38.00 (31.00, 47.75) | 0.090 | 42.00 (35.00, 55.00) | 40.00 (29.00, 49.00) | 0.176 | |
| EDV (cm/s) | 10.75 (9.50, 13.00) | 10.25 (7.63, 12.50) | 0.375 | 11.00 (9.00, 15.00) | 10.00 (7.00, 11.00) | 0.056 | |
| CRA | |||||||
| RI, mean |
61.75 |
61.10 |
0.687 | 61.96 |
60.39 |
0.337 | |
| PSV (cm/s) | 16.50 (15.00, 20.50) | 16.50 (12.63, 21.00) | 0.363 | 16.00 (14.00, 20.00) | 18.00 (13.00, 23.00) | 0.996 | |
| EDV (cm/s) | 10.50 (9.00, 13.75) | 10.00 (7.00, 15.00) | 0.374 | 7.00 (5.00, 8.00) | 7.00 (5.00, 9.00) | 0.625 | |
| PCA | |||||||
| RI, mean |
61.61 |
60.21 |
0.285 | 60.75 |
60.90 |
0.914 | |
| PSV (cm/s) | 20.00 (16.50, 22.75) | 18.25 (14.13, 23.38) | 0.222 | 20.00 (15.00, 24.00) | 19.00 (14.00, 21.00) | 0.867 | |
| EDV (cm/s) | 7.50 (6.50, 9.00) | 7.25 (5.00, 9.00) | 0.497 | 8.00 (6.00, 10.00) | 7.00 (5.00, 9.00) | 0.477 | |
| CRV | 8.50 (7.00, 9.50) | 7.50 (6.00, 9.50) | 0.288 | 8.00 (6.00, 9.00) | 8.00 (6.00, 9.00) | 0.221 | |
Abbreviations: OAU, ophthalmic arterial ultrasound; OA, ophthalmic artery; CRA, central retinal artery; PCA, posterior ciliary artery; CRV, central retinal vein; RI, resistive index; PSV, peak systolic velocity; EDV, end-diastolic velocity.
*Statistically significant difference (p
In the univariate logistic regression analysis (Table 4), BG-EPVS and CSO-EPVS burden were negatively correlated with SRCP parafoveal density, SRCP perifoveal density, DRCP parafoveal density, DRCP perifoveal density, and inside disc density in patients with minor stroke. A significant correlation was found between BG-EPVS burden and gender (odds ratio [OR] = 0.38, p = 0.015), as well as with diabetes mellitus (OR = 2.86, p = 0.008). The analysis also demonstrated stronger associations between high CSO-EPVS burden and gender (OR = 0.41, p = 0.030), high pWML score (OR = 2.79, p = 0.022), and high RI of the OA (OR = 1.16, p = 0.005) in patients with minor stroke.
| Characteristic | BG-EPVS | CSO-EPVS | ||||||
| OR | 95% CI | p value | OR | 95% CI | p value | |||
| Demographic statistics | ||||||||
| Age | 1.06 | 0.99–1.12 | 0.061 | 1.02 | 0.96–1.08 | 0.502 | ||
| Gender (female) | 0.38 | 0.18–0.83 | 0.015* | 0.41 | 0.18–0.92 | 0.030* | ||
| Diabetes mellitus | 2.86 | 1.31–4.25 | 0.008* | 1.41 | 0.65–3.03 | 0.381 | ||
| Hypertension | 1.02 | 0.46–2.24 | 0.962 | 0.81 | 0.37–1.80 | 0.600 | ||
| Smoking | 1.85 | 0.82–4.17 | 0.140 | 1.33 | 0.59–2.97 | 0.491 | ||
| Recurrent stroke | 1.18 | 0.54–2.57 | 0.686 | 0.92 | 0.42–2.05 | 0.841 | ||
| Fazekas pWML score | 1.47 | 0.77–2.81 | 0.243 | 2.79 | 1.14–4.27 | 0.022* | ||
| Fazekas dWML score | 1.45 | 0.90–2.34 | 0.123 | 1.44 | 0.89–2.31 | 0.121 | ||
| BMI | 1.01 | 0.86–1.17 | 0.934 | 1.03 | 0.88–1.21 | 0.678 | ||
| OCTA | ||||||||
| SRCP ParaFovea density | 0.79 | 0.70–0.89 | 0.90 | 0.84–0.96 | 0.001* | |||
| SRCP PeriFovea density | 0.83 | 0.75–0.93 | 0.87 | 0.80–0.95 | 0.002* | |||
| DRCP ParaFovea density | 0.89 | 0.82–0.96 | 0.003* | 0.95 | 0.90–0.99 | 0.024* | ||
| DRCP PeriFovea density | 0.90 | 0.84–0.96 | 0.002* | 0.93 | 0.88–0.99 | 0.016* | ||
| FAZ Area | 2.03 | 0.58–3.13 | 0.272 | 1.66 | 0.72–3.85 | 0.234 | ||
| sRNFL | 0.99 | 0.97–1.02 | 0.581 | 0.99 | 0.96–1.01 | 0.250 | ||
| dRNFL | 0.99 | 0.97–1.02 | 0.661 | 0.99 | 0.97–1.02 | 0.775 | ||
| pRNFL | 1.01 | 0.98–1.03 | 0.574 | 1.02 | 0.99–1.05 | 0.187 | ||
| Inside disc density | 0.93 | 0.86–0.99 | 0.041* | 0.92 | 0.85–0.99 | 0.029* | ||
| Peripapillary capillary density | 0.98 | 0.93–1.04 | 0.531 | 1.03 | 0.96–1.09 | 0.448 | ||
| Ophthalmic artery ultrasound | ||||||||
| OA | ||||||||
| RI, mean |
1.00 | 0.92–1.09 | 0.949 | 1.16 | 1.05–1.28 | 0.005* | ||
| PSV | 0.99 | 0.96–1.02 | 0.464 | 0.97 | 0.94–1.01 | 0.123 | ||
| EDV | 0.99 | 0.88–1.11 | 0.847 | 0.93 | 0.82–1.06 | 0.288 | ||
| CRA | ||||||||
| RI, mean |
0.99 | 0.93–1.05 | 0.683 | 0.97 | 0.91–1.00 | 0.334 | ||
| PSV | 0.95 | 0.89–1.03 | 0.204 | 0.99 | 0.91–1.09 | 0.972 | ||
| EDV | 0.88 | 0.70–1.11 | 0.269 | 1.05 | 0.83–1.33 | 0.678 | ||
| PCA | ||||||||
| RI, mean |
0.96 | 0.89–1.04 | 0.283 | 1.00 | 0.93–1.08 | 0.911 | ||
| PSV | 0.96 | 0.88–1.04 | 0.289 | 0.99 | 0.91–1.08 | 0.832 | ||
| EDV | 0.93 | 0.75–1.16 | 0.517 | 0.94 | 0.75–1.18 | 0.603 | ||
| CRV | 1.01 | 0.90–1.15 | 0.827 | 1.02 | 0.90–1.15 | 0.765 | ||
Abbreviations: OR, Odds ratio.
*Statistically significant difference (p
Multivariable logistic regression analysis was subsequently performed (Fig. 3).
Variables included in the multivariable logistic regression models were selected
based on both clinical relevance reported in previous studies and statistical
significance in univariable analyses (p
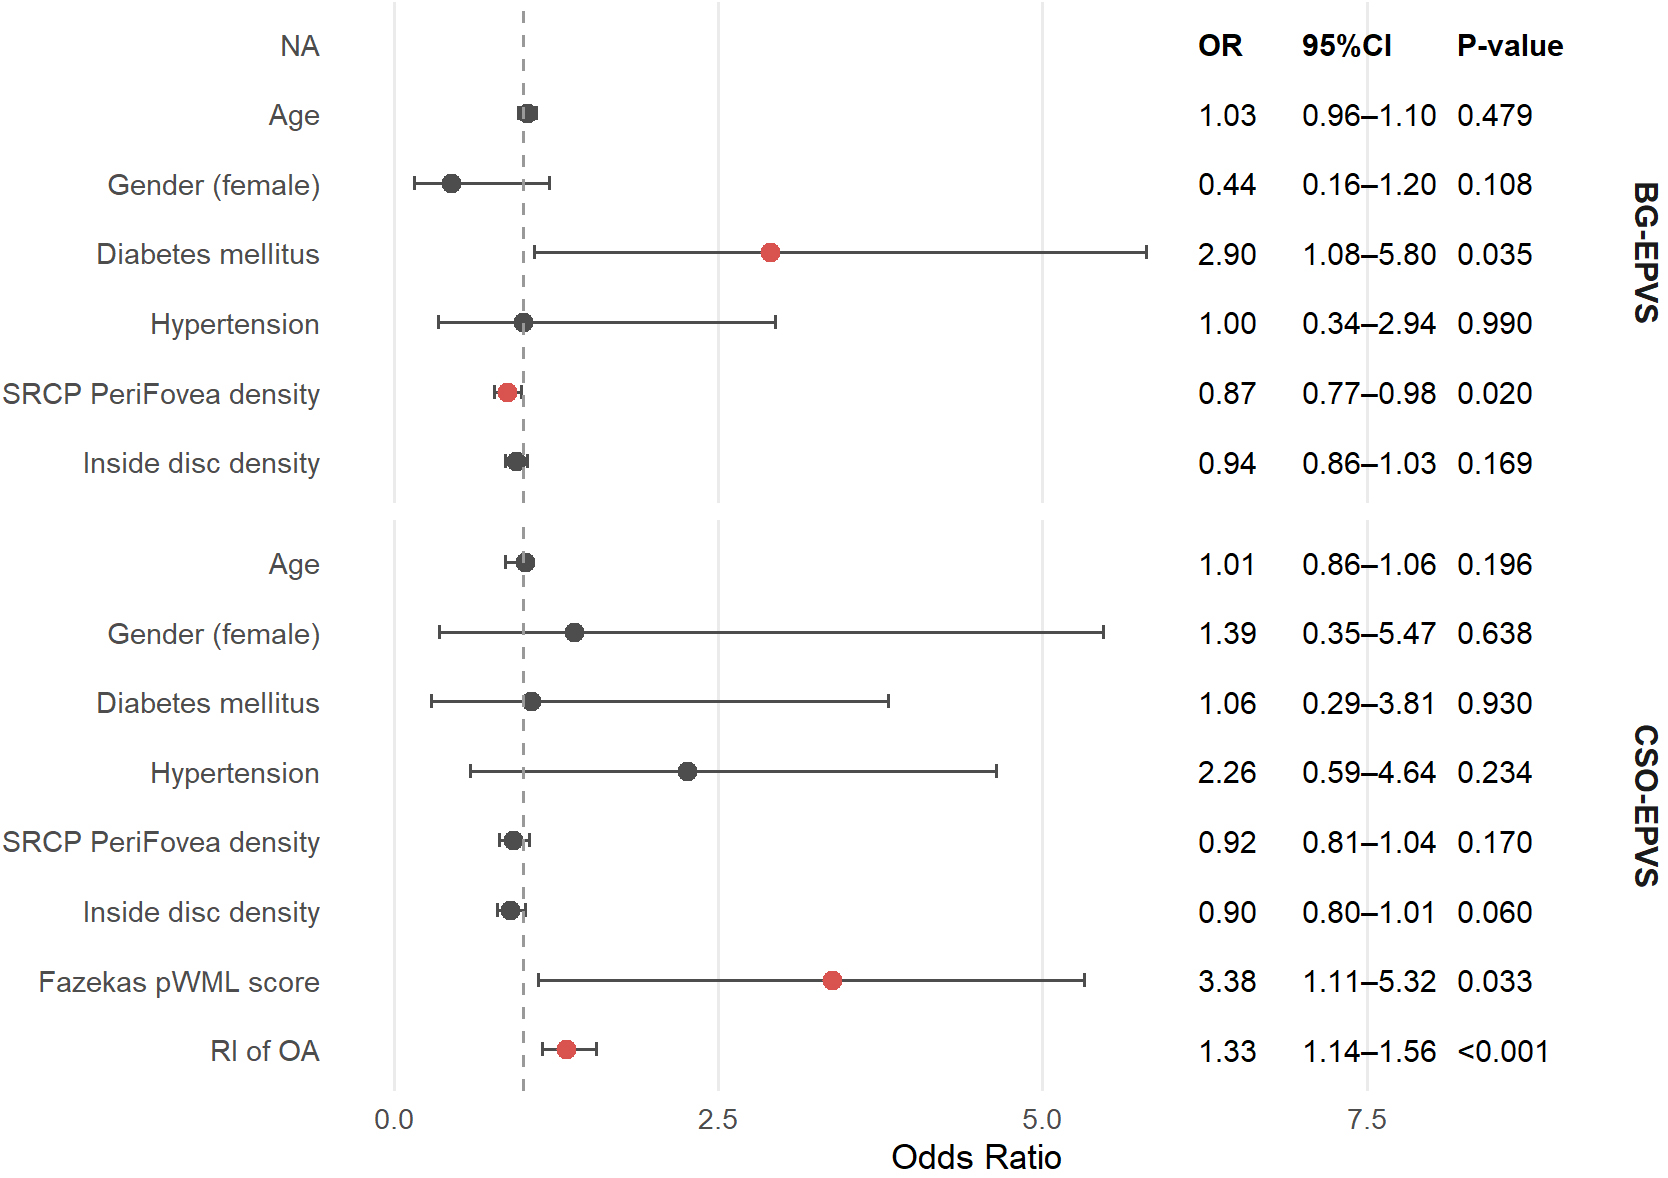 Fig. 3.
Multivariate logistic regression analysis of factors associated with EPVS. A indicates variables included as risk factors in the multivariate logistic regression.
In this observational study, we observed that EPVS severity and distribution varied according to ocular vascular characteristics. After adjusting for potential confounders, the perifoveal density of the superficial retinal capillary plexus measured by OCTA was independently associated with BG-EPVS, whereas the resistive index of the ophthalmic artery measured by OAU demonstrated an independent positive relationship with CSO-EPVS. These results suggest that specific microvascular and macrovascular parameters of the eye may reflect underlying cerebral small vessel pathology. By highlighting the distinct vascular correlates of BG-EPVS and CSO-EPVS, our findings contribute to a better understanding of the pathophysiological mechanisms underlying EPVS distribution and severity. This study provides novel evidence supporting the utility of noninvasive ocular vascular imaging as a potential biomarker for early identification and risk stratification of EPVS.
These findings align with prior studies reporting associations between EPVS and gender [17, 18], as well as with white matter hyperintensity [19]. Moreover, we found that diabetes mellitus was positively correlated with high BG-EPVS burden, corroborating prior studies indicating that insulin resistance is positively associated with the severity of BG-EPVS [20]. Although earlier studies have reported notable links between EPVS and ocular vascular characteristics, most of these investigations were limited to a single characteristic. Mutlu et al. [14] reported that CRAE and central retinal vein equivalent (CRVE) were associated with the occurrence of EPVS in the CSO and hippocampus, but not in the BG. Additionally, another study observed that in patients with transient ischemic attack or minor stroke, arteriovenous nicking and retinal arteriosclerosis were positively correlated with EPVS severity [13]. Compared with these previous studies, our study provides novel insights by distinguishing region-specific associations: we demonstrate that perifoveal SRCP density is independently associated with BG-EPVS, whereas ophthalmic artery resistive index is independently associated with CSO-EPVS. This highlights the differential roles of ocular microvascular density and vascular elasticity in the pathophysiology of EPVS, offering a more nuanced understanding of eye–brain vascular interactions.
Aging, atherosclerosis, and vascular calcification progressively diminish arterial elasticity, leading to reduced arterial compliance [21]. Prior research has demonstrated that markers of impaired vascular elasticity—such as decreased CRAE and increased CRVE—are associated with greater CSO-EPVS burden. A population-based cross-sectional study found that increased CRVE was associated with reduced small artery wall compliance, whereas decreased CRAE was linked to reduced large artery compliance, both of which are considered markers of endothelial dysfunction [22]. Furthermore, higher brachial–ankle pulse wave velocity (baPWV), a well-established indicator of systemic arterial stiffness, has similarly been linked to more severe CSO-EPVS [23]. These findings align with our results and support the notion that diminished vascular elasticity may impair perivascular clearance in the superficial white matter, thereby contributing to the development of CSO-EPVS. Retinal fractal dimension is commonly used to quantify retinal vascular density, and lower values indicate microvascular rarefaction. Reductions in fractal dimension (FD) have been linked to stroke, cognitive impairment, and hypertension, reflecting microvascular damage likely linked to impaired cerebral perfusion [24]. Consistent with this, our study found that lower ocular microvascular density was positively associated with higher burden of BG-EPVS, supporting the hypothesis that inadequate microcirculatory perfusion may disrupt glymphatic clearance and promote PVS enlargement in the BG. Taken together, these observations reinforce the concept that BG-EPVS and CSO-EPVS arise from distinct vascular mechanisms—microvascular hypoperfusion in deep brain regions versus reduced vascular elasticity in superficial white matter. Additionally, quantitative susceptibility mapping (QSM) reflects iron deposition and microvascular integrity. Increased susceptibility in deep gray nuclei has been linked to cognitive impairment and blood–brain barrier dysfunction in CSVD [25, 26], suggesting that iron accumulation may indicate microvascular damage. Although QSM was not available in our cohort, integrating EPVS and QSM in future studies could provide complementary mechanistic insights.
The region-specific associations (BG versus CSO) could influence clinical risk stratification or follow-up strategies in patients with minor stroke or early cerebral small vessel disease. BG-EPVS may serve as an imaging marker of chronic small perforating artery injury, suggesting that patients with higher BG-EPVS burden could benefit from stricter blood pressure control and closer management of vascular risk factors. In contrast, CSO-EPVS could indicate increased upstream arterial stiffness, suggesting that patients with higher CSO-EPVS burden may benefit from systematic assessment of arterial stiffness and hemodynamic parameters, including pulse pressure and arterial resistance–related indices. Previous studies have shown that the retina and diencephalon share similar angiogenesis patterns and highly protected vascular systems, and that blood-retinal barrier dysfunction parallels blood–brain barrier impairment [27, 28]. Inflammation and endothelial dysfunction, driven by common cardiovascular risk factors, may contribute to both retinal and cerebral microangiopathy [29]. Our findings suggest that ocular microvascular assessment, given its noninvasive nature, low cost, and accessibility [30], could serve as a potential biomarker for cerebral small vessel disease and may be useful for large-scale screening.
We prospectively recruited well-characterized subjects and innovatively explored
the association of ocular vascular characteristics with EPVS in different
regions. Simultaneously, our study represents a groundbreaking opportunity to
harness noninvasive ocular microvascular measurement tools for evaluating
early-stage pathological alterations in neurodegenerative diseases. Furthermore,
it provides additional evidence for the different mechanisms underlying the
formation of EPVS in various regions. This study had several limitations. First,
although it was prospectively designed, the analysis was cross-sectional in
nature. As a result, causal relationships cannot be established, and longitudinal
studies are needed to determine whether ocular vascular characteristics can serve
as baseline predictors of EPVS progression. Second, the cutoff of EPVS
In patients with minor stroke, reduced perifoveal SRCP density was associated with BG-EPVS, whereas increased ophthalmic artery resistive index was associated with CSO-EPVS, reinforcing that these EPVS subtypes arise from distinct vascular mechanisms—microvascular hypoperfusion versus reduced vascular elasticity. Noninvasive OCTA and OAU imaging may provide practical tools for assessing EPVS burden and early risk stratification.
EPVS, enlarged perivascular spaces; OCTA, optical coherence tomography angiography; OAU, ophthalmic arterial ultrasound; MRI, magnetic resonance imaging; CSO, centrum semiovale; BG, basal ganglia; CAA, cerebral amyloid angiopathy; CSVD, cerebral small vessel disease; CT, computed tomography; NIHSS, National Institutes of Health Stroke Scale; BMI, body mass index; SRCP, superficial retinal capillary plexus; DRCP, deep retinal capillary plexus; FAZ, foveal avascular zone; VD, vessel density; ILM, internal limiting membrane; IPL, inner plexiform layer; OPL, outer plexiform layer; RNFL, retinal nerve fiber layer; OA, ophthalmic artery; CRA, central retinal artery; PCA, posterior ciliary artery; CRV, central retinal vein; PSV, peak systolic velocity; EDV, end-diastolic velocity; RI, resistive index; ICC, intraclass correlation coefficient; SD, standard deviation; IQR, interquartile range; VIF, variance inflation factor; pWML, periventricular white matter lesion; dWML, deep white matter lesion; CRAE, central retinal arteriolar equivalent; AVR, arteriole-to-venule ratio; CRVE, central retinal vein equivalent; baPWV, brachial–ankle pulse wave velocity; FD, fractal dimension; QSM, quantitative susceptibility mapping.
The data that support the findings of this study are available from the corresponding authors on reasonable request.
NM, JT, and QD were responsible for formal analysis and writing-review and editing; QYY, HW, PL, and QY participated in patient investigation and data curation and were responsible for writing-original draft; LG, AJ, and PG provided conceptualization and methodology. All authors contributed to editorial changes in the manuscript. All authors read and approved the final manuscript. All authors have participated sufficiently in the work and agreed to be accountable for all aspects of the work.
This study was conducted in accordance with the Declaration of Helsinki and received approval from the Ethics Committee of Shanghai Tenth People’s Hospital (ethical approval number: 21K253). Written informed consent was obtained from all participants.
We thank all participants and their families, all trial investigators for their support.
This research was supported by grants from the Shanghai Municipal Science and Technology Commission (23Y11901000), National Health Commission Brain Health Innovation Research Project and National Natural Science Foundation Project (81901183).
The authors declare no conflict of interest.
Supplementary material associated with this article can be found, in the online version, at https://doi.org/10.31083/JIN49070.
References
Publisher’s Note: IMR Press stays neutral with regard to jurisdictional claims in published maps and institutional affiliations.