


 , Yiguo Deng 2, Miao Yu 1, Qihan Zhang 2, Siyu Li 2, Jiaying Li 3,*,†
 , Zengjie Ye 1,2,*,†
1 School of Nursing, Guangzhou University of Chinese Medicine, 510006 Guangzhou, Guangdong, China
2 School of Nursing, Guangzhou Medical University, 511436 Guangzhou, Guangdong, China
3 The Nethersole School of Nursing, Faculty of Medicine, The Chinese University of Hong Kong, Hong Kong SAR, China
†These authors contributed equally.
Abstract
Depression affects 28.4% of middle-aged and older adults globally, exacerbating functional decline, mortality, and healthcare burdens. Physical activity mitigates depression through neurobiological and psychosocial pathways, although efficacy varies significantly by gender. Current evidence lacks clarity regarding optimal physical activity intensity and interventions. This study aimed to identify the physical activity patterns most strongly associated with depression and to derive potential intervention targets for middle-aged and older Chinese adults.
The data from 3739 participants in the 2020 China Health and Retirement Longitudinal Study were analyzed. Gaussian graphical models were adopted to recognize core and bridge symptoms within physical activity-depression networks across genders. Subsequently, computer-simulated interventions were conducted to determine the optimal targets for reducing depressive symptoms by gender.
Both male and female networks identified “depressed” as the central symptom. However, the bridge symptoms differed: males exhibited a bridge role for “days with moderate physical activity per week”, whereas females showed this for “duration of moderate physical activity per day”. Network comparison test revealed significant gender differences in edge weights (p = 0.007), with 14 edges being statistically significant. Simulation interventions consistently pinpointed “depressed” and “stuck” as effective targets for intervention across genders.
Moderate physical activity most strongly correlated with depression. For men, interventions might prioritize increasing the regularity per week with moderate physical activity to prevent depression, whereas for women, focusing on the duration per day of such activity could be a promising target.
Keywords
- depression
- exercise
- middle-aged
- elderly
Depression, a common problem among middle-aged and older adults worldwide [1], affects nearly 28.4% of middle-aged and older individuals globally [2], with higher disability-adjusted life-years (DALYs) in females than males [1]. Due to life and work stresses such as financial burdens, occupational competition, and family responsibilities, the 45–59 years old middle-aged group may face a higher risk of depression [3, 4]. And the older age group may be at significantly increased risk of depression due to comorbid physical illness such as diabetes, dementia, and stroke [5, 6, 7]. Depression raises the risk of functional deterioration and death among middle-aged and older adults themselves [8, 9]. And it also increases the care burden on caregivers [10] and the financial burden on the health care system [11].
Among the modifiable factors beneficial for depression, physical activity (PA) has emerged as a particularly promising intervention approach due to its dual neurobiological and psychosocial benefits. For instance, PA promotes neuroplasticity by upregulating brain-derived neurotrophic factor (BDNF) [12] and enhances social engagement through group-based exercises [13]. Critically, the engagement with and response to PA appear to differ by gender. Females may derive more emotional benefits from PA but face barriers like somatic fatigue [14], and often favor recreational activities like dance or yoga for relaxation and socialization [15, 16, 17]. In contrast, males are often more inclined toward competitive activities [18] and may experience more pronounced hormonal modulation post-exercise [19].
These observed differences in PA patterns and responses suggest that the pathways linking PA to depression may be fundamentally gendered. This divergence could be rooted in a combination of physiological mechanisms and psychosocial factors. At the physiological level, differences in stress responses mediated by sex hormones and variations in neuroplasticity may form a crucial foundation [20, 21]. At the psychosocial level, gendered preferences for activities and societal roles further shape specific behavioral patterns and emotional experiences [22, 23]. Consequently, it is crucial to develop gender-specific physical activity interventions.
However, while meta-analyses confirm the overall efficacy of PA in reducing depressive symptoms [24], a pivotal gap remains regarding the specific intensity (light vs moderate vs vigorous), frequency and duration of PA. Specifically, evidence suggests that moderate to vigorous PA may alleviate depression by mitigating systemic inflammation [25], whereas light PA might primarily improve mood [26]. This suggests that it remains controversial which PA intensity may be most strongly related to reduced depression. Additionally, although gender differences in depression are well established [27, 28, 29], it is unclear whether PA is correlated with depression differently across genders. Furthermore, physical activity in middle-aged and older Chinese adults has Chinese characteristics that distinguish them from other countries, such as people’s preference for square dancing and Tai Chi exercise [30, 31]. Yet little study has focused on this field. These research gaps hinder the development of targeted interventions considering both specific PA patterns and gender nuances.
Unlike traditional regression methods that synthesize PA and depression into an overall score, network analysis maps relationships at the symptom level, recognizing core and bridge symptoms [32, 33]. What’s more, this study also applied a computer-simulated intervention approach, which identifies optimal targets for reducing depression by predicting the cascading effects of interventions on symptom networks [34]. Together, these methods form a complementary analytical framework. Network analysis reveals the structural connections among symptoms, while simulation modeling assesses their potential outcomes to intervention. This combined approach links the identification of key targets with the evaluation of their possible effects within the symptom network. In line with this detailed analytical framework, we conceptualized distinct behavioral dimensions of physical activity as separate network nodes, including frequency (days per week), duration (time per day), and purpose. This enables an examination of how specific and modifiable behavioral components are conditionally interrelated with individual depressive symptoms and seeks to identify which behavioral dimensions, such as regularity compared to duration, exhibit the strongest conditional associations within the symptom network and to assess whether their connective roles vary by gender.
To bridge these gaps, the study employs a network analysis framework, complemented by computer-simulated interventions, to elucidate the intricate relationships between PA and depression at the symptom level. This approach allows us to discern how specific PA patterns influence individual depressive symptoms. Specifically, this study aims to: (1) construct networks linking PA and depression to identify the core and bridge nodes among male and female older adults; (2) compare the structural differences between female and male PA-depression networks; and (3) simulate and compare potential effects of intervening on different PA nodes within the estimated network models for each gender.
This cross-sectional analysis used wave 5 data (in 2020) from the China Health and Retirement Longitudinal Study (CHARLS, https://charls.pku.edu.cn/en/index.htm), a national longitudinal study examining health dynamics in Chinese middle-aged and older populations. CHARLS has completed five survey waves (2011, 2013, 2015, 2018, 2020) across 450 villages or neighborhoods in 28 provinces, with detailed methods published previously [35]. This research adheres to the STROBE guidelines. For STROBE checklist see Supplementary Material 1.
The CHARLS wave 5 survey included both family housing and nursing home populations aged 45 and older, initially consisting of 19,395 participants. After excluding individuals with incomplete or aberrant demographic or depressive data, as well as those lacking assessments across all three PA intensities, the final sample comprised 3739 participants (Fig. 1). The Monte Carlo method recommended 1390 sample size for the Gaussian Graphical Model with 19 nodes to achieve sensitivity of 0.6 and statistical power of 0.8 [36]. Hence, the final 1926 females and 1813 males met the sample size requirement.
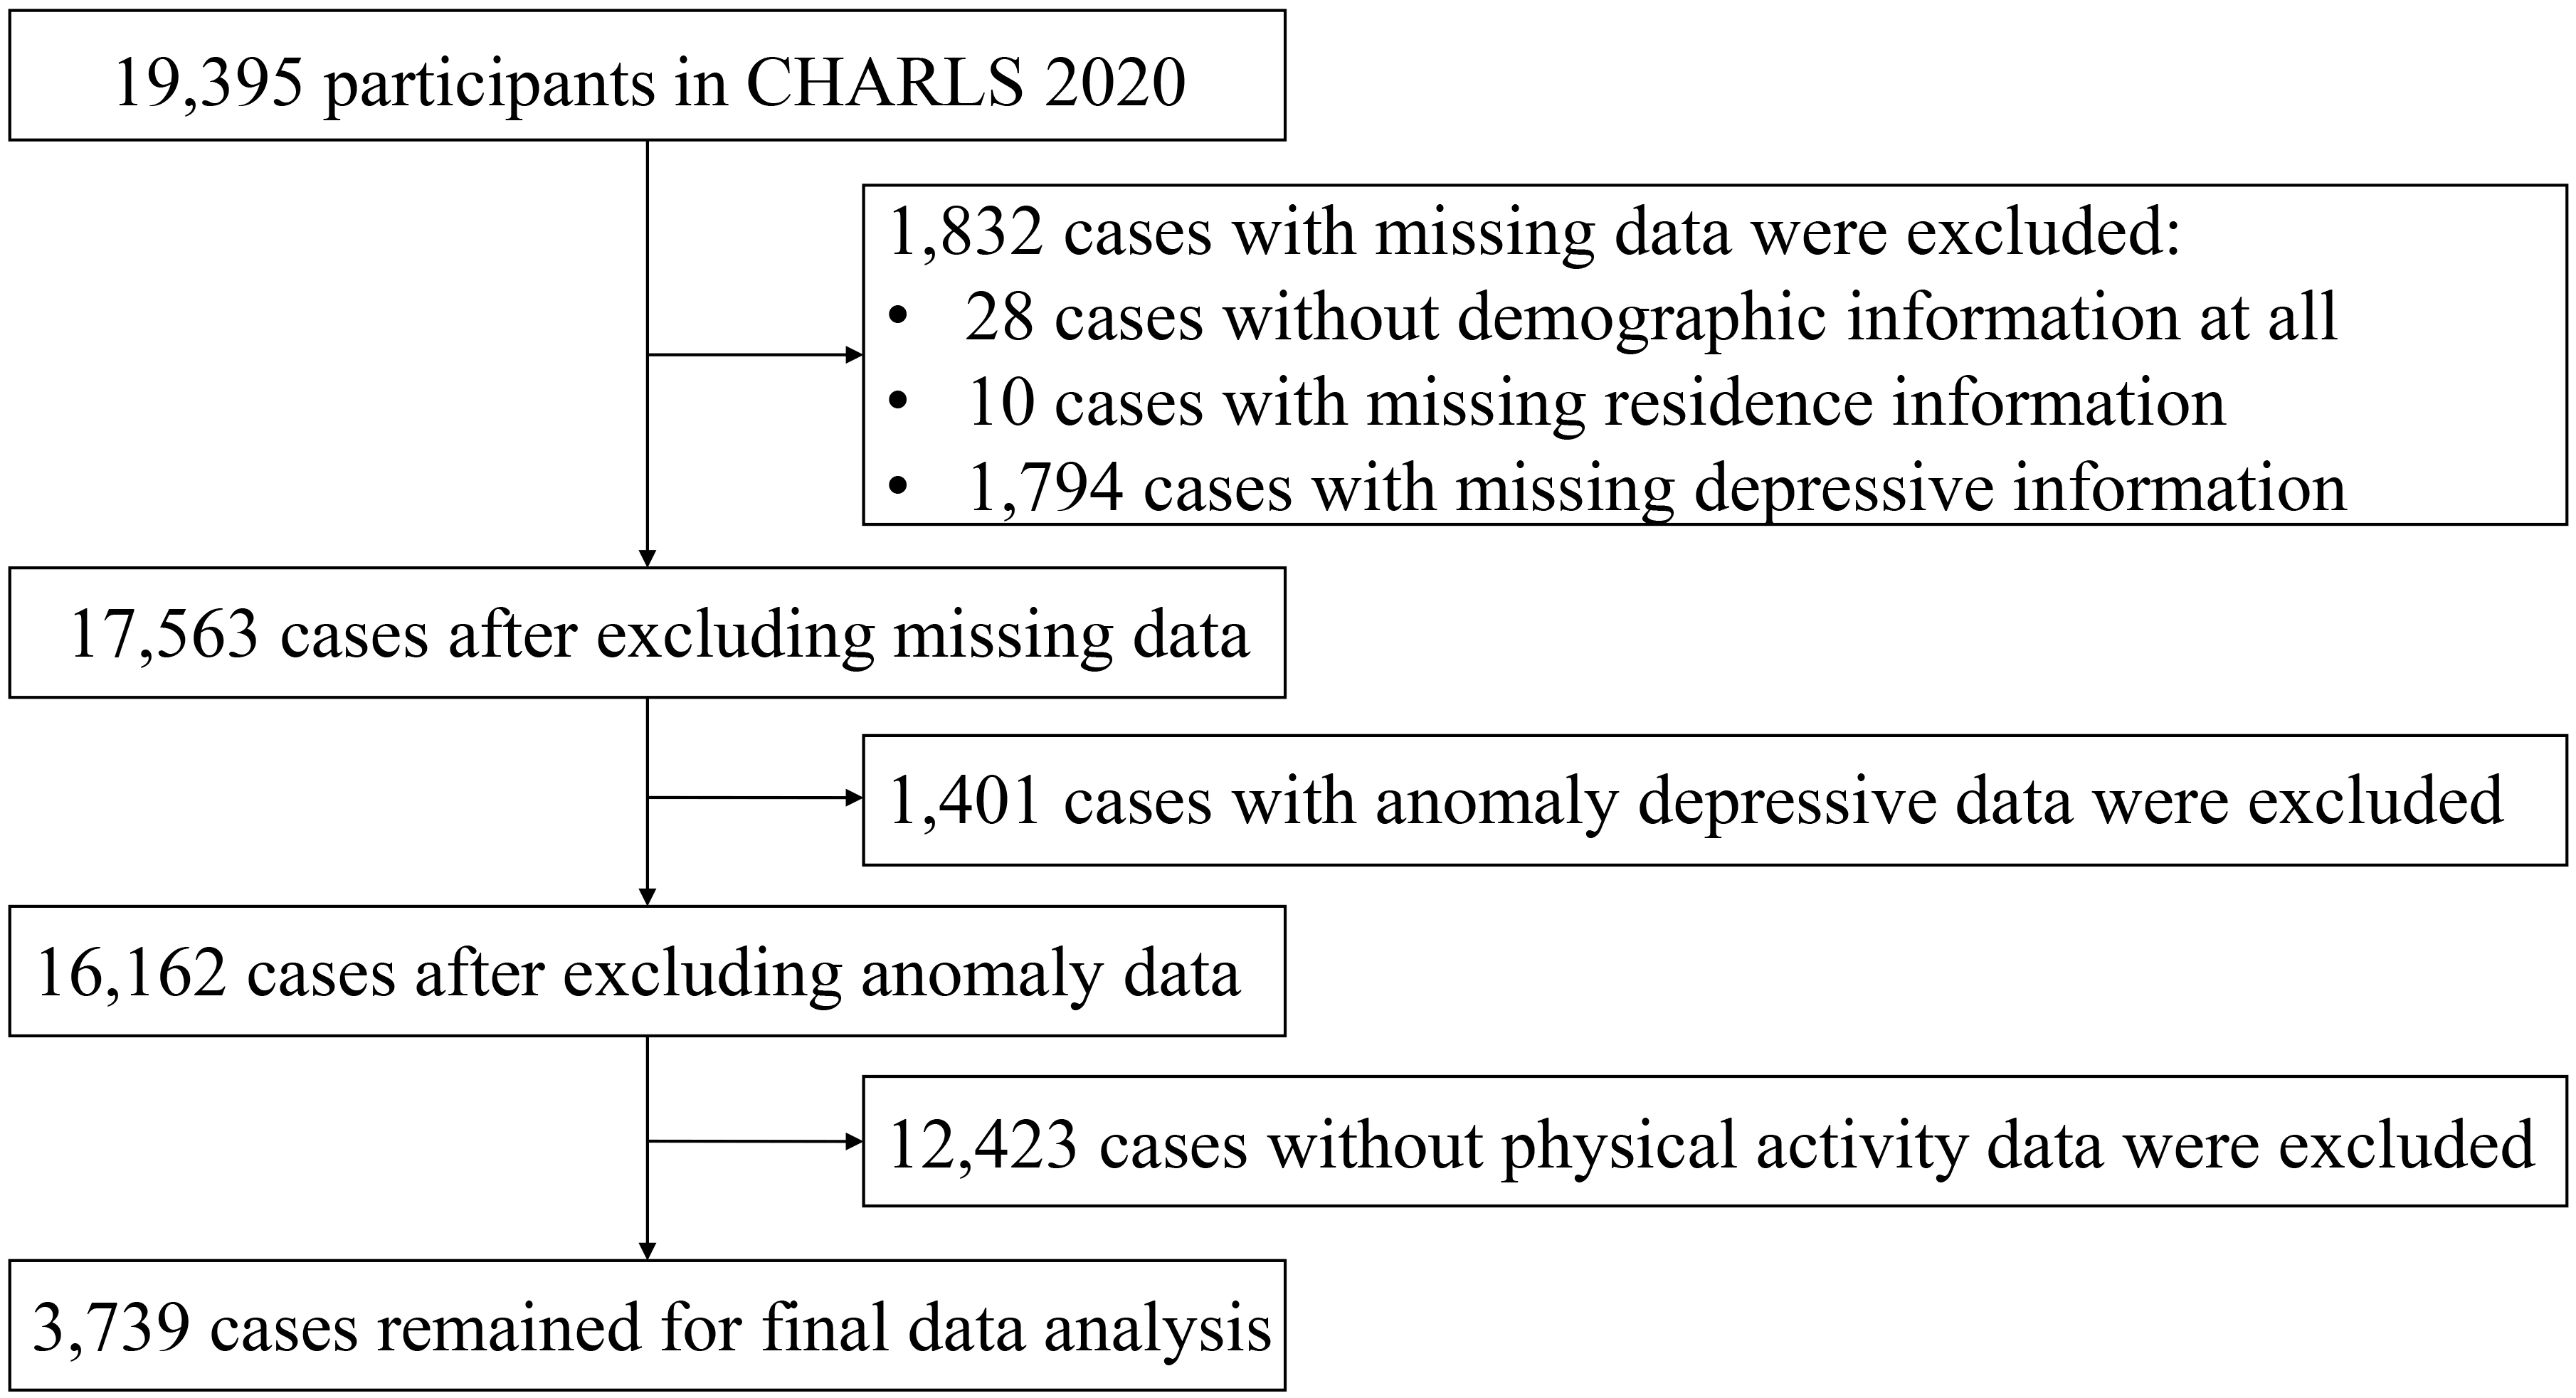 Fig. 1.
Data extraction flow chart.
Depression was estimated through the 10-item Center for Epidemiologic Studies Depression Scale (CESD-10) [37]. This scale assessed the frequency of depression symptoms (e.g., “Depression-item3 (D3): I felt depressed” or “Depression-item7 (D7): I didn’t sleep well”) over the past week using a 4-point Likert scale (0 = “rarely or not at all” to 3 = “most or all of the time”). The CESD-10 has exhibited good reliability and validity in Chinese older adults, with a Cronbach’s alpha of 0.79 [38]. Detailed information on each item is provided in Supplementary Material 2 Table 1.
PA was evaluated through the International Physical Activity Questionnaire Short
Form (IPAQ-SF) in this study [39], categorizing activity into three intensities.
Vigorous activity induces shortness of breath, such as lifting heavy objects or
aerobics; moderate activity slightly increases breathing, such as lifting light
objects or practicing Tai Chi; and light activity, such as leisure walking. Nine
items were collected, such as “Vigorous activity-item1 (V1): Days with vigorous
physical activity per week” (scored 1–7, representing 1–7 days), “Vigorous
activity-item2 (V2): Time with vigorous physical activity per day” (1 = “time
Graphical Gaussian Models were constructed for males and females separately since both PA and depression are continuous variables. The R package “qgraph” [40] was applied to visualize the networks and the Procrustes algorithm in “networktools” packages [41] was used to align the network layouts for more apparent edge comparisons. The nodes represented the items while the edges represented their connections. And the red edges represented negative connections while the green ones represented positive associations. Expected influence (EI) refers to the nature and magnitude of a node’s accumulative efficacy and the role it is likely to play in the network activation, persistence, and remission. Since EI is a better predictor of observed node influence compared to other centrality indices when the network involves positive and negative edges simultaneously [42], it was exerted to recognize core symptoms. Likewise, bridge expected influence (BEI), indicating a node’s sum connectivity with other communities, was adopted to determine bridge symptoms [33]. The 95% confidence intervals (CIs) of the edge weights and correlation stability coefficient (CS-C) were assessed to evaluate the accuracy and stability of the networks [43].
The Network comparison test (NCT) algorithm from the R package
“NetworkComparisonTest” [44] was employed to compare the male and female
networks from global differences and local differences. Global differences were
measured through examining the network structure invariance and global strength
while local differences were measured through examining the edge strength
invariance [45]. p-value
Item scores were dichotomized variables based on previous studies and World Health Organization (WHO) guidelines [46, 47]. Specifically, depression items were recoded so that scores 1–2 became 0 and 3–4 became 1, distinguishing mild symptoms and severe symptoms. For PA items, V1 was recoded with scores 1–3 as 0 and 4–7 as 1, while V2 and V3 were recoded with scores 1–2 as 0 and 3–4 as 1, distinguishing the lower and higher levels of involvement. The same recoding scheme was applied to the other two intensities of PA items.
Computer-simulated intervention used “nodeIdentifyR” algorithm (NIRA), which performs multiple simulations and implements the interventions through strategically modifying the threshold parameters of the Ising model network [34]. In NIRA, two kinds of interventions could be applied. Alleviating interventions lower the threshold of symptoms by subtracting a certain value from the original threshold parameter, while aggravating interventions do the opposite [34]. The threshold parameter indicating the tendency of each symptom manifestation is determined by the intercept of the logistic regression, and this parameter varies across different symptom networks [48, 49]. After the simulation, the absolute differences between the total score of the original network without intervention and the total score with intervention were calculated. The node with the highest absolute difference shows the greatest predictive efficacy on the network’s behavior [34].
The “bootnet” package [43] was employed to estimate the Ising model and the “nodeIdentifyR” package [34] was used to implement the simulating process. The outcomes for the simulation were depicted through the “dplyr” package (version 1.2.1, https://CRAN.R-project.org/package=dplyr). This approach allows for the identification of nodes whose simulated alteration is associated with the largest changes in the overall depression score within the network model.
The study involved 3739 middle-aged and older adults, most of whom were rural dwellers (76.6%), agricultural residency registration type (81.8%), and married (90.7%). The average age was 58.29 years old and 1813 (48.5%) were male and 1926 (51.5%) were female. Table 1 exhibits the detailed information on participants’ characteristics.
| Variables | Variable category | M |
| Age | — | 58.3 |
| Gender | Male | 1813 (48.5%) |
| Female | 1926 (51.5%) | |
| Residence | Central urban area | 513 (13.7%) |
| Rural-urban integrated area | 391 (10.5%) | |
| Rural area | 2835 (75.8%) | |
| Residency registration type | Agricultural type | 3077 (82.3%) |
| Non-Agricultural type | 662 (17.7%) | |
| Marriage | Married | 2985 (79.8%) |
| Divorced or others | 754 (20.2%) |
Fig. 2 depicts the network structure for PA-depression among the male and female middle-aged and older respectively. The male and female PA-depression networks shared the same core symptom, namely D3 “depressed” (unstandardized male EI = 0.542, unstandardized female EI = 0.429) (Fig. 3A), indicating that “depressed” had the greatest influence in the whole PA-depression networks. However, the bridge symptoms of PA-depression networks were different for different genders. Moderate activity-item1 (M1) “days with moderate physical activity per week” (unstandardized BEI-2step = 0.679) was identified as a bridge symptom in the male PA-depression network while Moderate activity-item2 (M2) “time with moderate physical activity each day” (unstandardized BEI-2step = 0.686) was identified as a bridge symptom in the female PA-depression network (Fig. 3B). Both male and female PA-depression networks had great stability and accuracy with high CS-C scores (both = 0.75 for strength and expected influence) and narrow edge bootstrap CIs. Detailed information was attached in the Supplementary Material 2 Figs. 1,2.
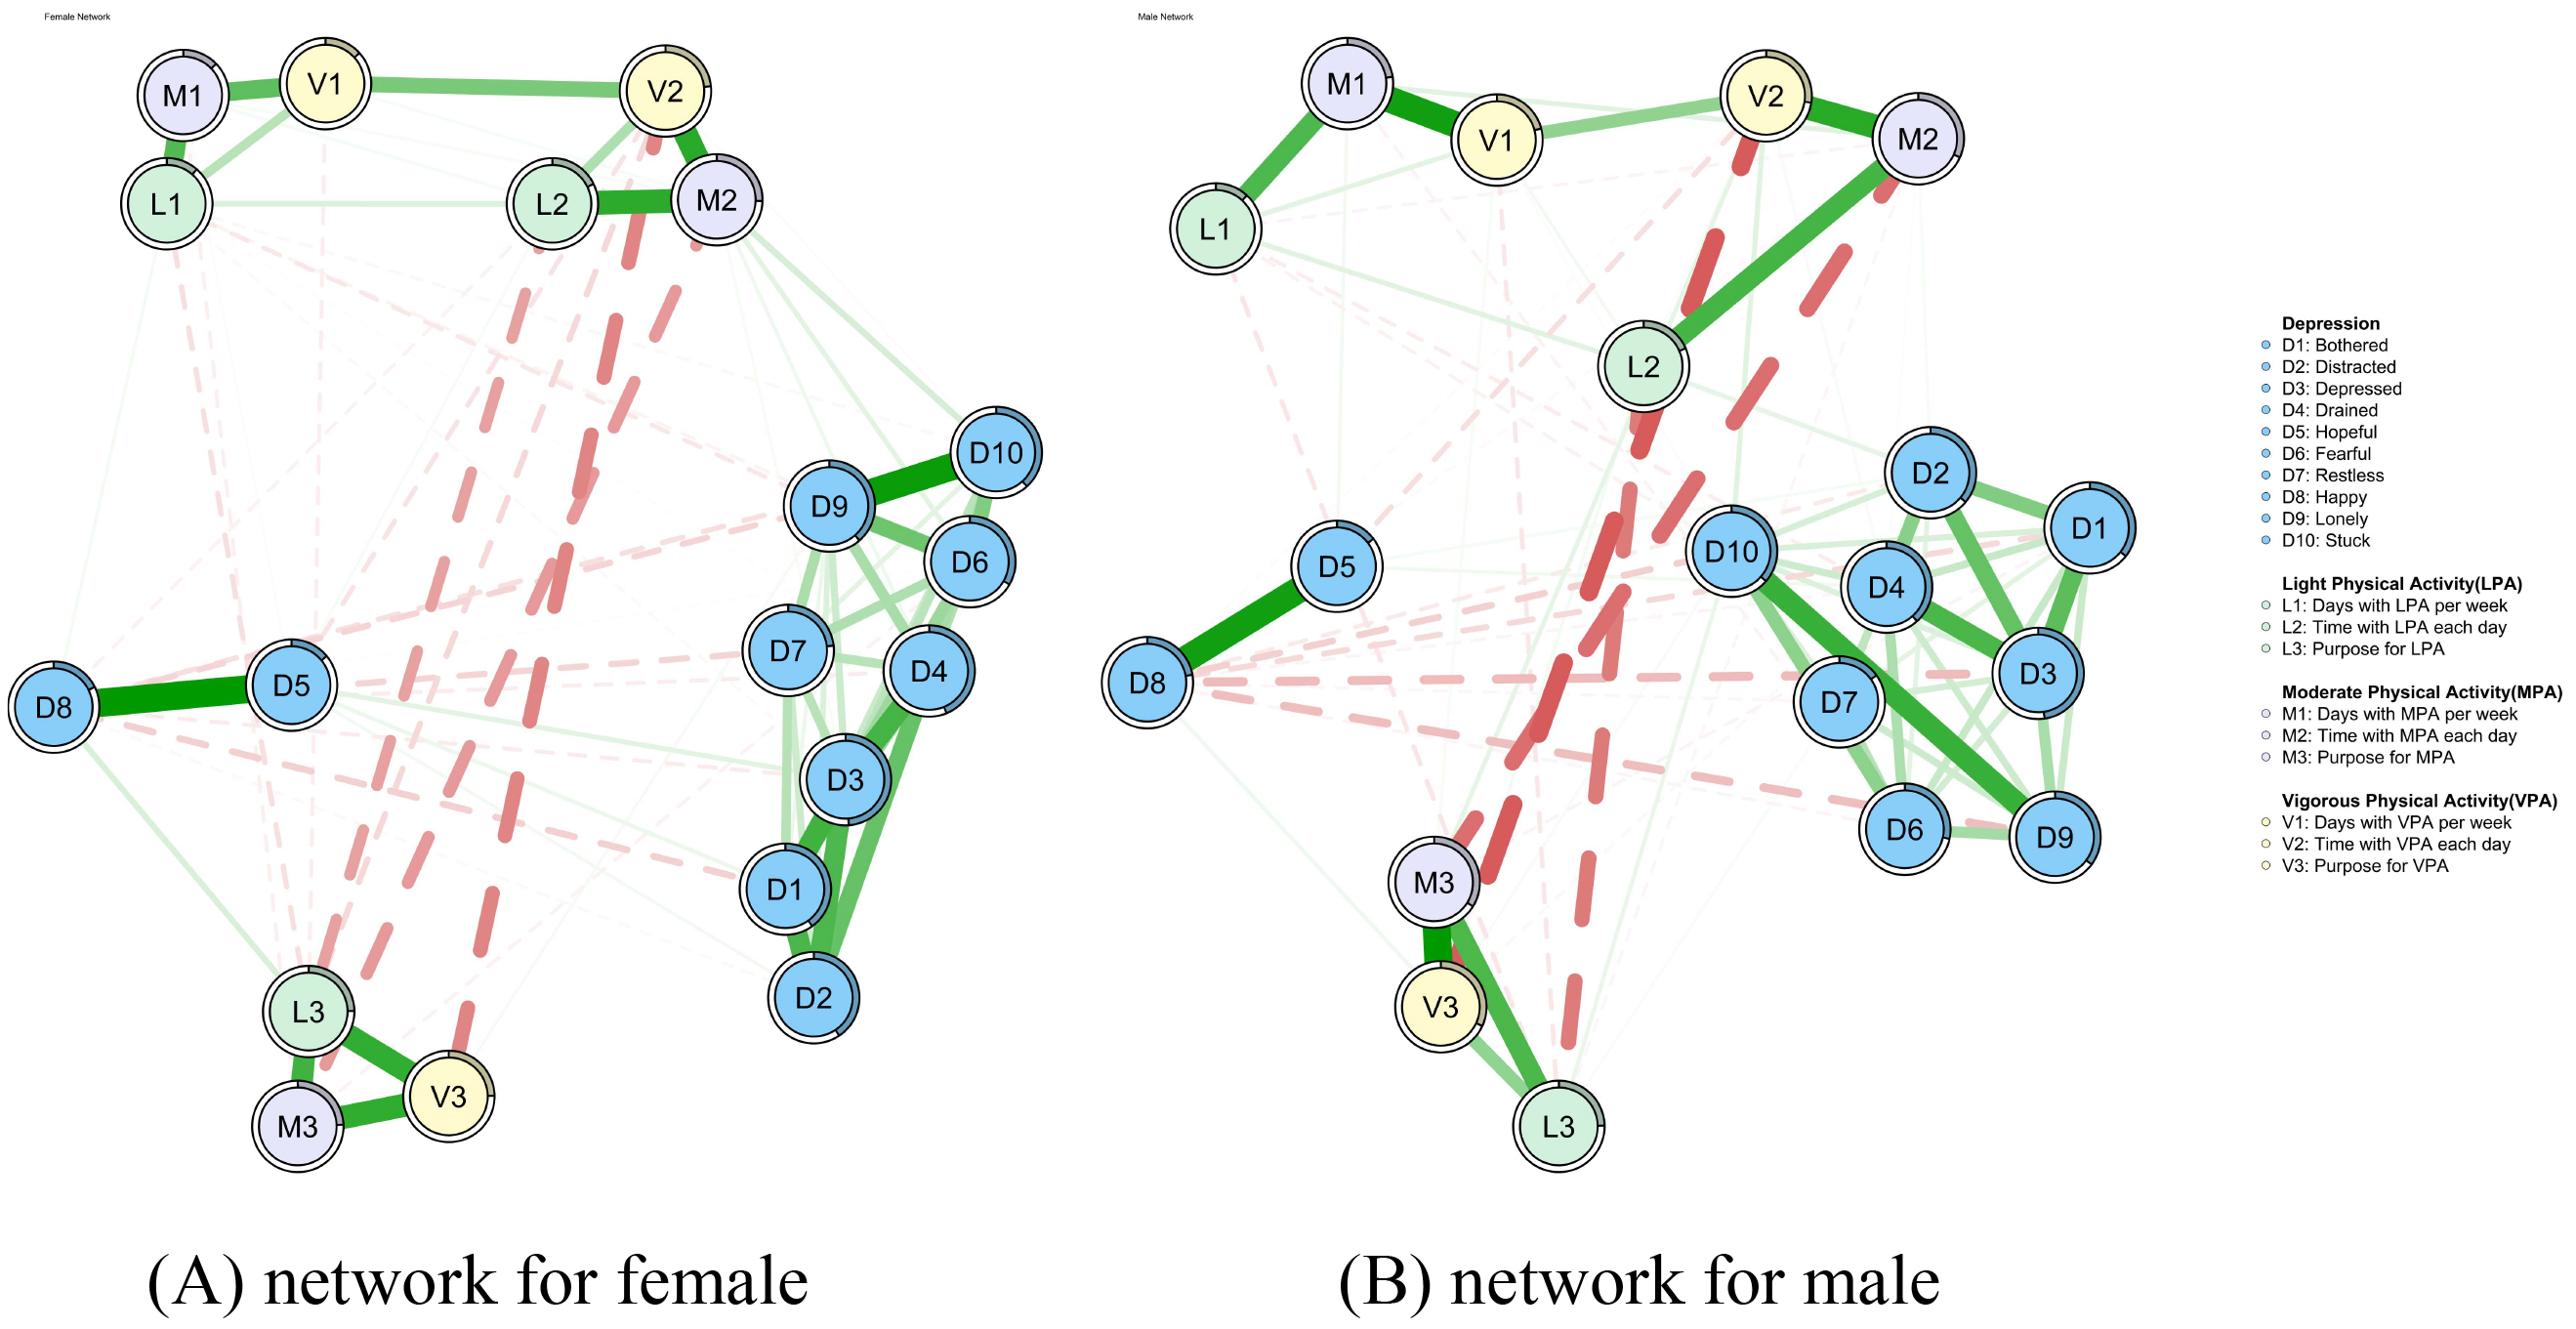 Fig. 2.
PA-depression networks for females and males. (A) PA-depression network for females. (B) PA-depression network for males. Thicker edges represent stronger associations. The rings around the node indicate the predictability of this node. PA, physical activity.
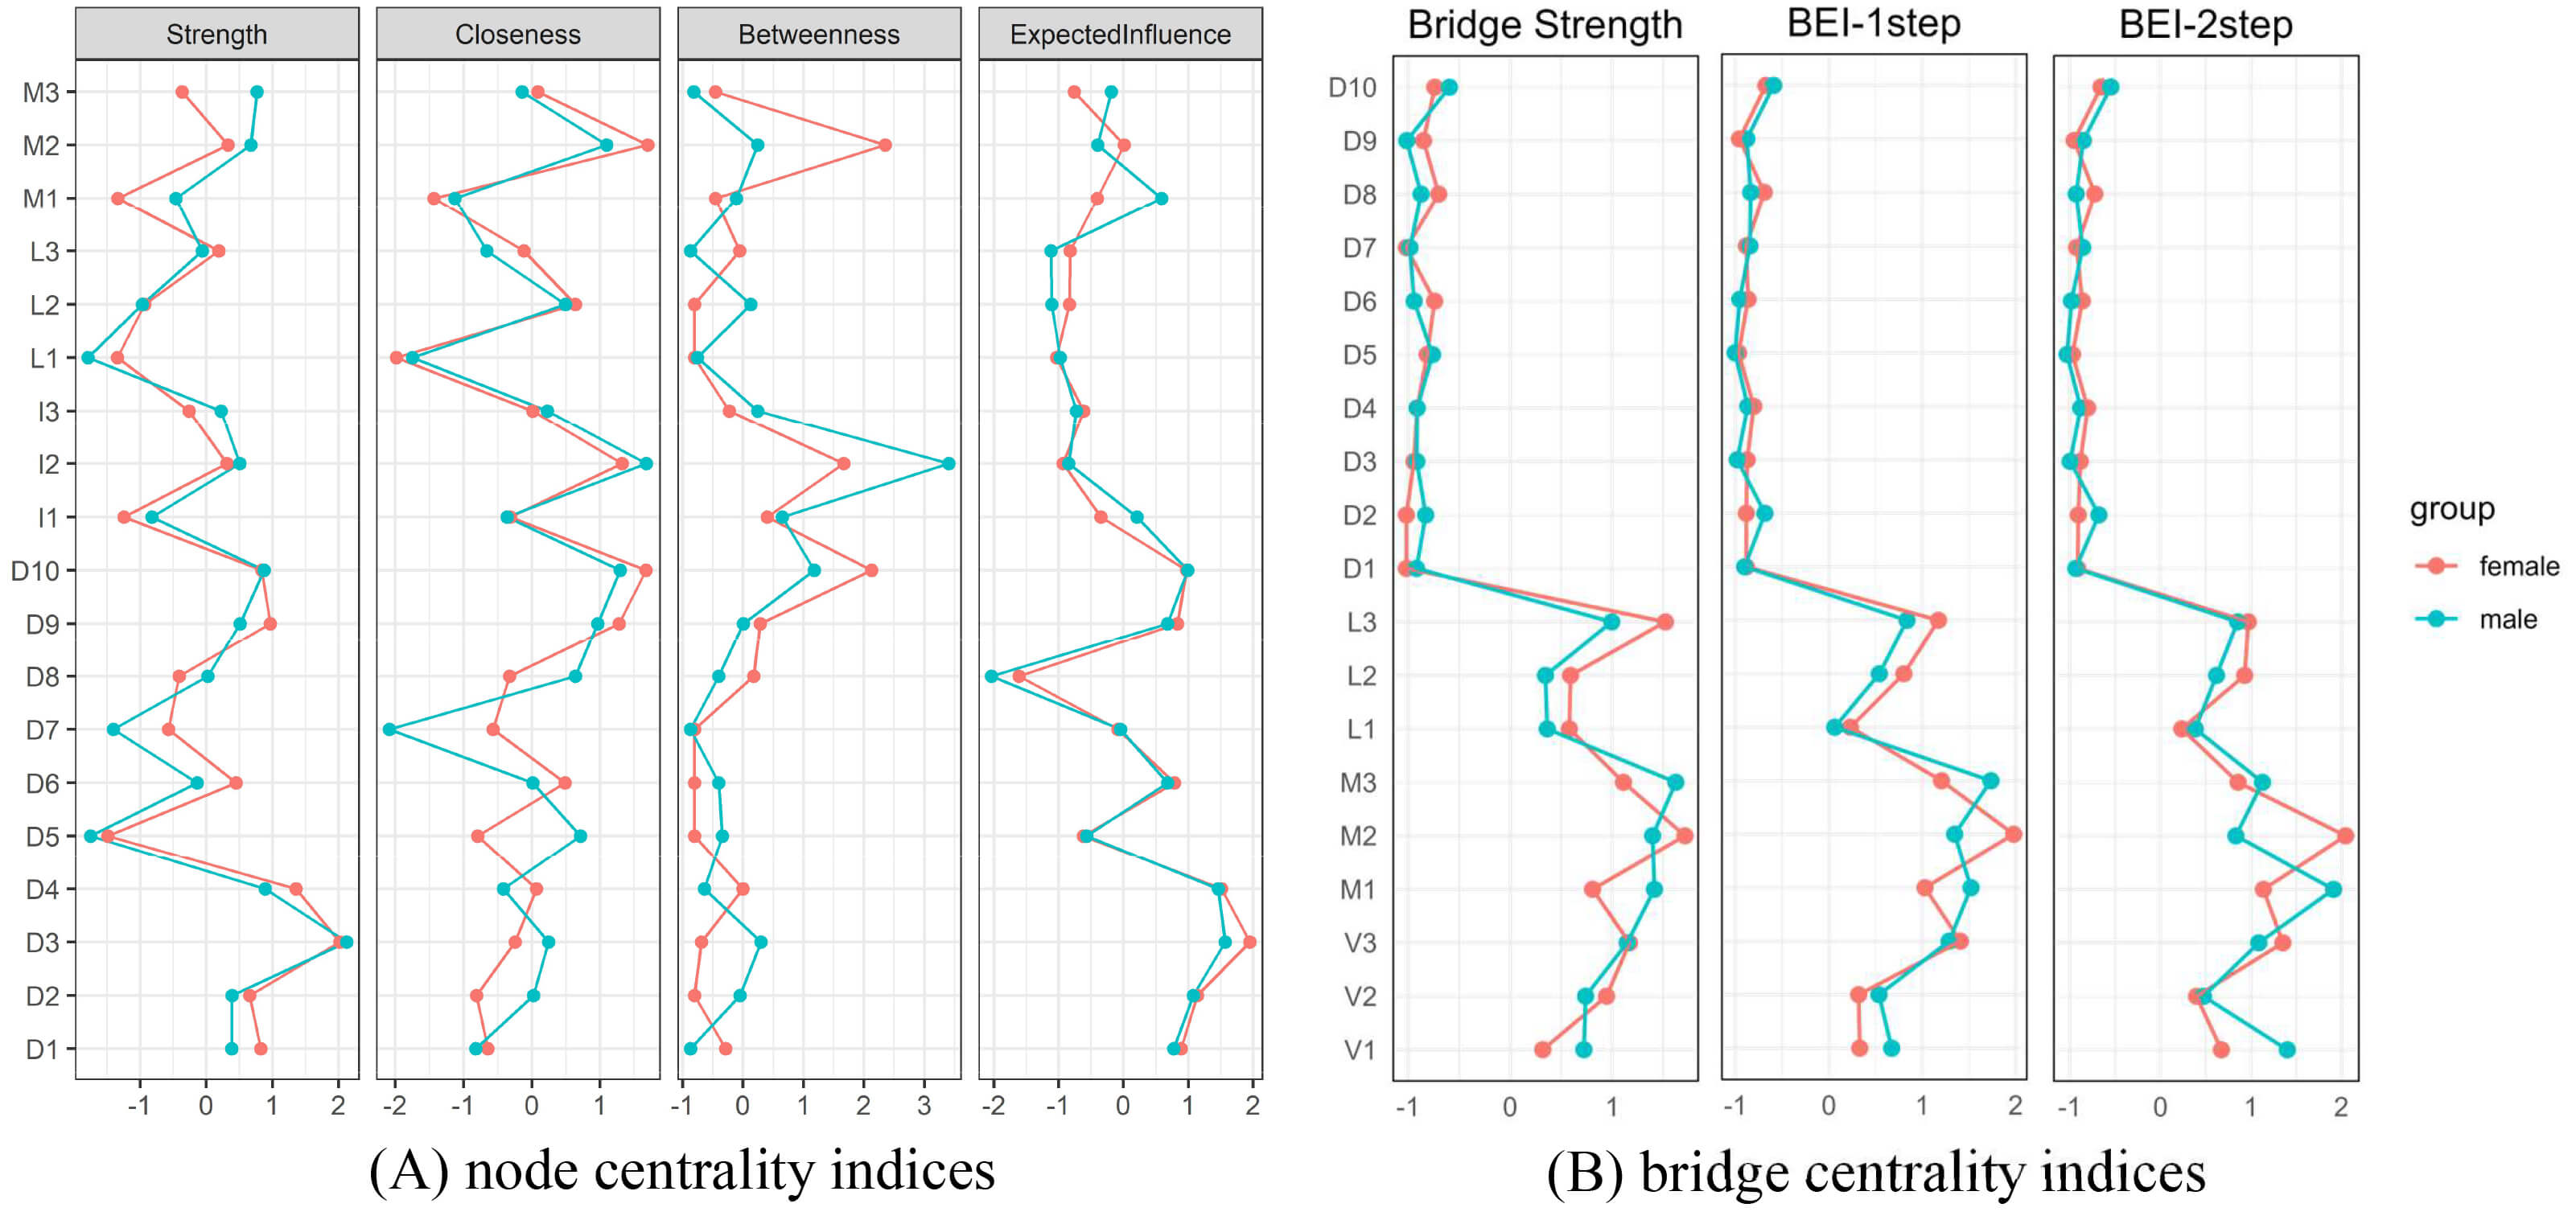 Fig. 3.
Node and bridge centrality indices for female and male PA-depression networks. (A) Node centrality indices for female and male PA-depression networks. (B) Bridge centrality indices for female and male PA-depression networks. The red lines represent female, while the blue lines represent male.
NCT revealed no significant difference in global strength between the male (6.319) and female (6.523) networks (difference = 0.204, p = 0.507). In contrast, the overall distribution of edge strengths differed significantly (M = 0.129, p = 0.007). More information is exhibited in Supplementary Fig. 3. Subsequent analyses identified 14 edges with significant differences, including four that linked the PA and depression communities. Notably, the connections between M2–D6, M3–D6, and M2–D10 were stronger in the female network, whereas the edge between M3–D1 was more pronounced in the male network, with larger absolute edge weights indicating stronger correlations (see Supplementary Material 2 Table 3).
Fig. 4 illustrates the outcomes of computer-simulated interventions applied to both networks using a common target. Node D3 (depressed), which emerged as the most central symptom, demonstrated an alleviating effect; its associated sum score decreased from 10.46 to 8.88 in females and from 9.15 to 8.05 in males (Fig. 4A). Conversely, node D10 (stuck) exhibited an aggravating effect, with sum scores increasing from 10.41 to 12.05 in females and from 9.24 to 11.16 in males (Fig. 4B).
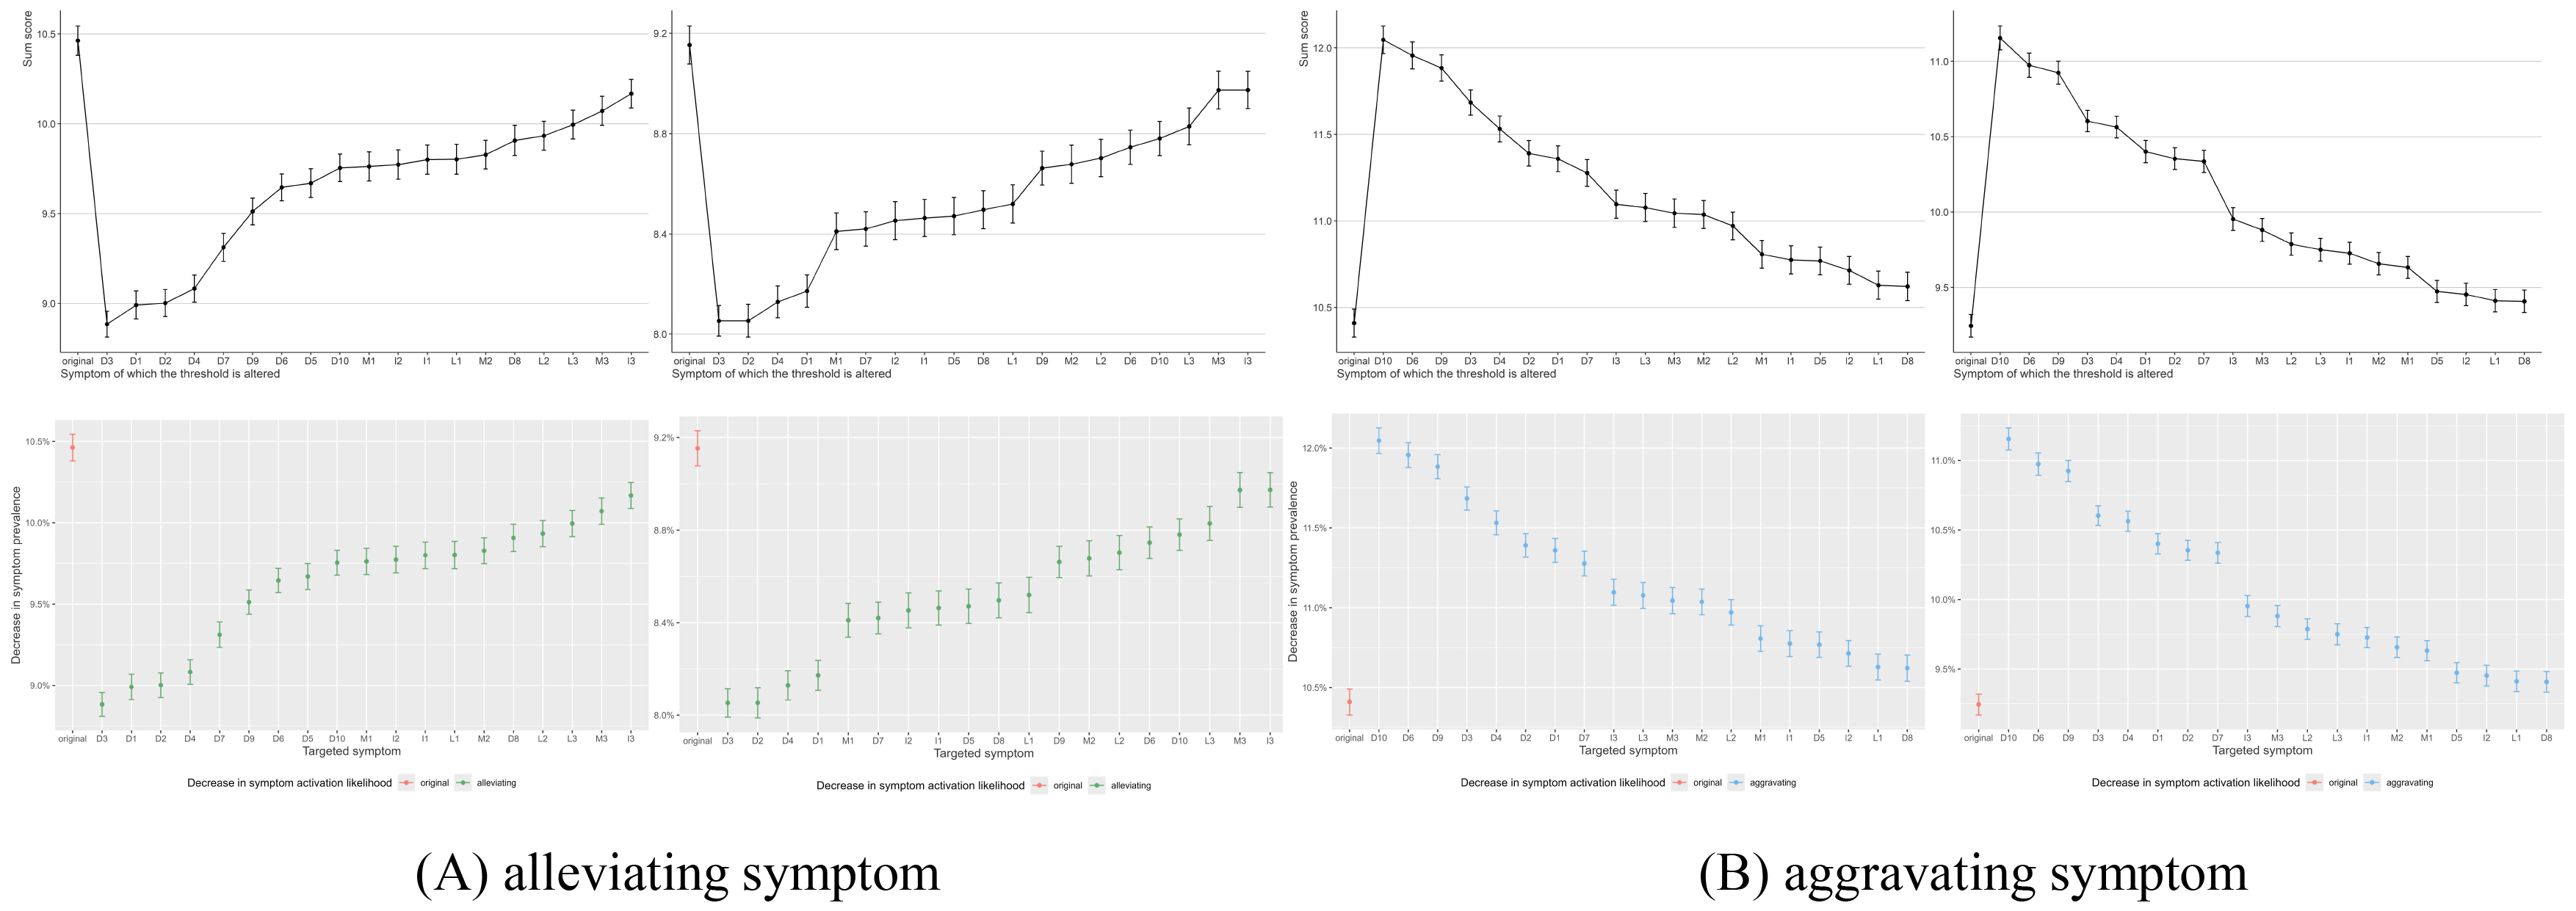 Fig. 4.
Alleviating and aggravating symptoms for females (left) and males (right). (A) Alleviating symptoms for females (left) and males (right). (B) Aggravating symptoms for females (left) and males (right).
To the best of our knowledge, this study is the first attempt to investigate the interrelationship between PA and depression among middle-aged and older adults and further discover the gender differences across these two networks. In conclusion, this study found that moderate PA has the strongest associations with depression among middle-aged and older adults compared to the other two intensities of PA. Specifically, days with moderate PA per week (M1) may matter most for males while it is the time with moderate PA per day (M2) that possibly influences depression most for the female population. Our study contributed to tailored PA interventions in depression among middle-aged and older adults.
Network analysis illustrated that the core symptom of the PA-depression networks for both males and females was D3 (depressed), which was congruent with the previous findings in middle-aged and older populations with disablement [50] and diabetes [51] in China. Such high consistency reflected the commonality of depressive symptoms in middle-aged and older adults, suggesting that this core symptom was prevalent in this population. Although the bridge symptoms for the male (M1) and female (M2) PA-depression networks were different, they all belonged to moderate physical activity, suggesting that moderate physical activity correlated with depression most among the three intensities of physical activity. This finding partially coincided with a previous meta-analysis study that revealed moderate to vigorous physical activity was related most to decreasing depression [52]. Furthermore, the inconsistency of the two bridge symptoms indicated that the mechanisms through which PA relieves depression may differ across genders. The frequency of moderate physical activity was most associated with depression among middle-aged and older male adults. A previous investigation by Wang et al. [53] discovered that spending 6–7 days per week on moderate physical activity was associated with a 1.45 times greater likelihood of depression in middle-aged and older male adults. In contrast, for females, it was the duration of moderate physical activity that was most associated with depression. Just as a 10-year prospective follow-up study of middle-aged and older female adults [54] figured that 10–29 minutes of physical activity per day may prevent the onset of depression in middle-aged and older women. It suggests that the behavioral dimensions of moderated physical activity that are most closely linked to depressive symptoms may differ by gender. The results point to the potential value of designing gender-differentiated physical activity programs. Future interventions for men might test the benefit of emphasizing regularity of moderate physical activity, while those for women could explore the impact of emphasizing continuity [55, 56].
Network comparisons test revealed no significant differences in global strengths, showing that the overall network structures were similar, which was consistent with the identification in the previous step that the two networks had the same core symptoms. However, the two networks differed significantly in terms of the edge strength and four of the differing edges were from the edges bridging PA and depression, which coincided with differences in the bridge symptoms between the two networks. Together, this implies that the mechanism to reduce depression through PA may be different for middle-aged and older adults of different genders. Two of the four bridging edges were related to M2 and their edge strength were stronger in the female network than in the male network. It further confirmed the role of M2 as a bridge for communicating PA and depression in the female network.
The results of the computer-simulated intervention revealed the same intervention target for both male and female networks, with D3 being the alleviating symptom. This was in accordance with the core symptoms recognized at the first step, reinforcing D3 as an intervention target for alleviating depression. Besides, it was also noteworthy that the bridge symptoms identified in the first step were not recognized as an intervention target in the computer intervention. This may be due to the following reasons: the results of the computer-simulated interventions and the centrality analysis may not always coincide [34] and the binary data may conceal information about the nodes in the networks. Also, this point reveals that directly strengthening a physical activity node generated a less extensive cascading effect on the overall depressive symptom network, compared to the hypothetical intervention targeting the central affective core symptom (D3). This nuance underscores that regular physical activity may function not as a direct therapeutic equivalent to core affective symptoms, but instead as a broad-spectrum preventive or modulating factor that can influence the network’s overall depression. However, synthesizing the results of the network comparison, M1 and M2 were indeed the key links connecting PA and depression in the male and female networks respectively. Hence M1 and M2 were considered as key PA interventions to reduce depression, which indicated that regularity of PA should be highlighted in male middle-aged and older adults while it is the continuity that matters most for females in healthcare practice.
This article had several limitations. First, the cross-sectional design in this paper could not lead to conclusions of causality. Future studies should consider a longitudinal design. Second, the variable indicators were assessed through a self-scoring questionnaire, and a more objective assessment method is needed in the future. Third, although the study identified connectivity edges that differed across networks, some edges with small weights may have created bias. Fourth, the network analysis in this study did not adjust for potential confounding variables, like socioeconomic status and comorbid health conditions. Consequently, the observed patterns of association among variables may be influenced by these unmeasured factors, and the results should be interpreted with caution. Future research may consider further testing these preliminary findings through longitudinal designs, network models that adjust for confounders, or experimental interventions. Fifth, the network models treated sub-items of the IPAQ-SF as separate nodes. While this allows for a detailed, exploratory analysis of how specific behavioral dimensions relate to depressive symptoms, it also means that the identified bridge symptoms are tied to this particular questionnaire structure and our analytic framework. The findings should be interpreted as generating hypotheses about potential behavioral targets. Future studies are needed to test the results when physical activity is measured using alternative methods or modeled with different conceptualizations. Lastly, the research data originates solely from a specific cohort within a single country. While this provides valuable insights into the association between physical activity and depression among middle-aged and older adults in China, the generalizability of these findings warrants caution. The physical activities examined in this study are rooted in specific cultural contexts, such as square dancing and Tai Chi. Consequently, the identified network association patterns and gender differences require further examination and validation across multiple countries and regions with diverse cultural backgrounds.
In general, this study innovatively explored the differences between male and female PA-depression symptoms using network analysis and also figured out the most promising PA intervention for alleviating depression. The moderate PA has the strongest association with depression. The findings suggest that the regularity per week of moderate PA has a particularly significant connection to depressive symptoms in men, whereas the duration per day shows a stronger association with depression in women. These associations highlight potential targets for future research into gender-tailored PA interventions. In practice, these insights could guide the design of future intervention trials, especially for Chinese middle-aged and older adults. Clinicians may consider these PA patterns when discussing lifestyle modifications, and policymakers might find it valuable to consider gender differences when developing public health strategies under the Chinese characteristic context.
PA, physical activity; CHARLS, China Health and Retirement Longitudinal Study; STROBE, Strengthening the reporting of observational studies in epidemiology; CESD-10, 10-item Center for Epidemiologic Studies Depression Scale; D1, Bothered, Depression-item1, “I was bothered by things that usually don’t bother me.”; D3, Depressed, Depression-item3, “I felt depressed.”; D6, Fearful, Depression-item6, “I felt fearful.”; D7, Restless, Depression-item7, “I didn’t sleep well.”; D10, Stuck, Depression-item10, “I could not ‘get on’.”; IPAQ-SF, International Physical Activity Questionnaire Short Form; V1, Vigorous activity-item1, “Days with vigorous physical activity per week.”; V2, Vigorous activity-item2, “Time with vigorous physical activity per day.”; V3, Vigorous activity-item3, “Purpose for vigorous physical activity.”; M1, Moderate activity-item1, “Days with moderate physical activity per week.”; M2, Moderate activity-item2, “Time with moderate physical activity each day.”; M3, Moderate activity-item3, “Purpose for moderate physical activity.”; EI, excepted influence; BEI, bridge excepted influence; CIs, confidence intervals; CS-C, correlation stability coefficient; NCT, Network comparison test; NIRA, nodeIdentifyR algorithm.
The data presented in this study are available on request from the corresponding author.
YX: data curation, writing – original draft. YD: conception, study design. MY: data curation, investigation. QZ: data curation, investigation. SL: data curation, investigation. JL, ZY: study design, review the manuscript. All authors contributed to editorial changes in the manuscript. All authors read and approved the final manuscript. All authors have participated sufficiently in the work and agreed to be accountable for all aspects of the work.
This study used open-access data from the CHARLS. We did not conduct any participant recruitment or data collection. Ethical approval for the CHARLS study was obtained from the Institutional Review Board of Peking University (IRB00001052-11015). The study was conducted in accordance with the Declaration of Helsinki. All participants voluntarily enrolled in the program and signed written informed consent.
The authors appreciate the contributions of the CHARLS study team and all interviewees.
This research received no external funding.
The authors declare no conflict of interest.
Supplementary material associated with this article can be found, in the online version, at https://doi.org/10.31083/JIN47468.
References
Publisher’s Note: IMR Press stays neutral with regard to jurisdictional claims in published maps and institutional affiliations.