


 , Shengtao Huang 1,†, Zheng Li 2, Xiaowen Cai 3, Xiaoke Qiu 1, Zhangjin Zhang 4, Yong Huang 1,5,*
1 School of Traditional Chinese Medicine, Southern Medical University, 510515 Guangzhou, Guangdong, China
2 Clinical Medical College of Acupuncture Moxibustion and Rehabilitation, Guangzhou University of Chinese Medicine, 510006 Guangzhou, Guangdong, China
3 Department of Rehabilitation Medicine, The Tenth Affiliated Hospital, Southern Medical University (Dongguan People’s Hospital), 523109 Dongguan, Guangdong, China
4 School of Chinese Medicine, The University of Hong Kong, Hong Kong, China
5 Department of Acupuncture, Nanfang Hospital, Southern Medical University, 510515 Guangzhou, Guangdong, China
†These authors contributed equally.
Abstract
Evidence from both clinical trials and animal studies indicates that electroacupuncture (EA) combined with antidepressants is more effective and has fewer side effects in the treatment of depression. In this study we investigated the impact of EA combined with paroxetine on improving synaptic ultrastructure and regulating α-amino-3-hydroxy-5-methyl-4-isoxazolepropionic acid receptors (AMPARs) in the treatment of depression.
The study employed a Chronic Unpredictable Mild Stress (CUMS) depression rat model, incorporating interventions such as paroxetine, electroacupuncture (EA), and their combination, along with a normal control group. Behavioral indicators (weighing, the sucrose preference test, and the open field test) assessed modeling and intervention effects. Nissl staining examined hippocampal neuron number and structure changes. Transmission electron microscopy observed alterations in postsynaptic membrane density and dentate gyrus (DG) neuron mitochondria. Western blotting detected AMPAR levels and changes in sirtuin 2 (SIRT2) pathway-related proteins in the DG. The nicotinamide adenine dinucleotide/reduced nicotinamide adenine dinucleotide (NAD+/NADH) ratio measured mitochondrial function changes. Immunofluorescence validated SIRT2 and AMPAR co-expression for confirmation.
Both EA and EA combined with paroxetine notably alleviated depression-like behaviors, particularly anhedonia-like response, in CUMS-induced rats, with the hippocampal DG identified as a focal area. Transmission electron microscopy revealed increased hippocampal DG synapses and enhanced ultrastructure with the combined treatment. Western blotting and immunofluorescence demonstrated improved mitochondrial function and upregulated glutamate ionotropic receptor AMPA type subunit 1 (GluA1) levels through the activated SIRT2 pathway.
The results suggest that the therapeutic mechanism of EA combined with paroxetine is related to the regulation of the SIRT2/AMPAR pathway in the hippocampal DG of CUMS-induced depressive rats, which subsequently affects synaptic ultrastructure.
Keywords
- depression
- electroacupuncture
- synaptic ultrastructure
- sirtuin 2
- AMPA receptor
The burden of disease caused by depression is increasing, and the World Health Organization predicts that depression will become the second leading cause of disease burden by 2030 [1]. The pathogenesis of depression is complex and has not been fully elucidated. A study found that people with depression showed shrinkage in certain brain regions, particularly the hippocampus and prefrontal lobes [2], an observation replicated in animal models of depression [3, 4], indicating that the pathogenesis of depression is closely related to the hippocampus and prefrontal lobes. Hippocampus includes CA1, CA2, CA3, CA4, and dentate gyrus (DG) regions. The subgranular layer of the DG is rich in neural stem cells and exhibits ongoing neurogenesis, reflecting high neuroplasticity [5]. Changes in synaptic efficacy lie at the heart of brain function and constitute a principal molecular mechanism of signal transduction underlying nervous system disorders [6]. Given the critical role of the hippocampus in mood regulation, impaired synaptic function and structure in the hippocampal DG is considered a key pathological feature underlying depression [7, 8].
The evidence-based medical studies show that the clinical efficacy of electroacupuncture (EA) in the treatment of mild and moderate depression is comparable to that of antidepressants, with fewer adverse reactions and high safety [9, 10]. Conventional antidepressant medications, particularly commonly used drugs such as Selective Serotonin Reuptake Inhibitors (SSRIs), are often accompanied by a range of side effects, including nausea, weight gain, sexual dysfunction, insomnia, and drowsiness [11, 12]. These adverse effects frequently lead to reduced patient compliance, thereby compromising treatment outcomes. In contrast, EA, as a non-pharmacological therapy, demonstrates distinct advantages in the aspects mentioned above. Numerous studies have found that, compared with antidepressants alone, combining EA with antidepressants can accelerate the therapeutic effect and rapidly relieve symptoms [13, 14]. Our previous clinical trials also found that EA at Yintang (GV29) and Baihui (GV20) can shorten the onset time of paroxetine, one of the SSRIs, improve its clinical efficacy, and reduce side effects [15, 16]. The clinical efficacy of EA combined with paroxetine is superior to that of paroxetine alone and reduces its onset time [17]. Importantly, underlying these rapid clinical effects is the modulation at the synaptic level. Previous animal experiments were consistent with clinical trials, and showed that EA promoted rapid antidepressant action by modifying synaptic efficacy and architecture in the hippocampus [18]. Furthermore, synaptic structure changes are closely related to the molecular composition of the postsynaptic density, particularly the abundance of glutamate receptors such as AMPARs [19, 20, 21].
The process of AMPAR transfer and enrichment in the postsynaptic membrane must be anchored to the local cytoskeleton or synaptic structural proteins to maintain receptor enrichment in local synapses. The high electron density of the postsynaptic membrane can be observed under the electron microscope, which is called the postsynaptic compact region [19]. Postsynaptic densification protein 95 (PSD-95) is one of the main proteins in the postsynaptic densification region, and is also the main skeleton protein for the maintenance of synaptic puffiness [22]. The direct interaction of PSD-95 with glutamate receptors represents a fundamental regulatory mechanism of synaptic structure [23]. PSD-95 belongs to a family of synaptic skeleton proteins containing the PSD-95/Discs-large/ZO-1 (PDZ) domain (80–90 amino acids) [24]. While such proteins, typically PSD-95, act as skeleton proteins within the synapse, the PDZ domain binds to the C-terminus of many ion channels, including N-methyl-d-aspartate receptor (NMDAR) and AMPAR, participates in their interactions, and anchors receptor proteins within the synapse [25]. Notably, synaptic anchoring of AMPAR is more important than that of NMDAR for regulating synaptic strength and functional adaptation [26, 27]. Crucially, AMPAR trafficking and anchoring, regulated by proteins like PSD-95, are processes disrupted in depression and targeted by antidepressant treatments [28]. Studies have shown that increased PSD-95 can promote synaptic formation and increase AMPAR levels on synapses [29]. In neurodegenerative diseases, the anchoring and transfer of AMPARs in the postsynaptic membrane are closely related to mitochondria [30].
Mitochondrial energy metabolism and cellular respiratory dysfunction are one of
the internal structural changes of metabolic disorders. Studies indicate that
mitochondrial pathology also exists in neurons during depression and affects
disease progression by impairing the structural and functional integrity of
synapses [31]. The adenosine monophosphate-activated protein kinase (AMPK)
pathway, a crucial regulator of energy metabolism and mitochondrial function,
serves as a key nexus between energy sensing and the pathways governing synaptic
remodeling. Its downstream confluence with mTORC1 signal regulates synaptic
protein synthesis and influences the formation and maintenance of synapses [32].
Peroxisome proliferator-activated receptor gamma coactivator 1-alpha
(PGC-1
The enzyme activity of SIRTs depends on the participation of intracellular
nicotinamide adenine dinucleotide (NAD+) [37]. NAD is an electron carrier in
the process of oxidative phosphorylation, also known as coenzyme Ⅰ. NAD+ is
the oxidation state involved in the process of oxidative phosphorylation, while
reduced nicotinamide adenine dinucleotide (NADH) is the reduced state in this
process [38]. The conversion of oxidation/reduction states is catalyzed by the
NADH dehydrogenase complex (Complex I) located in the inner mitochondrial
membrane, that is, the NADH dehydrogenase complex catalyzes
NADH
Therefore, we hypothesized that chronic unpredictable mild stress (CUMS)-induced
depression-like rats are related to AMPAR in the postsynaptic membrane of
hippocampal DG. The antidepressant effect of EA combined with paroxetine is
related to the regulation of AMPAR, and its mechanism is related to synaptic
function and structure in the hippocampal DG region. Specifically, we propose
that the combined treatment may exert its effects by modulating the
AMPK/PGC-1
A total of 80 adult male Specific Pathogen Free (SPF) Sprague Dawley (SD) rats
(weighing 200
According to the random number table method, 80 adult male SPF SD rats were randomly divided into two groups: normal control group (NC, N = 13) and modeling group (N = 67).
The CUMS procedure was applied for 28 days [41]. The rats were randomly given 6 different stress stimuli for 28 days, including water deprivation for 24 hours, food deprivation for 24 hours, wet bedding for 24 hours, immobilization for 2 hours, level shaking for 5 minutes, and tail clamping for 3 minutes. Schedule the above 6 types of stimulation for 28 days and give one type of stimulation every day (Table 1). During the 28-day CUMS modeling period, the rats in the normal control group were kept in a different room from those in the modeling group, and were fed and drank water freely without any treatment.
| Stressors | Duration |
| Water deprivation | 24 h |
| Food deprivation | 24 h |
| Wet bedding | 24 h |
| Immobilization | 2 h |
| Level shaking | 5 min |
| Tail clamping | 3 min |
After 28 days of modeling, the degree of depression was evaluated according to the behavioral index of sugar water preference rate. The sucrose preference test (SPT) was conducted at the end of the 28-day CUMS period (Day 28), before any treatment allocation. If the sugar water preference rate of rats was lower than 70%, the modeling was considered successful. The model’s success rate for rats was 77.6%. 52 rats were successfully modeled. A detailed statistical analysis using two-way repeated measures ANOVA for the sucrose preference data across all time points (before modeling, before treatment, and after treatment) is provided in the Supplementary Material. These rats were then used for subsequent therapeutic intervention studies.
After the modeling, except the normal control group (NC, n = 13), the rats in the modeling group were divided into 4 groups according to the random number table: The model group (CUMS, n = 13), paroxetine group (SSRI, n = 13), EA group (EA, n = 13), and EA combined with paroxetine group (EA+SSRI, n = 13).
All rats in the NC group, SSRI group, EA group, and EA+SSRI group received a 14-day intervention as follows:
EA intervention: After mild fixation, GV20 (Baihui, the middle of the parietal
bone) and GV29 (Yintang, the middle of the browbone) were selected on the body
surface of the rats for acupuncture according to the names of commonly used
acupoints in experimental animals and their location in rats, as well as the
literature of the Chinese Acupuncture Society [42]. A disposable sterile needle
(0.30
Sham acupuncture intervention: After gentle fixation, the acupuncture needles were fixed at GV20 and GV29 with medical tape without penetrating the skin surface. The needle handle was connected to the electrode of the electroacupuncture instrument, but no electrical stimulation was applied.
Paroxetine gavage intervention: Rats were given Paroxetine 1.8 mg/kg gavage once a day [43].
Normal saline gavage intervention: Rats were given normal saline 1.8 mg/kg gavage (same as paroxetine) once a day.
For the NC group, a sham acupuncture intervention was administered, and a normal saline gavage intervention was given. For the EA group, EA intervention and normal saline gavage intervention were given. For the SSRI group, sham acupuncture intervention and paroxetine gavage intervention were given. For the EA+SSRI group, EA intervention and Paroxetine gavage intervention were given. The intervention lasted for 14 days, and CUMS modeling was continued at the same time (Fig. 1).
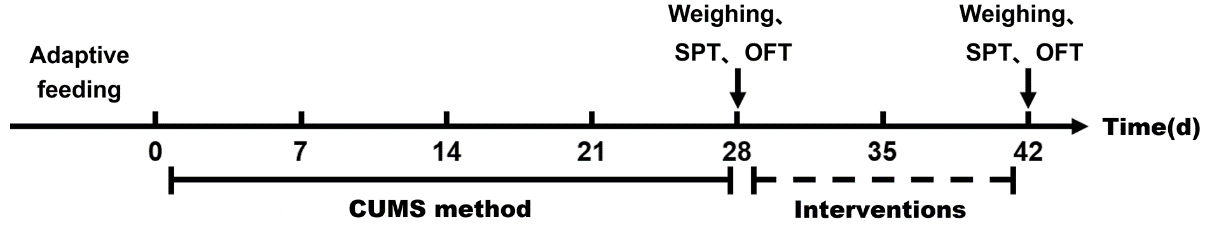 Fig. 1.
Experimental design. CUMS, Chronic Unpredictable Mild Stress; SPT, sucrose preference test; OFT, open field test.
The rats in the beaker were placed on an electronic balance with a tray, and their weight was recorded. The testing time points are on day 28, corresponding to the CUMS modeling period, and day 42, corresponding to the intervention period.
The SPT is divided into adaptation training and formal experiments.
Adaptation training: Before the formal SPT, all animals undergo a 3-day adaptation training, during which they are trained to adapt to drinking sugary water in a quiet environment, with 2 identical water bottles placed in each cage. During the first 24 hours, both bottles contain 1% sucrose water of equal weight; during the second 24 hours, one bottle contains 1% sucrose water, and the other contains pure water of equal weight. Afterward, food and water are withheld for 23 hours.
Formal experiment: Two identical water bottles, one containing 1% sucrose water
and the other containing pure water of equal weight, are weighed and their
weights recorded before the experiment. Both water bottles are then given to the
rat, and their weights are recorded again after an hour. The amount of sucrose
water consumed and pure water consumed are calculated, and the sucrose preference
rate is calculated using the following formula: Sucrose preference rate = sucrose
solution consumption(g)
Additionally, during the adaptation training and formal experiments, the position of the sucrose water bottle is changed every 12 hours to eliminate any potential influence from the rats’ location preference. During non-experimental periods, the food and water dispensers are placed in the center of the cage to prevent the rats from developing feeding and drinking location preferences. The formal testing time points are the same as those for weighing.
The OFT is conducted in a quiet environment. The square field is evenly divided into 25 squares, with the central 9 squares defined as the central zone and the remaining squares defined as the peripheral zone. One rat is gently placed in the center of the field by grasping its tail, and its movements are recorded by a camera for 5 minutes. The time spent in the central zone and the total distance traveled are analyzed and calculated using the SMART 3.0.02 (S7-200 SMART V3.0, Siemens, Munich, Bavaria, Germany) small animal behavior video acquisition and analysis system. After each rat is tested, the excrement is removed, and 75% alcohol is sprayed in the box to remove any residual odors. The next rat is tested after the alcohol has evaporated. One rat is tested at a time. The testing time points are the same as those for weighing.
Four rats were randomly selected for each group. The rats were anesthetized by
intraperitoneal injection of 25% sodium pentobarbital (50 mg/kg; Cat. No. P-010, Sigma-Aldrich, St. Louis, MO, USA) and then
euthanized by decapitation. After separating the brains from the animals, they
were fixed in 4% paraformaldehyde, embedded in paraffin, and sectioned. The
sections were then dewaxed, hydrated, stained with Nissl (Cat. No. C5042, Sigma-Aldrich, St. Louis, MO, USA), dehydrated, cleared,
and cover-slipped. The DG neurons in the hippocampus were observed under a
40
Two rats were randomly selected from each group. After intraperitoneal injection of 25% pentobarbital sodium (50 mg/kg) anesthesia, perfusion was completed with a mixture of paraformaldehyde and glutaraldehyde (2%/2.5%), and the brain tissue was removed after decapitation. The hippocampus was separated and soaked in 2.5% glutaraldehyde for fixation. After rinsing with PBS, it was fixed with 1% osmic acid for 1 hour, then dehydrated with acetone, infiltrated with pure epoxy resin overnight, embedded, and polymerized. Finally, 60-nm ultrathin sections were cut after trimming, stained with uranyl acetate-lead citrate, and observed for changes in neuronal and synaptic ultrastructure. Ultrastructural assessments of both synapses and mitochondria were based on a qualitative comparison of key morphological features: for synapses, these included the clarity of the pre- and postsynaptic membranes and the electron density and width of the postsynaptic density; for mitochondria, these included their size, shape, the integrity of cristae, and the presence of pathology such as swelling or vacuolization.
Four rats were randomly selected for each group. The rats were anesthetized with
25% pentobarbital sodium (50 mg/kg) by intraperitoneal injection, quickly
decapitated, and the brain was isolated, and the attached tissues were removed.
The hippocampal tissue in the DG region was dissected bluntly, washed with PBS,
and immediately frozen in liquid nitrogen, then stored at –80 °C for
further analysis. Four randomly selected samples from each group were used for
protein extraction. Protein concentration was determined by the bicinchoninic
acid assay (BCA; Cat. No. P0009, Beyotime Biotechnology, Shanghai, China), and the protein concentration in the radioimmunoprecipitation
assay (RIPA; Cat. No. P0013B, Beyotime Biotechnology, Shanghai, China) lysis buffer was adjusted. After electrophoresis, wet transfer,
blocking, primary and secondary antibody (anti-Glutamate Receptor 1 (AMPA
subtype) antibody, Abcam, ab109450, Cambridge, UK, 1:2000; anti-Ionotropic Glutamate receptor 2
antibody, Abcam, ab133477, 1:4000; anti-NMDAR1 antibody: Abcam, ab109182, 1:5000;
anti-PSD-95 antibody, Abcam, ab76115, 1:2000; anti-SIRT2 antibody, Abcam, ab67299,
1:2000; Anti-AMPK
Four rats were randomly selected for each group. The NAD/NADH Quantitation kit (Thermo Fisher Scientific, MAK037-1KT) was used for the measurement. Rats were anesthetized with intraperitoneal injection of 25% sodium pentobarbital (50 mg/kg), quickly decapitated, and the hippocampal tissue from the DG region was bluntly separated. Tissue NAD+/NADH extraction buffer was added and homogenized on ice, centrifuged, and the supernatant was collected. The supernatant was divided into two parts:
(1) NAD total (NAD+ and NADH): used directly for measurement.
(2) NADH: heated at 60 °C for 30 minutes to decompose and remove NAD+.
Both samples were incubated in the dark with ethanol dehydrogenase working solution, and the color was developed with a coloring reagent. The absorbance at 450 nm was measured with a microplate reader (SpectraMax i3x, Molecular Devices, LLC, San Jose, CA, USA), and the contents of NAD+ and NADH were calculated based on the standard curve. The NAD+/NADH ratio was calculated using the formula: NAD+/NADH = (NAD total – NADH) / NADH.
Four rats were randomly selected for each group. After anesthesia with
intraperitoneal injection of 25% sodium pentobarbital (50 mg/kg), the brain was
isolated and routinely embedded in paraffin. 5 µm sections were cut,
deparaffinized, rehydrated with graded alcohols, underwent antigen retrieval with
sodium citrate, permeabilized, and blocked. The sections were then incubated
overnight at 4 °C with antibodies against SIRT2 and GluA1, followed by 2-hour
incubation at room temperature with secondary antibodies (anti-SIRT2 antibody,
Proteintech, 19655-1-AP, 1:100; anti-Glutamate Receptor 1 (AMPA subtype)
antibody, Abcam, ab109450, 1:200). The slides were mounted with 4′,6-diamidino-2-phenylindole (DAPI)-containing
mounting medium. The SIRT2 and GluA1 co-localization in the hippocampal DG was
observed under a laser confocal microscope (LSM 980, Carl Zeiss AG, Oberkochen, Germany) at high magnification (63
The collected data were organized and analyzed using GraphPad Prism 9 (9.5.1,
GraphPad Software LLC, San Diego, CA, USA). The measurement data were
presented as mean
After establishing the CUMS model and conducting behavioral tests (weight, SPT,
OFT), about 77.6% of rats (n = 52) showed depressive behavior induced by CUMS, and
were then given corresponding interventions. No rats died during modeling or
intervention. During the intervention period, the CUMS model remained stable, and
the behavioral results were significantly different from those of the NC group
(p
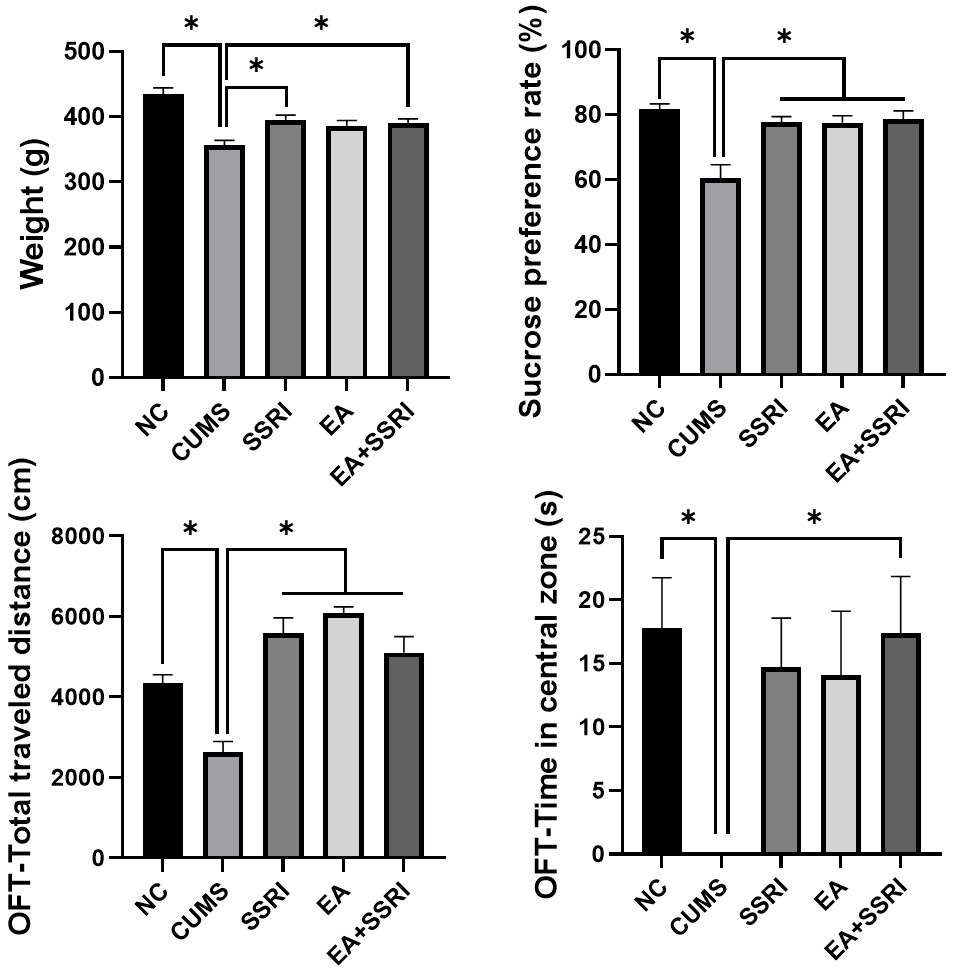 Fig. 2.
Behavioral comparison of rats in each group. Mean
The Nissl staining results showed that in the hippocampal DG region of the NC group rats, the neuronal cell nuclei appeared deep blue, with neat and dense tissue arrangement. After CUMS modeling, the neuronal cell nuclei appeared light blue, with disordered neuronal arrangement and loose tissue. Following paroxetine, electroacupuncture, and electroacupuncture combined with paroxetine interventions, the neuronal cell nuclei appeared deep blue or purple, and the neuronal arrangement was more organized, and the tissue was denser than that of the CUMS group.
Using ImageJ software, the AOD of Nissl staining in the hippocampal DG area of
CUMS model rats was significantly lower than that of the NC group (p
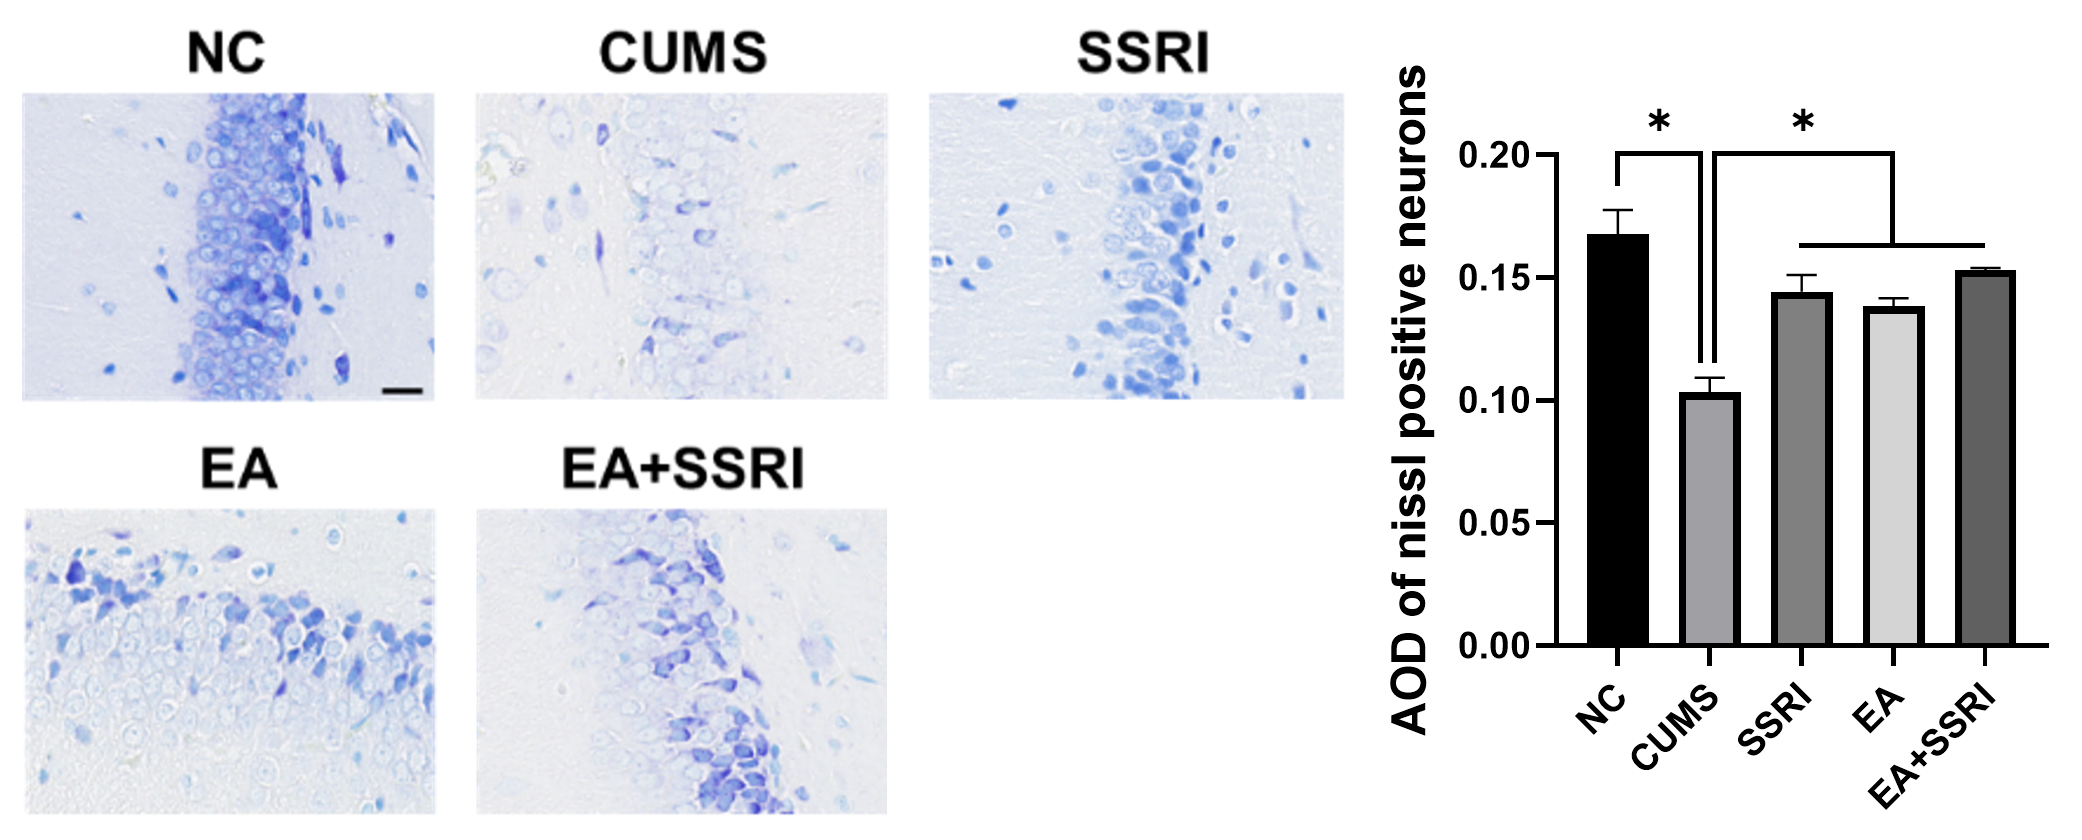 Fig. 3.
Comparison of AOD in hippocampal DG Nissl staining of rats in
each group. Mean
Transmission electron microscopy showed that the synaptic profile in the hippocampal DG region of the NC group rats was clear, with a wide and high-density postsynaptic density. In the CUMS group, the pre- and postsynaptic membrane contours were blurred, and the density of the postsynaptic density was decreased. Compared to the CUMS group, the SSRI and EA groups both exhibited a trend towards clearer synaptic contours and a postsynaptic density that appeared wider and more electron-dense. Among all groups, the EA+SSRI group consistently demonstrated the most pronounced improvement in these ultrastructural features (Fig. 4).
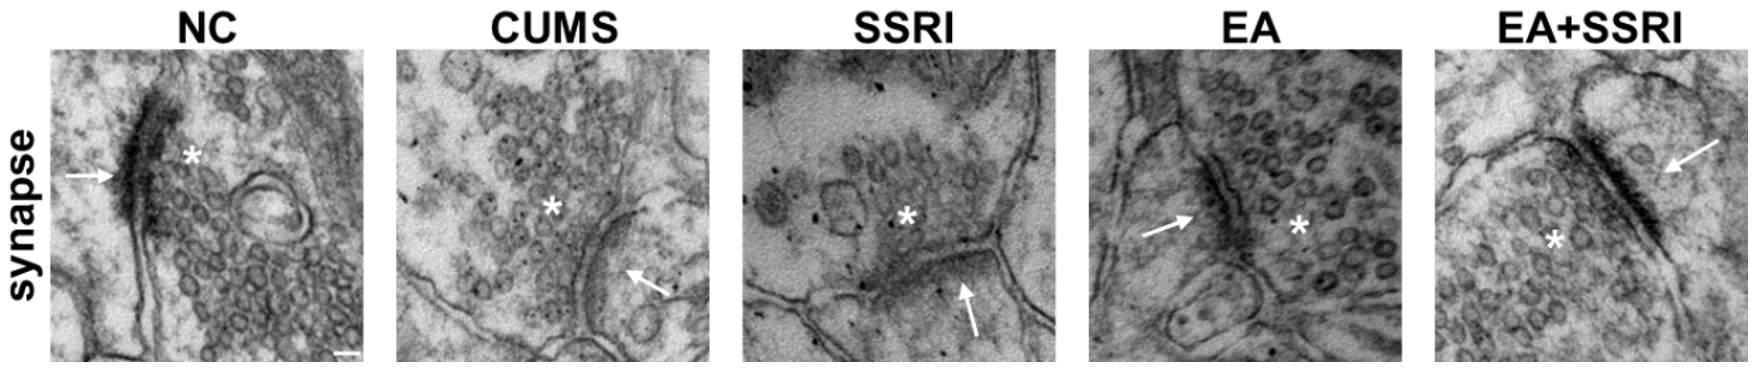 Fig. 4.
Comparison of synaptic ultrastructure of rat hippocampal DG in
each group. * indicates the presynaptic membrane,
Western blotting results showed that the expression of the GluA1 subunit of
AMPAR, the GluN1 subunit of NMDAR, and PSD-95 in the hippocampal DG of depressed
rats induced by CUMS was significantly reduced compared with the NC group
(p
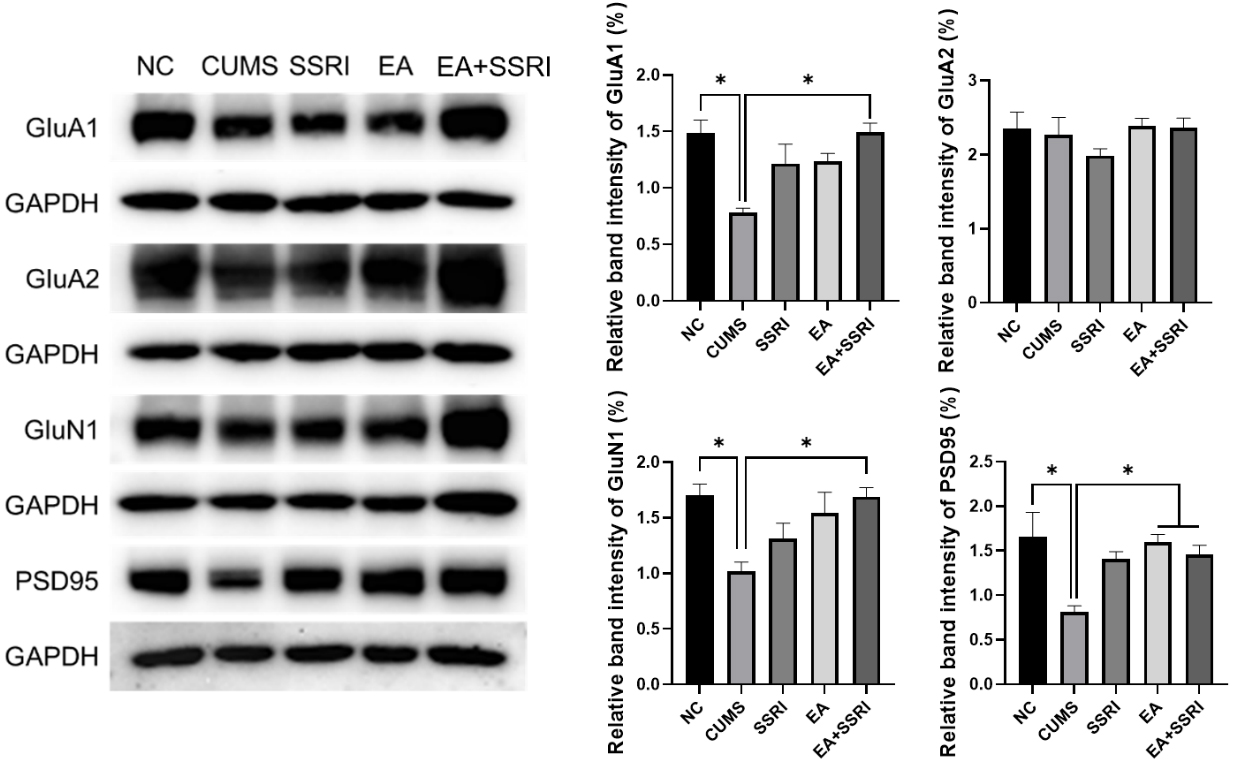 Fig. 5.
Comparison of the normalized intensity of rat hippocampal DG
synaptic proteins in each group. Mean
Transmission electron microscopy revealed distinct morphological trends across groups. Mitochondria in the NC group were predominantly elliptical with intact cristae. In contrast, the CUMS group predominantly exhibited smaller, swollen mitochondria with reduced, fragmented cristae, and occasional vacuolization. Compared to the CUMS group, the SSRI and EA groups showed a trend towards improved morphology, with mitochondria appearing more elliptical and containing a greater number of cristae. The EA+SSRI group demonstrated the most pronounced improvement, with mitochondria frequently appearing short-rod-shaped and containing numerous intact cristae (Fig. 6).
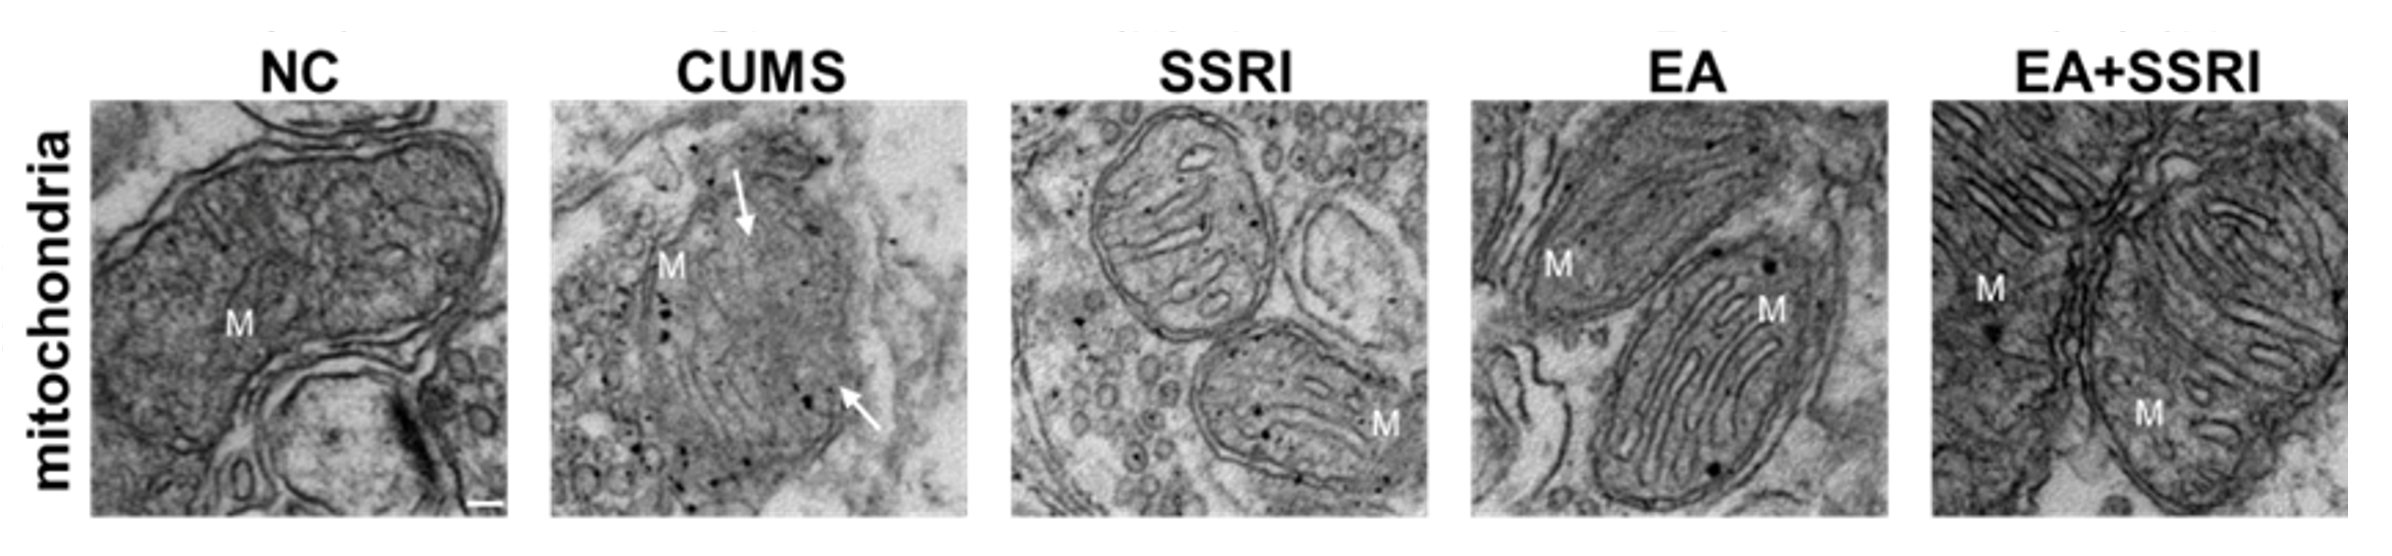 Fig. 6.
Comparison of mitochondrial ultrastructure of rat hippocampal DG
in each group. M stands for mitochondria,
In the NAD+/NADH ratio measurement, the NAD+/NADH ratio of the
hippocampal DG in rats was significantly lower in the CUMS group than in the NC
group (p
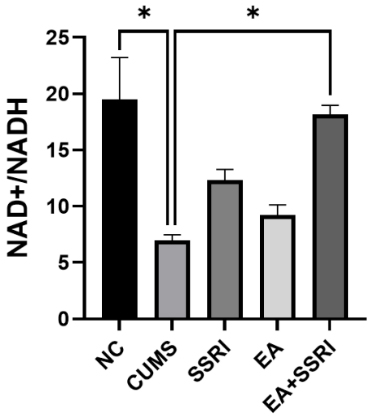 Fig. 7.
Comparison of hippocampal DG NAD+/NADH ratio in rats of
each group. Mean
Western blotting results showed that the relative gray values of SIRT2,
p-AMPK/AMPK, and PGC-1
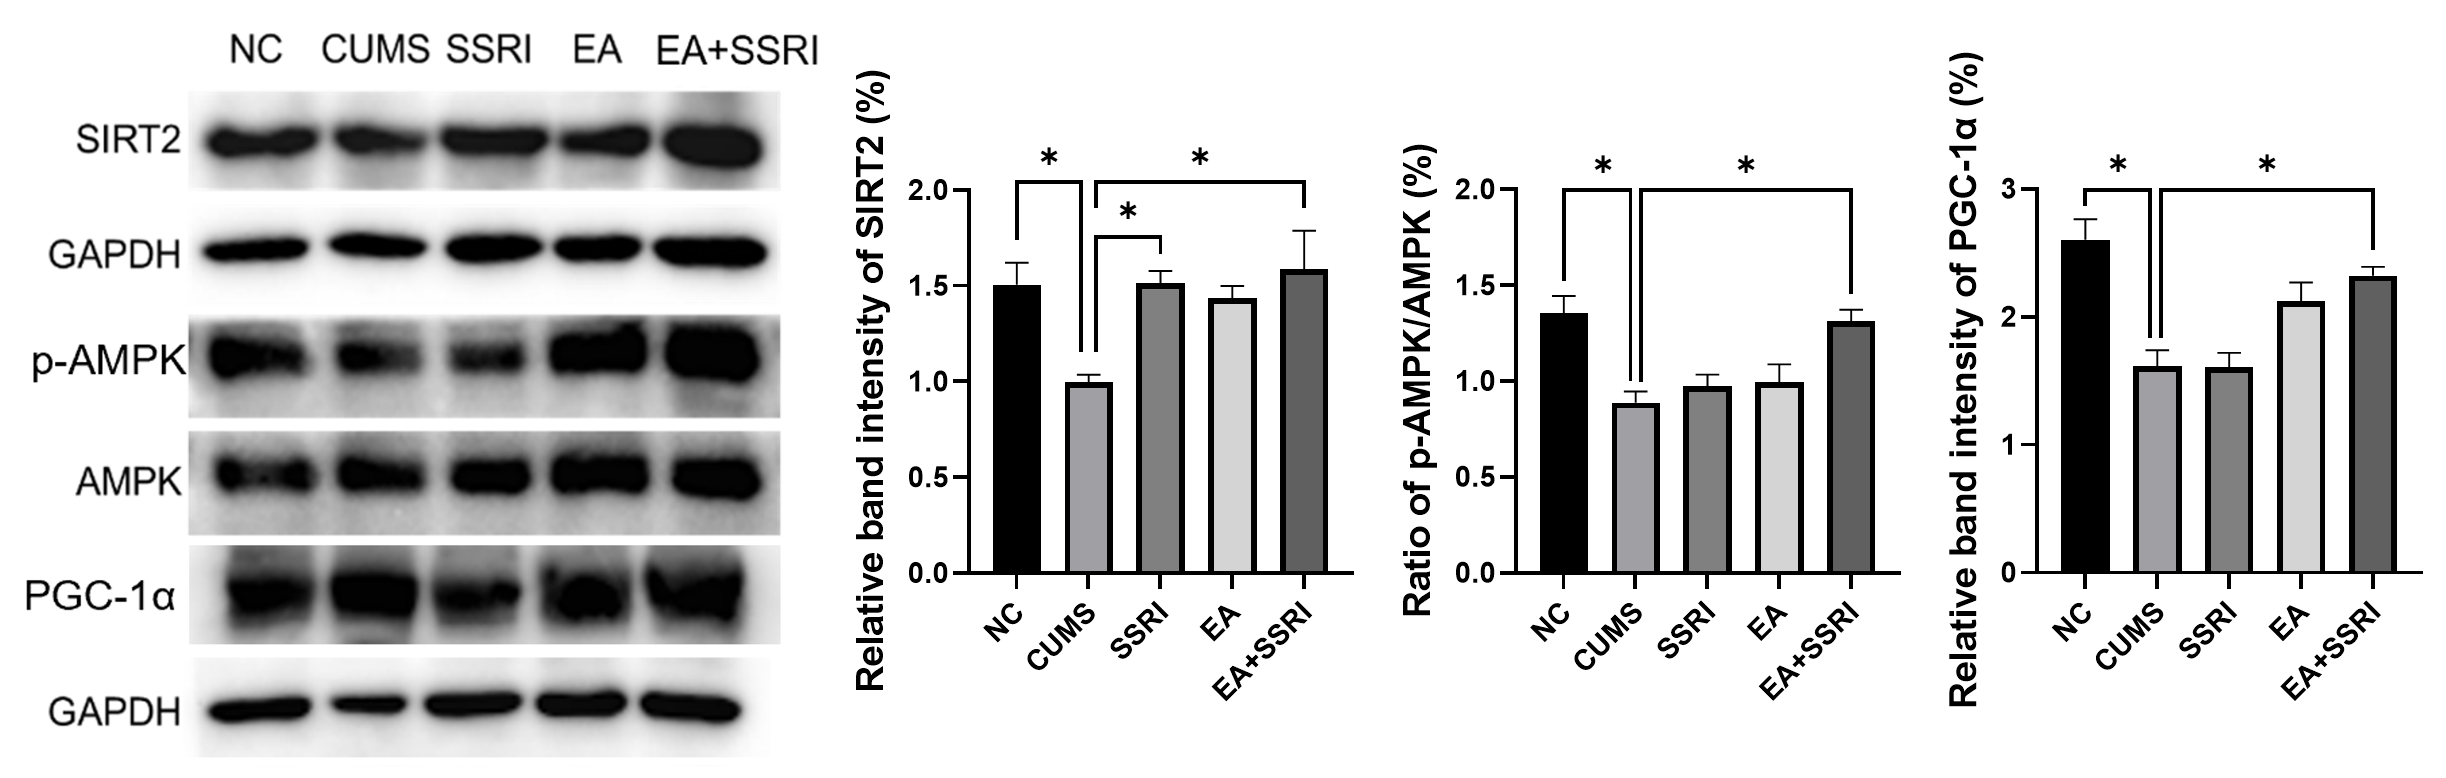 Fig. 8.
Comparison of the normalized intensity of hippocampal DG SIRT2
pathway-related proteins in each rat group. Mean
The immunofluorescence results for SIRT2 and GluA1 were consistent with the Western blot data and provided visual context for the protein interactions. Representative images revealed a strong immunofluorescence signal for both SIRT2 and GluA1 in the NC group, with their spatial distributions appearing highly overlapping. In the CUMS group, both signals were markedly attenuated, and the overlapping distribution was less apparent. The EA and EA+SSRI groups exhibited a restoration of signal intensity for both proteins, and their spatial distributions showed a notable degree of overlap, a trend that was most evident in the EA+SSRI group. The SSRI group showed restored signal intensity but a less apparent overlap in distribution compared to the EA-treated groups (Fig. 9).
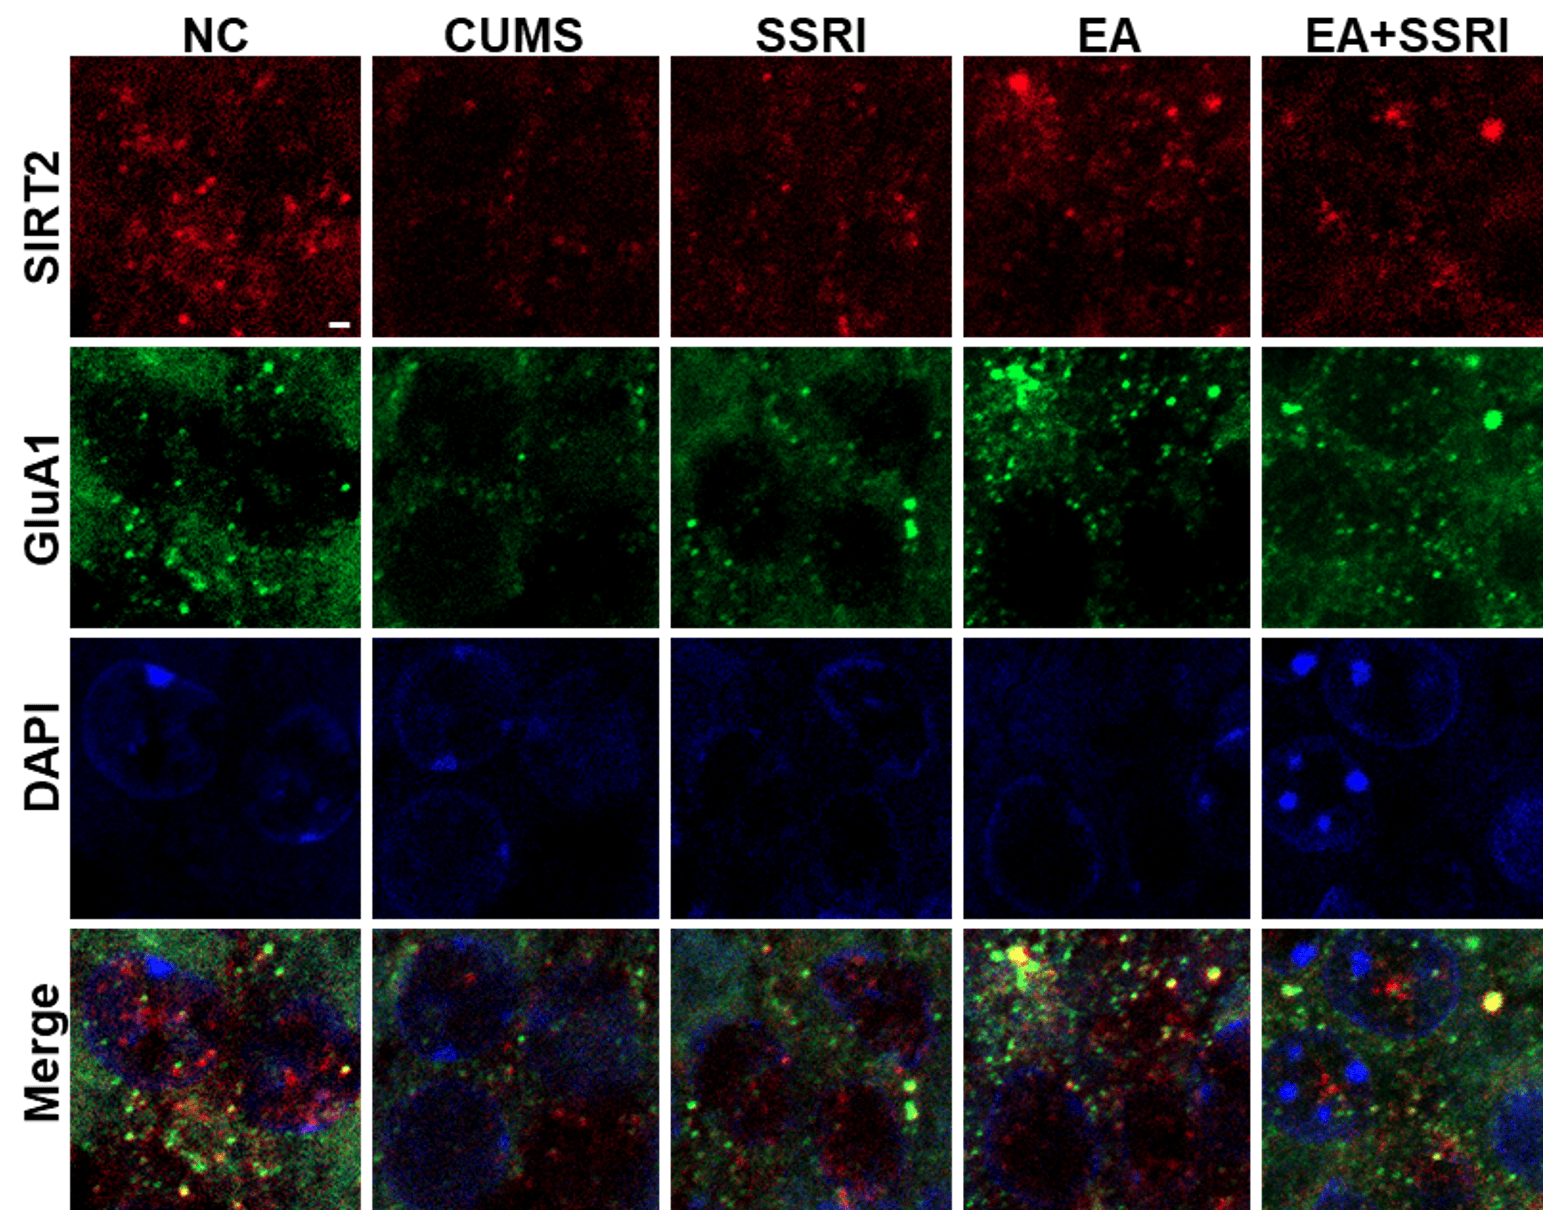 Fig. 9.
Comparison of hippocampal DG SIRT2-AMPAR co-location of rats in
each group. Scale = 1 µm. AMPAR,
CUMS model was used to induce depressive rats in this study. CUMS is a well-established model that simulates human depression pathogenesis through chronic, unpredictable low-level stress [44, 45]. Behavioral tests, including reduced food intake, anhedonia, and anxiety-related behavior or exploratory behaviors in the open field test, are used to reflect depression-like behaviors in animals [46]. Studies have shown that EA not only has significant therapeutic effects on mild and moderate depression but also can be used in combination with antidepressants to shorten the onset time of the antidepressants, compared with antidepressants alone [14]. We observed that EA combined with paroxetine intervention improved depression-like behaviors in rats better than paroxetine alone or EA alone, based on improvements in behavioral indicators, consistent with previous studies. It is noteworthy that the behavioral recovery in the treatment groups presented a complex profile when viewed against the naive controls, with some indicators exceeding and others approximating NC levels. However, the paramount finding remains that all interventions significantly reversed the CUMS-induced deficits, the primary goal of this therapeutic investigation. It is worth noting that in terms of body weight, paroxetine and EA combined with paroxetine intervention had a greater effect than EA alone. In fact, antidepressants, including the SSRIs such as paroxetine used in this experiment, carry a greater risk of weight gain during both acute and long-term treatment [47]. Therefore, for patients with heavy body weights, EA may be a more favorable alternative with less impact on weight compared to SSRIs. While the core behavioral improvements were significant across all treatment groups, the most compelling evidence for the enhanced efficacy of the combined EA+SSRI regimen emerged at the molecular and ultrastructural levels. This mechanistic distinction underscores a potential key advantage of the combination therapy beyond what was captured at the single behavioral time point assessed.
We focused on the neuronal damage in the hippocampal DG region. The hippocampus is considered a diagnostic neurobiological biomarker and a therapeutic target for depression [48]. Studies have shown that the hippocampus is one of the targeted brain regions in EA intervention for depression patients [49]. Nissl staining is a neuronal-specific staining, and the intensity of staining (AOD) is positively correlated with the number of neurons in the brain region. Nissl staining was performed on the DG region of the rat hippocampus to observe the number of neurons and evaluate the extent of damage. Critically, the arrangement and density of neurons reflect the structural basis for neural connectivity and function. The disorganized architecture observed in CUMS rats suggests impaired neurogenesis, disrupted synaptic integration, and compromised information processing within the hippocampal formation, which are key mechanistic deficits in depression [50, 51]. We found that the depressive rats had disorganized and loose hippocampal DG neuronal arrangements, and after paroxetine, EA, or EA combined with paroxetine intervention, the number and arrangement of neurons were improved. Combined with the improvement in the macroscopic behavioral and microscopic hippocampal DG neuronal counts in CUMS-induced depressive rats, EA combined with paroxetine intervention was superior to EA or paroxetine alone.
In recent years, an increasing number of studies have shown a close relationship between the pathogenesis of depression and disruptions in hippocampal synaptic structure and transmission [52, 53, 54]. Here, we directly observed changes in the ultrastructure of synapses in the DG region of rat hippocampus by transmission electron microscopy, analyzed changes in various ultrastructures of presynaptic and postsynaptic membranes and the synaptic cleft, and evaluated the plasticity of neuronal synapse structures. TEM primarily visualizes mature granule cell synapses. We focused on the DG due to its role in synaptic integration. The restoration of synaptic architecture indicates recovery of circuit integrity. This improved synaptic environment in the mature network may also support the subsequent integration of newborn neurons. Therefore, enhancing mature synapses may be a fundamental therapeutic mechanism. We found that EA intervention was more effective in improving the synaptic structure of DG in depressive rats than paroxetine intervention, with a more significant increase in the density of postsynaptic dense bodies. Furthermore, EA combined with paroxetine intervention had the most significant improvement in the synaptic ultrastructure of DG neurons, as well as the best antidepressant effect.
Thus, we speculate that EA might supplement the delayed effects of SSRIs by driving more robust improvements in synaptic efficacy and stability, particularly by enhancing the development of postsynaptic dense bodies and the formation of a clearer, more stable postsynaptic membrane contour. The clarification of the postsynaptic membrane contour often signifies the maturation and enhanced stability of the synaptic structure, which provides more secure anchoring sites for neurotransmitter receptors and signaling molecules, thereby potentially directly augmenting synaptic transmission efficacy [55]. Moreover, combined with clinical treatment, the delayed onset of action of SSRIs and the relatively rapid onset of EA intervention may be related to the dynamics of changes in synaptic structural plasticity, particularly concerning the maturation of the postsynaptic component, including the PSD and the well-defined postsynaptic membrane interface [16].
The postsynaptic density contains scaffold protein PSD-95 and receptor proteins for various neurotransmitters. Among the receptor proteins, the glutamate receptors (AMPAR and NMDAR) are most critically involved in regulating synaptic strength and efficacy. In hippocampal neurons, glutamatergic neurons are predominant, and AMPARs are one of the key receptors for long-term potentiation (LTP), serving as an intuitive indicator of functional synaptic state [20]. Western blotting was used to further examine the abundance of glutamate receptor synaptic proteins in the hippocampal DG neurons to identify the molecular targets of EA and EA combined with paroxetine intervention in the treatment of depression. AMPAR subunits (GluA1 and GluA2), NMDAR subunit (GluN1), and PSD-95 were selected for detection. It is important to note that our Western blot analysis measured total hippocampal protein levels. Although this approach does not distinguish between intracellular and surface-expressed receptor pools, the observed reduction in total GluA1 and other key synaptic proteins constitutes a fundamental deficit in the synaptic component reservoir, which is a necessary precondition for impaired synaptic transmission. We found that the EA combined with paroxetine intervention significantly improved the expression of the GluA1 subunit, while it did not affect the expression of the GluA2 subunit. Studies have shown that the level of the GluA1 subunit in central nervous system AMPARs decreases in depression, reflecting impaired synaptic strength and integrity, while changes in the GluA2 subunit are not significant [56]. This may be related to the fact that GluA1 is the main physiological functional subunit of AMPARs, while the GluA2 subunit is involved in the regulation of subunits. In addition, we also found that EA combined with paroxetine intervention significantly increased the expression of the GluN1 subunit of NMDAR and PSD-95, and EA intervention increased the expression of PSD-95. NMDAR, as a modulatory receptor, mainly regulates the number of AMPARs in synapses, promotes the transfer and fixation of cytoplasmic AMPARs to the postsynaptic membrane, and indirectly influences synaptic function. There is still debate on the changes in NMDAR levels in the central nervous system in depression, and experimental results are not completely consistent [57], suggesting that NMDAR may only indirectly or partially participate in the pathogenesis of depression. PSD-95, as a key synaptic scaffold protein, does not directly maintain dynamic synaptic properties but can serve as an indicator of synaptic structural status [22]. The improvement of the PSD is more obvious with EA combined with paroxetine intervention, consistent with the transmission electron microscopy results.
Mitochondrial dysfunction can also lead to the disappearance of synapses [58]. Mitochondria regulate the apoptotic machinery in cells, and abnormalities can lead to a reduction in synaptic protein synthesis and even the number of synapses [59]. In this experiment, transmission electron microscopy was used to observe the ultrastructure of mitochondria in hippocampal DG neurons to evaluate the effects of EA and EA combined with paroxetine intervention on the ultrastructure of neuronal mitochondria. We found that mitochondria in the hippocampal DG neurons of CUMS-induced depressive rats showed swelling, smaller size, decreased number of cristae, and vacuolization or focal-like cavitation. However, after intervention with paroxetine, EA, or EA combined with paroxetine, this process could be reversed, and EA combined with paroxetine intervention was more effective. To further evaluate changes in mitochondrial function, we also measured the NAD+/NADH ratio in the hippocampal DG of rats in each group to evaluate the effect of EA and EA combined with paroxetine intervention on mitochondrial NADH dehydrogenase. The results showed that EA combined with paroxetine intervention significantly increased the NAD+/NADH ratio, consistent with the transmission electron microscopy results. The concurrent improvement in depression-like behaviors, synaptic protein levels, and mitochondrial parameters following treatment suggests a potential mechanistic link. We hypothesize that the recovery of mitochondrial bioenergetics (elevated NAD+/NADH ratio and restored ultrastructure) may provide the necessary cellular substrate for the synthesis and stabilization of synaptic proteins like GluA1 and PSD-95. While this study demonstrates a strong association across these levels, future causal experiments are warranted to definitively link the specific elevation of GluA1 or NAD+/NADH to the reversal of synaptic ultrastructure damage. It is suggested that changes in the hippocampal mitochondrial pathway caused by EA combined with paroxetine intervention may be one of the important mechanisms underlying the efficacy of this intervention in depression, and that the mitochondrial pathway is an important upstream pathway for modulating synaptic efficacy in neurons [60].
Our observations of mitochondrial recovery pertain primarily to the mature
neuronal population within the DG. In depressive patients and model animals, such
dysfunction impairs the ATP production and calcium homeostasis required for
synaptic vesicle cycling, receptor trafficking, and the structural remodeling of
spines—processes fundamental to synaptic transmission and structural
adaptability [61]. Therefore, the reversal of mitochondrial swelling, cristae
loss, and bioenergetic deficit (increased NAD+/NADH) in mature cells, as
induced most effectively by the combined EA+SSRI treatment, likely represents a
crucial upstream event. Mitochondrial NAD+ is a substrate of the SIRTs
protein family. Some studies have shown that the hippocampal SIRT2 of depressed
mice is significantly reduced, and antidepressant treatment can increase the
content of SIRT2 in the hippocampus of CUMS model animals, improving depression
[62, 63]. Another study has suggested that enhancing SIRT2 levels can boost
mitochondrial protein levels and activity, thereby enhancing mitochondrial
function. Conversely, reducing SIRT2 expression leads to decreased expression of
p-AMPK and PGC-1
Based on the effect of EA combined with paroxetine on the GluA1 subunit and SIRT2-related pathways, immunofluorescence double staining was used to detect the co-expression of SIRT2 and GluA1 in the hippocampal DG of depressive rats in each group, to evaluate the influence of EA and EA combined with paroxetine intervention on the co-expression of SIRT2 and GluA1. Some studies have shown that when SIRT2 is knocked out or inhibited, the acetylation level of GluA1 in the hippocampus is increased, while GluA2, GluN1, and PSD-95 are not changed, but synaptic function is also damaged, which is represented by reduced synaptic markers and impaired synaptic LTP [63, 65]. The results of immunofluorescence double staining showed that EA combined with paroxetine intervention significantly increased the co-expression of SIRT2 and GluA1, which was consistent with previous studies.
This study focused on exploring the effective mechanism of SIRT2/AMPAR in the hippocampal DG brain region of CUMS-induced depressive rats, and preliminarily proved that the rapid effect of EA combined with paroxetine intervention may be through the regulation of the SIRT2/AMPAR signaling pathway. However, the study still has some limitations. First, the absence of a non-acupoint electroacupuncture control group limits the ability to definitively conclude that the observed effects are specific to the stimulation of the selected acupoints (GV20 and GV29). Additionally, for the regulation of AMPAR-related pathways, agonists and inhibitors can be added, or specific genes can be knocked out to verify the regulation of the pathway. In future studies, we may select SIRT2 inhibitors or SIRT2 knockout animals to study the regulation mechanism of the AMPAR-related pathway, so as to further study the antidepressant mechanism of EA combined with paroxetine intervention. Furthermore, future investigations should incorporate a non-acupoint electroacupuncture control group to further validate the specificity of the acupoint effects.
This study preliminarily explored the effective mechanism of EA combined with paroxetine intervention to improve depression-like behavior in CUMs-induced depressive rats. The results indicate that the mechanism involves the activation of the SIRT2/AMPAR pathway in the hippocampal DG, leading to enhanced synaptic ultrastructure and reduced depression-like behavior. This provides support for the clinical application of EA in the treatment of depression, and complements the possible mechanism of EA intervention in depression and the pathogenesis of depression.
All data that support the findings are included in the article.
YH and ZNZ were involved in conception and design of the study and critically revised the manuscript for important intellectual content. STH conducted final data analyses, drafted the manuscript, and participated in revising it critically. XWC and XKQ performed animal experiments and index detection, and contributed to the revision of the methods section and reviewed the manuscript. ZL performed statistical analysis and critically revised the statistical sections and results interpretation. ZJZ directed the experiment, provided critical feedback on the manuscript draft, and revised the discussion section. All authors read and approved the final version and agree to be accountable for all aspects of the work.
This experiment has been reviewed by the Experimental Animal Ethics Committee of Southern Medical University (No.: L2017178). All procedures complied with the ARRIVE guidelines 2.0. All animal experiments in this study strictly adhered to the ethical guidelines outlined by the Institution’s Animal Care and Use Committee (IACUC).
Not applicable.
This study was supported by the National Natural Science Foundation of China (Grant No. 82405537 and 82074519); Natural Science Foundation of Guangdong Province (Grant No. 2026A1515010770 and 2023A1515012235); the Science and Technology Program of Guangzhou, China (Grant No. 2024A04J3988); the Administration of Traditional Chinese Medicine Research Program of Guangdong Province, China (Grant No. 20241197).
The authors declare no conflict of interest.
Supplementary material associated with this article can be found, in the online version, at https://doi.org/10.31083/JIN44692.
References
Publisher’s Note: IMR Press stays neutral with regard to jurisdictional claims in published maps and institutional affiliations.