


 , Mansour Alshanawani 2, Haya Alshegri 2, Mahasin G. Hassan 1, Amal Ibrahim Alorainy 1, Nouf Abdullah Alroqaiba 1, Shanoo Sheikh 1
1 College of Health and Rehabilitation Sciences, Princess Nourah bint Abdulrahman University, 11472 Riyadh, Saudi Arabia
2 Department of Radiology, King Abdullah bin Abdulaziz University Hospital, 11564 Riyadh, Saudi Arabia
Abstract
Emotional variability in healthy individuals may reflect underlying neurochemical processes relevant to mental health. Proton magnetic resonance spectroscopy (1H-MRS) enables in vivo quantification of metabolites linked to neuronal integrity and glial activity, yet data on nonclinical Middle Eastern populations remain scarce.
Eighty-four healthy young women from Saudi Arabia underwent 3T 1H-MRS of the basal ganglia. Metabolite ratios ((N-acetylaspartate/Creatine (NAA/Cr), Choline/Creatine (Cho/Cr), Myo-Inositol/ Creatine (Myo-In/Cr), Glutamate/Creatine (Glx/Cr)) were quantified using LCModel. Mood and anxiety were assessed with validated self-reported scales. Correlation and regression analyses examined associations between metabolite ratios and emotional scores.
Higher Cho/Cr and Myo-In/Cr ratios correlated positively with mood (r = 0.35, p < 0.001; r = 0.29, p = 0.004) and anxiety (r = 0.32, p = 0.002; r = 0.27, p = 0.009). NAA/Cr showed small negative associations, while Glx/Cr was nonsignificant. Regression confirmed Cho/Cr and Myo-In/Cr as significant predictors of both mood and anxiety, explaining up to 31% of variance.
Basal ganglia metabolite ratios, particularly Cho/Cr and Myo-In/Cr, are associated with affective variability in healthy young women. These findings underscore the potential of 1H-MRS neurochemical profiles as early indicators of emotional vulnerability, supporting integration into precision mental health frameworks for preventive care.
Keywords
- proton magnetic resonance spectroscopy
- neurochemical biomarkers
- choline
- myo-inositol
- N-acetylaspartate
- glutamate
- basal ganglia
- mood
- anxiety
- precision mental health
Proton magnetic resonance spectroscopy (1H-MRS) is a non-invasive neuroimaging technique that quantifies brain metabolites in vivo, offering unique insights into neurochemical processes underlying mental health disorders [1]. Unlike structural MRI, which depicts anatomical features, 1H-MRS captures biochemical signatures linked to neuronal integrity, glial activity, and neurotransmission. Key metabolites—N-acetylaspartate (NAA), choline-containing compounds (Cho), creatine (Cr), myo-inositol (Myo-In), and glutamate/glutamine (Glx)—reflect neuronal viability, membrane turnover, osmotic regulation, and excitatory signaling [2, 3, 4, 5, 6]. These markers have been implicated in the pathophysiology of mood and anxiety disorders, making them clinically relevant targets for early detection and intervention.
Recent MRS meta-analyses have reported alterations in key metabolites—including reduced NAA and variable changes in Cho and Myo-In—in individuals with depression and anxiety disorders, suggesting disruptions in neuronal integrity, membrane turnover, and glial activity [7, 8, 9, 10]. These findings highlight the relevance of basal ganglia neurochemistry to affective processes. Emerging evidence further suggests that similar patterns of neurochemical variability may also be detectable in healthy individuals, potentially contributing to normal emotional regulation and stress reactivity [11, 12]. Identifying such patterns in nonclinical populations could enable early risk stratification and preventive strategies—an approach aligned with precision psychiatry [13, 14].
The basal ganglia, traditionally associated with motor control, are increasingly recognized for their role in emotional regulation and reward processing [15, 16]. Functional imaging and connectivity studies highlight their involvement in affective circuits and stress-related disorders [17]. Furthermore, 1H-MRS investigations have demonstrated metabolite alterations in the basal ganglia among individuals with major depressive disorder and bipolar disorder, reinforcing its potential as a biomarker region [11].
Young adulthood represents a critical developmental stage characterized by heightened stress reactivity and mood fluctuations, and university students frequently report elevated psychological distress [18, 19]. Investigating basal ganglia neurochemistry in this population can reveal early neurochemical signatures of vulnerability, supporting targeted interventions before clinical onset [11]. This study examines whether basal ganglia metabolite ratios (NAA/Cr, Cho/Cr, Myo-In/Cr, Glx/Cr) predict mood and anxiety scores in healthy young women using 3T 1H-MRS. By linking neurochemical variability to affective states, we aim to advance non-invasive biomarkers for mental health monitoring and bridge the gap between basic neuroscience and clinical application.
This cross-sectional study was conducted between January and June 2024 at King
Abdullah bin Abdulaziz University Hospital, following ethical approval from the
Institutional Review Board of Princess Nourah bint Abdulrahman University (IRB
Log Number: 23-0257, dated March 22, 2023). Written informed consent was obtained
from all participants prior to enrolment. A total of 84 healthy female Saudi
participants were recruited from the Radiology Department. To minimize
confounding and enhance internal validity, participants were selected to ensure
comparable characteristics in age (18–25 years; mean 21.3
All participants completed a standard MRI safety screening before scanning. Imaging was performed on a 3 Tesla scanner (Magnetom Vida, Siemens Healthineers, Erlangen, Germany) using a 32-channel head coil. Participants were positioned supine with head-first orientation, and the laser localizer was aligned over the glabella.
Initial imaging included a three-plane localizer, followed by low-resolution
T1-weighted images (
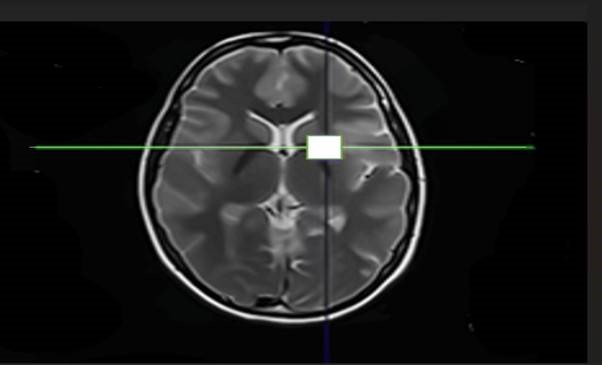 Fig. 1.
Axial T2 weighted MRI illustrating the single voxel 1H-MRS region of interest (15
Single-voxel spectroscopy (SVS) was acquired using a PRESS localization
sequence, positioned in the basal ganglia based on T2-weighted images.
Acquisition parameters included: voxel size = 15
Spectral fitting was performed using LCModel software (version 6.3; Provencher, 1993, developed by Stephen Provencher, LCModel Inc., Oakville, Ontario, Canada) [1]. The basis set included N-acetylaspartate (NAA), choline-containing compounds (Cho), creatine (Cr), myo-inositol (Myo-In), glutamate + glutamine (Glx), and additional macromolecule/lipid components supplied by the manufacturer. The analysis window spanned 0.2–4.0 ppm, and eddy-current correction was applied using the unsuppressed water reference. Quantification was performed using water-scaled metabolite estimates.
To ensure data quality, all spectra included in the analysis met the
acquisition-time quality control thresholds applied during scanning. We
acknowledge that recent LCModel recommendations and MRS reliability studies
support the use of stricter post-processing criteria (e.g., Cramér–Rao Lower Bound (CRLB)
A short TE was selected to optimize detection of metabolites with short T2 relaxation times, including Glx and Myo-In, which are not reliably detected at longer echo times. Spectral fitting was subsequently performed using LCModel software (version 6.3; Provencher, 1993) [1], incorporating frequency drift correction and motion compensation for accurate quantification of NAA, Cho, Cr, Myo-In, and Glx. Automated shimming optimized magnetic field homogeneity.
Mood was assessed using the Brief Mood Survey (BMS) [20], a validated 33-item self-reported instrument capturing negative affective states such as fatigue, irritability, and sadness. Items were rated on a three-point Likert scale (0 = Not true, 1 = Sometimes, 2 = True), yielding a total score range of 0–66, with higher scores indicating greater affective variability. Anxiety was evaluated using the Beck Anxiety Inventory (BAI) [21], a widely used 21-item questionnaire assessing common anxiety symptoms including fear, dizziness, and trembling. Items were rated on a four-point scale (0 = Not at all, 1 = Mildly, 2 = Moderately, 3 = Severely), producing a total score range of 0–63, with higher scores reflecting increased anxiety severity. The BAI is extensively validated in clinical and nonclinical populations.
Metabolite ratios were calculated by normalizing each metabolite concentration
to creatine (Cr), yielding NAA/Cr, Cho/Cr, Myo-In/Cr, and Glx/Cr. Although Cr
normalization is standard in single-voxel MRS, creatine levels can vary with
metabolic or physiological factors; however, absolute quantification was not
feasible in the present dataset, and Cr stability across participants could not
be formally assessed. Descriptive statistics summarized all variables. Data
distributions were inspected visually using histograms and Q–Q plots to assess
approximate normality. Effect sizes for correlations were interpreted using
Cohen’s conventions (r
Mood and anxiety scores demonstrated substantial variability across participants. Mood scores ranged from 0 to 66 (mean = 28.4, SD = 12.7), while anxiety scores ranged from 0 to 63 (mean = 26.1, SD = 11.9). Both distributions approximated normality, confirming that the sample captured a broad spectrum of affective variability (Table 1).
| Variable | Mean | SD | Min | Max |
| Mood score (0–66) | 28.40 | 12.70 | 0 | 66 |
| Anxiety score (0–63) | 26.10 | 11.90 | 0 | 63 |
Higher scores indicate greater affective variability (mood) or anxiety severity. Values represent the mean, standard deviation (SD), and observed minimum and maximum scores for each measure.
Representative 1H-MRS spectra, as seen in Fig. 2, showed clear separation of
major metabolite peaks (NAA, Cho, Cr, Myo In, Glx), and LCModel fitting provided reliable quantification. showed clear separation of major
metabolite peaks (NAA, Cho, Cr, Myo-In, Glx), and LCModel fitting provided
reliable quantification. All spectra met quality control thresholds
(Cramér–Rao lower bounds
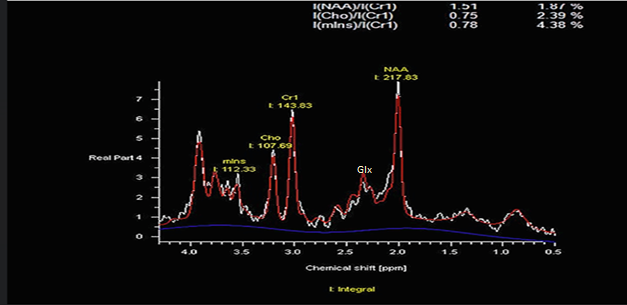 Fig. 2.
Representative 1H-MRS spectrum from the basal ganglia at 3T. Peaks for N-acetylaspartate (NAA), choline (Cho), creatine (Cr), myo-inositol (Myo-In), and glutamate/glutamine (Glx) are shown, with LCModel fitting applied for metabolite quantification. In this scanner-integrated display, the LCModel fit is shown as a red line, the original spectral data appear as a white dotted plot, and the residuals are displayed as a blue trace at the bottom.
| Variable | Mean | SD | Min | Max |
| NAA/Cr | 1.23 | 0.21 | 0.45 | 2.50 |
| Cho/Cr | 0.69 | 0.14 | 0.50 | 1.40 |
| Myo-In/Cr | 0.58 | 0.13 | 0.20 | 1.50 |
| Glx/Cr | 0.94 | 0.18 | 0.30 | 1.70 |
Significant positive correlations were observed for Cho/Cr and Myo-In/Cr with
both mood and anxiety scores (all p
| Metabolite Ratio | Mood (r, p) | Anxiety (r, p) |
| NAA/Cr | –0.21; p = 0.031 | –0.17; p = 0.045 |
| Cho/Cr | +0.35; p |
+0.32; p = 0.002 |
| Myo-In/Cr | +0.29; p = 0.004 | +0.27; p = 0.009 |
| Glx/Cr | –0.12; p |
–0.09; p |
Regression analyses identified Cho/Cr and Myo‑In/Cr as significant positive predictors of mood scores, while NAA/Cr showed a small negative contribution. Glx/Cr was not a significant predictor. The overall model accounted for 31% of the variance in mood scores (Table 4).
| Predictor | p value | |
| Cho/Cr | +0.41 | |
| Myo-In/Cr | +0.33 | 0.004 |
| NAA/Cr | –0.19 | 0.031 |
| Glx/Cr | –0.08 | 0.112 |
| R2 | 0.31 | — |
For anxiety, Cho/Cr and Myo-In/Cr emerged as significant positive predictors, whereas NAA/Cr showed a small negative contribution. Glx/Cr was not a significant predictor. The overall model explained 28% of the variance in anxiety scores (Table 5).
| Predictor | p value | |
| Cho/Cr | +0.38 | 0.002 |
| Myo-In/Cr | +0.30 | 0.009 |
| NAA/Cr | –0.17 | 0.045 |
| Glx/Cr | –0.06 | 0.138 |
| R2 | 0.28 | — |
Principal component analysis (PCA) identified two latent neurochemical components. The first component, characterized by high loadings for Cho/Cr and Myo-In/Cr, explained 41.3% of the variance and was positively associated with both mood and anxiety scores. The second component, dominated by NAA/Cr and Glx/Cr loadings, explained 28.6% of the variance and showed small inverse associations with emotional scores. Together, these components accounted for 69.9% of the total variance, suggesting distinct biochemical pathways underlying affective variability.
This study demonstrates that specific basal ganglia metabolite ratios measured via 3T 1H-MRS are significantly associated with mood and anxiety scores in healthy participants. The positive associations between Cho/Cr and Myo-In/Cr ratios and both emotional measures suggest that increased membrane turnover and glial activity may contribute to affective variability, even in nonclinical populations. These findings indicate that neurochemical markers derived from MRS are linked to emotional states, supporting their relevance for understanding subclinical affective fluctuations and informing preventive mental health strategies. In healthy individuals, higher scores on these scales are best interpreted as reflecting normal variability in emotional reactivity rather than clinical pathology, although some participants may exhibit subthreshold levels of distress that fall below diagnostic thresholds.
While some clinical studies have reported elevated Cho/Cr or Myo-In/Cr ratios in mood and anxiety disorders, the broader literature is mixed and varies across brain regions, populations, and methodological approaches. Our findings therefore should be interpreted as complementary to, rather than fully aligned with, prior clinical work. By examining a homogeneous, nonclinical sample, this study highlights that neurochemical variability is detectable even in healthy individuals, although the extent to which these patterns parallel those observed in clinical populations remains uncertain. Similarly, although emotional regulation may be conceptualized along a continuum, the present results do not directly establish continuity with the neurophysiological subtypes described in studies such as Drysdale et al. [23], which focus on functional connectivity rather than metabolite profiles.
The small inverse relationship between NAA/Cr and mood or anxiety scores suggests that reduced neuronal integrity may contribute to emotional vulnerability, although the effect size was modest. The lack of strong associations with Glx/Cr may reflect the complexity of glutamatergic signaling, which involves multiple receptor subtypes and region-specific dynamics. Sarawagi et al. [24] emphasize that glutamate variability in healthy individuals may require task-based paradigms to reveal functional relevance, while Godlewska et al. [15] report significant glutamatergic alterations in depressed patients using high-field MRS, contrasting with our nonsignificant Glx findings.
The identification of two latent neurochemical components through PCA—one reflecting glial/membrane activity (Cho, Myo-In) and the other neuronal integrity (NAA, Glx)—provides a biologically grounded framework for interpreting affective variability. Elevated Cho and Myo-In may indicate heightened membrane turnover and glial activation, processes implicated in stress reactivity and neuroinflammation, as noted by Munhoz et al. [25] and Sălcudean et al. [26]. Conversely, lower NAA may reflect subtle inefficiencies in neuronal mitochondrial function, which could predispose individuals to affective fluctuations. These observations suggest that emotional health may be shaped by a balance between glial activity and neuronal integrity.
From a translational perspective, our findings support the potential of 1H-MRS as a non-invasive biomarker tool for identifying individuals at risk for emotional dysregulation. Current psychiatric diagnostics rely heavily on self-reported and behavioral assessments; neurochemical profiling could provide objective biological markers to complement these measures, as emphasized by Miller et al. [27]. This is particularly relevant for precision psychiatry frameworks advocating integration of neuroimaging biomarkers into screening protocols, as highlighted by Williams and Whitfield Gabrieli [28]. However, given the methodological constraints of the present study, including reliance on acquisition-time MRS quality thresholds, these translational implications should be considered preliminary. It is possible that applying more stringent CRLB thresholds or excluding outlier spectra could alter the strength or direction of the observed associations, and future work should incorporate these refinements to validate the robustness of our findings.
The focus on a homogeneous cohort of young women is both a strength and a limitation. While it minimizes confounding variables such as age and sex, it raises questions about generalizability. Future studies should examine whether similar neurochemical–emotional associations are present in males, older adults, and culturally diverse populations, as suggested by Trofimova and Gaykalova [29]. Expanding to longitudinal designs would clarify whether elevated Cho/Cr and Myo-In/Cr ratios predict future emotional difficulties or represent transient states. Multimodal imaging approaches, including functional magnetic resonance imaging (fMRI) and diffusion tensor imaging (DTI), could complement MRS findings and provide deeper insights into the neural circuits underlying mood and anxiety, as proposed by Etkin et al. [30]. Finally, these findings carry implications for university health programs. Psychological distress is disproportionately high among students, as shown by Granieri et al. [18], and our results suggest that neurochemical variability may contribute to this vulnerability. Integrating neuroimaging biomarkers into student wellness initiatives could help identify individuals at risk for mood and anxiety difficulties, guiding targeted support and resilience-building interventions. This aligns with global calls for precision mental health approaches that combine biological, psychological, and social indicators, as emphasized by Comai et al. [14]. Future work may also benefit from integrating susceptibility-based measures such as quantitative susceptibility mapping (QSM), which index iron content, myelination, and microstructural properties of the basal ganglia, and may provide complementary information to metabolite-based markers such as Cho and Myo-In.
A key limitation of this study is the reliance on self-reported mood and anxiety scales that include only positively keyed items. Such measures are vulnerable to individual differences in response bias, including the general tendency to endorse or deny high ratings on negative emotional traits. Because the study is cross-sectional, this response bias may contribute to the observed correlations between metabolite levels and symptom ratings, and no causal inferences can be drawn regarding the direction of these associations. Although the present findings provide preliminary insight into neurochemical correlates of emotional functioning, future work should incorporate clinician-rated assessments or multimethod approaches and consider statistical strategies to reduce the influence of response bias when examining associations between neurochemical markers and affective symptoms.
A second limitation concerns the quality-control procedures applied to the MRS
data. Although standard acquisition-time thresholds were used, we were not able
to retrospectively apply stricter LCModel criteria such as CRLB
Finally, because the study is cross-sectional, it is not possible to determine whether elevated Cho/Cr and Myo-In/Cr ratios reflect stable vulnerability traits or transient emotional states; longitudinal MRS designs will be essential for disentangling these possibilities. Although Cho/Cr and Myo-In/Cr are moderately correlated, formal multicollinearity diagnostics (e.g., Variance Inflation Factor (VIF)) were not conducted,which may influence the precision of regression estimates.
This study demonstrates that neurochemical variability in the basal ganglia, as measured by 3T 1H-MRS, is associated with mood and anxiety scores in healthy young women. Elevated Cho/Cr and Myo-In/Cr ratios may reflect neurochemical processes linked to affective variability, suggesting that glial and membrane-related metabolites contribute to emotional functioning even in nonclinical populations.
By employing a homogeneous cohort and standardized imaging protocols, we minimized several potential confounders and improved the interpretability of metabolite–emotion associations. While these findings provide preliminary insight into neurochemical correlates of affective states, they should be interpreted cautiously given the methodological constraints and the mixed results reported in the broader clinical literature.
The potential translational value of MRS-based neurochemical profiling for mental health monitoring is promising but remains exploratory. Future research should validate these observations in larger and more diverse samples, incorporate longitudinal designs to clarify temporal relationships, and apply more rigorous MRS quality-control procedures. Such work will be essential for determining whether metabolite patterns can reliably inform early identification of emotional vulnerability and contribute to emerging precision mental health approaches.
Data are available from the corresponding author upon reasonable request.
HH conceived and designed the study. MS and HA contributed to data acquisition and imaging protocol optimization. MGH, AIA, and NAA performed statistical analysis and contributed to data interpretation under the supervision and guidance of the principal investigator. SS Contributed to data collection and interpretation, and participated in manuscript preparation and final approval. HH supervised the project, integrated all contributions, and finalized the manuscript. All authors contributed to editorial changes in the manuscript. All authors reviewed and approved the final version of the manuscript and agree to be accountable for all aspects of the work.
The study was conducted in accordance with the Declaration of Helsinki and approved by the Institutional Review Board of Princess Nourah bint Abdulrahman University (IRB Log Number: 23 0257). Written informed consent was obtained from all participants prior to enrolment.
We would like to thank all the volunteers who generously participated in this study. Their contribution and willingness to take part were essential to the completion of this research.
This work was funded by the Deanship of Scientific Research at Princess Nourah bint Abdulrahman University, through the Research Groups Program Grant no. (RGP-1444-0062).
The authors declare no conflict of interest.
References
Publisher’s Note: IMR Press stays neutral with regard to jurisdictional claims in published maps and institutional affiliations.