


 , Yingqi Li 1, Hujun Wang 1, Congxiao Wang 1, Shuyan Qie 1,*
1 Department of Rehabilitation, Beijing Rehabilitation Hospital, Capital Medical University, 100144 Beijing, China
Abstract
To investigate whether the common clinical practice of setting transcranial magnetic stimulation (TMS) parameters by scaling from the motor threshold (MT) measured at the primary motor cortex (M1) can be expected to yield comparable stimulation at complex brain regions such as the dorsolateral prefrontal cortex (DLPFC).
Personalized head models were constructed from T1- and T2-weighted magnetic resonance imaging (MRI) scans from 20 healthy elderly adults from a public Chinese dataset. SimNIBS 4.1 was used for tissue segmentation, mesh generation, and TMS electric field (E-field) simulations. A MagVenture MC-B70 figure-of-eight coil was used to simulate stimulation over the M1 and DLPFC (C3/F3, 10–10 electroencephalography (EEG) system). First, both targets were simulated at a fixed intensity of 60% of maximum stimulator output (MSO) to isolate anatomical contributions. Second, an MT-equivalent reference output framework was implemented by calibrating subject-specific output to an M1 reference E-field level of 60 mV/mm, using two calibration tracks (Mean-based and Max-based), and the DLPFC was evaluated at 80–120% of the subject-specific reference output.
Under fixed-output stimulation, the mean and robust maximum E-field magnitudes on the gray matter surface and within gray matter volume were significantly lower in the DLPFC region of interest (ROI) than in the M1 ROI (PFDR < 0.05). The normal (surface-perpendicular) component did not differ significantly between targets (PFDR > 0.05), whereas the tangential (surface-parallel) component was significantly weaker at the DLPFC (PFDR < 0.05). Under MT-equivalent scaling, increasing intensity reduced the overall magnitude gap, with approximate parity around 110% of the reference output, but a component trade-off persisted: scaling that brought tangential fields closer to the M1 reference tended to increase normal fields beyond the M1 reference.
Fixed-output simulations show target-wise differences in both E-field magnitude and component balance between the M1 and DLPFC. An M1-referenced, MT-equivalent scaling framework can reduce magnitude differences but does not necessarily align component balance at the DLPFC. These findings support target-specific, E-field–informed parameter selection and should be tested in prospective studies linking modeled E-fields to experimental readouts and clinical outcomes.
Keywords
- transcranial magnetic stimulation
- dorsolateral prefrontal cortex
- motor cortex
- finite element analysis
- computer simulation
- aged
Transcranial magnetic stimulation (TMS), as a non-invasive neuromodulation technique, has been widely applied in the treatment of various neuropsychiatric disorders such as depression, anxiety, Parkinson’s disease, stroke, and chronic pain [1, 2, 3, 4]. Its fundamental principle is based on the law of electromagnetic induction: a brief, powerful, time-varying magnetic field generated by an electromagnetic coil placed on the scalp passes unimpeded through the skull and induces a secondary electric field (E-field) within the cerebral cortex [5]. This induced E-field is the “dose” of TMS, directly altering the membrane potential of neurons to modulate their activity and improve neurological function. When applied in a repetitive pattern (rTMS), it can induce lasting effects on cortical excitability and network connectivity, which form the basis of its therapeutic effects [6]. Therefore, the characteristics of the intracranial E-field, specifically its strength, spatial distribution, and orientation, are the key physical factors determining the biological effects and clinical efficacy of TMS [7, 8, 9, 10].
Although the clinical effectiveness of TMS has been confirmed, optimizing treatment protocols still faces numerous challenges, with the precise determination of effective stimulation intensity for different brain regions being a central issue [11]. Current clinical practice and numerous studies widely rely on the motor threshold (MT) as the “gold standard” for dose calibration. MT is a physiological metric defined as the lowest stimulation intensity that reliably evokes a motor evoked potential (MEP) of a specific amplitude in a contralateral hand muscle when stimulating the hand area of the primary motor cortex (M1). This intensity is typically expressed as a percentage of the maximum stimulator output (%MSO). Subsequently, the stimulation intensity for non-motor areas, such as the dorsolateral prefrontal cortex (DLPFC) commonly targeted in depression treatment, is set as a percentage of this MT (e.g., 120% MT) [12]. This practice is widespread because the MEP provides an objective, quantifiable physiological feedback, making it possible to standardize stimulation dosage across different individuals [13, 14, 15].
However, this “one-size-fits-all” approach remains debated, as it assumes that an intensity producing a threshold-level physiological effect at M1 will yield comparable target engagement at the DLPFC. Such an approach may conflate a physiologically convenient metric with the biophysically relevant dose at the therapeutic target, which could contribute to variability in target engagement and outcomes. This fundamental misalignment between convenience and relevance may be a major source of the large inter-individual variability in efficacy observed in clinical trials. The challenge stems from significant anatomical heterogeneity across cortical regions, which manifests in several ways. First, the scalp-to-cortex distance, along with the thickness of the skull, cerebrospinal fluid (CSF), and the cortex itself, varies across the head. These tissues have different conductive and attenuating properties, directly affecting the actual E-field strength that ultimately reaches the neurons [16]. Second, the cortical folding patterns (i.e., the morphology of gyri and sulci) differ vastly between brain regions [7]. M1 is typically located on the anterior wall of the central sulcus with a relatively regular shape, whereas the gyral-sulcal structure of the DLPFC is more complex. These intricate geometric shapes greatly influence the local E-field distribution and orientation. These inter-individual and inter-regional anatomical differences collectively lead to enormous variability in the induced E-field characteristics under a fixed %MSO [16], making it extremely difficult to achieve stable and comparable biological effects. These issues are particularly pronounced in the elderly population. On one hand, older adults are a key target demographic for TMS therapies (e.g., for treating age-related cognitive decline); on the other hand, the very neuroanatomical changes associated with aging are likely to intensify E-field variations between brain regions, effectively subjecting the MT-based dosing paradigm to a critical test of its generalizability.
In recent years, the development of computational modeling and simulation techniques has provided powerful tools for accurately investigating this issue. By constructing anatomically precise, personalized head models based on individual magnetic resonance imaging (MRI) and using numerical methods like the finite element method (FEM), it is possible to simulate the TMS-induced intracranial E-field distribution with high fidelity. This approach, known as computational dosimetry, precisely calculates the physical E-field dose applied to the brain based on individual anatomy, rather than simulating a virtual physiological response. Its validity has been extensively verified through comparisons with direct physiological measurements, such as MEPs [17]. Because the induced E-field itself is the key physical entity that determines the effects of TMS, computational dosimetry can bypass the confounding variable of individual physiological reactivity. This allows for the direct assessment and comparison of the physical dose delivered to different brain regions, offering an ideal pathway to resolve the shortcomings of current dose calibration methods.
In this context, we hypothesized that regional anatomical differences between M1 and the DLPFC, potentially amplified in older adults, would lead to systematic between-target differences in the induced E-field, not only in overall magnitude but also in the balance of orientation components. Prior computational dosimetry studies have highlighted substantial inter-individual and target-wise variability in TMS-induced E-fields, as well as sensitivity to coil placement and orientation [7, 11, 13, 14]. Building on this literature, our contribution is to quantify target-wise differences in an older-adult cohort and to explicitly bridge fixed-output comparisons with an MT-equivalent, M1-referenced scaling analysis that interrogates both E-field magnitude and component balance. To test this, we combined two complementary modeling perspectives: a fixed-output comparison to isolate anatomical effects, and an M1-referenced intensity-scaling analysis based on an MT-equivalent reference output to approximate how clinical protocols scale intensity from M1 to non-motor targets. Together, these analyses aim to clarify what aspects of the E-field can or cannot be matched across targets by intensity scaling alone, and to inform the development of more individualized, target-aware dosing strategies.
This study selected T1-weighted (T1w) and T2-weighted (T2w) MRI images of 20
healthy elderly participants (age: 65.45
MRI acquisition parameters (CHCP structural MRI). The CHCP structural images
were acquired on a 3T Siemens MRI system using a human connectome project
(HCP)-harmonized structural protocol. Specifically, T1w images were obtained
using a 3D MPRAGE sequence (repetition time [TR] = 2400 ms, echo time [TE] = 2.14
ms, inversion time [TI] = 1000 ms, flip angle = 8°, field of view [FOV]
= 224
All head modeling and E-field simulations were performed using SimNIBS 4.1 software (Danish Research Centre for Magnetic Resonance, Copenhagen, Denmark), an open-source benchmark tool in the field of neuromodulation simulation whose integrated algorithms and pipelines have been validated and applied in numerous studies [7, 17, 19]. We used the built-in charm pipeline for automated multi-tissue segmentation of the T1w and T2w images and generation of high-quality tetrahedral meshes, ultimately constructing anatomically highly realistic personalized head models comprising nine tissue types. These nine tissues included: scalp, compact bone, spongy bone, CSF, gray matter (GM), white matter (WM), eyeballs, blood vessels, and muscles.
To ensure the highest anatomical fidelity, we performed manual review and correction of the automated segmentation results for each model using the ITK-Snap open-source software (Version 4.2, University of Pennsylvania, Philadelphia, PA, USA). This step is crucial for accurately defining tissue boundaries, especially at interfaces with large conductivity differences (e.g., skull and CSF), as segmentation accuracy directly impacts the reliability of E-field calculations. Following the study by Puonti et al. [20], we assigned internationally recognized isotropic conductivity values (in S/m) to each tissue layer: scalp 0.465, compact bone 0.008, spongy bone 0.025, CSF 1.654, GM 0.275, WM 0.126, eyeballs 0.5, blood vessels 0.6, and muscle 0.16. These standardized parameters ensure the electromagnetic similarity between the models and a real human head.
Field simulations were performed using a MagVenture MC-B70 figure-of-eight coil (MagVenture A/S, Farum, Denmark), widely used in both clinical and research settings due to its optimal balance between stimulation focality and penetration depth [21]. Coil placement was guided by the international 10–10 electroencephalography (EEG) system [22], with the M1 and DLPFC targets centered at C3 and F3, respectively—both of which are clinically recognized sites validated for these cortical regions [23]. A coil-to-scalp distance of 4 mm was maintained across all models, a standard parameter in computational modeling studies, to account for hair and scalp thickness [23]. The coil handle was oriented 45° postero-laterally to the midline to induce a posterior-to-anterior (PA) cortical current. This orientation is optimized to align the E-field approximately perpendicular to the precentral gyrus in the M1, which is the gold standard for maximizing neural recruitment. By maintaining this consistent angle for both targets, we can purely evaluate how a standardized clinical setting interacts with the distinct sulcal geometries of the M1 and DLPFC. This positioning approach, based on international standards, helps ensure the reproducibility and clinical relevance of the study’s findings by accurately reflecting real-world clinical practice.
In SimNIBS, stimulation intensity is defined by the rate of change of the coil current (dI/dt), where 100% MSO for the MC-B70 coil corresponds to 149 A/µs [24]. To facilitate a direct biophysical comparison across different individual models, an initial fixed intensity of 60% MSO was applied to all subjects. This intensity serves as a supra-threshold stimulus for most individuals, ensuring a robust E-field for comparative analysis of anatomical influences while remaining within typical clinical treatment ranges [24, 25]. Unlike MT-based methods, the fixed intensity strategy eliminates the confounding influence of individual physiological variability, allowing for a focused assessment of how anatomical structure dictates E-field distribution.
To quantify the E-field characteristics at the cortical targets, we defined a spherical region of interest (ROI) with a 10-mm radius at each target. This ROI was determined as the intersection of the sphere and the subject-specific gray matter mask, ensuring it encompassed the entire thickness of the gray matter layer within that radius. The 10-mm radius follows standard conventions in E-field modeling and is supported by a recent large-scale systematic review [26], which demonstrated that this size effectively captures focal stimulation hotspots while preventing the signal attenuation associated with larger ROIs.
The ROI was centered at the point on the gray matter surface closest to the
geometric center of the coil. From each ROI, we extracted the mean E-field
magnitude on the surface and within the volume, as well as the robust maximum
E-field magnitude (defined as the 99.9th percentile) on the surface and within
the volume. Additionally, the mean tangential and normal (perpendicular) E-field
components were extracted from the gray matter surface to further investigate the
spatial orientation of the field. Furthermore, the normal component was
decomposed into negative (inward-directed; E𝑛
While the initial simulations used a fixed stimulator output to isolate anatomical effects, clinical TMS dosing is commonly individualized using the MT measured at M1 and then scaled by a fixed factor (e.g., 120% MT) for non-motor targets. To better mirror this M1-referenced scaling logic in a modeling setting, we implemented an MT-equivalent reference output approach. Following prior work on E-field–based dosing [27], we used an M1 reference E-field magnitude level of 60 mV/mm. For each subject, we estimated the stimulator output (%MSO) required for the M1 ROI to reach this reference level by linearly scaling from the initial simulation, and treated the resulting %MSO as the subject-specific 100% MT-equivalent reference output for subsequent analyses.
Because there is no single consensus on how the reference level should be defined within an ROI, we considered two practical calibration choices that reflect common reporting preferences in the literature. In the Mean-based calibration, the subject-specific reference output was computed such that the M1 ROI mean E-field magnitude equaled 60 mV/mm. In the Max-based calibration, the reference output was computed such that the M1 ROI robust maximum E-field magnitude equaled 60 mV/mm. We used the 99.9th percentile as a robust maximum to reduce sensitivity to numerical outliers compared with a single-voxel peak. Under each calibration choice, DLPFC was simulated at 80–120% of the subject-specific reference output to characterize how intensity scaling affects DLPFC E-field magnitude and its normal/tangential components.
All statistical analyses were performed using SPSS 25.0 software (IBM Corp.,
Armonk, NY, USA). The Shapiro-Wilk test confirmed normality of all E-field
parameters. Paired-samples t-tests were used to compare E-field
magnitude measures and components between the M1 and DLPFC targets. To control
for multiple comparisons across the set of E-field outcomes, p-values
were adjusted using the Benjamini–Hochberg false discovery rate (FDR) procedure.
Effect sizes are reported as Hedges’ g to correct for small-sample bias. The 95%
confidence intervals (CIs) of Hedges’ g were estimated using bootstrap resampling
(5000 iterations). For the intensity-scaling analysis, DLPFC was evaluated at
five dose levels (80%, 90%, 100%, 110%, and 120% of the subject-specific
MT-equivalent reference output) under each calibration scheme (Mean-based and
Max-based). At each dose level, paired-samples t-tests compared DLPFC
values against the corresponding M1 reference level defined at 100% within the
same calibration scheme. This yielded 80 comparisons in total (5 dose levels
Regarding the E-field magnitude, the mean E-field magnitude on the ROI gray matter surface was 10.30 mV/mm lower at the DLPFC than at M1. This difference was statistically significant (P𝐹𝐷𝑅 = 0.047), with a medium effect size (Hedges’ g = 0.507) (Table 1, Fig. 1A and Fig. 2). Furthermore, the robust maximum E-field magnitude on the ROI gray matter surface was 17.34 mV/mm lower at the DLPFC, a highly significant difference (P𝐹𝐷𝑅 = 0.008) with a large effect size (Hedges’ g = 0.830), suggesting a substantial difference between the targets (Table 1, Fig. 1B and Fig. 2).
| E-field | M1 target (Mean |
DLPFC target (Mean |
Mean difference (95% CI) | t | P𝑟𝑎𝑤 | P𝐹𝐷𝑅 (q) | Hedges’ g (95% CI) |
| ROI gray matter surface | |||||||
| Mean E-field | 141.42 |
131.12 |
10.30 (1.17, 19.44) | 2.361 | 0.029# | 0.047* | 0.507 (0.087, 1.121) |
| Robust max E-field | 169.91 |
152.57 |
17.34 (7.95, 26.73) | 3.866 | 0.001# | 0.008* | 0.830 (0.430, 1.462) |
| ROI gray matter volume | |||||||
| Mean E-field | 136.44 |
124.74 |
11.70 (3.36, 20.04) | 2.935 | 0.008# | 0.017* | 0.630 (0.196, 1.300) |
| Robust max E-field | 149.22 |
136.19 |
13.02 (4.81, 21.24) | 3.318 | 0.004# | 0.014* | 0.712 (0.340, 1.216) |
| Spatial Distribution of E-field magnitude on the ROI Gray Matter Surface | |||||||
| Normal E-field component | 52.53 |
55.15 |
–2.61 (–11.62, 6.39) | –0.608 | 0.551 | 0.629 | –0.130 (–0.582, 0.327) |
| Negative normal E-field component | –56.70 |
–62.54 |
5.84 (–4.85, 16.52) | 1.143 | 0.267 | 0.356 | 0.245 (–0.182, 0.695) |
| Positive normal E-field component | 46.62 |
47.06 |
–0.44 (–8.54, 7.65) | –0.115 | 0.910 | 0.910 | –0.025 (–0.460, 0.442) |
| Tangential E-field component | 122.29 |
107.52 |
14.77 (4.97, 24.58) | 3.154 | 0.005# | 0.014* | 0.677 (0.247, 1.328) |
#: P𝑟𝑎𝑤
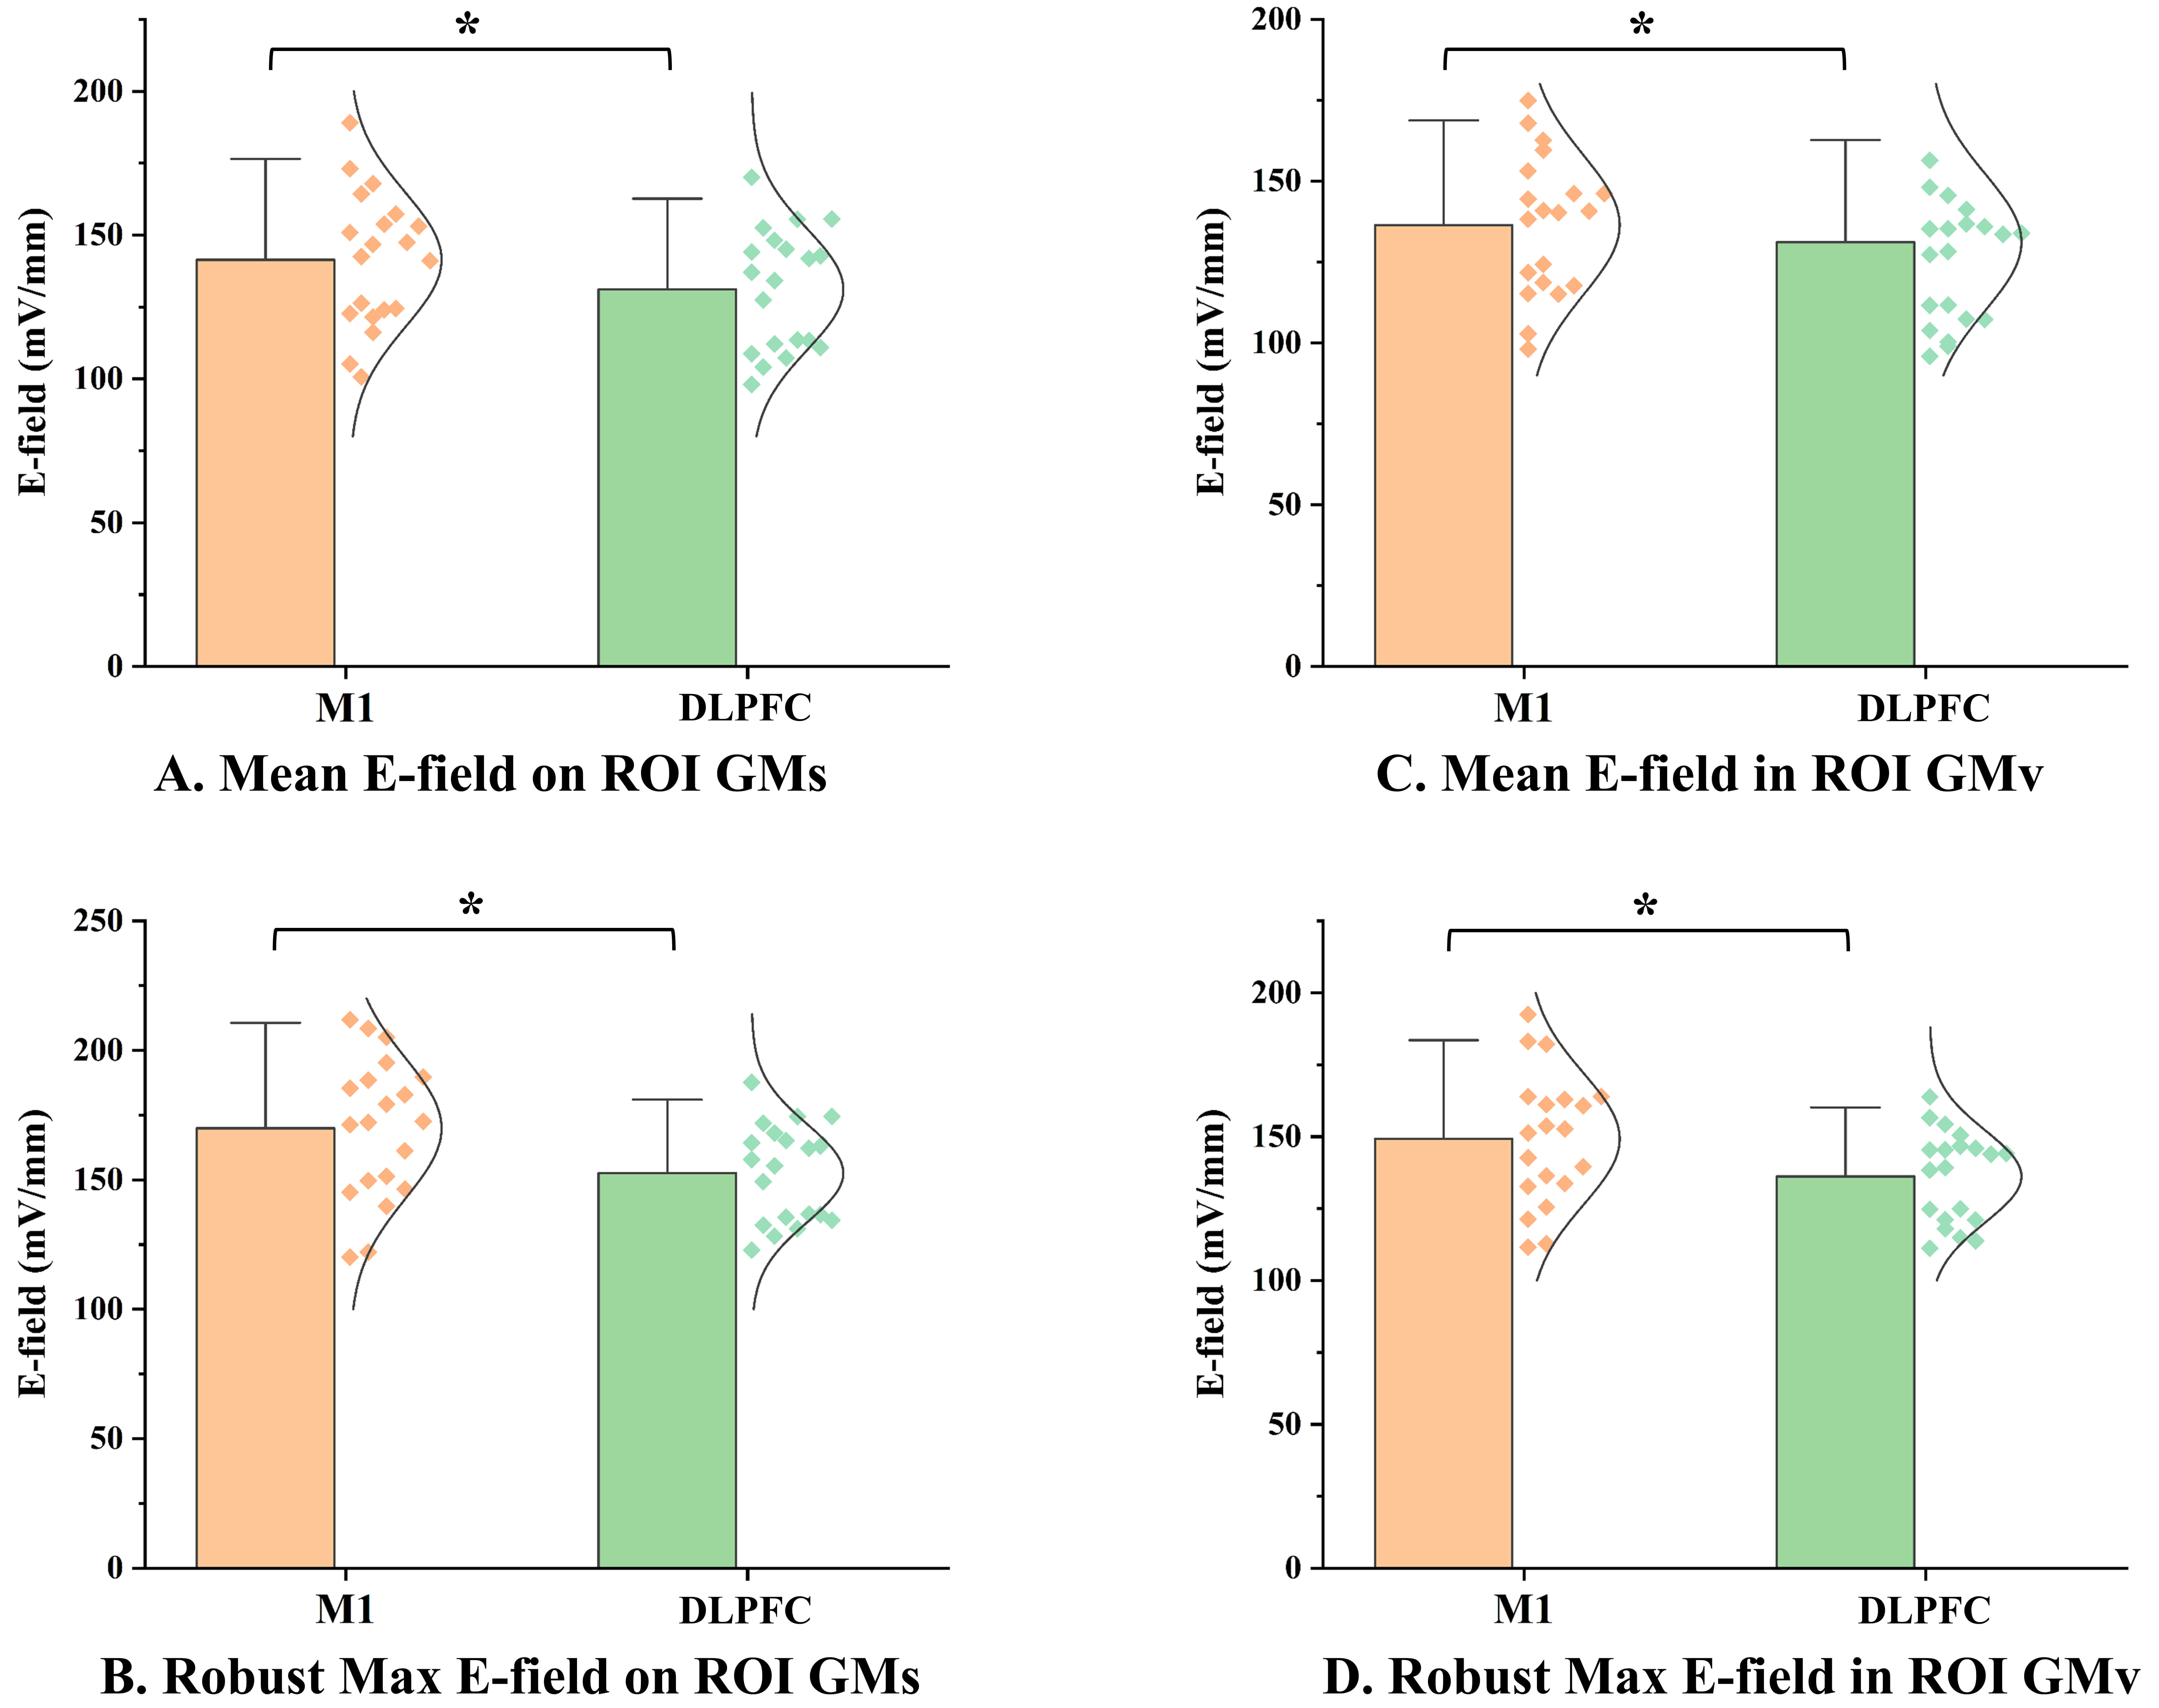 Fig. 1.
Comparison of E-field magnitudes between M1 and DLPFC targets.
(A) Mean E-field magnitude on the ROI gray matter surface. (B) Robust maximum
E-field magnitude on the ROI gray matter surface. (C) Mean E-field magnitude
within the ROI gray matter volume. (D) Robust maximum E-field magnitude within
the ROI gray matter volume. The scatter plots represent data from individual participants (n = 20). *: P𝐹𝐷𝑅
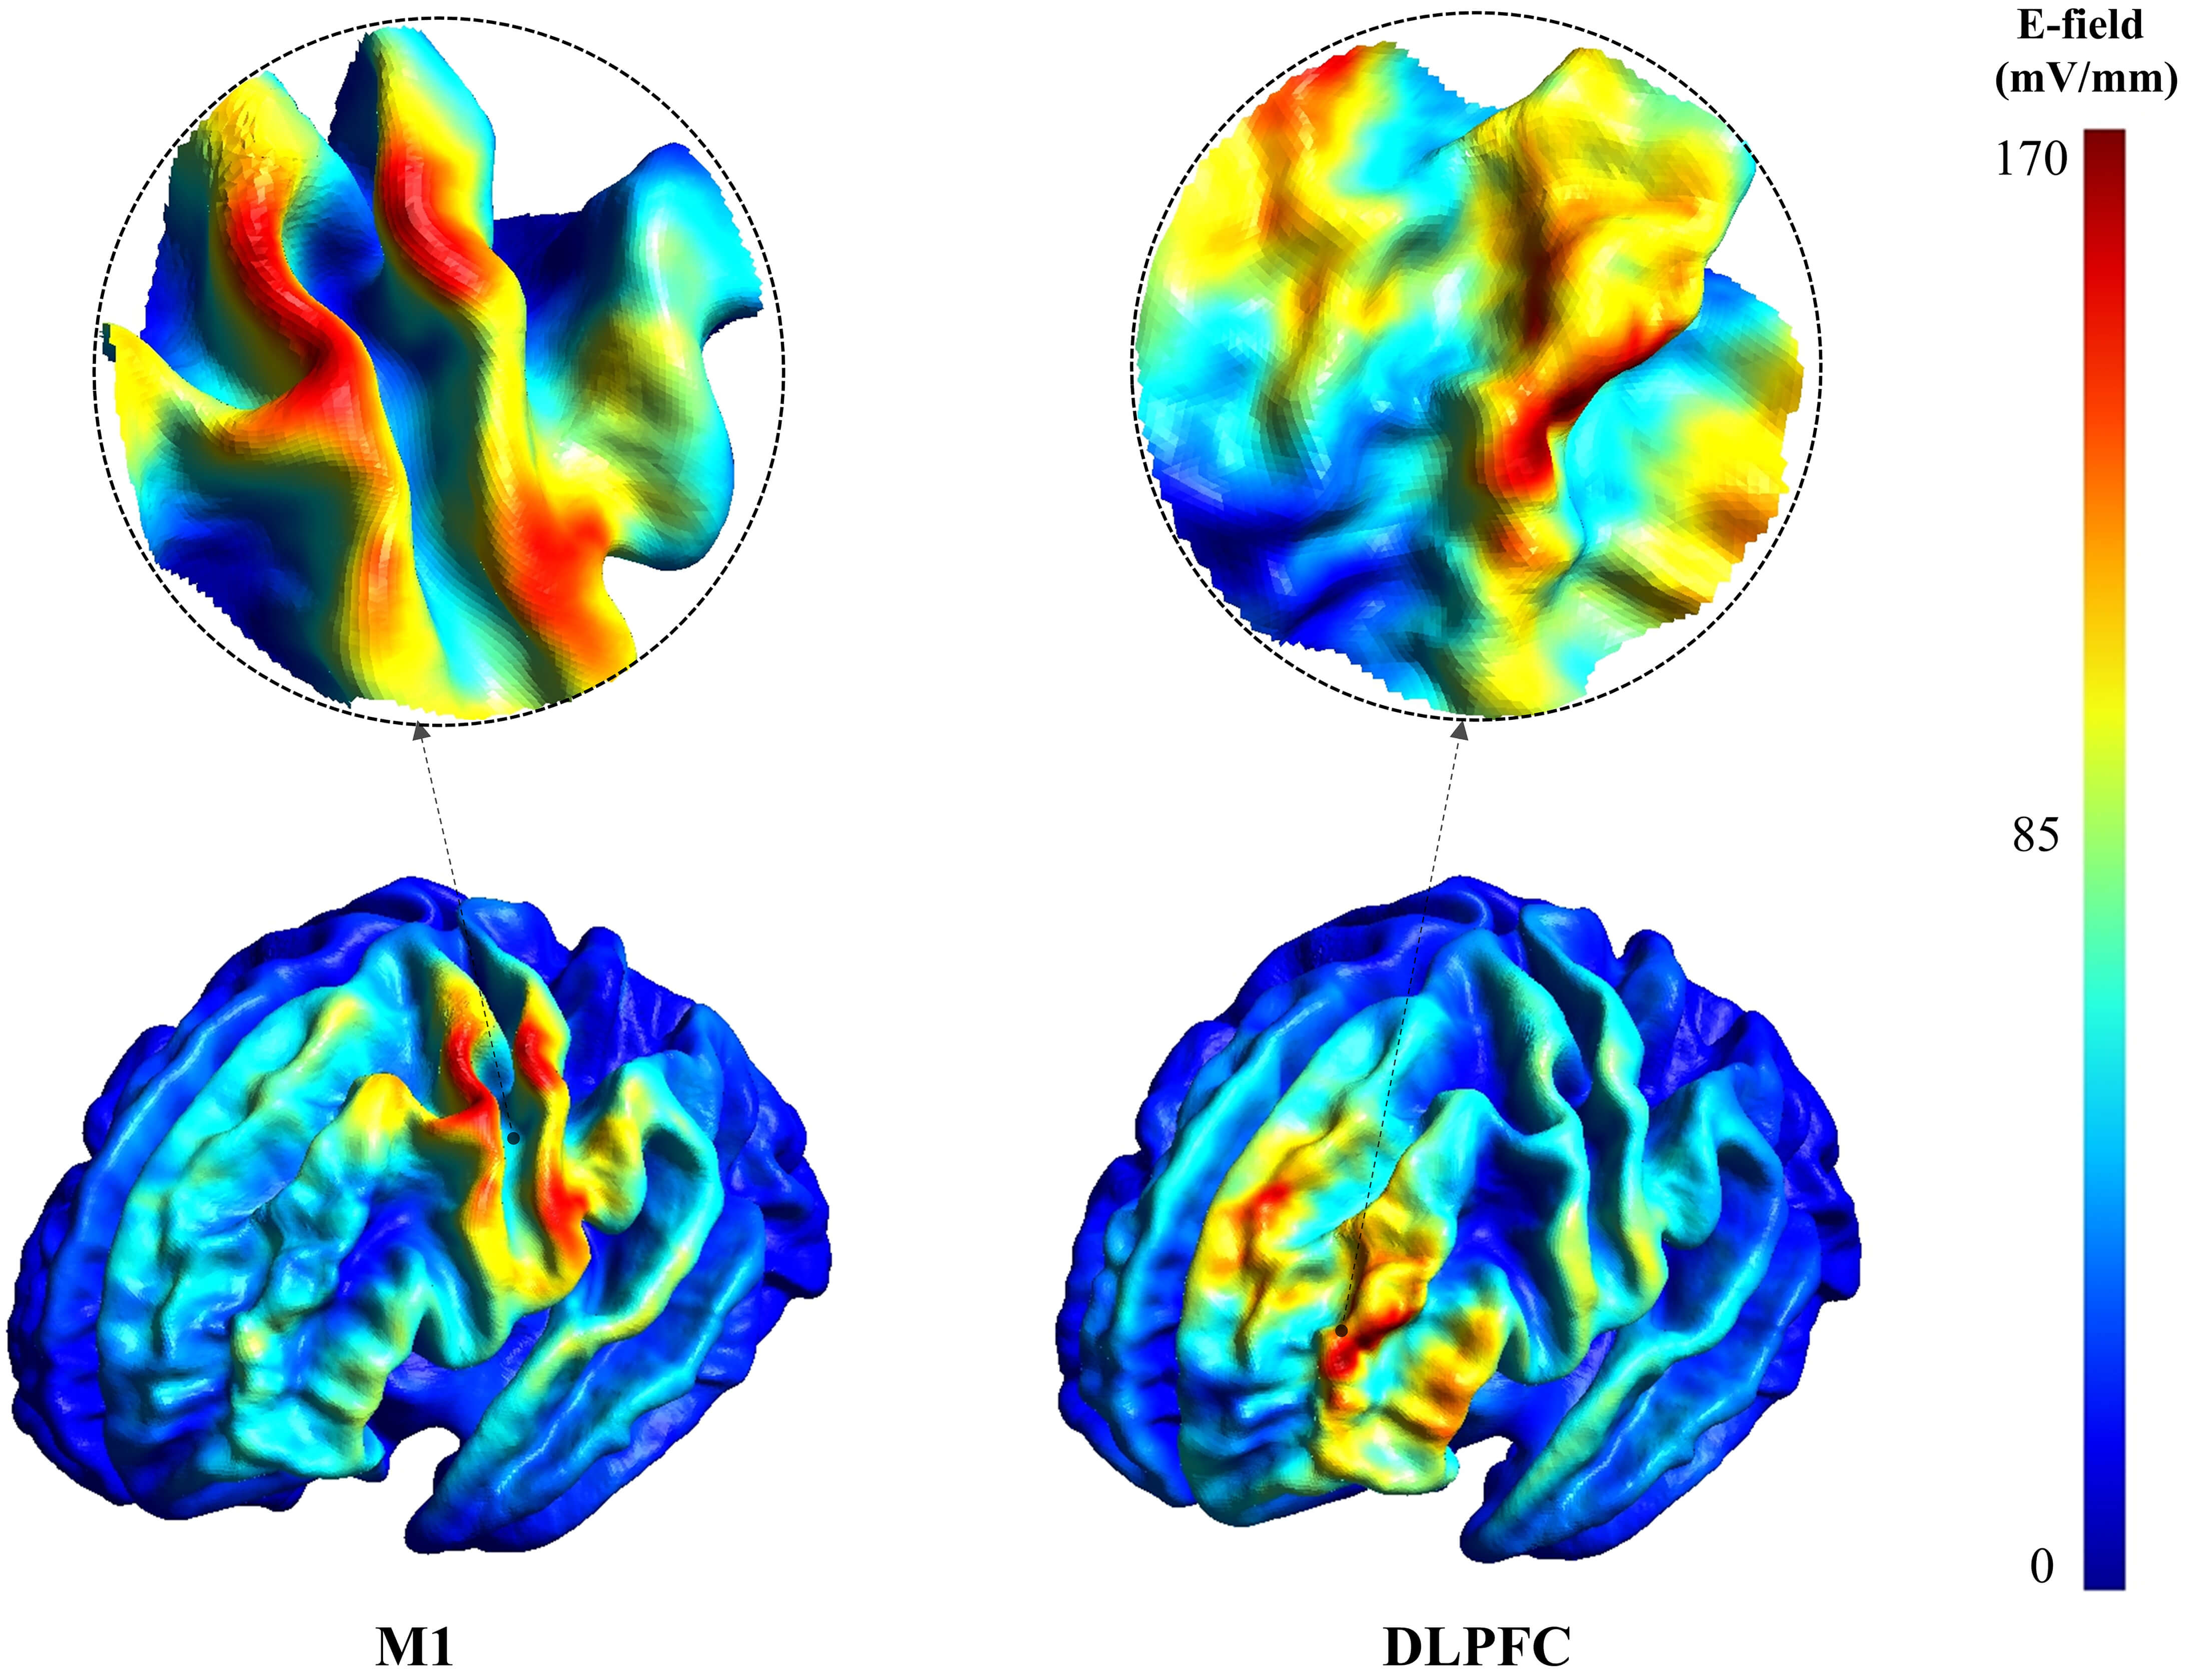 Fig. 2.
Representative E-field magnitude maps for stimulation over M1 and DLPFC. Color indicates E-field magnitude (mV/mm) on the cortical surface; the color scale is shown on the right. The same scale was used for M1 and DLPFC within this figure. Circular insets provide magnified views of the electric field distribution in the corresponding targeted regions.
Within the gray matter volume, a similar pattern was observed. The mean E-field magnitude within the DLPFC ROI volume was 11.70 mV/mm lower than in the M1 ROI (P𝐹𝐷𝑅 = 0.017, Hedges’ g = 0.630), and the robust maximum E-field magnitude was 13.02 mV/mm lower (P𝐹𝐷𝑅 = 0.014, Hedges’ g = 0.712) (Table 1, Fig. 1C,D). These results consistently demonstrate that, under identical stimulation intensity, the E-field magnitude induced at the DLPFC is significantly weaker than at M1, both in terms of average and robust maximum values, with effect sizes ranging from medium to large.
Analysis of the E-field’s spatial distribution revealed no significant
differences between the two regions in the mean normal E-field component or its
positive and negative sub-components (all P𝐹𝐷𝑅
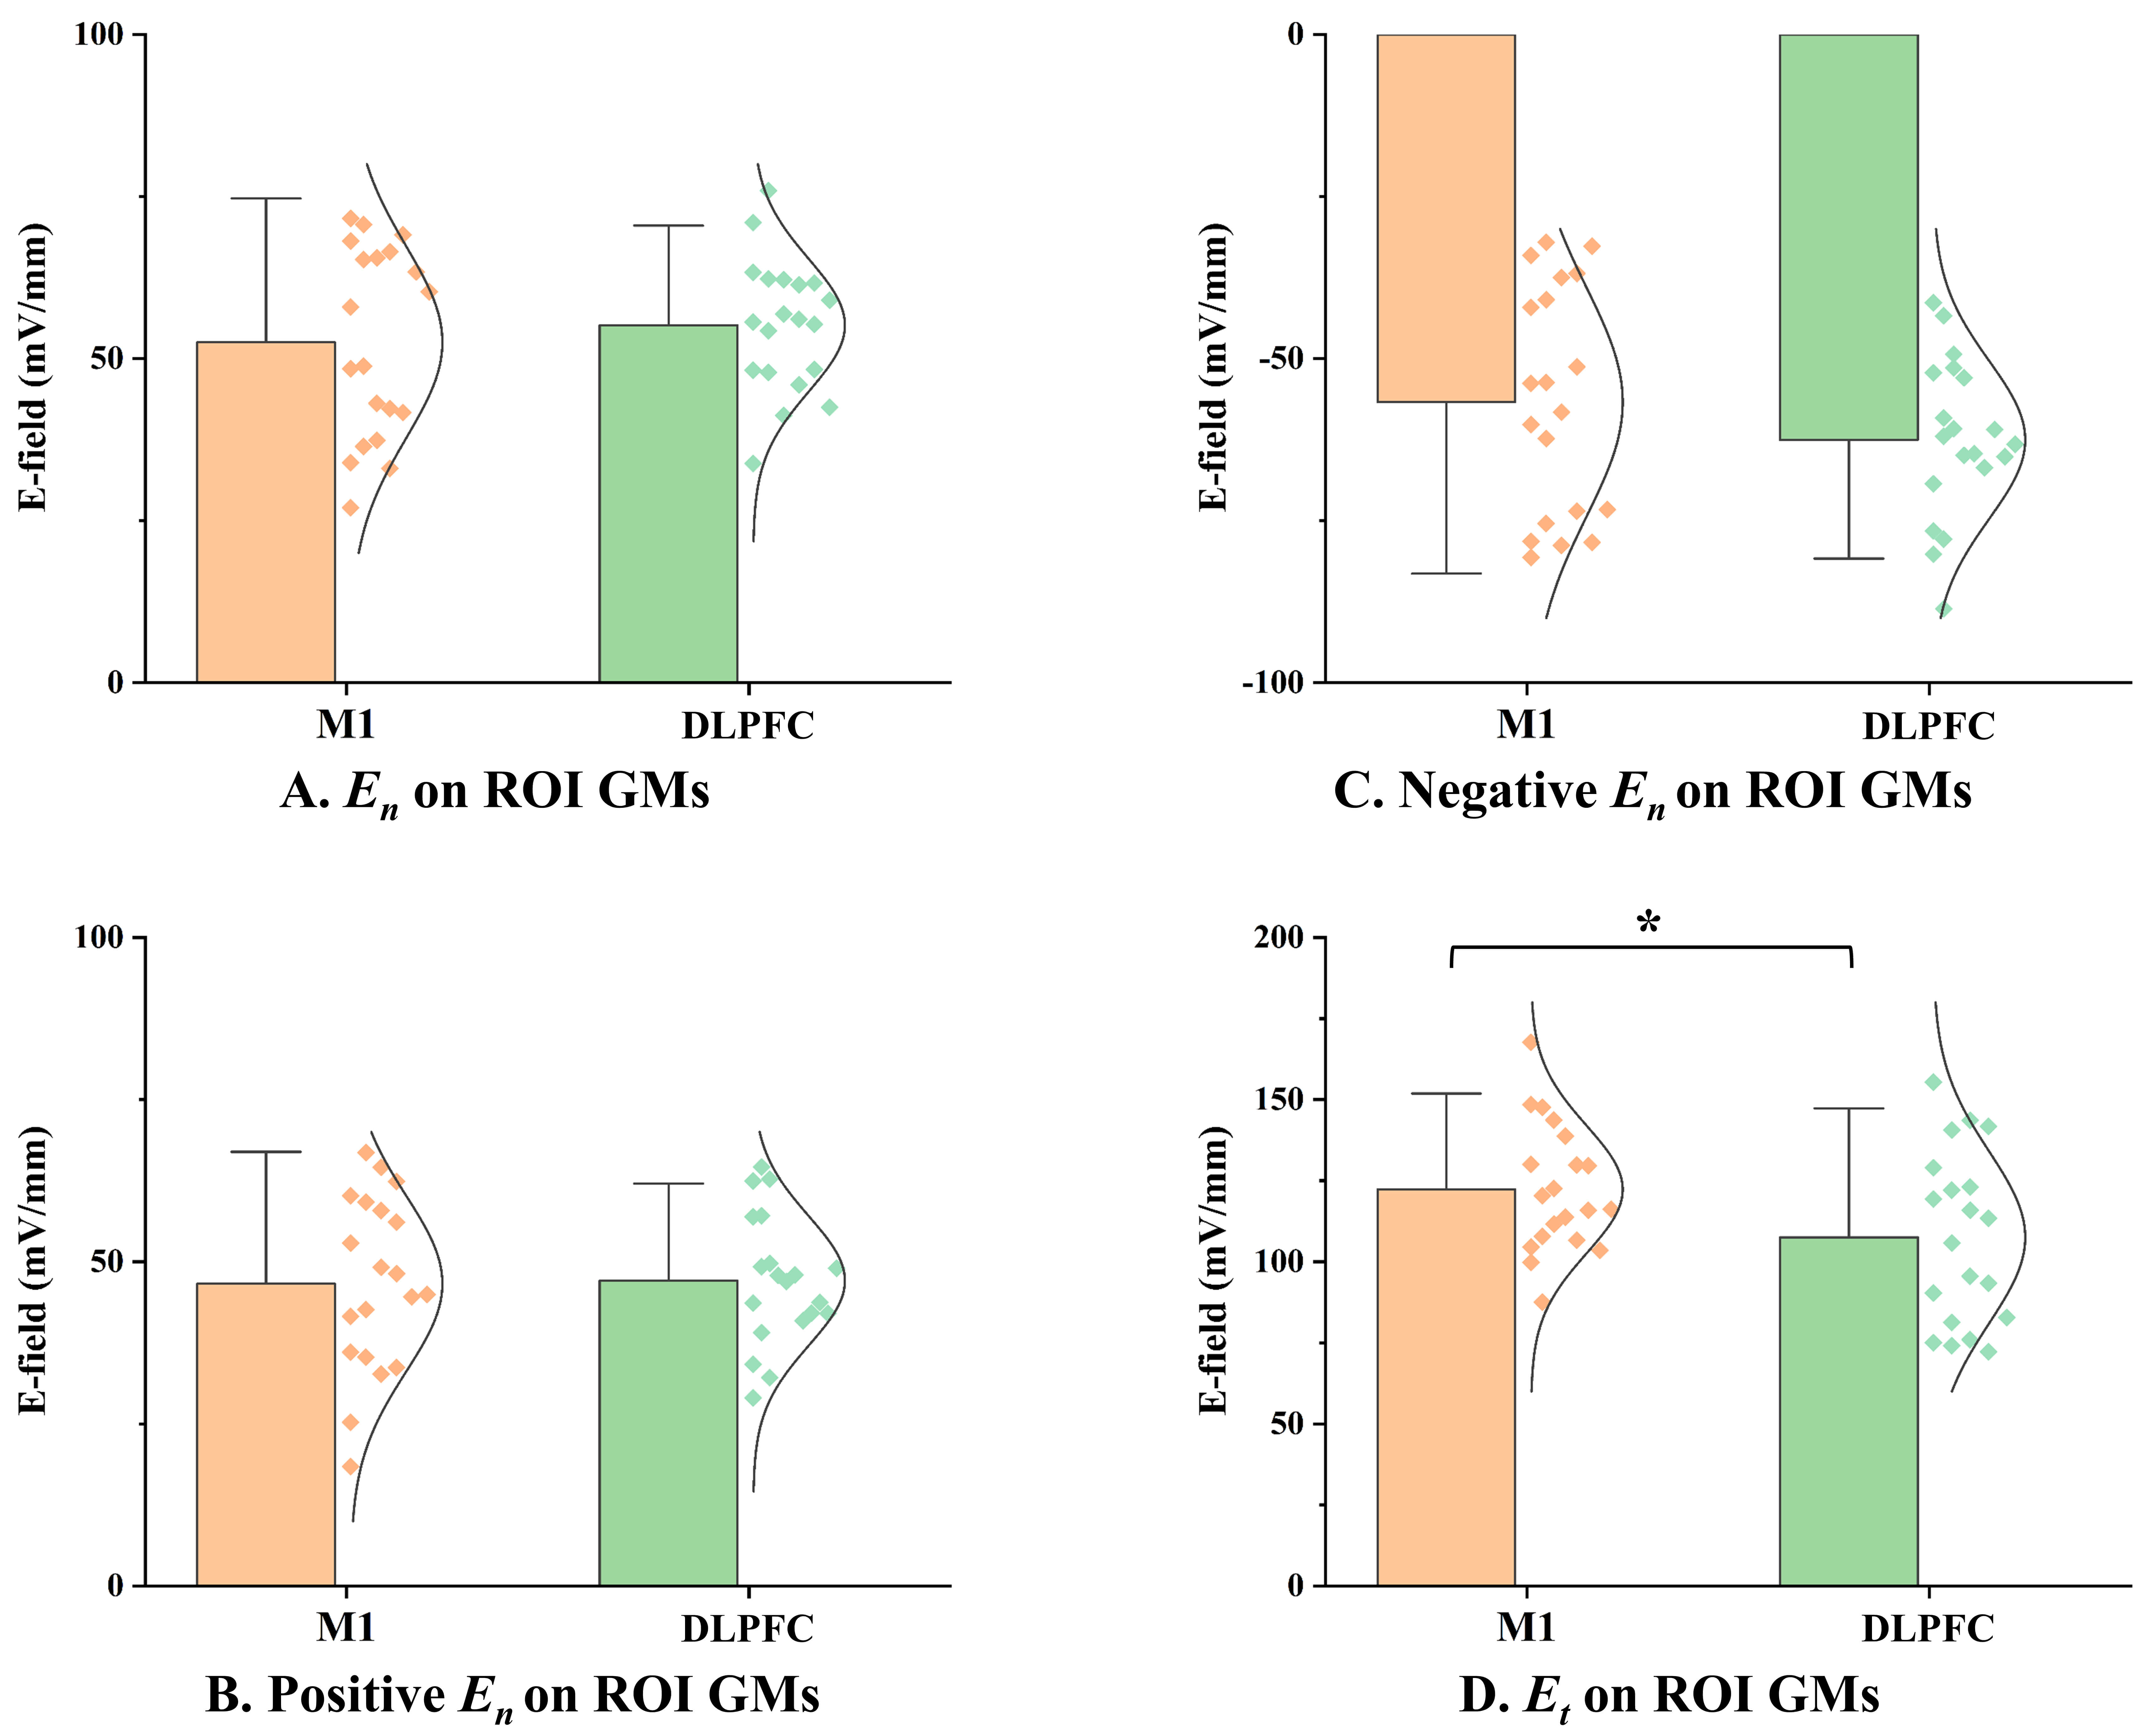 Fig. 3.
Comparison of E-field spatial components between M1 and DLPFC
targets. (A) Normal E-field component magnitude on the ROI gray matter surface.
(B) Positive normal E-field component magnitude on the ROI gray matter surface.
(C) Negative normal E-field component magnitude on the ROI gray matter surface.
(D) Tangential E-field component magnitude on the ROI gray matter surface. *:
P𝐹𝐷𝑅
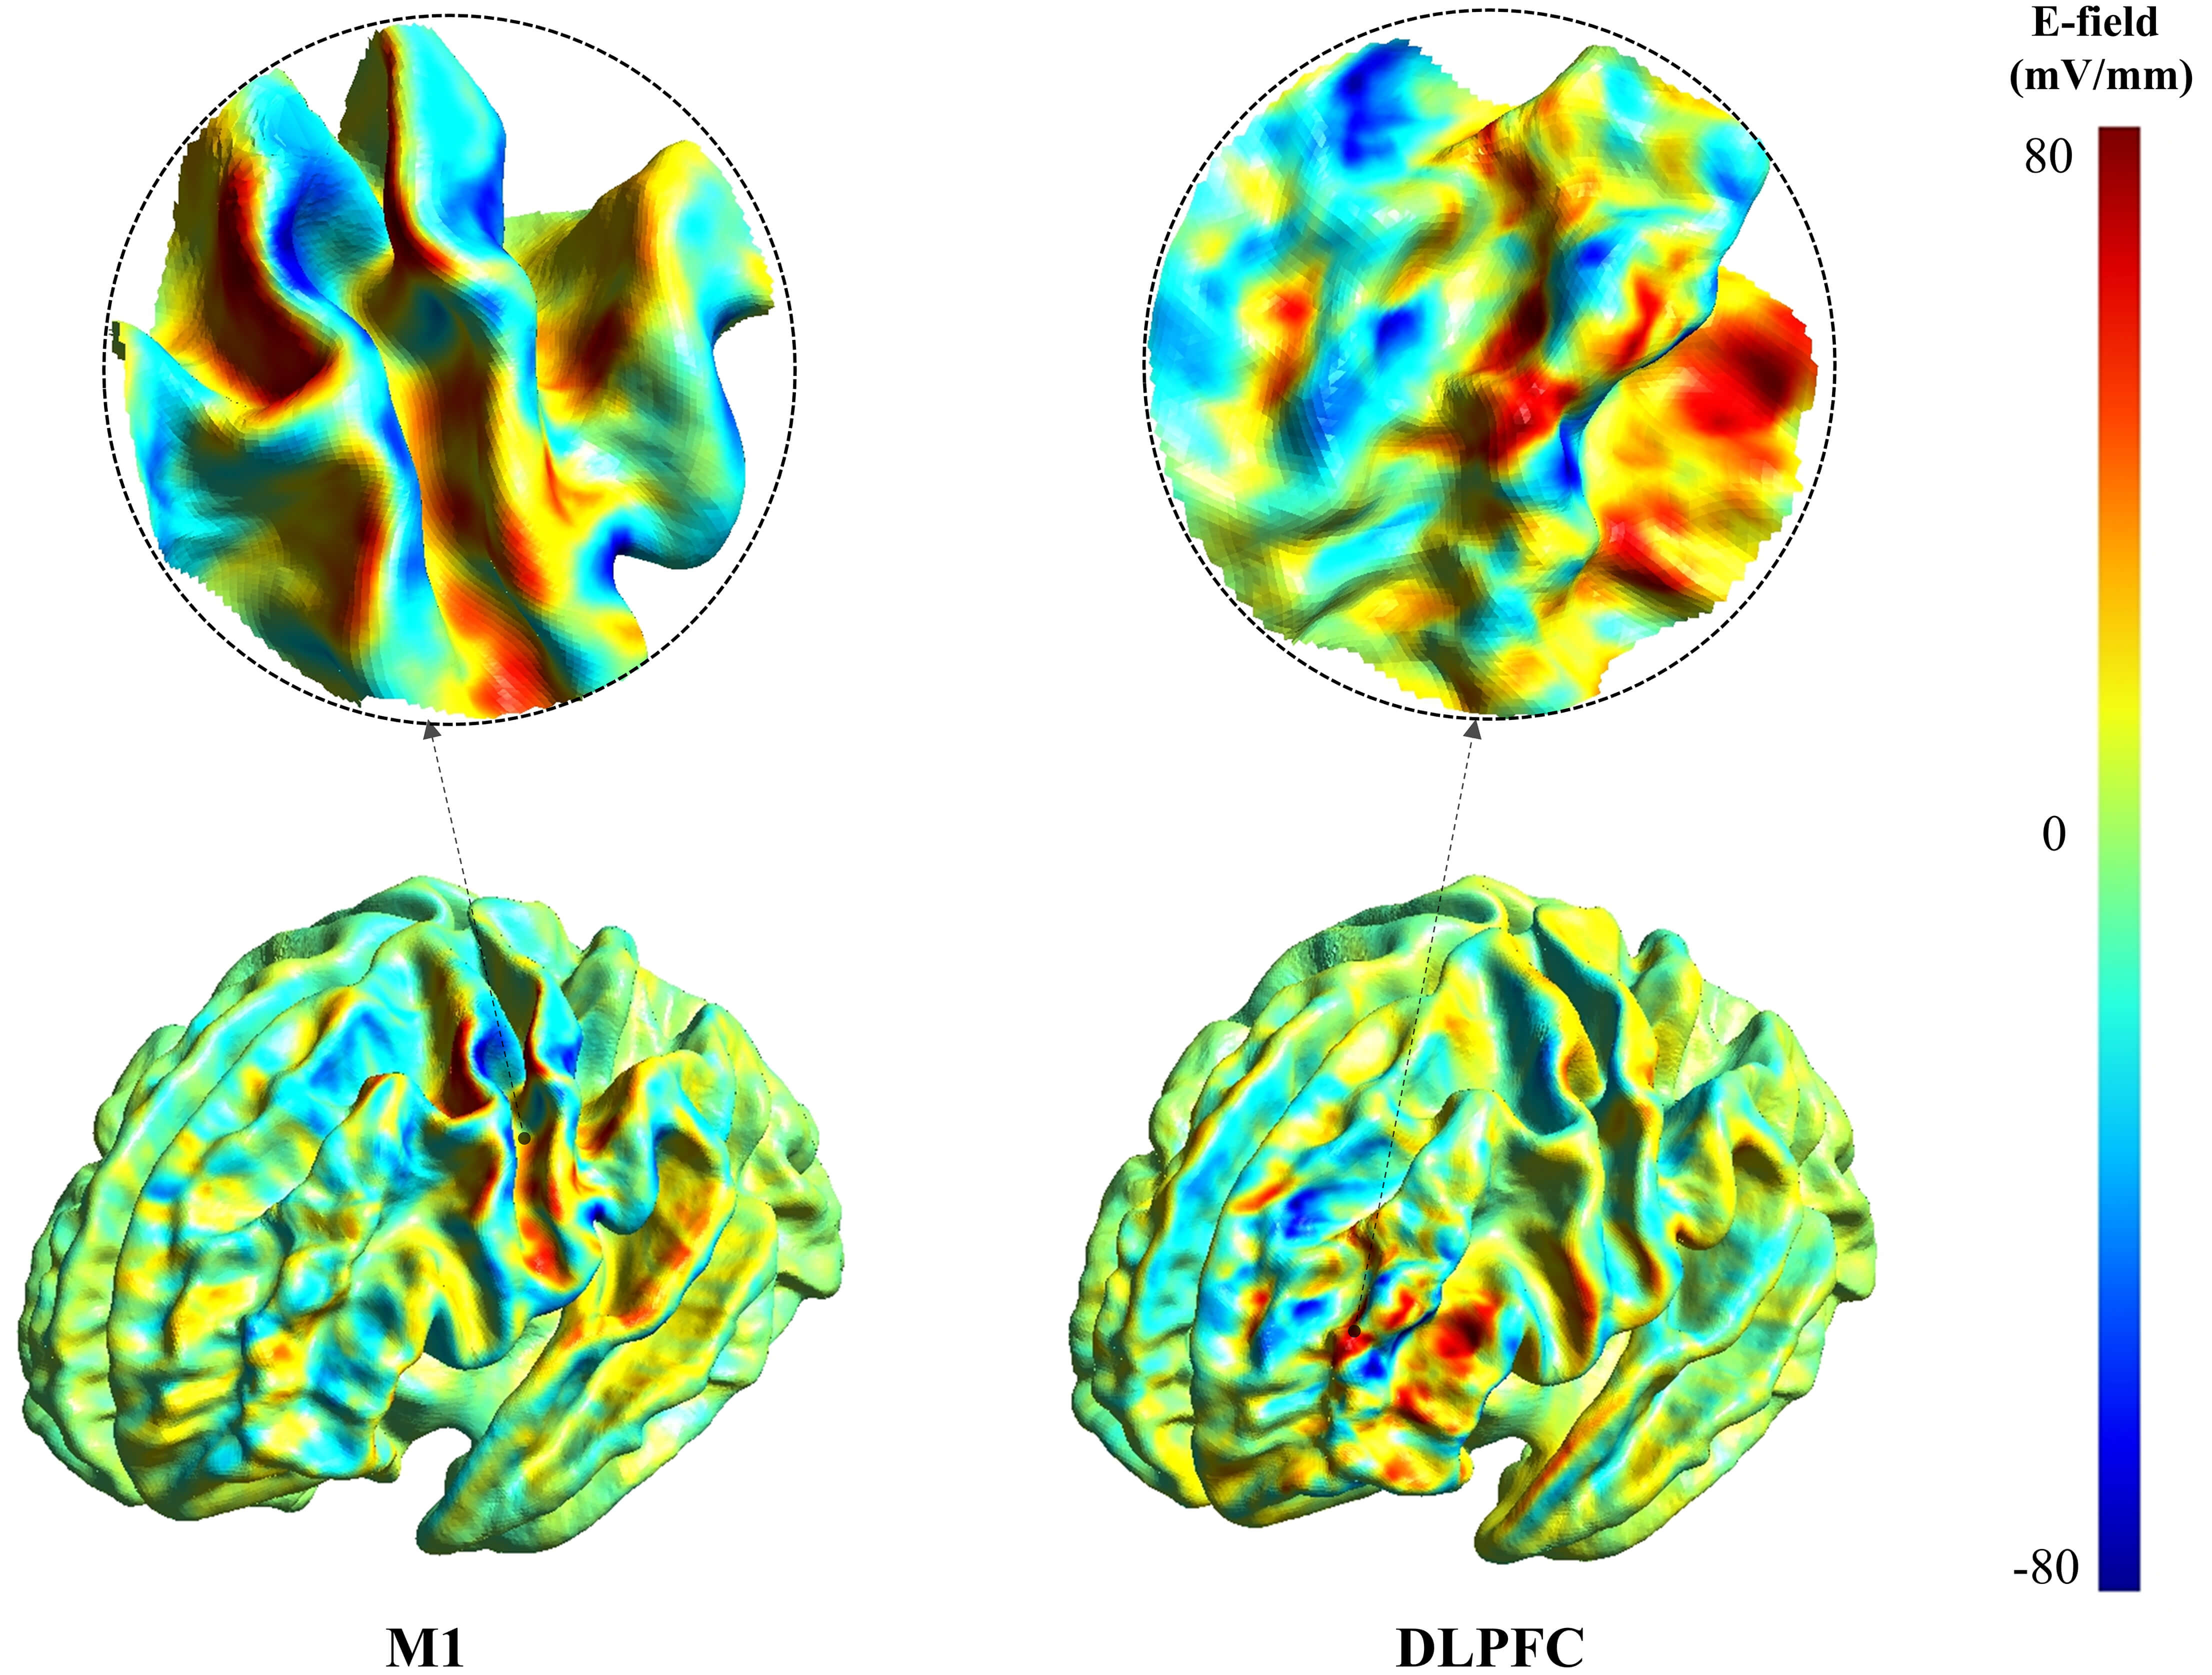 Fig. 4.
Representative maps of the normal (surface-perpendicular)
E-field component for M1 and DLPFC stimulation. Color indicates the signed
normal component (mV/mm). Positive values denote outward-directed fields (E𝑛
In stark contrast, the mean tangential E-field component on the ROI gray matter surface was 14.77 mV/mm lower at the DLPFC compared to M1. This difference was statistically significant (P𝐹𝐷𝑅 = 0.014) with a medium-to-large effect size (Hedges’ g = 0.677) (Table 1, Fig. 3D and Fig. 5). This finding suggests that while the normal component was similar, the E-field component magnitude oriented parallel to the cortical surface was significantly weaker at the DLPFC.
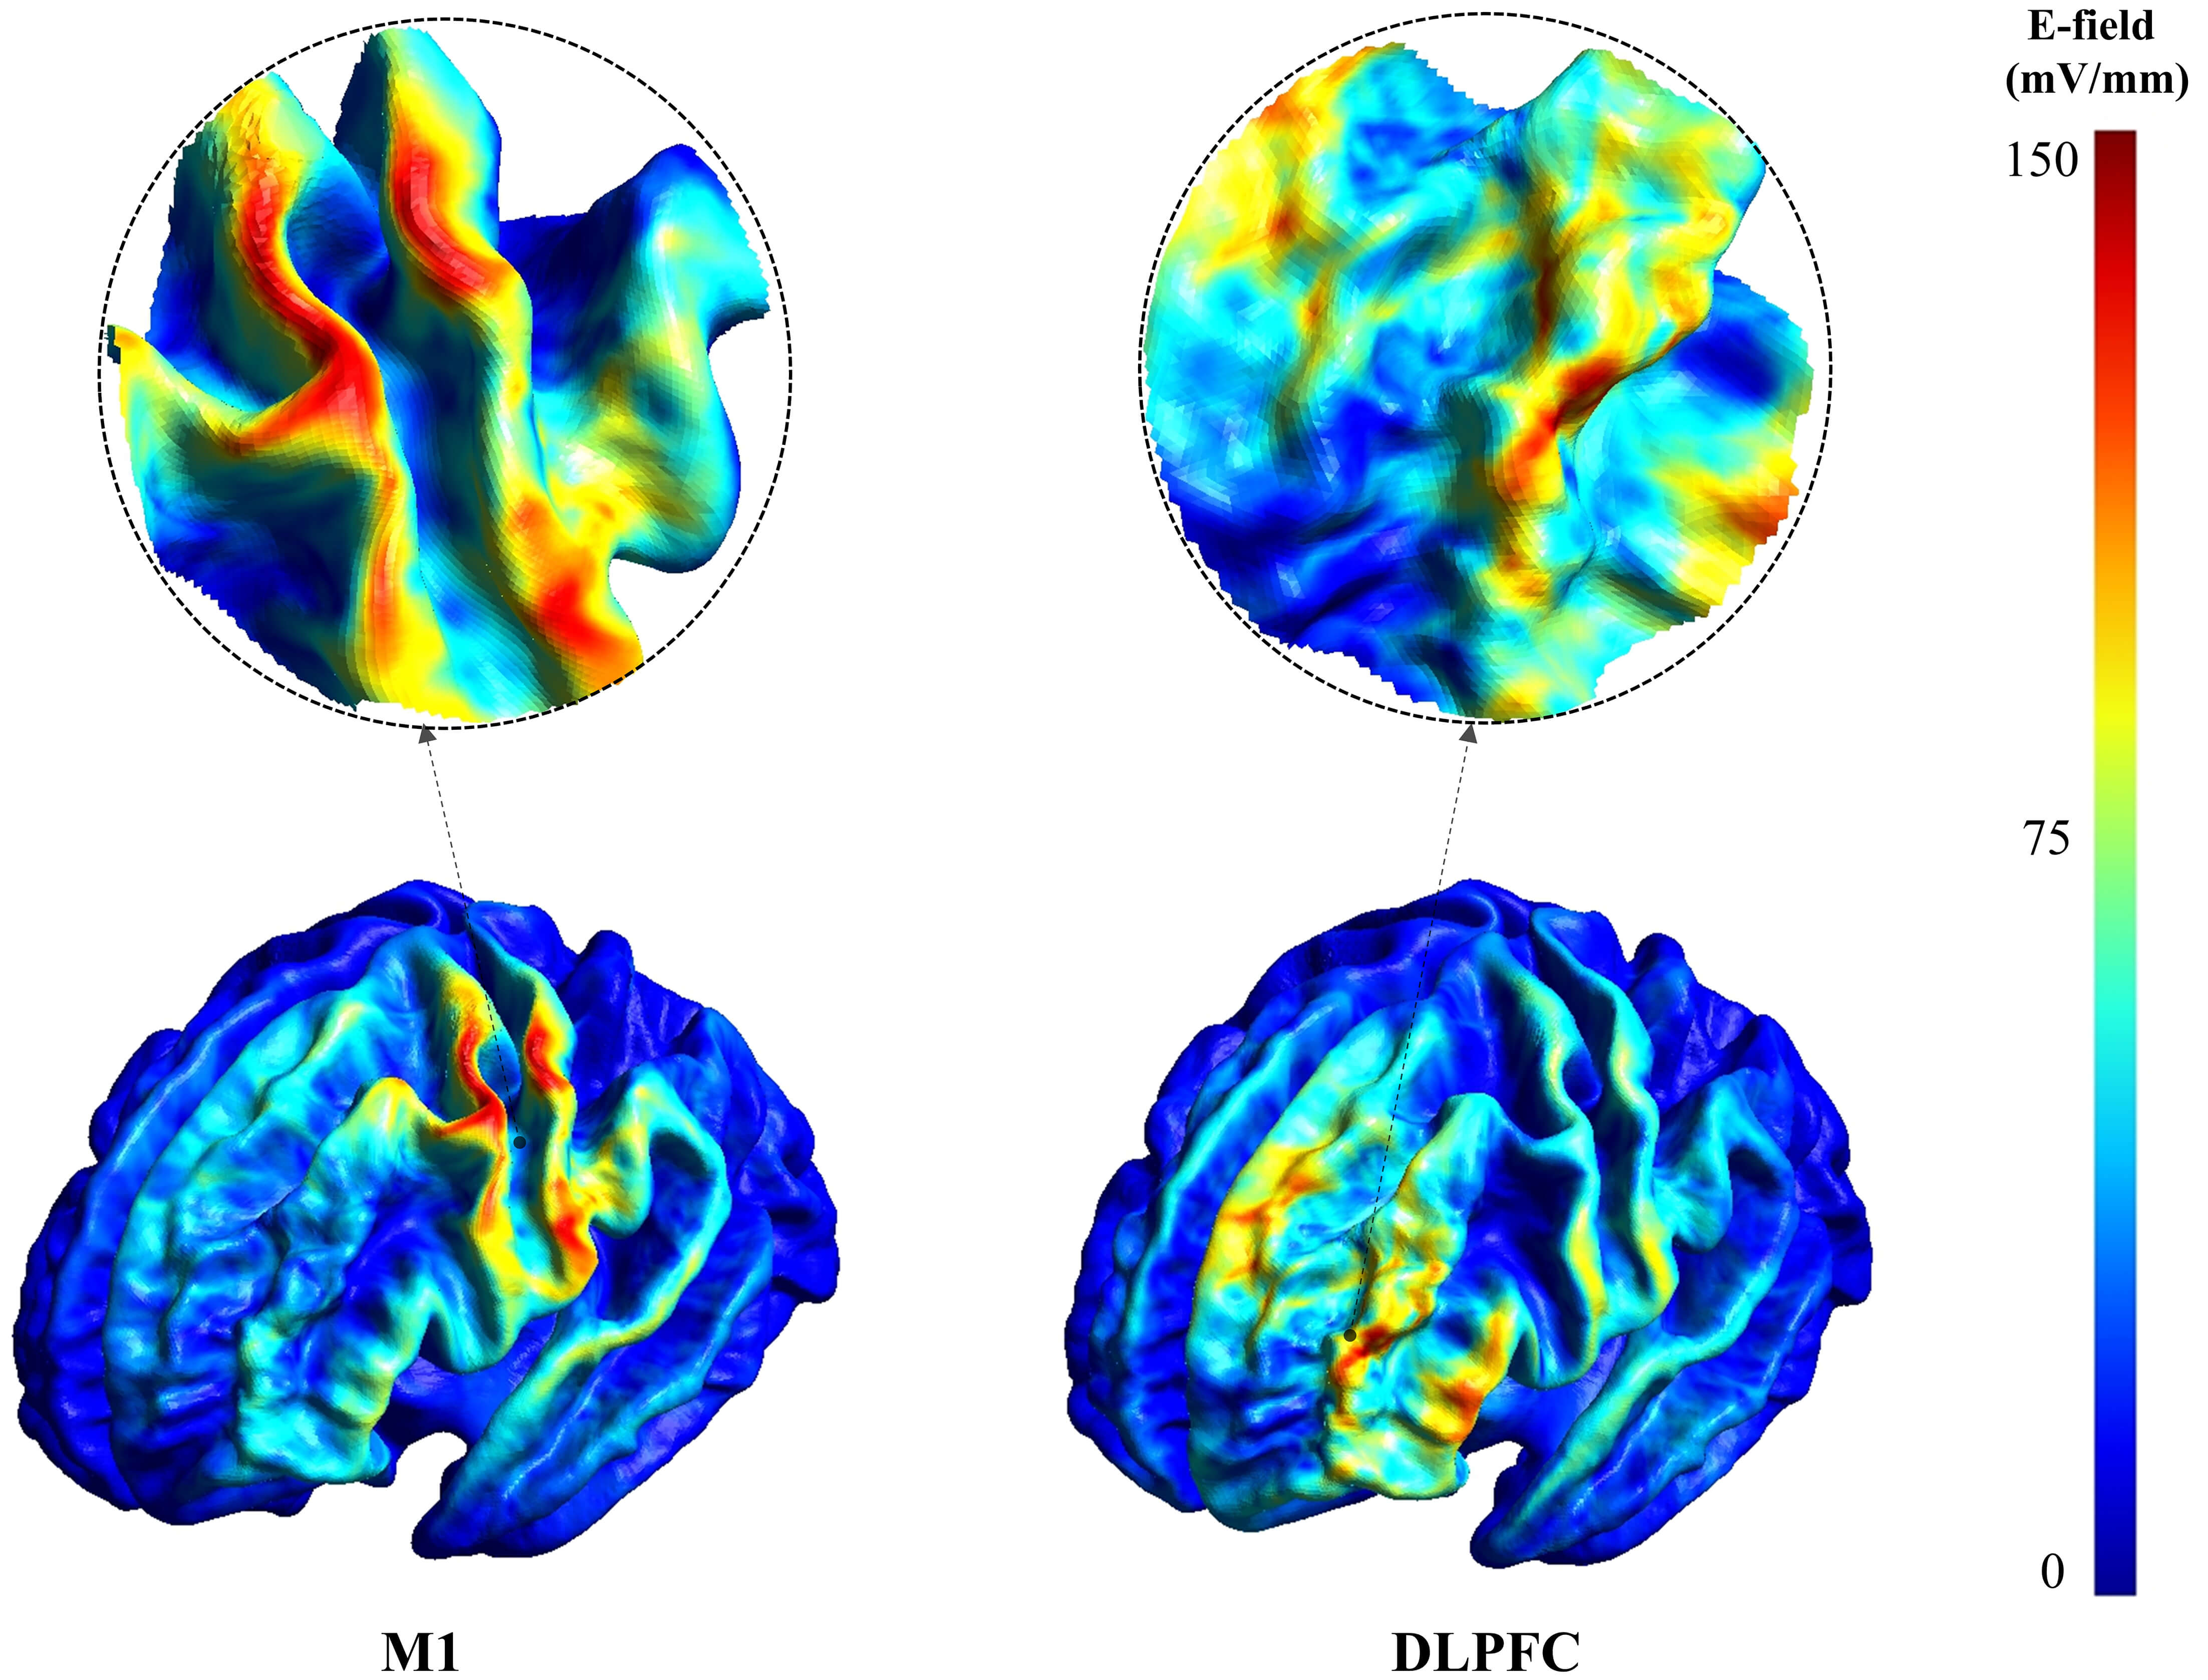 Fig. 5.
Representative maps of the tangential (surface-parallel) E-field component for M1 and DLPFC stimulation. Color indicates tangential component magnitude (mV/mm); the color scale is shown on the right. Circular insets provide magnified views of the electric field distribution in the corresponding targeted regions.
The intensity-scaling analysis showed an approximately linear dose–response in DLPFC E-field magnitude and its components across 80–120% of the MT-equivalent reference output (Figs. 6,7). At the 100% MT-equivalent reference output, both the Mean-based and Max-based calibration schemes indicated a significant deficit in the overall E-field magnitude at DLPFC relative to M1 (Fig. 6). Specifically, under the Max-based calibration, the mean E-field magnitude within the DLPFC GM volume was 50.56 mV/mm, significantly lower than the M1 reference level (54.86 mV/mm; P𝐹𝐷𝑅 = 0.023; Hedges’ g = 0.602). Likewise, the robust maximum E-field magnitude on the GM surface (Smax) and within the GM volume (Vmax) were significantly lower than the corresponding M1 reference levels (Smax: 61.96 vs. 68.25 mV/mm, P𝐹𝐷𝑅 = 0.005; Vmax: 55.37 vs. 60.00 mV/mm, P𝐹𝐷𝑅 = 0.012). Although the mean E-field magnitude on the GM surface also tended to be lower, it did not reach statistical significance after correction for multiple comparisons within the multi-dose scaling analysis (P𝐹𝐷𝑅 = 0.072).
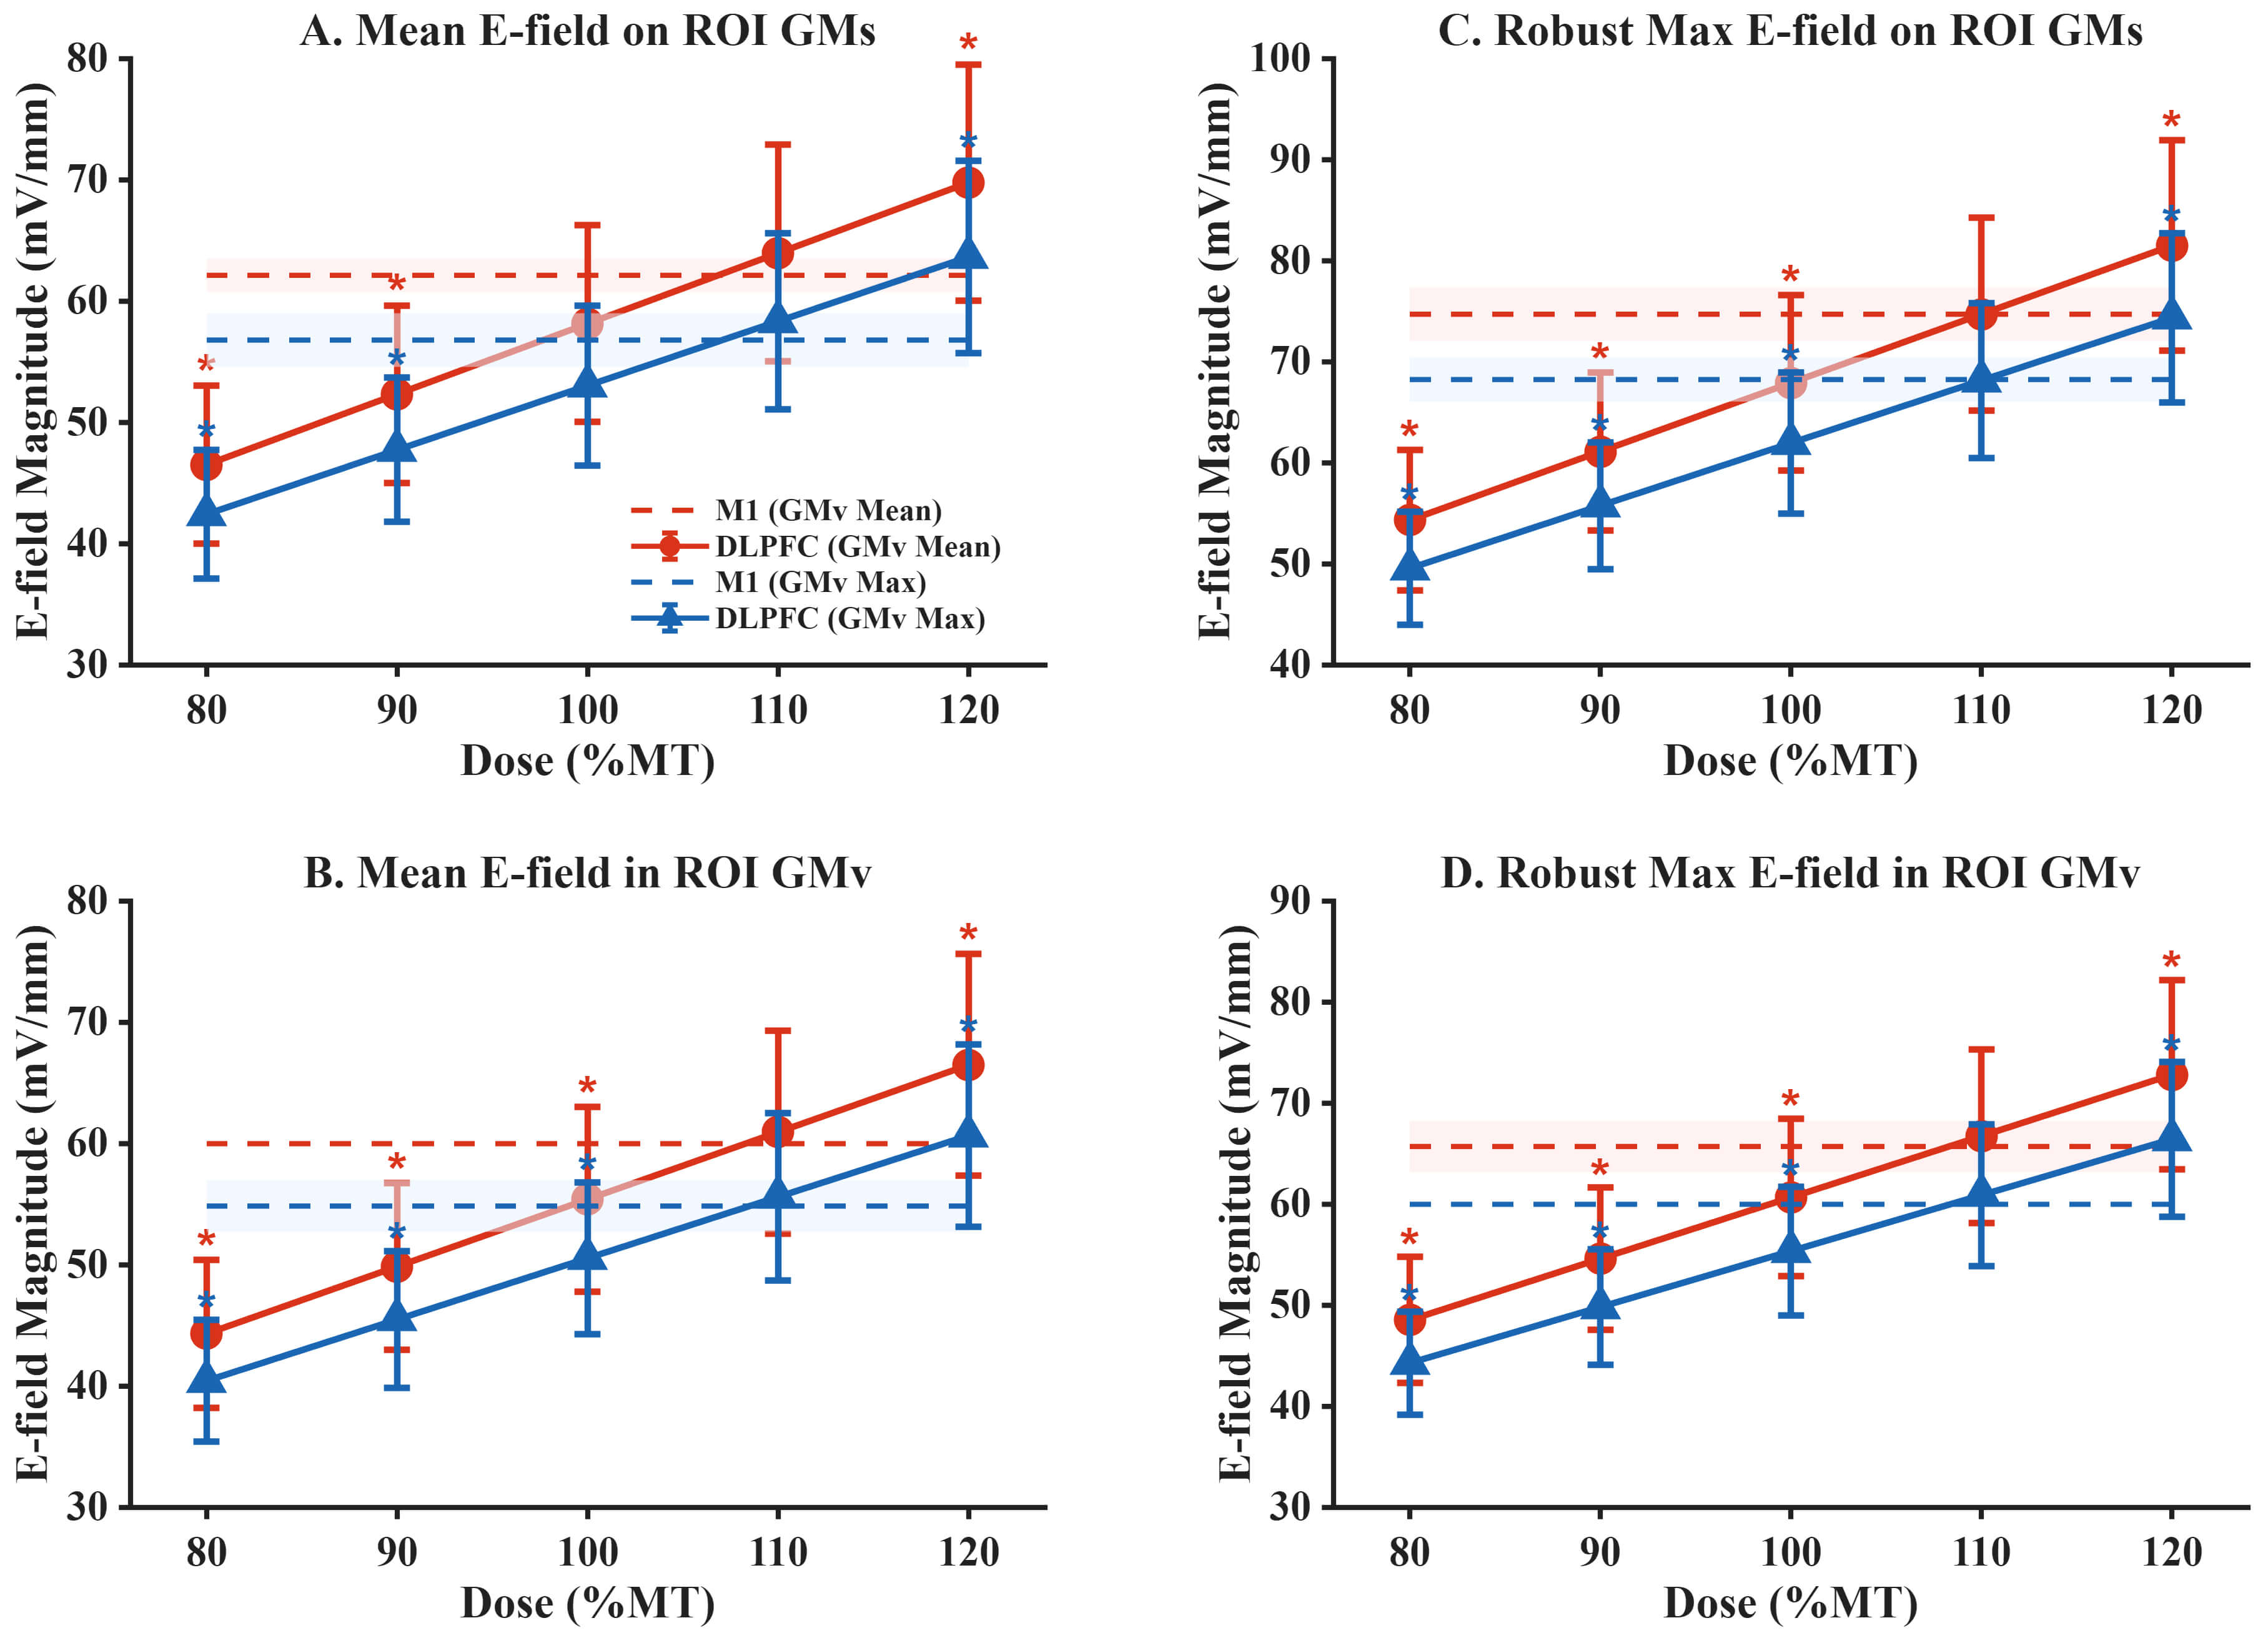 Fig. 6.
Intensity scaling of E-field magnitude at DLPFC under Mean-based
and Max-based MT-equivalent calibration. (A) Mean E-field magnitude on the ROI
gray matter surface. (B) Mean E-field magnitude within the ROI gray matter
volume. (C) Robust maximum E-field magnitude on the ROI gray matter surface. (D)
Robust maximum E-field magnitude within the ROI gray matter volume. Solid lines
with markers indicate DLPFC group means across subjects at 80–120% of the
MT-equivalent reference output; error bars denote
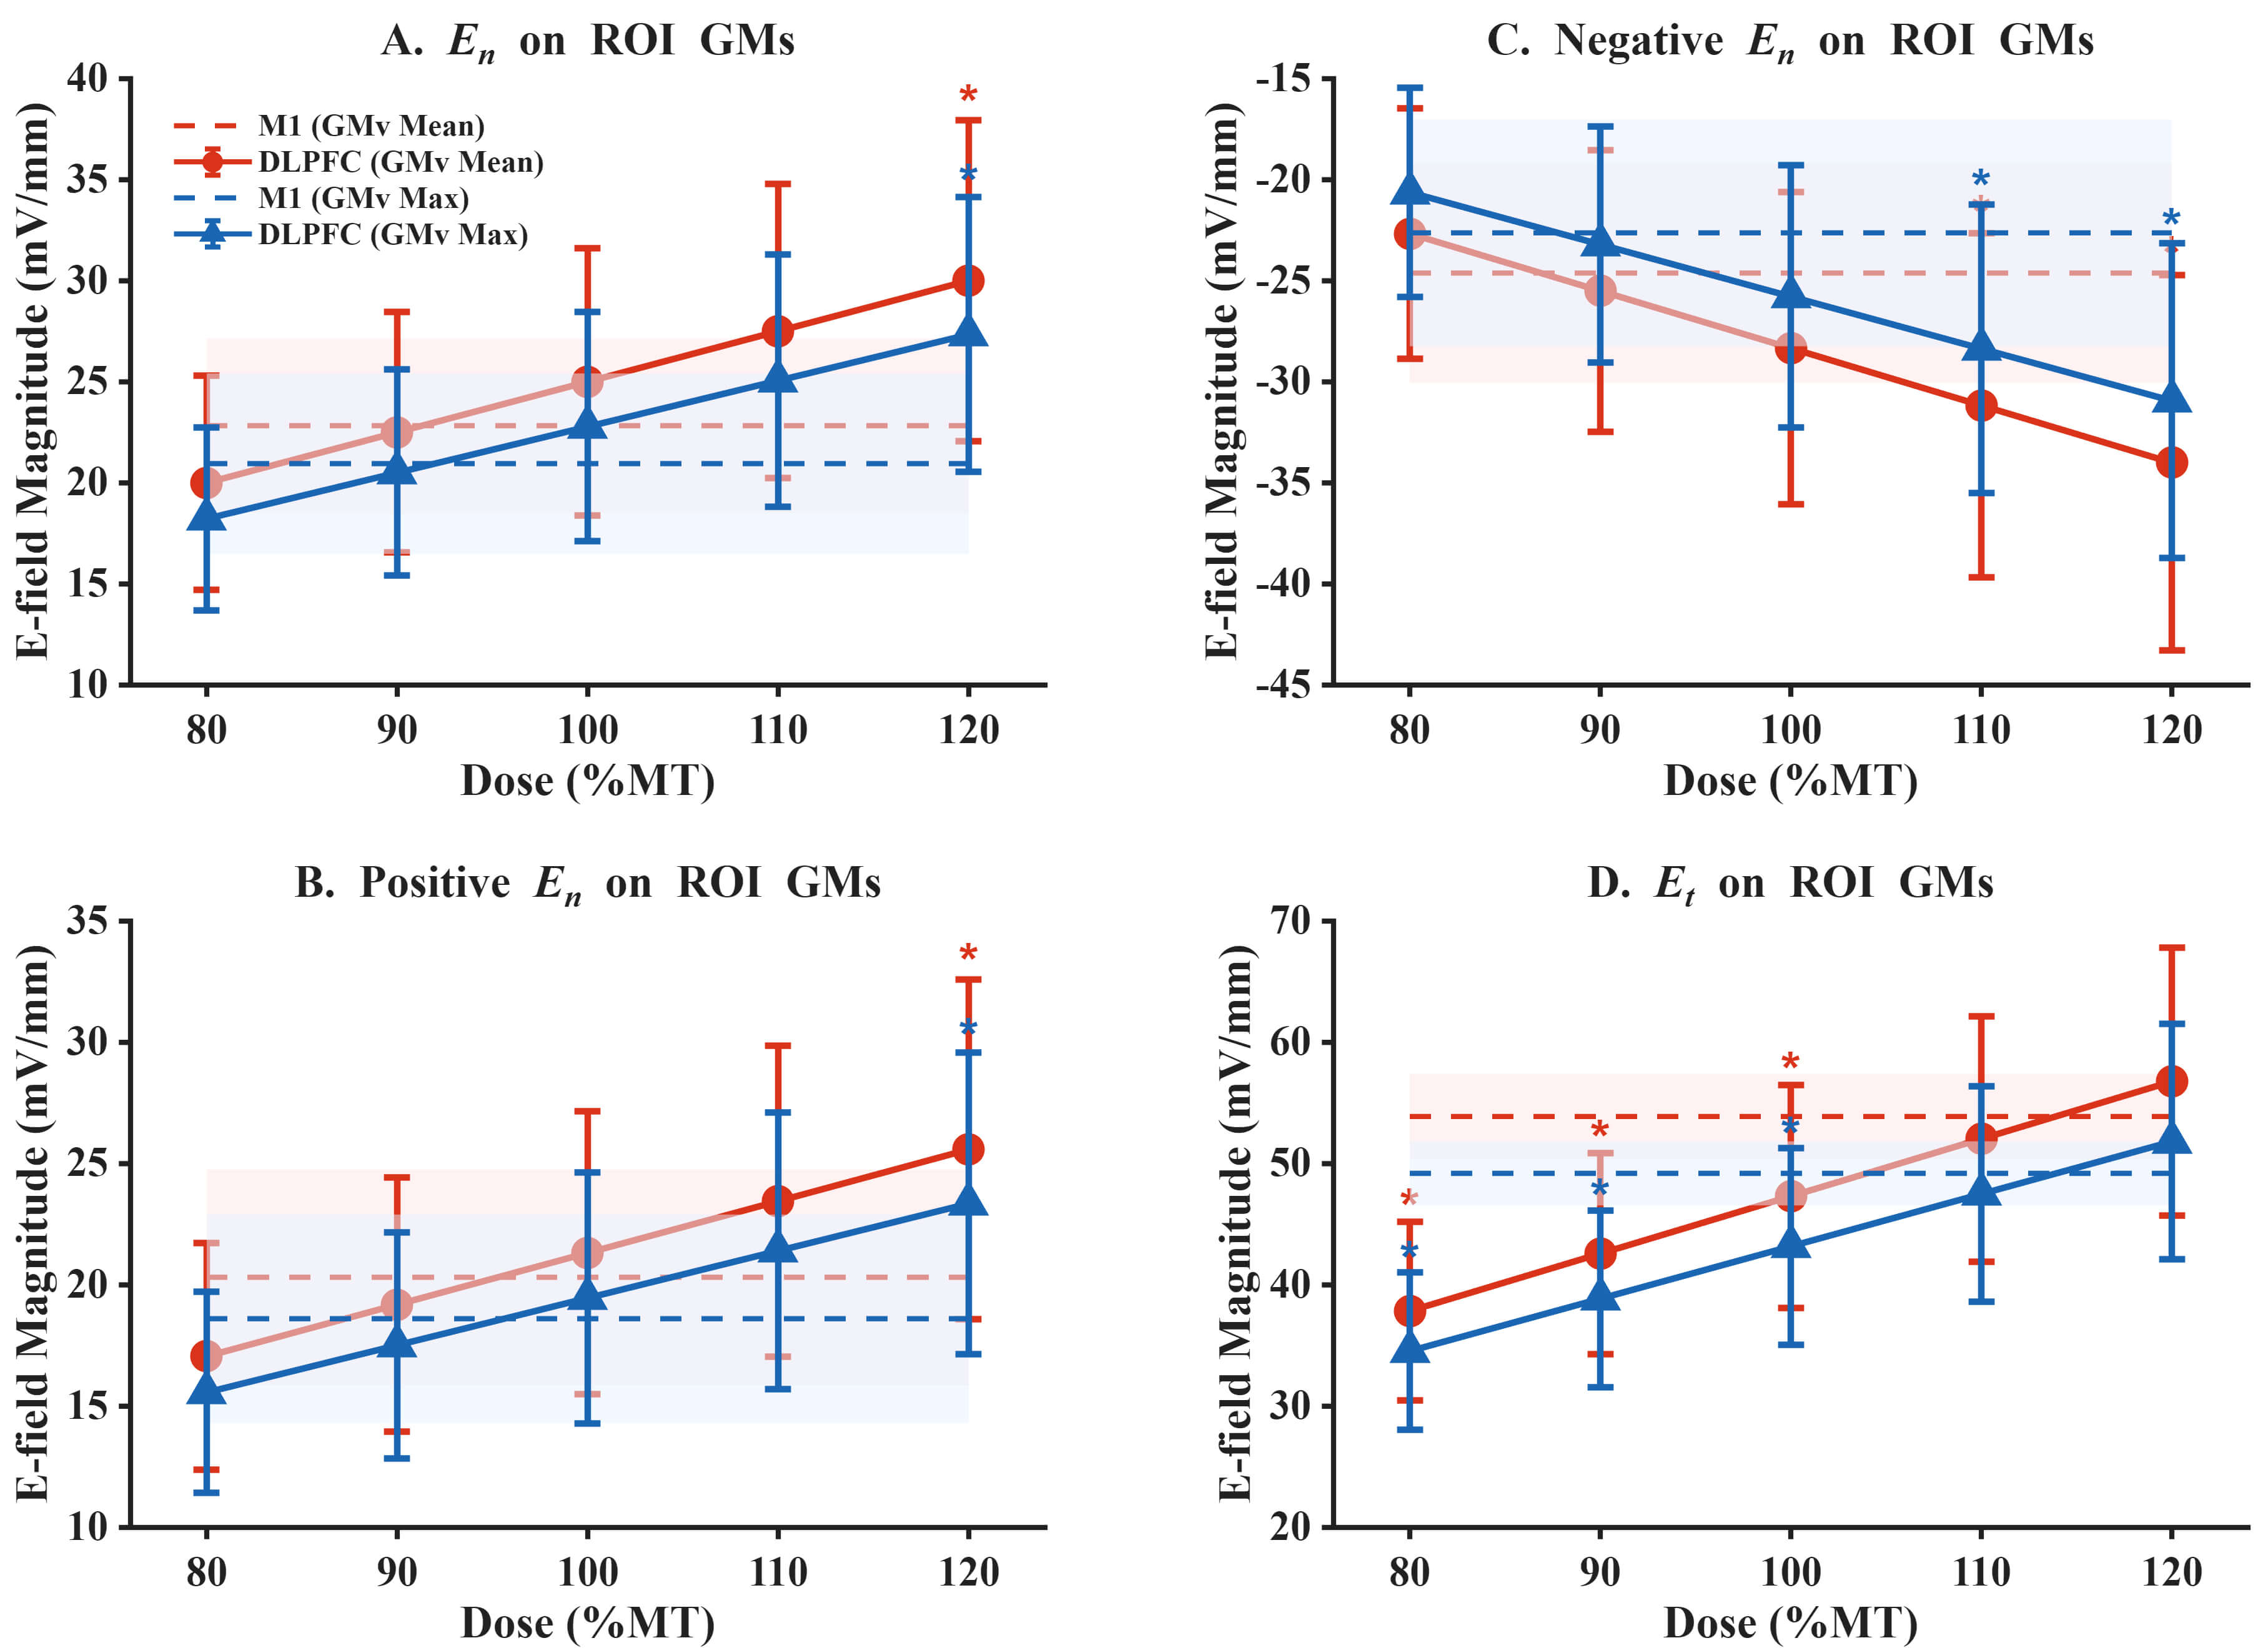 Fig. 7.
Intensity scaling of E-field components at DLPFC under
Mean-based and Max-based MT-equivalent calibration. (A) Normal E-field component
magnitude (E𝑛) on the ROI gray matter surface. (B) Positive normal
E-field component magnitude (E𝑛) on the ROI gray matter surface.
(C) Negative normal E-field component magnitude (E𝑛) on the ROI
gray matter surface. (D) Tangential E-field component magnitude
(Et) on the ROI gray matter surface. Solid lines with markers
indicate DLPFC group means across subjects at 80–120% of the MT-equivalent
reference output; error bars denote
The scaling analysis further suggested that approximate parity of DLPFC overall
magnitude with the M1 reference level was achieved at around 110% of the
MT-equivalent reference output (P𝐹𝐷𝑅
As a promising non-invasive neuromodulation technique, TMS offers a new therapeutic option for many neuropsychiatric disorders that respond poorly to conventional drug treatments [1, 2, 3, 4]. By targeting specific brain regions, TMS can modulate neural activity and alleviate symptoms. However, the widespread clinical practice of using the MT measured at M1 to set the stimulation intensity for non-motor areas like the DLPFC remains debated, given substantial anatomical and physiological differences across cortical regions [10, 13, 14, 15]. Using advanced computational E-field modeling, this study directly compared E-field characteristics at M1 and DLPFC under standardized stimulation conditions, providing a biophysical basis for refining dosing strategies.
The core finding of this study is that, under identical physical stimulation conditions, the E-field magnitude delivered to the DLPFC is significantly lower than that delivered to M1. Both on the cortical surface and within the gray matter volume, the mean and robust maximum E-field magnitudes were significantly lower in the DLPFC. This difference can be attributed to the combined effect of multiple anatomical factors. First, M1 is typically located near the central sulcus with relatively regular cortical folding, whereas the DLPFC has a more complex gyral-sulcal morphology, including deeper sulci and more tortuous gray-white matter interfaces [7], which can disperse induced currents and alter local E-field magnitude distributions. Second, the DLPFC is located more anteriorly, and regional differences in local skull properties and coil-to-cortex distance may exist across individuals and targets. Given the high resistivity of the skull and distance-dependent attenuation, these factors can jointly reduce the induced E-field magnitude. In addition, conductivity contrasts across tissues can substantially shape field distributions [17]. Because CSF is far more conductive than gray matter, induced currents may preferentially flow through the CSF as a low-resistance pathway, producing a “shunting effect” that reduces the effective E-field magnitude within cortical gray matter. Meanwhile, M1 and DLPFC differ in the relative proportions and geometric configurations of gray matter, white matter, and CSF; prior work has suggested that the prefrontal cortex may be covered by a thicker CSF layer in some individuals [7], which could further exacerbate E-field attenuation at DLPFC. The elderly cohort in our study offers additional insight into these mechanisms. Aging is often accompanied by cortical atrophy, increasing CSF volume in sulci and the subarachnoid space [28]. Therefore, the reduced DLPFC E-field magnitude observed in our study likely reflects the combined influence of intrinsic prefrontal anatomical complexity and age-related structural changes. This mechanistic account helps explain the observed attenuation and suggests that, in older adults, M1-referenced linear intensity settings may benefit from more refined, individualized parameter adjustment to compensate for this additional biophysical attenuation.
The most innovative finding of this study is the revelation of a specific deficit in the tangential electric field component at the DLPFC. This result has important mechanistic implications, as it links the macroscopic field properties to neuronal activation mechanisms. While E-field magnitude is a key determinant, its spatial orientation is also critical in shaping which neural elements are preferentially engaged [29]. Microscopically, the cerebral cortex contains pyramidal neurons that are predominantly oriented perpendicular to the cortical surface [7]. Both theory and experiments suggest that the normal component (perpendicular to the cortical surface) is strongly related to activation mechanisms underlying MEP generation at M1 [7, 30]. However, the cerebral cortex also contains many other neuron types, particularly various interneurons, which constitute up to 20–30% of the neurons in the prefrontal cortex [31, 32, 33]. The axons and dendrites of these interneurons may run more parallel to the cortical surface, potentially increasing their sensitivity to the tangential E-field component [5]. In the DLPFC, modulation of these complex local circuit elements is often hypothesized to contribute to mood and cognitive regulatory effects of TMS, rather than relying solely on activation of a single class of projection neuron [11, 34, 35, 36]. These GABAergic interneurons play a crucial role in shaping network activity, gating information flow, and supporting neuroplasticity [34].
In this study, while the normal E-field component was comparable between M1 and DLPFC, the tangential component was significantly weaker in the DLPFC. This finding has important mechanistic implications. At M1, the primary measurable output (MEP) is closely linked to activation of corticospinal pyramidal neurons, for which a strong normal component is thought to be effective [7, 9]. By contrast, therapeutic effects at DLPFC likely depend more on modulation of complex local circuits containing diverse interneuron populations [34, 35, 36]. Therefore, a reduced tangential component at DLPFC suggests that an intensity calibrated using an M1-derived physiological reference may not ensure comparable target engagement across regions, particularly for circuit elements that may be more sensitive to tangential fields. This interpretation is consistent with multiscale modeling studies showing that different neuronal subtypes can exhibit different activation thresholds and orientation sensitivities [37]. In this sense, MT-based dosing uses a physiological output largely driven by M1-relevant activation mechanisms (MEP) to calibrate intensity, and then applies it to a target (DLPFC) whose effects may depend on a different balance of E-field components. Such a biophysical mismatch may contribute to variability in stimulation effects and inter-individual differences in rTMS response.
These fixed-output results highlight a target-wise biophysical asymmetry between M1 and DLPFC that cannot be inferred from MEP-based calibration alone. Because clinical rTMS protocols commonly scale stimulation intensity from an M1-derived reference, we next examined whether intensity scaling can reconcile the observed differences in overall E-field magnitude and component balance at DLPFC. Importantly, our MT-equivalent reference output analysis bridges the fixed-output comparisons with the typical M1-referenced intensity scaling used in clinical rTMS. In this analysis, increasing intensity reduced the overall E-field magnitude gap between DLPFC and the M1 reference level, with approximate magnitude parity occurring around 110% of the MT-equivalent reference output. However, the same scaling also revealed a component trade-off: while 120% scaling brought the tangential component at DLPFC closer to the M1 reference level, the normal component increased significantly beyond the M1 reference level. Together, these results indicate that intensity-only linear scaling may be insufficient to simultaneously match overall E-field magnitude and component balance at DLPFC across individuals, likely due to target-specific anatomical determinants.
Taken together, our findings provide a practical biophysical rationale for moving toward target-specific, E-field–informed parameter selection in TMS applications. These observations are consistent with prior modeling work emphasizing that intensity scaling alone cannot fully compensate for target-specific anatomy and coil–cortex geometry [11, 24, 38], and they reinforce the rationale for incorporating E-field–informed targeting and dosing into future prospective studies. Rather than directly demonstrating under-dosing in routine clinical practice, the present results suggest that M1-referenced dosing may not ensure comparable E-field magnitude at the DLPFC and component balance across individuals. This motivates strategies that jointly consider intensity and coil orientation (and, where available, individualized modeling) to better align stimulation parameters with target characteristics, especially in older adults. More broadly, the results support integrating personalized, model-based simulation methods into treatment planning as a component of precision neuromodulation [38]. Notably, advances in faster and near real-time E-field modeling are making such approaches increasingly feasible in practical workflows [39]. Future studies combining model-based predictions with physiological measures (e.g., MEP-related benchmarks for M1 and TMS–EEG/behavioral readouts for DLPFC) and clinical outcomes will be essential to validate and refine these dosing strategies.
This study also has some limitations. First, although our head models were based on high-resolution MRI, simplifications still exist in tissue segmentation and conductivity assignment. We used uniform, isotropic conductivity values, whereas the electrical properties of real brain tissue vary between individuals and exhibit anisotropy in white matter. Future work incorporating diffusion MRI–informed anisotropic conductivity could provide more accurate E-field estimates. Second, our sample size (N = 20) is reasonable for computational modeling but remains relatively small; we therefore reported small-sample–corrected effect sizes (Hedges’ g) with bootstrap confidence intervals to quantify uncertainty. Future work should replicate these findings in larger cohorts and/or additional open datasets. Third, our participants were older adults. Age-related brain structural changes (e.g., cortical atrophy) can affect E-field distribution, so caution is needed when generalizing the results to younger populations or patient groups with significant brain structural abnormalities [40]. Fourth, only one figure-of-eight coil model (MagVenture MC-B70) and one standard coil orientation (45°) were simulated. Because coil geometry and orientation can influence E-field magnitude and component balance, future studies should evaluate coil- and orientation-dependence using additional validated coil models and sensitivity analyses. Fifth, although CHCP was designed to be comparable to HCP via harmonized acquisition procedures, subtle imaging differences may still arise across scanner models and sites. Importantly, our key comparisons were within-subject and within-dataset (M1 vs. DLPFC) using the same modeling pipeline, so scanner/site effects are unlikely to explain the target-wise differences reported here. Future work could further evaluate generalizability by replicating the analysis in multi-site datasets and/or traveling-participant designs. Finally, this is a purely computational simulation study lacking direct physiological or clinical validation. Our MT-equivalent reference output framework approximates common M1-referenced intensity-scaling logic but does not replace experimentally measured MT. Prospective studies linking modeled E-field characteristics to physiological measures (e.g., MEP-related benchmarks for M1 and TMS–EEG/behavioral readouts for DLPFC) and clinical outcomes are needed to validate the translational value of E-field–informed dosing.
Using personalized head model simulations, this study shows that under the same physical stimulator output, TMS-induced E-fields at M1 and DLPFC differ in both magnitude and component balance. Specifically, overall E-field magnitude at DLPFC is lower, and the tangential component is significantly reduced relative to M1. Using an MT-equivalent reference output framework, intensity scaling reduced the overall magnitude gap (with approximate parity around 110%), but a component trade-off remained: scaling that brought the tangential component closer to the M1 reference tended to increase the normal component beyond the M1 reference. Together, these biophysical findings suggest that M1-referenced intensity scaling may not ensure comparable DLPFC E-field magnitude and component balance across individuals, highlighting the potential value of target-specific, E-field–informed parameter selection. Future work combining individualized modeling with physiological and clinical validation will be essential to determine whether such strategies improve reliability and outcomes in TMS applications.
The MRI datasets analyzed during the current study are publicly available in the Science Data Bank repository. Specifically, data were sourced from the Chinese Human Connectome Project (CHCP), which can be accessed via the following link: https://www.scidb.cn/en/detail?dataSetId=f512d085f3d3452a9b14689e9997ca94 (DOI: 10.11922/sciencedb.01374). The SimNIBS 4.1 software used for the simulations is open-source and publicly available at https://simnibs.github.io/simnibs/.
YW and SQ designed the research study. YW performed the research, including methodology development, software implementation, data curation, and visualization. YW and YL analyzed the data. YL, HW, and CW conducted the validation. HW and CW provided resources for the study. YW prepared the original draft of the manuscript. SQ provided supervision, project administration, and funding acquisition. All authors contributed to editorial changes in the manuscript. All authors read and approved the final manuscript. All authors have participated sufficiently in the work and agreed to be accountable for all aspects of the work.
This research is a secondary analysis of a publicly available and fully anonymized dataset. As such, no new ethics approval was required for the computational modeling work performed in this study.
We gratefully acknowledge the data provided by the Chinese Human Connectome Project (CHCP, PI: Jia-Hong Gao), funded by the Beijing Municipal Science & Technology Commission, the Chinese Institute for Brain Research (Beijing), the National Natural Science Foundation of China, and the Ministry of Science and Technology of China.
This research was funded by the National Key R&D Program of China on Active Health and Aging Technologic Solutions, grant numbers 2022YFC3600501 and 2022YFC3600500.
The authors declare no conflict of interest.
References
Publisher’s Note: IMR Press stays neutral with regard to jurisdictional claims in published maps and institutional affiliations.