


 , Jiacheng Chen 2,†, Yangzhi Xie 1, Ping Zhang 1, Zhengyang Yuan 1, Yili Yi 1, Zhao Pan 1,*
1 Department of Neurology, The Affiliated Nanhua Hospital, Hengyang Medical School, University of South China, 421001 Hengyang, Hunan, China
2 Department of Intensive Care Unit, The Affiliated Nanhua Hospital, Hengyang Medical School, University of South China, 421001 Hengyang, Hunan, China
†These authors contributed equally.
Abstract
A high-fat diet (HFD) has been implicated in the induction of depressive-like behaviors, yet the underlying mechanisms remain incompletely elucidated. Growing evidence indicates that microglia-mediated neuroinflammation plays a critical role in the pathogenesis of depression, with excessive lipid droplet (LD) accumulation emerging as an early trigger for neuroinflammatory cascades. The aim of this study was to investigate microglial LD accumulation and the associated neuroinflammatory response in a model of HFD-induced depression.
Diet-induced obese (DIO) mice were compared with normal control (Con) mice. Depressive-like behaviors were evaluated through a battery of behavioral tests. Hippocampal neuronal damage and microglial activation were assessed using histological and immunofluorescence techniques. A co-culture system of glial cell-enriched isolates and hippocampal neurons was employed to evaluate the neurotoxic potential of DIO microglia. LD accumulation in microglia was quantified in vivo and in vitro using Bodipy staining, Oil Red O staining, and electron microscopy. Untargeted lipidomics was performed on glial cells to characterize alterations in lipid metabolism.
Compared with Con mice, DIO mice exhibited significant depressive-like behaviors and hippocampal neuronal damage, accompanied by enhanced microglia-mediated neuroinflammation. In the co-culture system, microglia from DIO mice demonstrated increased neurotoxicity toward hippocampal neurons. Bodipy staining and electron microscopy revealed increased accumulation of LDs in the hippocampal microglia of DIO mice. This was further confirmed in glial cells in vitro. Lipidomic profiling identified substantial disturbances in lipid metabolism in DIO microglia.
Diet-induced obesity leads to depressive-like behaviors and hippocampal neuronal damage, which is associated with microglia-mediated neuroinflammation and intracellular accumulation of LDs. The enhanced neurotoxicity of DIO microglia, coupled with pronounced lipid metabolic dysregulation, suggests that lipid-laden microglia may contribute to the link between obesity and depression via neuroinflammatory mechanisms.
Keywords
- depression disorder
- obesity
- lipid droplet
- neuroinflammation diseases
- microglia
Major depressive disorder is one of the most prevalent psychiatric disorders globally, contributing significantly to disability and diminished quality of life. While its etiology is not fully understood, depression is increasingly recognized as a multifactorial condition influenced by genetic, environmental, and metabolic interactions [1]. Notably, the global increase in consumption of high-fat diets (HFD) has been strongly linked to an increased risk of depressive symptoms, although the underlying neurobiological mechanisms remain poorly defined [2]. This knowledge gap hinders the development of effective interventions for diet-associated mood disorders. Emerging evidence suggests that HFD-induced systemic inflammation can disrupt the integrity of the blood-brain barrier and promote microglial activation, thereby facilitating neuroinflammation [3]. A central mechanistic hypothesis posits that neuroinflammation, a state of heightened and sustained immune activation in the brain, serves as a key mediator linking nutritional imbalance to emotional dysfunction [4]. Microglia, the resident immune cells of the central nervous system, play a central role in this process. Under physiological conditions, microglia support neuronal health through constant surveillance and synaptic maintenance. However, under metabolic stress induced by HFD, they can shift toward a pro-inflammatory phenotype, releasing cytokines and chemokines that negatively impact neuronal function and viability [5]. Recent groundbreaking studies have demonstrated that intracellular accumulation of lipid droplets in microglia is a critical early event in the initiation and persistence of neuroinflammation [6, 7]. This phenomenon, increasingly termed “microglial lipidosis”, does not merely represent passive lipid storage but is also an indicator of active cellular transformation with functional consequences. Lipid-laden microglia display enhanced release of inflammatory mediators, impaired phagocytic capacity, and diminished synaptic support [8, 9].
The hippocampus, a brain region critical for mood regulation and cognitive function, appears particularly susceptible to these diet-induced changes [10, 11]. Although the link between systemic inflammation and depression is well established, the role of microglial lipid accumulation as a central mechanism in HFD-induced depression remains poorly understood. The lipidomic profiles of microglia under dietary stress have yet to be fully characterized. Moreover, it is not yet known how their altered metabolism directly contributes to neuronal dysfunction in vivo and in vitro.
The aim of this work was to investigate a potential mechanistic connection between the accumulation of microglial lipid droplets (LDs) and the onset of depression, thereby offering a novel perspective on how dietary fats may influence brain immunity and emotional health. These findings may ultimately reveal new therapeutic strategies for targeting immunometabolic pathways in the treatment of depression.
Male C57BL/6J mice (6-week-old) were purchased from Gempharmatech (Nanjing,
Jiangsu, China), and maintained under standard housing conditions (12-h
light/dark cycle, 22
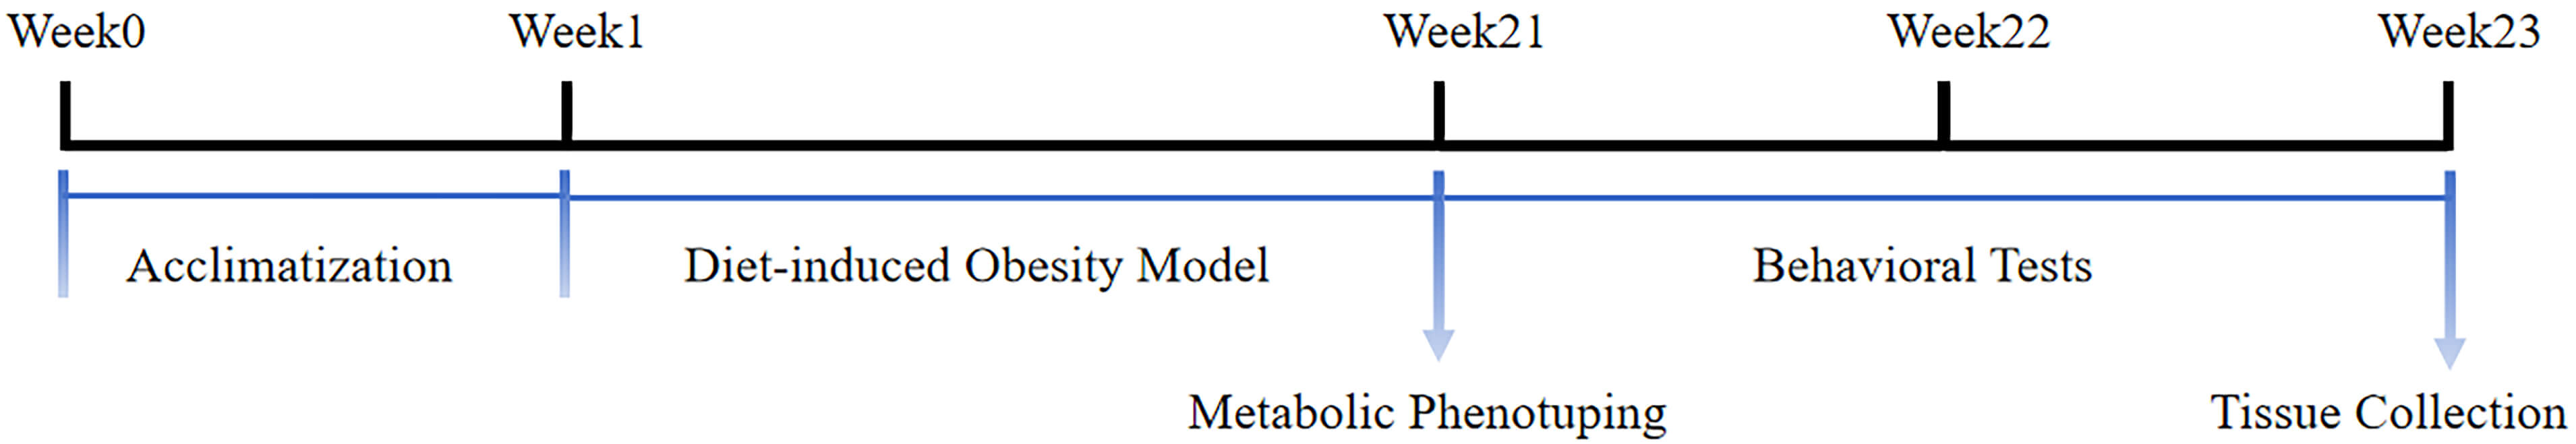 Fig. 1.
Experimental design and timeline. Mice were fed a control or high-fat diet (HFD) for 20 weeks, followed by behavioral tests (Open Field Test, Sucrose Preference Test, Tail Suspension Test, Forced Swim Test). Hippocampal tissues were then collected for histological, biochemical, and lipidomic analyses.
To comprehensively evaluate the systemic metabolic phenotype of DIO mice, their body weight was monitored throughout the 27-week study period. Following the behavioral tests, mice were fasted for 6 h, after which fasting blood glucose was measured from the tail vein using an Elite Glucometer (Bayer, Mishawaka, IN, USA). Serum was also collected via retro-orbital bleeding for the quantification of fasting insulin levels using a mouse-specific enzyme-linked immunosorbent assay (ELISA) kit (JL48252, JONLNBIO, Shanghai, China). A glucose tolerance test (GTT) was then conducted by intraperitoneal injection of a glucose solution (2 g/kg body weight) into mice that had fasted for 6 hours. Blood glucose levels were monitored at 0, 15, 30, 60, 90, and 120 minutes post-injection. Total glycemic excursion was quantified as the area under the curve (AUC) using the trapezoidal rule.
To assess depressive-like behaviors, all mice underwent a battery of
well-validated behavioral tests with a 48-h interval between each test to
minimize potential carryover effects. The open field test was conducted to
evaluate general locomotor activity and anxiety-like behavior. Each mouse was
placed individually in a square arena (50
After the behavioral tests, mice were deeply anesthetized and transcardially
perfused with PBS followed by 4% paraformaldehyde (PFA, Shanghai Maokang
Biotechnology Co., Ltd, Shanghai, China). The brains were post-fixed overnight
at 4 °C and subsequently cryoprotected in 30% sucrose solution. Coronal
hippocampal sections (20 µm thick) were prepared using a freezing
microtome. For hematoxylin and eosin (H&E) staining, sections were first
incubated in H&E solutions (catalog No. K1142, APExBIO, Houston, TX, USA),
dehydrated through an alcohol series, and then mounted. For Nissl staining,
sections were incubated in Cresyl Violet Stain Solution (1%) (catalog No.
ab246817, Abcam, Cambridge, UK), differentiated in alcohol, and a coverslip was
added. To assess hippocampal neuronal damage, the number of intact neurons per
mm2 was quantified across three non-overlapping fields in the ventral CA1
subregion. Analyses were performed on sections located between approximately AP
–2.9 mm and AP –4.2 mm from Bregma (Paxinos and Franklin’s mouse brain atlas),
with a representative imaging field centered at AP –3.5 mm, ML
Upon completion of the behavioral tests and metabolic phenotyping, mice were
deeply anesthetized with sodium pentobarbital (50 mg/kg, i.p.). Blood samples
were collected via retro-orbital bleeding. The blood was allowed to clot for 30
min at room temperature and then centrifuged at 3000
Total RNA was extracted from samples using TRIzol reagent (catalog No.
15596018CN, Sigma-Aldrich). Complementary DNA (cDNA) was then synthesized from
the isolated RNA with a PrimeScript RT reagent kit (catalog No. RR037A, Takara,
Kusatsu, Japan). Quantitative real-time PCR (qPCR) was performed on a 7300 Plus
Real-Time PCR System (catalog No. JM1966-018481, Thermo Fisher Scientific,
Waltham, MA, USA) using SYBR Premix Ex Taq I (Takara, RR820A).
The 20 µL reaction mixture contained 1 µL of cDNA template, 10
µL of PCR master mix, 5 pmol of each primer, and nuclease-free water
(catalog No. AM9937, Ambion™, Waltham, MA, USA). The PCR
protocol involved an initial denaturation at 95 °C for 13 s, followed by
40 cycles of 94 °C for 10 s and 60 °C for 20 s. Gene expression
levels were calculated using the comparative
| Target gene | Forward primer sequence | Reverse primer sequence |
| TNF- |
CAGGCGGTGCCTATGTCTC | CCATTTGGGAACTTCTCATCCCTT |
| iNOS | GGTGAAGGGACTGAGCTGTT | ACGTTCGTTCTCTTGCA |
| GAPDH | GCCAAGGCTGTGGGCAAGGT | TCTCCAGGCGGCACGCAGA |
TNF-
Glial cell-enriched isolates were obtained from the brains of 16-week-old C57BL/6J mice using a combined enzymatic and mechanical dissociation protocol. In brief, mice were transcardially perfused with ice-cold PBS. The brains were rapidly excised, and the cortices and hippocampi were carefully dissected. The tissues were enzymatically digested in Hank’s balanced salt solution (HBSS) (catalog No. 14185052, Thermo Fisher Scientific) supplemented with 2 mg/mL papain (catalog No. LS003126, Worthington, Lakewood, NJ, USA) and 100 U/mL DNase I (catalog No. D5025, Sigma-Aldrich) for 30 minutes at 37 °C. The resulting cell suspension was triturated, filtered through a 70-µm cell strainer, and centrifuged on a 30%/70% Percoll (catalog No. 17089101, GE Healthcare, Chicago, IL, USA) density gradient. Fractions enriched with glial cells were harvested and used as glial cell-enriched isolates from the interphase layer, washed, and subsequently seeded in DMEM/F-12 complete medium for further culture.
For immunofluorescence staining, brain sections or cultured primary microglia
were fixed with 4% PFA, permeabilized with 0.3% Triton X-100 (catalog No.
T8787, Sigma-Aldrich), and blocked with 5% bovine serum albumin (BSA, catalog
No. A3156-25G, Sigma-Aldrich). Sections or cells were incubated overnight at
4 °C with the following primary antibodies: anti-ionized calcium-binding
adapter molecule 1 (Iba1) (1:100, catalog No. ab283319, Abcam) and anti-inducible
nitric oxide synthase (iNOS, 1:100, catalog No. ab210823, Abcam), or appropriate
combinations for co-staining. Bodipy™ 493/503 (1:600, Thermo
Fisher Scientific, Cat. No. D3922) was applied for the detection of LDs.
Following three washes with PBS, samples were incubated with Alexa
Fluor® 488-conjugated goat anti-rabbit IgG (1:500, A11017, Thermo Fisher Scientific) and
Alexa Fluor® 594-conjugated goat anti-mouse IgG (1:500, A-11020, Thermo Fisher Scientific) secondary antibodies for 1 h at room temperature. Nuclei were counterstained with 4’,6-diamidino-2-phenylindole (DAPI)
(catalog No. D9542-1MG, Sigma-Aldrich). Fluorescent images were acquired using a
Nikon A1R HD25 confocal microscope (Nikon Corporation, Tokyo, Japan) equipped
with a Plan Apo
Isolated glial cell-enriched isolates were fixed with 4% PFA for 15 minutes and rinsed with PBS. Cells were subsequently incubated with 60% isopropanol (catalog No. 563935, Sigma-Aldrich) for 1 minute to permeabilize the membranes, followed by staining with freshly prepared Oil Red O working solution (catalog No. O0625, Sigma-Aldrich) for 15 minutes at room temperature. After staining, cells were thoroughly washed with distilled water and counterstained with hematoxylin (catalog No. H9627, Sigma-Aldrich) for 1 minute. Brightfield images were captured using a Nikon Eclipse Ni light microscope (ECLIPSE Ni-L, Nikon Corporation). The extent of lipid droplet accumulation was quantified by measuring the integrated optical density (IOD) of Oil Red O staining across five randomly selected fields per sample using ImageJ software (Version 1.41, NIH, Bethesda, MD, USA). ImageJ analysis of immunofluorescence involved automated thresholding (“Analyze Particles”) for quantification of the Percent Area/Integrated Density and plugin-based co-localization (Manders’ Coefficients), with all analyses performed blinded.
For the analysis of apoptosis, glial cell-enriched isolates were stained using the Annexin V-FITC/PI Apoptosis Detection Kit (catalog No. 556547, BD Biosciences, San Jose, CA, USA) as per the manufacturer’s instructions. Briefly, cells were resuspended in binding buffer and incubated with Annexin V-FITC (catalog No. 51-65874X, BD Biosciences) and propidium iodide (PI) for 15 minutes in the dark. The percentage of apoptotic cells was quantified using a BD FACSVerse flow cytometer (catalog No. 651155; BD Biosciences). For the measurement of intracellular reactive oxygen species (ROS), cells were incubated with 10 µM DCFH-DA (catalog No. S0033S, Beyotime Biotechnology, Shanghai, China) at 37 °C for 30 minutes, washed with PBS, and analyzed immediately by flow cytometry. Fluorescence intensity was detected in the FITC channel. All data were analyzed using FlowJo software (BD Biosciences).
To assess the neurotoxic effects of microglia on hippocampal neurons in a
transwell co-culture system, neuronal viability and cytotoxicity were evaluated
using the CCK-8 and LDH assays, respectively. For the CCK-8 assay, hippocampal
neurons were seeded in the lower chamber of 24-well plates. After 24 h of
co-culture with microglia in the upper chamber, the CCK-8 reagent (catalog No.
CK04, Dojindo Laboratories, Kumamoto, Japan) was added to each well, and the
plates were incubated for 2 h at 37 °C. Absorbance was then measured at
450 nm using a microplate reader. Neuronal viability was expressed as a
percentage relative to the control group. For the LDH release assay, culture
supernatant was collected from the lower chamber after 24 h of co-culture. LDH
activity was measured using a Cytotoxicity Detection Kit (catalog No.
11644793001, Roche Diagnostics, Mannheim, Germany) according to the
manufacturer’s instructions. Absorbance was read at 490 nm. The percentage of LDH
release was calculated as follows: (LDH activity in supernatant / total LDH
activity)
Glial cell‑enriched isolates were fixed with 2.5% glutaraldehyde (catalog No. G916054-25ml, Macklin, Shanghai, China) overnight at 4 °C and subsequently post-fixed in 1% osmium tetroxide (catalog No. BD9014, Exonlab, Guangzhou, China). Following dehydration through a graded ethanol series, the cells were embedded in EPON resin (catalog No. 02334-500, Polysciences, Warrington, PA, USA). Ultrathin sections (70 nm) were prepared and double-stained with uranyl acetate (catalog No. 22405, Electron Microscopy Sciences, Hatfield, PA, USA) and lead citrate (catalog No. 17800, Electron Microscopy Sciences). The morphology of LDs was examined using a transmission electron microscope (catalog No. HT7800, Hitachi High-Tech Corporation, Tokyo, Japan) at 80 kV. The number and average diameter of LDs were quantified from randomly selected micrographs using ImageJ software.
Lipids were extracted from glial cell-enriched isolates using a methyl-tert-butyl ether (MTBE)/methanol-based extraction method. Lipid profiling was carried out using ultra-high-performance liquid chromatography (UHPLC, Waters Corporation, Milford, MA, USA, ACQUITY UPLC I-Class) coupled with tandem mass spectrometry (MS/MS, Thermo Scientific, Q-Exactive HF-X). Chromatographic separation was performed on a C18 column (catalog No. 186005296, Waters Corporation) with a gradient elution program involving acetonitrile and isopropanol. Mass spectrometry data were acquired in both positive and negative ionization modes.
Data processing was conducted using LipidSearch™ software
(v4.2) (catalog No. OPTON-30880, Thermo Fisher Scientific) for lipid
identification and quantification. Multivariate statistical analyses, including
principal component analysis (PCA) and orthogonal partial least squares
discriminant analysis (OPLS-DA), were performed using SIMCA-P (v16.0).
Significantly altered lipid species were selected based on a variable importance
in projection (VIP) value
HFD induced a significant increase in the body weight of DIO mice, as well as
elevated glucose and insulin levels. After 20 weeks of HFD consumption, the body
weight of mice in the DIO group was significantly higher than in the control
group (p
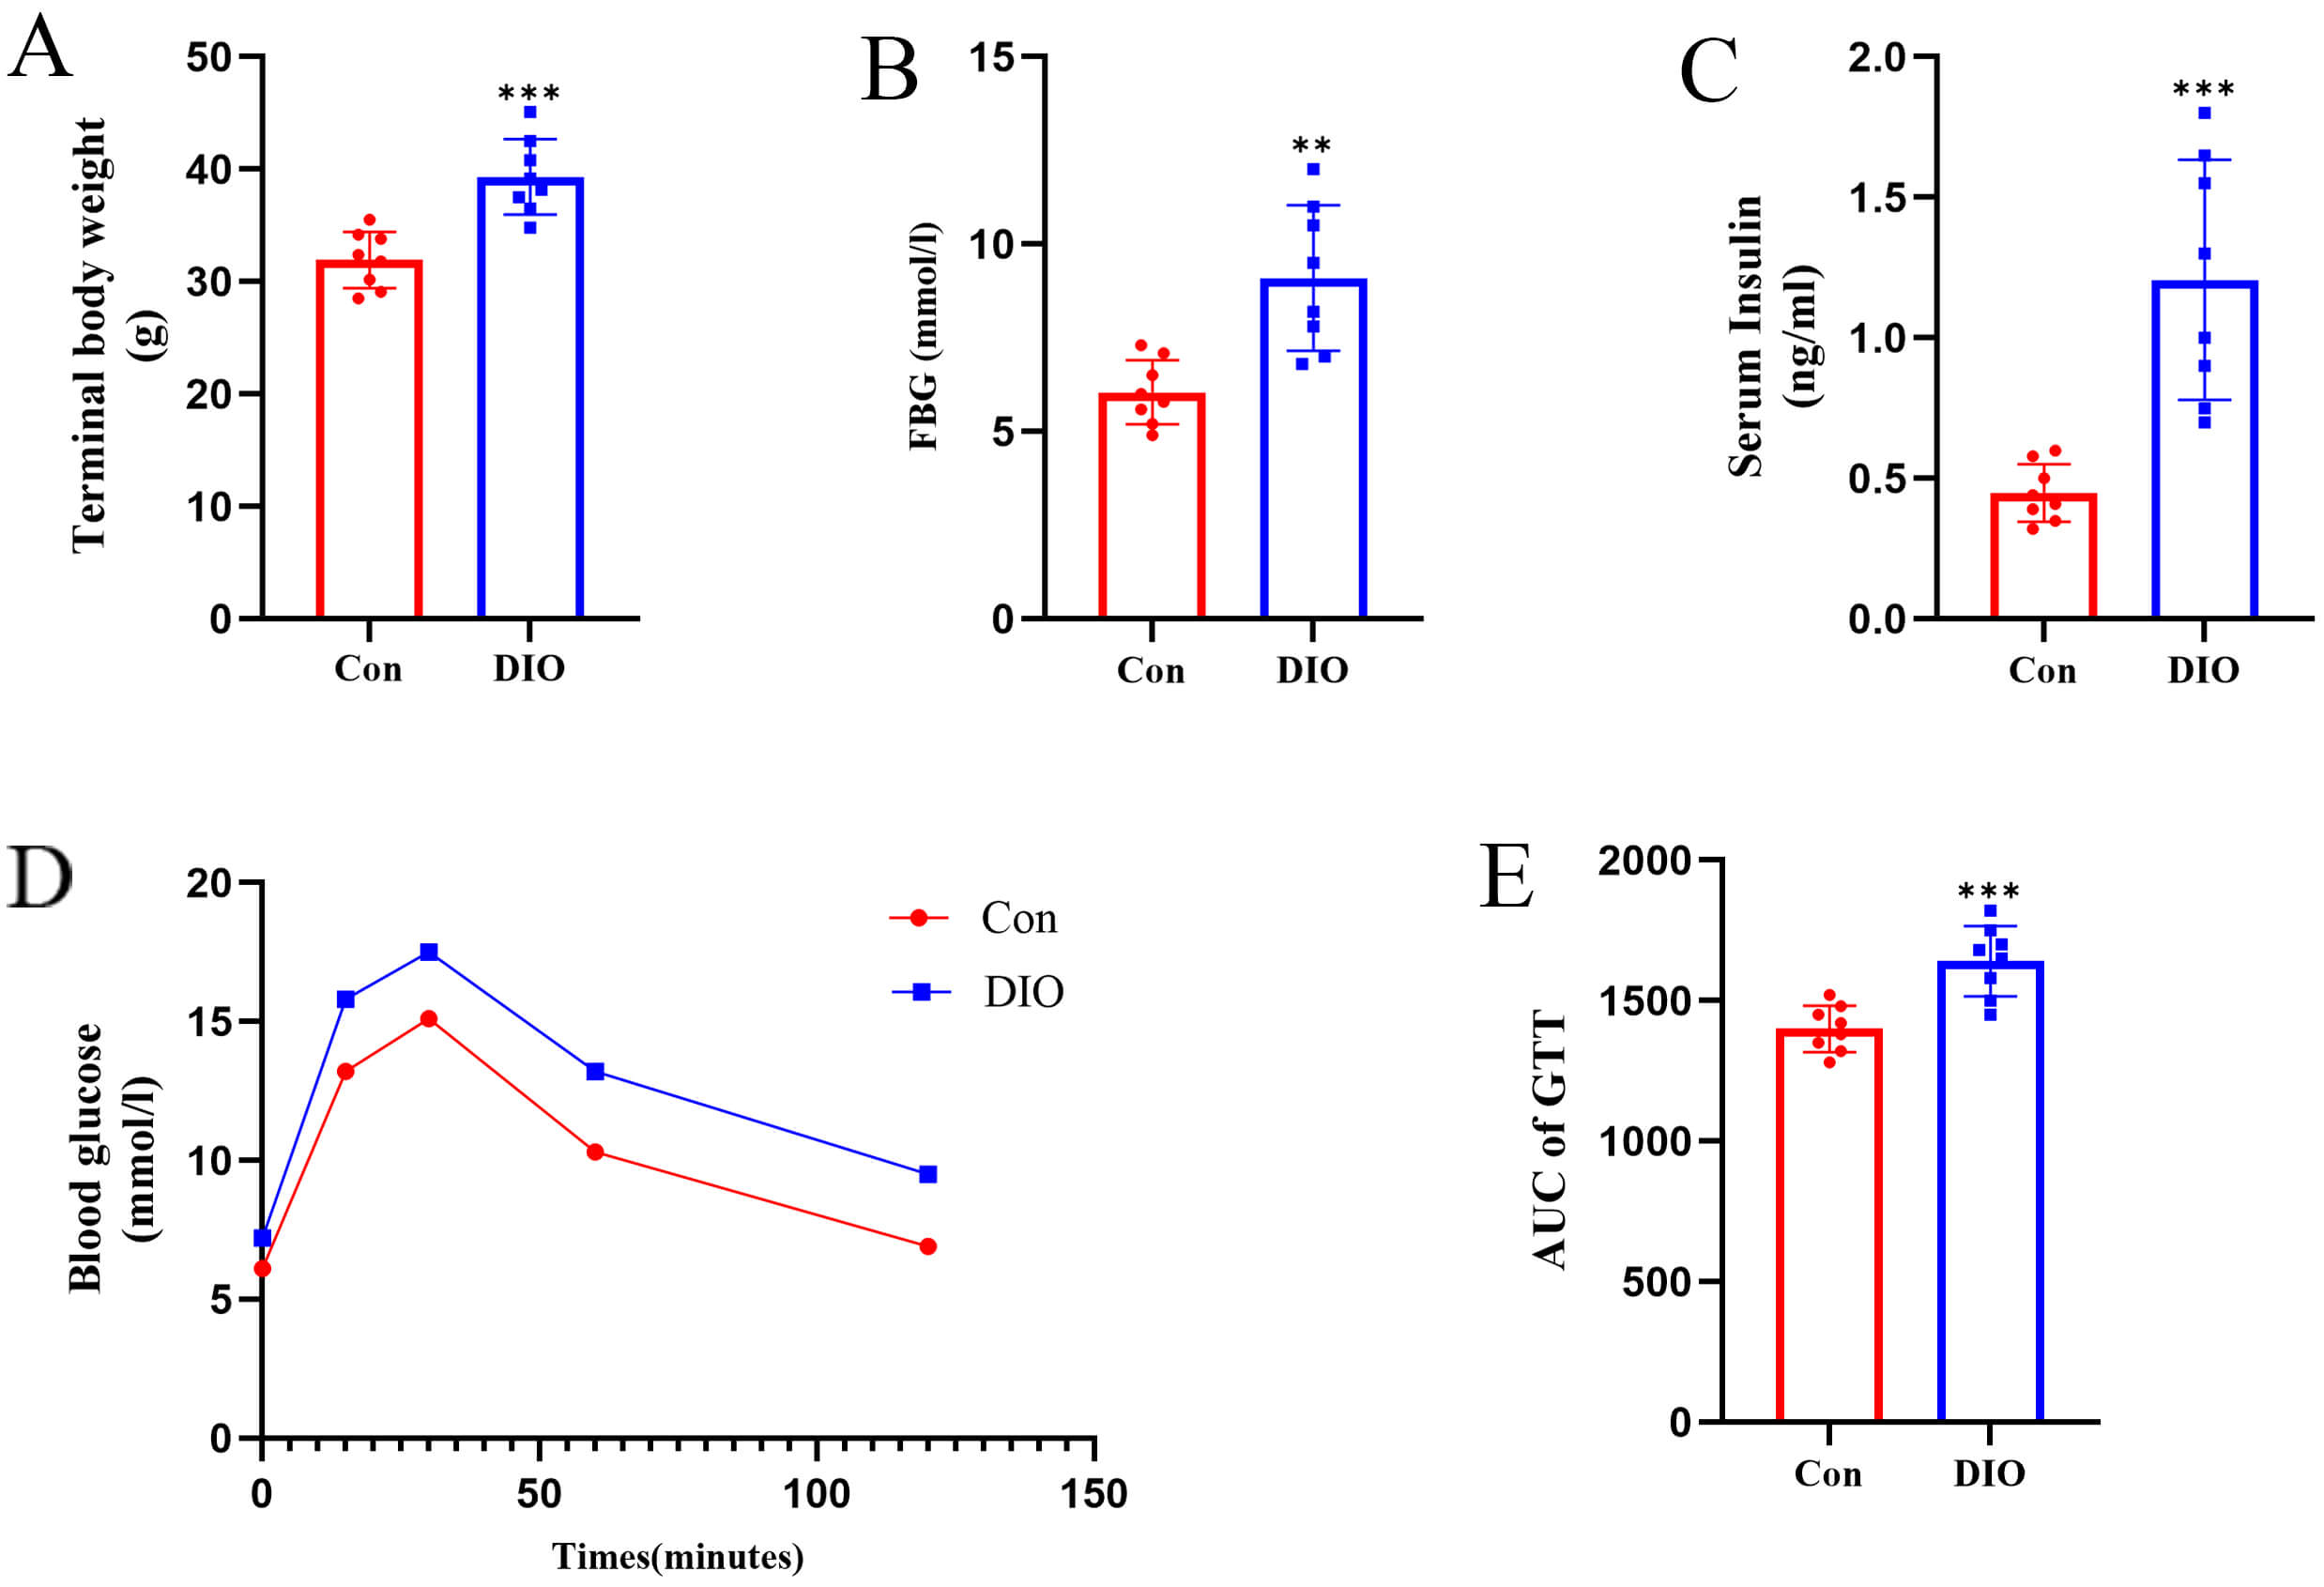 Fig. 2.
DIO mice exhibit systemic metabolic dysfunction and glucose
intolerance. (A) Terminal body weight of control (Con) and diet-induced obese
(DIO) mice after 20 weeks of dietary intervention (n = 8). (B) Fasting blood
glucose (FBG) levels (n = 8). (C) Fasting serum insulin concentrations (n = 8).
(D) Blood glucose levels during the intraperitoneal glucose tolerance test (GTT)
(n = 8). (E) Quantification of the total glycemic response shown as the area
under the curve (AUC) for the GTT (n = 8). **p
To investigate the impact of diet-induced obesity on depression-related
pathology, mice were first subjected to a series of behavioral tests. Compared to
the control group, DIO mice exhibited behaviors consistent with depressive-like
phenotypes (Fig. 3A). This was evidenced by increased immobility time in both the
tail suspension test (p
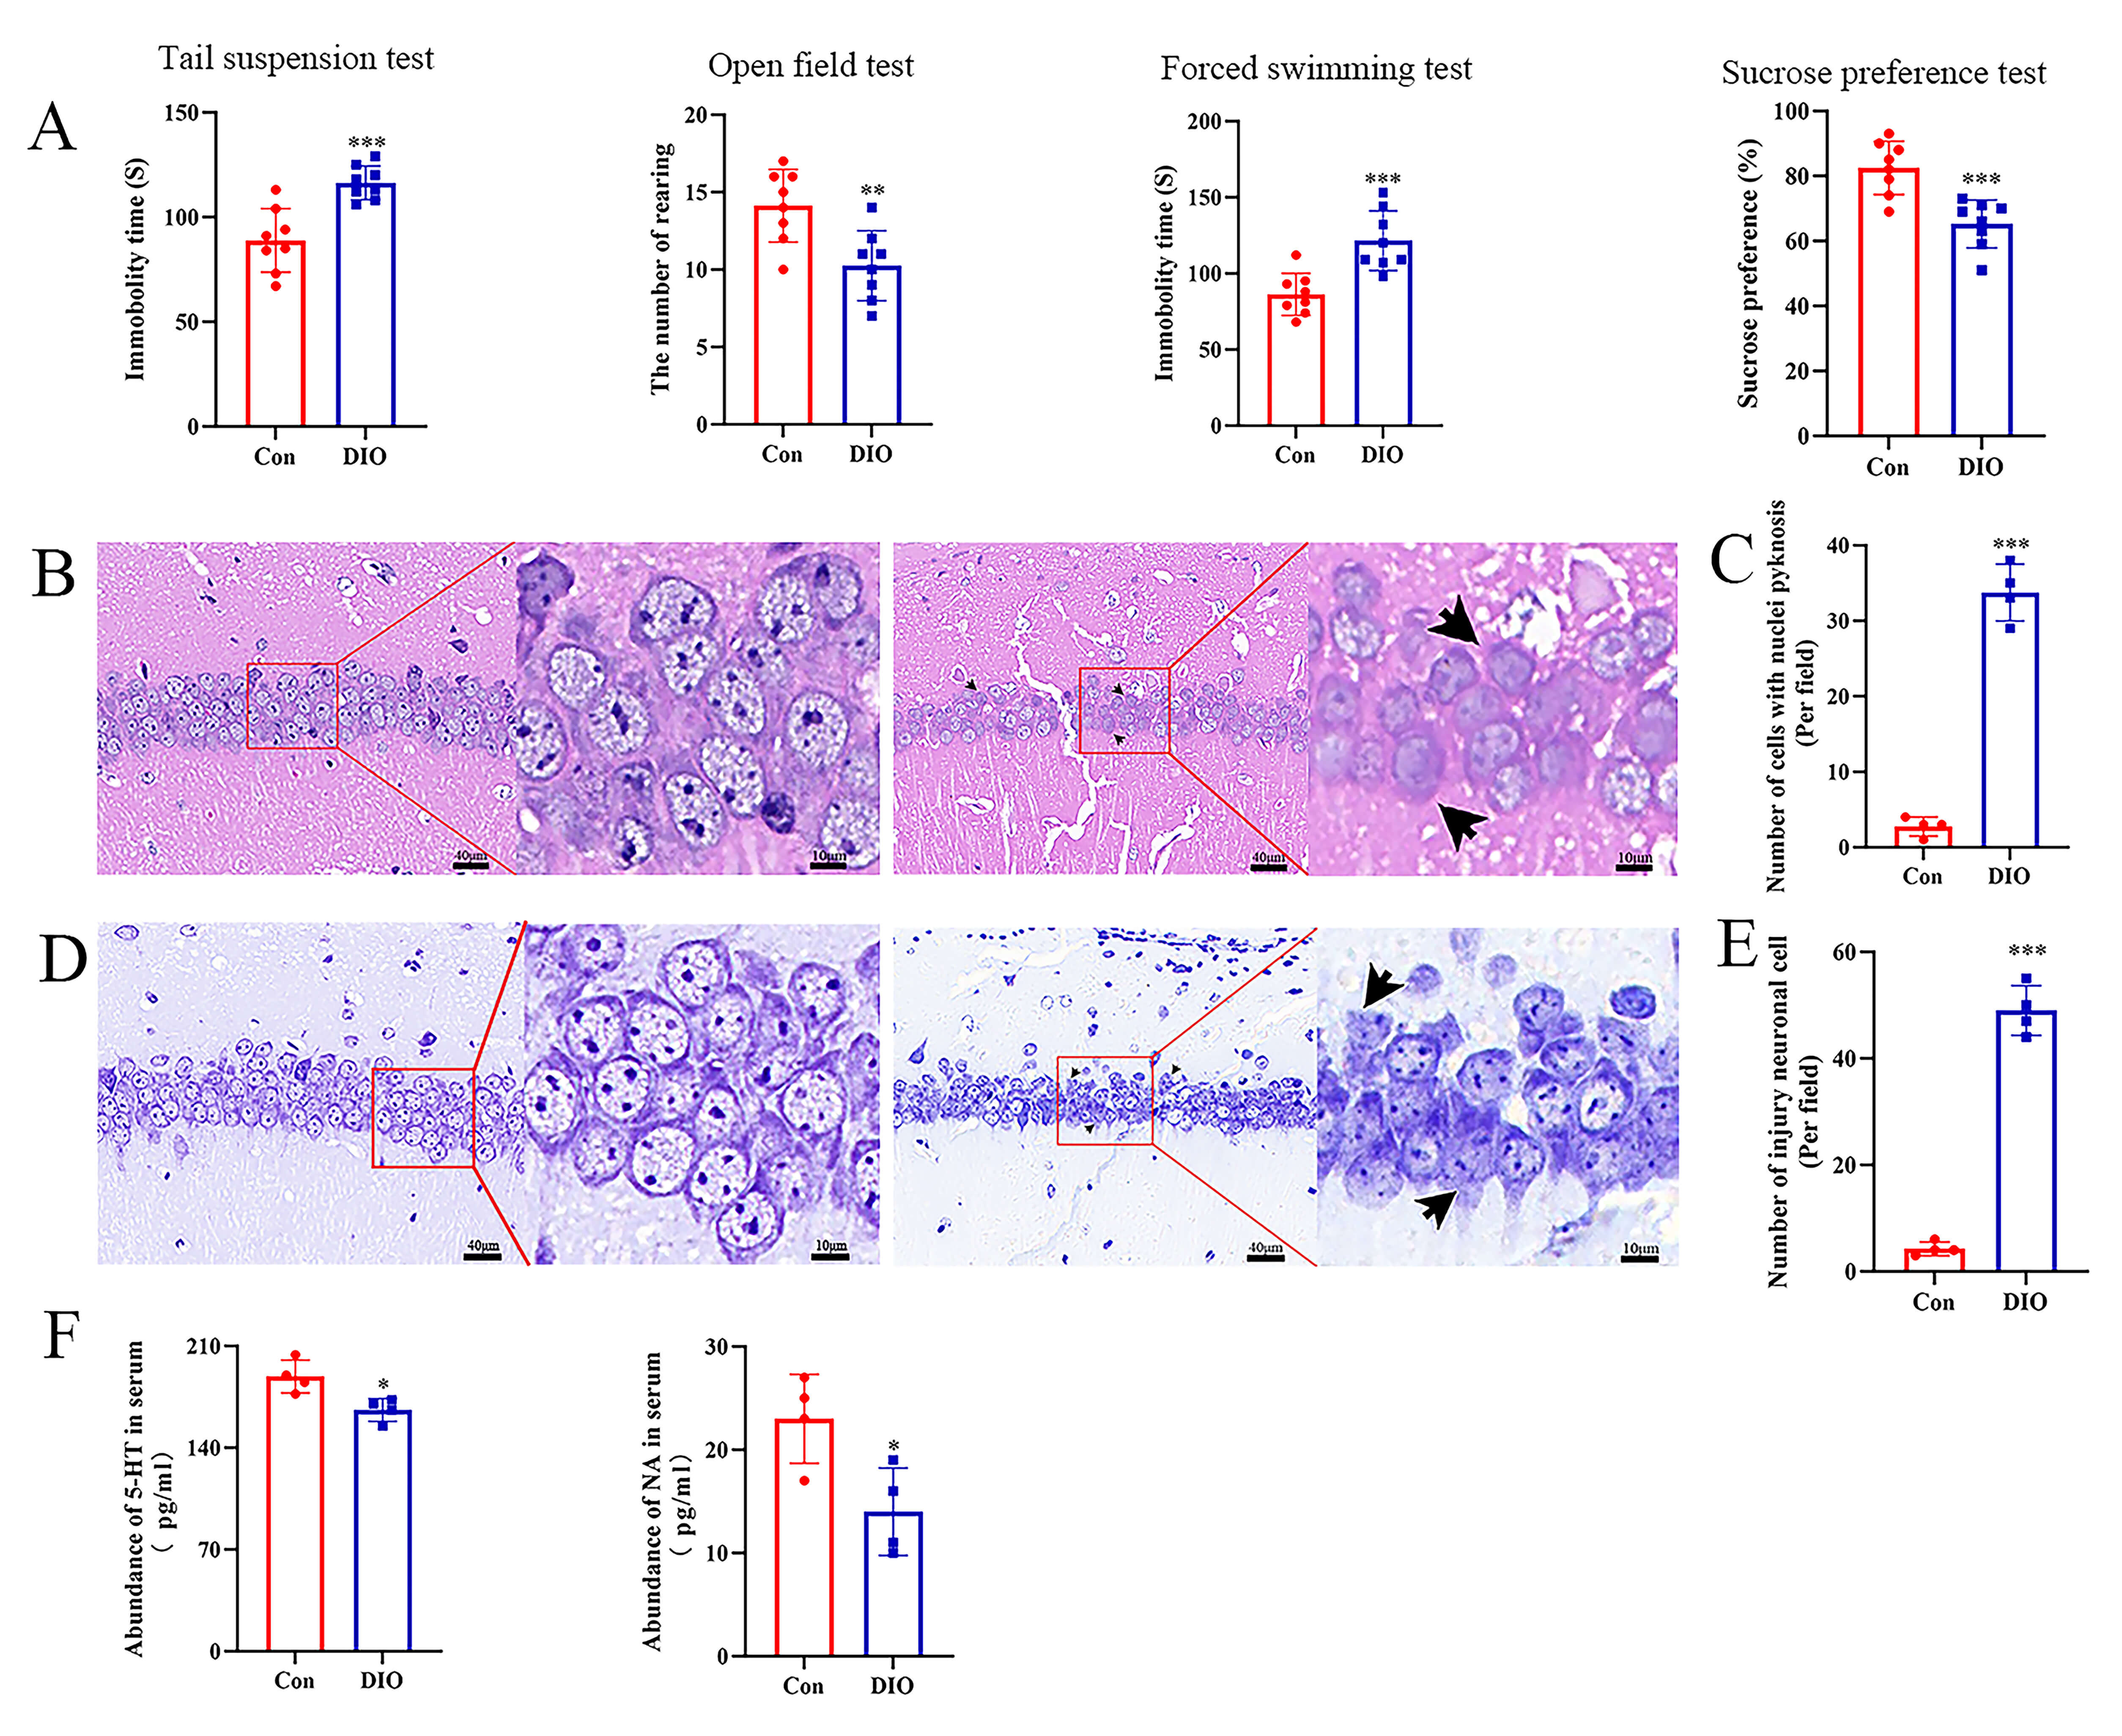 Fig. 3.
Depressive-like phenotypes and neuronal damage in DIO mice. (A)
Comparison of depressive-like behaviors between groups (n = 8). (B)
Representative hematoxylin and eosin (H&E) stained images of the ventral
hippocampal CA1 subregion. Pyknotic cells are indicated by black arrows. Scale
bars = 40 µm (overview) and 10 µm (inset/enlarged view). (C)
Quantification of pyknotic cells in the hippocampus. Damaged neurons are
indicated by black arrows (n = 4). (D) Representative Nissl-stained images of the
hippocampus. Scale bar = 20 µm. (E) Quantification of hippocampal neuronal
damage (n = 4). (F) Abundance of 5-hydroxytryptamine (5-HT) and norepinephrine
(NA) in serum (n = 4). *p
To determine whether DIO triggers a pro-inflammatory response in the brain, we
assessed the polarization state of microglia in the
hippocampus. Immunofluorescence double-labeling for Iba1 (a microglial marker)
and iNOS (a marker for the M1 pro-inflammatory phenotype) revealed markedly
increased co-localization in the hippocampus of DIO mice compared to controls,
suggesting a shift towards the M1 polarized state (Fig. 4A). Quantitative
analysis confirmed a significant increase in the percentage of iNOS-positive
microglia in the DIO group (p = 0.002; Fig. 4B). To further validate
this pro-inflammatory shift, glial cells from the brains of both groups were
isolated. Representative images of the extracted glial cells are shown in Fig. 4C. Analysis of these cells revealed a significantly enhanced inflammatory
profile in the DIO group. At the transcriptional level, mRNA expression of
classic M1 markers, including TNF-
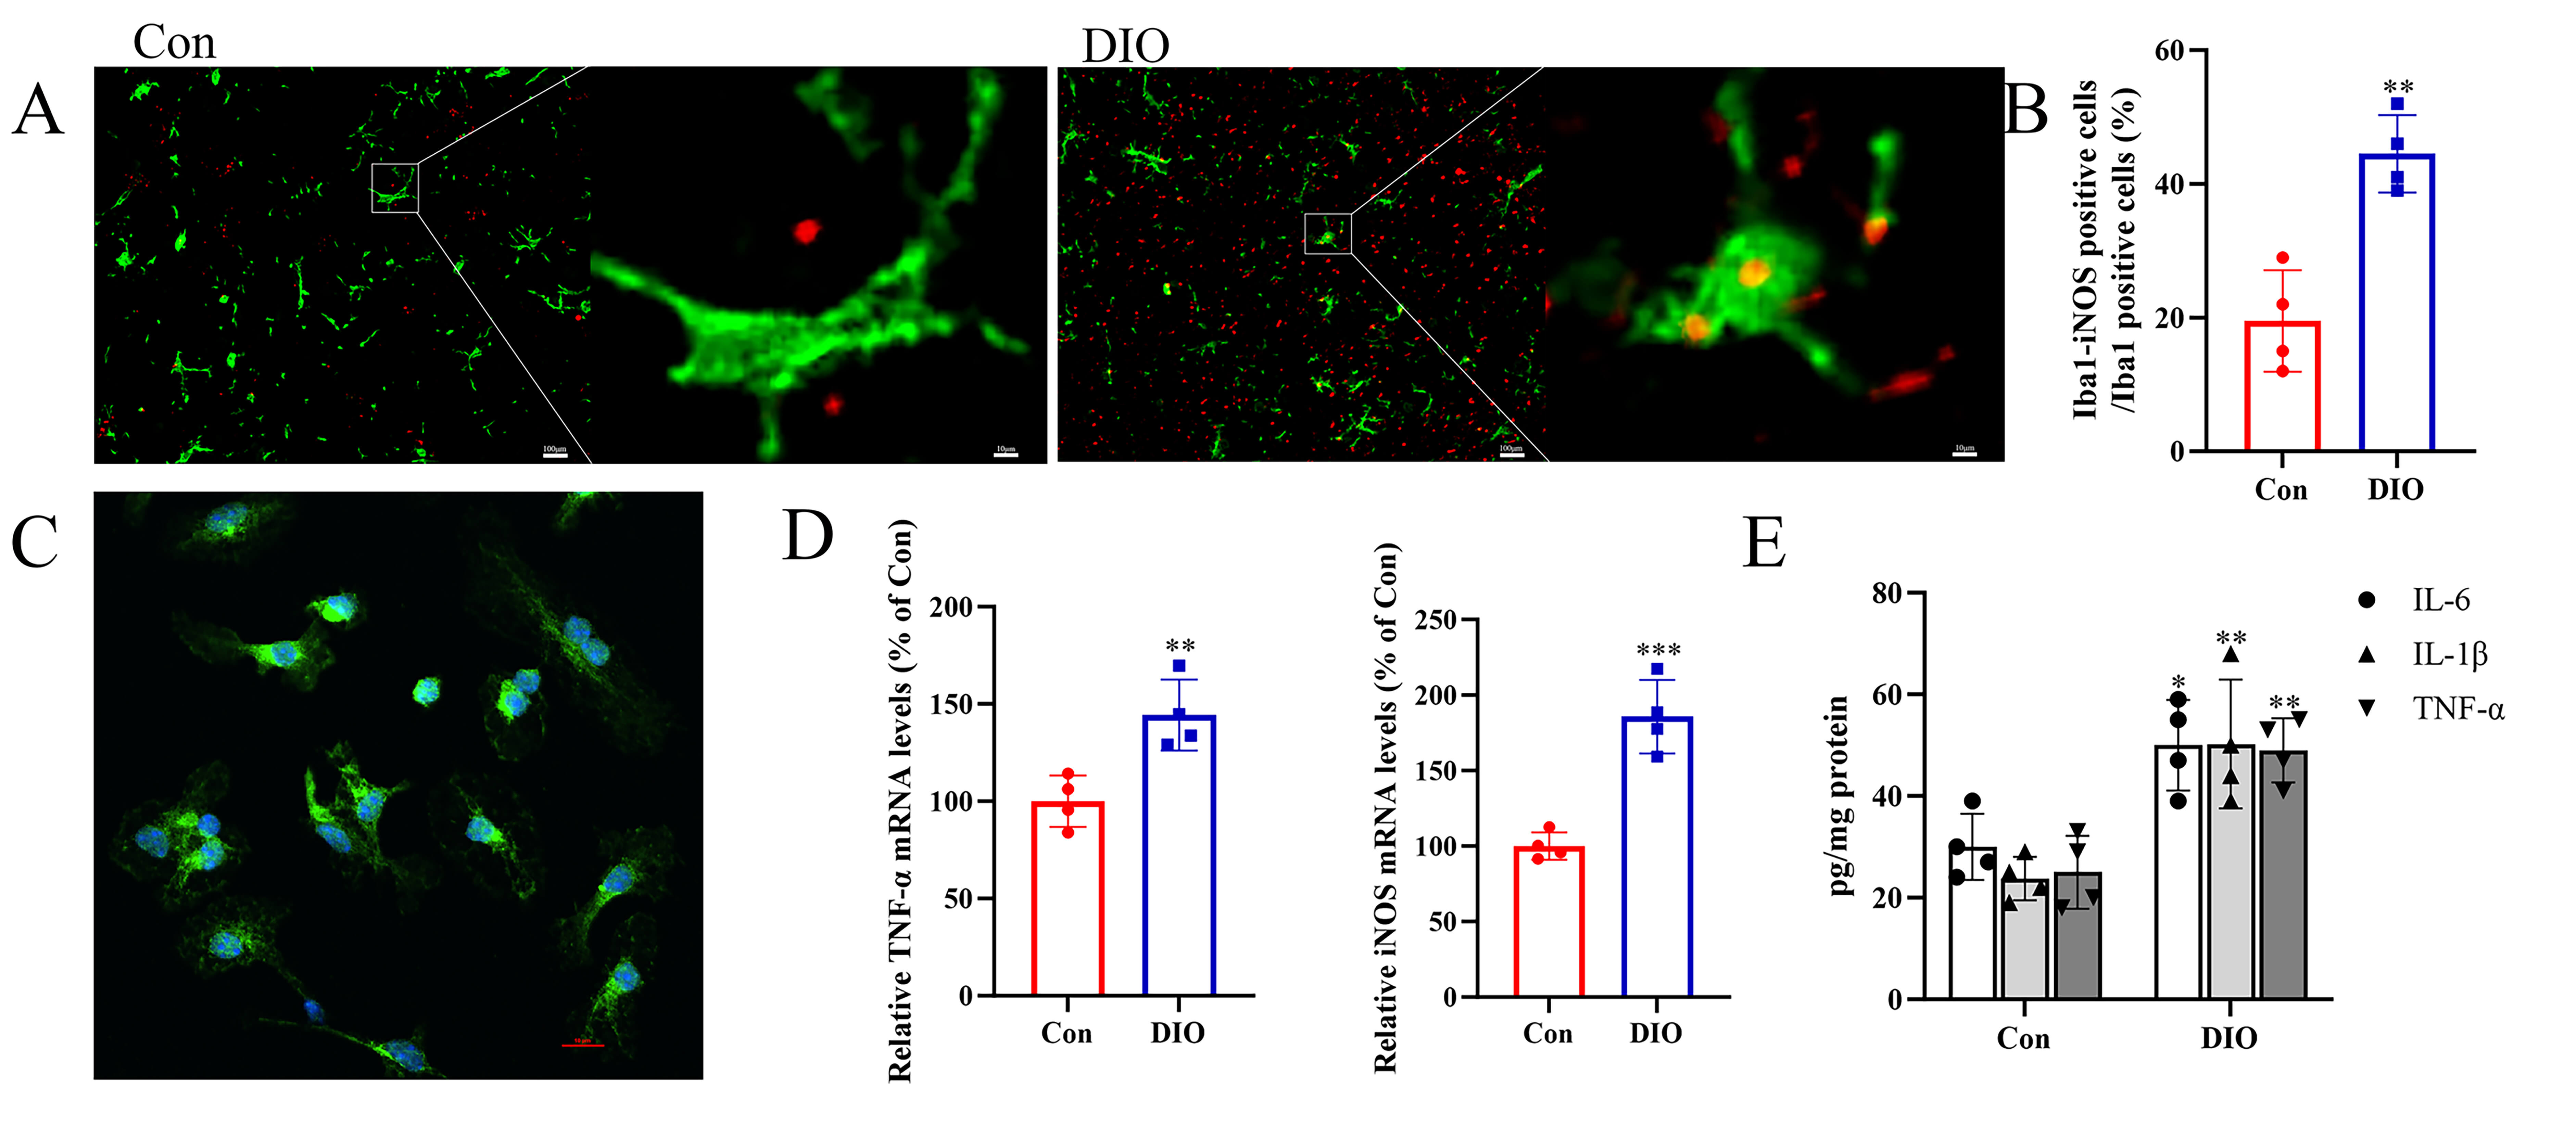 Fig. 4.
Hippocampal microglia in DIO mice show enhanced M1 polarization
and a pro-inflammatory signature. (A) Representative double immunofluorescence
staining of Iba1 and iNOS in hippocampal sections. The white arrow represents
an M1-polarized pro-inflammatory microglial phenotype. Scale bars = 100 µm
(overview) and 10 µm (inset/enlarged view). (B) Bar chart showing the
proportion of double-labeled cells relative to microglia (n = 4). (C)
Immunofluorescence of glial cell cultures. Scale bar = 10 µm. (D) mRNA
levels of M1 phenotypic markers in glial cells from the two groups (n = 4). (E)
Levels of pro-inflammatory cytokines (n = 4). *p
A transwell co-culture system was established to directly investigate the
functional impact of DIO microglia on neuronal health. As schematically
illustrated in Fig. 5A, this system allows the exchange of soluble factors
between glial cells cultured in the upper chamber and hippocampal neurons
cultured in the lower chamber, without direct cell-to-cell contact. We first
assessed the viability of hippocampal neurons after exposure to conditioned media
from the different microglial populations. The CCK-8 assay revealed the viability
of hippocampal neurons co-cultured with DIO microglia was significantly reduced
compared to those co-cultured with control microglia (p = 0.031; Fig. 5B). Concurrently, the release of LDH, an indicator of neuronal cytotoxicity and
membrane damage, was markedly elevated in the co-culture system containing DIO
microglia (p = 0.005; Fig. 5C). Representative flow cytometry plots
(Fig. 5D) and their quantitative analysis confirmed a significantly higher rate
of apoptosis in hippocampal neurons exposed to factors derived from DIO microglia
(p = 0.005; Fig. 5E). Given the established link between inflammation
and oxidative stress, we also measured the levels of intracellular
ROS. Representative flow cytometry histograms (Fig. 5F) and their quantification
revealed a significant increase in ROS accumulation in neurons co-cultured with
DIO microglia (p
 Fig. 5.
Neurotoxic effects of DIO microglial conditioned media on
hippocampal neurons in a co-culture system. (A) Schematic diagram of a transwell
co-culture system. (B) CCK-8 assay results for cell viability (n = 4). (C)
Measurement of lactate dehydrogenase (LDH) activity (n = 4). (D) Analysis of
apoptosis by flow cytometry. (E) Bar graph showing apoptosis of hippocampal
neurons (n = 4). (F) Flow cytometric analysis of intracellular reactive oxygen
species (ROS). (G) Bar graph showing the relative fluorescence intensity of ROS
(n = 4). *p
To investigate the hypothesis that metabolic disturbances in DIO lead to lipid
accumulation within microglia, we performed a morphological and ultrastructural
analysis. Immunofluorescence staining for Iba1 and Bodipy (a neutral lipid dye)
revealed markedly increased co-localization in the hippocampus of DIO mice
compared to controls (Fig. 6A), indicating a substantial accumulation of neutral
lipids within microglial cells in the DIO group. Quantitative analysis of the
fluorescence intensity confirmed a significant increase in Bodipy signal within
Iba1-positive cells in DIO mice (p = 0.015; Fig. 6B). To further
validate these findings at a higher resolution, microglia were examined using
transmission electron microscopy (TEM). Representative electron micrographs
revealed the presence of large, electron-lucent LDs in the cytoplasm of microglia
from DIO mice (Fig. 6C). Taken together, these data provide direct visual and
quantitative evidence that DIO induces a state of significant lipid overload, as
demonstrated by the accumulation of LDs in hippocampal microglia. Quantitative
morphometric analysis of TEM images also revealed a significant increase in the
average diameter of LDs within the hippocampal microglia of DIO mice compared to
the control group (p
 Fig. 6.
Lipid droplet accumulation in the hippocampal microglia of DIO
mice. (A) Representative immunofluorescence images showing co-localization of
Iba1 (green) and Bodipy (red) in the ventral hippocampal CA1 subregion
(approximately Bregma –3.5 mm). White arrows indicate lipid droplet-positive
microglia. Scale bars = 100 µm (overview) and 20 µm (inset/enlarged
view). (B) Proportion of double-stained (Iba1+/Bodipy+) microglia (n =
4). (C) Representative electron micrograph showing lipid droplet size in
microglia. Scale bar = 500 nm. LD, lipid droplet; Lys, lysosome. (D) Quantitative
analysis of lipid droplet size in microglia (n = 8). *p
To assess the intrinsic propensity for lipid accumulation in microglia under DIO
conditions, we examined primary cells isolated from the DIO and Con
groups. Bodipy staining of cultured microglia revealed the presence of LDs (Fig. 7A). Morphometric analysis of these images indicated a distinct pattern of lipid
storage: the average size of LDs was significantly larger in microglia from DIO
mice (p = 0.004; Fig. 7B), whereas the number of LDs per cell was
comparable between the two groups (p = 0.123; Fig. 7B). This observation
was confirmed using an alternative histological method. Oil Red O staining also
demonstrated more substantial lipid accumulation in DIO microglia (Fig. 7C). Densitometric measurement of the staining intensity confirmed a significant
increase in total neutral lipid content in the DIO group compared to controls
(p
 Fig. 7.
Enhanced in vitro lipid accumulation and triglyceride
content in glial cells from DIO mice. (A) Bodipy staining in glial cells. Scale
bar = 100 µm. (B) Analysis of lipid droplet size and number in microglia (n
= 4). (C) Oil Red O (ORO) staining in glial cells. Scale bar = 100 µm. (D)
Normalized number of Oil Red O-positive puncta per cell (n = 4). (E) Normalized
intracellular triglyceride (TG) level (n = 4). **p
To comprehensively investigate the impact of the DIO state on the lipid landscape of microglia, we performed an untargeted lipidomics analysis on glial cells isolated from Con and DIO mice. PCA demonstrated a clear separation between the two groups (Fig. 8A), indicating a distinct global lipidomic profile in DIO microglia. Unsupervised hierarchical clustering of the top 50 most differentially abundant lipids further highlighted pronounced differences, as visualized in a heatmap (Fig. 8B). A ranked metabolite plot detailed these specific alterations (Fig. 8C). Pathway enrichment analyses were performed to gain functional insights. Kyoto Encyclopedia of Genes and Genomes (KEGG) pathway analysis revealed significant enrichment for several lipid metabolism-related pathways, including adipocytokine signaling, fat digestion and absorption, lipid degradation, sphingolipid signaling, glycerophospholipid metabolism, and biosynthesis of unsaturated fatty acids (Fig. 8D). Consistent with these findings, reactome pathway analysis confirmed significant perturbations in key biological processes such as fatty acid transport, sphingolipid metabolism, and overall lipid metabolism (Fig. 8E). Collectively, these data demonstrate substantial and broad rewiring of the lipid metabolic network in the microglia of DIO mice.
 Fig. 8.
Lipidomic profiling of glial cells from DIO mice. (A) PCA analysis of untargeted lipidomics. (B) Heatmap analysis of differential metabolites. (C) Visualization of differential metabolites with a lollipop plot. (D) KEGG pathway enrichment analysis. (E) Reactome pathway enrichment analysis. PCA, principal component analysis; KEGG, Kyoto Encyclopedia of Genes and Genomes.
Our study delineates a compelling pathogenic cascade that connects DIO to depression-like pathophysiology, centering on the critical role of hippocampal microglia. The findings suggest that HFD is associated not only with depressive-like behaviors, but also with a profound functional transformation in microglia. This transformation is characterized by the excessive accumulation of intracellular lipid, a phenomenon which in the context of metabolic stress has recently been termed “microglial lipidosis”. The lipid-laden state of microglia is mechanistically linked to a pro-inflammatory, M1-polarized phenotype that drives significant hippocampal neuronal damage. However, it is important to note that the quantitative histological analyses of neuronal damage were conducted with a limited sample size (n = 4 per group). While the observed effects were large, consistent, and supported by our functional co-culture data, future studies with larger cohorts are warranted to confirm these findings. By integrating behavioral, histological, and cellular evidence, our findings position microglial lipid dysregulation as a pivotal mechanism that translates peripheral metabolic distress into inflammation and dysfunction of the central nervous system, thereby expanding the concept of the gut-brain axis in metabolic disorders [16]. Importantly, this pathway identifies several promising avenues for clinical translation, offering new hope for diagnosing and treating the increasingly prevalent condition of metabolic depression.
The transition of microglia from homeostatic sentinels to lipid-laden,
pro-inflammatory effector cells appears to be a cornerstone of this process. The
pronounced accumulation of LDs, as vividly captured by Bodipy staining and
electron microscopy, indicates a state of metabolic overload that overwhelms the
normal catabolic functions of these cells. This phenomenon is increasingly
recognized in neuroinflammatory conditions such as Alzheimer’s disease and other
neurodegenerative disorders [17]. Our observations are consistent with recent
work showing that metabolic stress can induce a distinct
“lipid-droplet-accumulating” microglial state, with impaired phagocytic
function and enhanced cytokine production [18, 19]. Our lipidomics data confirms
the presence of broad alterations in pathways such as glycerophospholipid and
sphingolipid metabolism, consistent with prior reports linking lipid
dysregulation to neuroinflammation [20, 21]. However, the key clinical insights
lie not in the specific lipid species that are altered, but in the overarching
phenomenon itself. These lipid alterations may contribute directly to the
pro-inflammatory phenotype. For instance, lipids enriched with saturated fatty
acids could drive the production of pro-inflammatory cytokines (e.g.,
TNF-
Our co-culture experiments established a direct causal link through which glial cell-enriched isolates from DIO mice inflict severe damage on healthy hippocampal neurons. Our findings highlight the therapeutic potential of targeting this microglial dysfunction. The observed neuronal injuries, including increased apoptosis and oxidative stress, provide insight into a potential cellular mechanism that may contribute to hippocampal atrophy and the functional deficits often associated with major depressive disorder [25, 26]. Interruption of the deleterious crosstalk from microglia to neurons could therefore represent a rational treatment strategy. The most immediate translational value of our findings may lie in the repurposing of existing metabolic drugs. For instance, peroxisome proliferator-activated receptor agonists, such as the glitazones used in type 2 diabetes, are known regulators of lipid metabolism and possess anti-inflammatory properties. These have shown promise in preclinical models of neuroinflammation [27, 28]. Our data provide strong justification for preclinical studies investigating these agents in patients with comorbid obesity and depression, with the rationale being that they could help to normalize lipid metabolism in brain immune cells, thereby reducing neuroinflammation. Similarly, drugs targeting sphingolipid metabolism, another involved pathway in our model, are being developed for other conditions and could also be explored for metabolic depression, given the emerging role of sphingolipids in neurological disease [29, 30].
Our work underscores the importance of lifestyle interventions that extend beyond simple weight loss. The fact that a dietary insult can trigger such a dramatic cascade in the brain reinforces the concept that “brain health is metabolic health”, echoing findings from epidemiological studies linking Western-style diets to an increased risk of depression [31, 32]. For patients with treatment-resistant depression and metabolic syndrome, structured dietary interventions aimed at reducing systemic inflammation and lipid levels could be prescribed as an adjuvant to psychotherapy or pharmacotherapy, with the specific goal of mitigating the microglial-driven pathway. This provides a biological rationale for the observed antidepressant effects of anti-inflammatory diets and highlights the need for a more integrated, systemic approach to managing depression, consistent with recent clinical trials demonstrating the efficacy of dietary interventions in depression [33, 34].
It is important to acknowledge the inherent limitations of this study. The experimental design utilized male mice only to avoid potential confounders associated with the female estrous cycle. However, this meant we were unable to evaluate sex differences, despite their known importance in human depression and immunometabolism [35, 36]. Furthermore, a fundamental question that remains unresolved is whether intervening in microglial lipid metabolism can reverse the pathological process once it has been established. A critical question for future clinical research will therefore be to determine whether lipid accumulation in microglia is a reversible phenomenon. If the sequestration of lipids is an adaptive and protective response to an overwhelming influx, therapeutic strategies that improve systemic metabolism and reduce the lipid burden on the brain may allow microglia to gradually clear their LDs and return to a homeostatic state. This was suggested by a recent study showing metabolic flexibility in microglia [37]. Conversely, if chronic lipid loading leads to an irreversible transformation, then early intervention becomes paramount, emphasizing the need for a preventive approach in individuals with metabolic risk factors. In this case, screening for subclinical depressive symptoms long before the full-blown disorder develops is critical, aligning with recent moves toward precision psychiatry.
Several other limitations of this study should also be acknowledged. First, the sample size for certain analyses was modest, which warrants caution in interpreting the findings. Second, the exclusive use of male mice, while controlling for hormonal variations associated with the estrous cycle, prevents investigation of potential sex differences in the observed effects. These limitations highlight the need for future studies with larger sample sizes and including both sexes to confirm and extend our preliminary observations. Another limitation is the microglial isolation method using Percoll gradient centrifugation. While this method effectively enriches for glial cells, the resulting enriched fraction may also contain other cell types. Thus, the lipidomic alterations reported here, while highly suggestive, were characterized in this enriched fraction rather than in a pure microglial population. Future studies using more stringent purification methods, such as fluorescence-activated cell sorting (FACS) or magnetic-activated cell sorting (MACS), will be essential to confirm the observed changes specifically in microglia.
In conclusion, our findings suggest that microglial lipid accumulation and the subsequent neuroinflammatory response may represent a potential mechanistic link between obesity and depression. The primary clinical value of this research is the identification of a novel, druggable pathway that goes beyond the traditional neurocentric view of depression. This shifts the therapeutic focus towards normalizing the metabolic-immune interface within the brain, in line with the growing concept of immunometabolic depression. By reconceptualizing a subset of depression as a disorder of immunometabolism, our findings open the door to more personalized and effective treatment strategies. Targeting lipid metabolism in glial cells, either through novel pharmacologic agents or repurposed metabolic drugs, alongside targeted lifestyle changes, may break the vicious cycle linking poor metabolic health to the devastating experience of depression. This could potentially inform the development of more effective and holistic patient care strategies.
The datasets used and analyzed in this study can be obtained from the corresponding author upon reasonable request.
XJL, JCC, YZX, PZ, and ZP designed the research study. The research and experiments were performed by XJL, ZP, YZX, ZYY, and YLY, with the experimental work primarily conducted by XJL, JCC, YZX, and PZ. XJL and ZP analyzed the data and wrote the manuscript. All authors contributed to editorial revisions, read and approved the final manuscript, and agreed to be accountable for all aspects of the work.
All animal procedures were performed in accordance with the guidelines approved by the Institutional Review Board of The Affiliated Nanhua Hospital. All animal procedures were approved by the Animal Ethics Committee of Affiliated Nanhua Hospital, University of South China (Approval number: 2025-ky-126). All animal experiments in our study were conducted in strict accordance with National Institutes of Health Guide for the Care and Use of Laboratory Animals.
Not applicable.
This work was supported by Natural Science foundation of Hunan Province (grant number: 2025JJ81092) and the Clinical Medical Technology Innovation Guide Project of Hunan Province, China (grant number: 2021SK51901).
The authors declare no conflict of interest.
During the preparation of this work, the authors used ChatGPT and DeepSeek to assist with language polishing, grammar checking, and formatting suggestions. After using these tools, the authors thoroughly reviewed and revised the content and take full responsibility for the final version of the manuscript.
References
Publisher’s Note: IMR Press stays neutral with regard to jurisdictional claims in published maps and institutional affiliations.