


 , Siyu Long 1,2,†, Wenjun You 3, Jing Zhu 1, Jiawen Chen 1,2, Mengyu Zhou 1,2, Jie Gao 1,*
 , Su Liu 1,2,*
1 Department of Rehabilitation Medicine, Affiliated Hospital of Nantong University, 226001 Nantong, Jiangsu, China
2 School of Nursing and Rehabilitation, Nantong University, 226001 Nantong, Jiangsu, China
3 Department of Geriatrics, Affiliated Nantong Rehabilitation Hospital of Nantong University, 226001 Nantong, Jiangsu, China
†These authors contributed equally.
Abstract
The subjective limitations of neurobehavioral assessment cause a high misdiagnosis rate for disorders of consciousness (DoC). The purpose of this study was to identify the DoC level based on an analysis of multi-dimensional electroencephalogram (EEG) signals to assist with establishing a clinical diagnosis.
Sixty-seven patients with DoC [coma, n = 19; vegetative state (VS), n = 23; and minimally conscious state (MCS), n = 25] were included to analyze resting state EEG characteristics. The EEG features were statistically compared among five band powers (delta, theta, alpha, beta, and gamma) and five brain regions (prefrontal, frontal, parietal, temporal, and occipital) by multidimensional analyses, including time-domain analysis, spectral analysis, and functional brain connectivity.
Amplitude-integrated electroencephalography (aEEG) center amplitude showed significant differences between coma and MCS (p = 0.02688), with no significant differences observed for the other comparison. Spectral analysis revealed that delta and theta power decreased with higher consciousness levels, whereas alpha, beta, and gamma power increased. Relative power differed among groups across specific brain regions (prefrontal, frontal, parietal, temporal, and occipital) and frequency bands. Weighted Phase Lag Index (wPLI) based functional connectivity demonstrated frequency-specific network reorganization with theta band connectivity strongest in VS and alpha/beta/gamma band connectivity enhanced in MCS. Absolute power topographic maps showed expanding high-power regions from coma-to-MCS in high-frequency bands and the left dorsolateral prefrontal cortex (DLPFC) (F3 electrode) exhibited a consistent power gradient of coma < MCS < VS across all bands.
Multidimensional EEG features have significant value in differentiating the levels of consciousness disorders. aEEG center amplitude discriminated MCS from coma; delta/gamma relative power separated VS from MCS, and alpha/beta relative power separated coma, VS, and MCS. Parieto-occipital connectivity matrix in the theta band distinguishes coma from VS, while absolute power topography of the left DLPFC shows potential for grading levels of impaired consciousness. These electrophysiologic biomarkers complement behavioral assessments, enhancing diagnostic accuracy.
Keywords
- disorders of consciousness
- electroencephalogram
- spectrum analysis
Disorders of consciousness (DoC) refer to a spectrum of conditions characterized by impaired levels of consciousness due to various underlying causes. DoC are primarily classified into coma, vegetative state (VS), and minimally conscious state (MCS) [1]. Despite advances in clinical practice, accurately determining the specific level of consciousness in DoC patients remains a significant challenge. The precise assessment and differentiation between these states are crucial for guiding diagnosis and treatment but continue to present difficulties in the management of DoC patients.
Several standardized assessment methods have been developed specifically for evaluating DoC patients, among which the Coma Recovery Scale-Revised (CRS-R) is widely recognized for its practicality and effectiveness. The CRS-R is particularly sensitive in detecting the MCS, making the CRS-R a valuable tool in the assessment of DoC patients. However, the reliability of these neurobehavioral measures can be compromised due to the subjective nature of the evaluation process, resulting in variable accuracy of the assessment outcomes [2]. Therefore, while neurobehavioral scales are useful for diagnosing DoC, neurobehavioral scales are not entirely dependable.
Neuroimaging techniques, such as functional Magnetic Resonance Imaging (fMRI) and Positron Emission Tomography (PET), provide objective assessment of DoC by probing underlying brain function, detecting covert awareness, and revealing behaviorally undetectable neural correlates of consciousness [3, 4]. However, routine clinical use of neuroimaging techniques is significantly limited by high costs, restricted accessibility, technical demands (e.g., patient transport and MRI compatibility), and challenges in scanning critically ill patients [5]. In contrast, electroencephalogram (EEG)-based approaches offer substantial advantages, including bedside monitoring of spontaneous brain activity, delivering high temporal resolution, portability, repeatability, and lower cost [6]. Advances in EEG analysis enhance diagnostic accuracy and covert consciousness detection [7, 8], making EEG a critical tool for complementing behavioral and neuroimaging assessments. Within the EEG methodologies, amplitude-integrated EEG (aEEG) presents a streamlined solution. aEEG compresses raw EEG data into min-max amplitude bands on a semi-log scale, enabling rapid visual trend assessment [9]. Although originally developed for neonatal monitoring [9], the artifact tolerance, simplicity, and suitability of aEEG for continuous monitoring facilitate effective translation to adult critical care [10], for which aEEG is gradually being applied.
EEG signals are classified into low-frequency bands, including delta, theta, and alpha, as well as high-frequency bands, such as beta and gamma. The brain activity state is assessed based on the amplitude and fluctuations of EEG waveforms. Under normal awake conditions EEG amplitudes and waveforms exhibit regular patterns. However, the spectral power across these frequency bands is significantly disrupted in patients with DoC [11]. Klimesch [12] reported that variations in alpha and theta reflect cognitive function and memory capabilities. Patients with DoC typically display enhanced delta and suppressed alpha compared to healthy individuals [5]. Naro et al. [13] further noted that patients with MCS exhibit higher power in theta and alpha than patients with VS in whom alpha wave activity is closely associated with consciousness recovery. Specifically, alpha power in the parietal and occipital regions is significantly increased in patients with MCS [13, 14]. In addition, Piarulli et al. observed that beta power is notably higher in patients with MCS compared to patients with VS. However, research on high-frequency bands, such as beta and gamma in DoC, is limited [15].
Consciousness-related information in the brain is often complex and multifaceted. The spectral power of EEG and the amplitude changes in specific frequency bands reflect the differences and correlations between various states of consciousness. Numerous studies have examined the relationship between EEG and consciousness states and shown that consciousness is not simply a “present or absent” condition. EEG-based neurofunctional imaging techniques offer an innovative approach to tackling this challenge. Cavinato et al. [16] observed that patients in a VS exhibit impaired cortical integration with significant disruption of the associations between the frontal and parietal lobes. In contrast, Wu et al. [17] reported that patients in a MCS exhibit superior functional connectivity between brain regions with enhanced cortical peripheral connectivity compared to patients with VS [16, 17, 18, 19]. Increasing evidence suggests that resting-state EEG coherence serves as a robust tool for quantifying the relationship between conscious awareness and cerebral information processing and provides more granular insight into differentiating between various levels of consciousness [20, 21]. Patients who regained consciousness demonstrated higher levels of cortical functional connectivity in quantity and strength in a clinical trial assessing the prognosis of patients with DoC over a 3-month period [22]. Schorr et al. [23] proposed that the coherence between frontal and parietal regions serve as a predictive marker for dynamic shifts in consciousness states, such as recovery from VS-to-MCS with delta and theta in the parietal cortex showing high sensitivity and specificity in forecasting recovery in patients with VS.
It is indisputable that significant challenges remain in the diagnosis and management of DoC, primarily due to an insufficient understanding of the neurophysiologic mechanisms underlying consciousness. Therefore, a comprehensive analysis of EEG signals was performed in DoC patients with a focus on the whole-brain power spectral distribution, amplitude fluctuations within distinct frequency bands, and the functional state of brain connectivity in the resting state. By integrating these brain-machine data, a more cohesive model of the consciousness network within the brain was constructed. Furthermore, the most valuable EEG features related to consciousness were identified, thereby advancing the use of resting-state EEG in DoC. This approach will enhance the accuracy of diagnosis, enable better monitoring of therapeutic interventions, and facilitate the prediction of recovery in DoC patients.
This study recruited a total of 90 patients with DoC from the Department of Rehabilitation Medicine of the Affiliated Hospital of Nantong University (Jiangsu, China). Due to issues, such as poor data quality and changes in clinical condition, 23 patients withdrew during the study. Ultimately, 67 patients were included in the analysis (19 with coma, 23 with VS, and 25 with MCS). The baseline characteristics of the sample are listed in Table 1.
| Variables | Coma | VS | MCS | p | |
| n = 19 | n = 23 | n = 25 | |||
| Gender, n (%) | 0.105 | ||||
| Male | 9 (47.4%) | 12 (52.2%) | 19 (76.0%) | ||
| Female | 10 (52.6%) | 11 (47.8%) | 6 (24.0%) | ||
| Age, years | 0.944 | ||||
| Median (Q𝑙, Q𝑢) | 64 (58.0, 71.0) | 64 (56.0, 69.0) | 64 (48.5, 74.5) | ||
| Time since injury, months | 0.099 | ||||
| Median (Q𝑙, Q𝑢) | 2.0 (1.3, 2.4) | 1.4 (1.1, 2.3) | 1.3 (1.0, 1.9) | ||
| Etiology | 0.512 | ||||
| NTBI | 10 (52.6%) | 11 (47.8%) | 9 (36.0%) | ||
| TBI | 9 (47.4%) | 12 (52.2%) | 16 (64.0%) | ||
| Behavioral scale assessment | |||||
| Total score of CRS-R | 2 (1, 3) | 9 (7, 9) | 12 (11, 14) | ||
| Total score of GCS | 4 (3, 5) | 6 (4, 7) | 11 (10, 11) | ||
VS, vegetative state; MCS, minimally conscious state; NTBI, non-traumatic brain injury; TBI, traumatic brain injury; CRS-R, coma recovery scale-revised; GCS, glasgow coma scale.
All enrolled patients met the following inclusion criteria: (1) met the
diagnostic criteria for DoC [6, 24]; (2)
The study was conducted under the Declaration of Helsinki of the World Medical Association and approved by the Ethics Committee of Nantong University Affiliated Hospital on 20 July 2024. The approval number for the study was 2024-K142-01. Before inclusion, the researcher fully informed the legal guardian of each patient about the study protocol and obtained informed consent, especially those in a coma state.
Patients were systematically evaluated using the CRS-R and Glasgow Coma Scale (GCS) after a preliminary diagnosis of DoC [25, 26, 27]. Two trained therapists independently performed all assessments with discrepancies resolved through consensus. Three separate CRS-R and GCS evaluations were performed to accurately determine the patient’s level of consciousness at least 5 d prior to the EEG assessment.
CRS-R systematically evaluates 6 functional domains (auditory, visual, motor, oromotor/verbal, communication, and arousal) using a 23-point hierarchical scale. Lower subscale scores suggest brainstem-mediated reflexive responses, while higher scores imply cortically-driven cognitive processing. As the gold-standard behavioral assessment for DoC, CRS-R demonstrates superior sensitivity in differentiating unresponsive wakefulness syndrome (UWS) from a MCS by detecting reproducible neurobehavioral markers, such as visual tracking [2].
GCS quantifies acute cerebral dysfunction through triaxial responsiveness, as
follows: ocular (1–4); verbal (1–5); and motor (1–6). Total scores stratify
injury severity, as follows: 15 (intact); 13–14 (mild); 9–12 (moderate); and 8
(coma/severe dysfunction) [28, 29]. Serial GCS monitoring (hourly when
Resting-state EEG data were collected from patients with three types of DoC. A
32-channel EEG (ZhenTec-NT1, ZhenTec Intelligent Technology Co., Ltd., Xi’an, Shaanxi, China) cap from a brain-computer interface (BCI) system was utilized. The
electrodes were positioned in accordance with the internationally recognized
10–10 system [30]. The impedance of all electrodes was maintained below 10
k
The pre-selected EEG data were pre-processed using MATLAB 2021a (The MathWorks Inc, Natick, MA, USA) and the EEGLAB toolbox (version 2022.1; Swartz Center for Computational Neuroscience, University of California San Diego, San Diego, CA, USA). The pre-processing steps were as follows: (1) electrode coordinate file was loaded and mapped to the corresponding electrode positions on the EEG cap (Gelfree-S3, Wuhan Greentek Pty. Ltd., Wuhan, Hubei, China); (2) a notch filter was applied using the ERPLAB filter to eliminate a 50-Hz power line interference; (3) band-pass filtering was performed between 1 and 45 Hz using a sixth-order Butterworth filter [31, 32, 33]; (4) Epochs with evident electromyographic or motion artifacts and non-EEG electrodes (e.g., electrooculogram) were excluded; (5) application of independent component analysis (ICA) to identify and remove the components related to physiologic artifacts, such as eye movements and electromyography; and (6) the average results of 30-channel electroencephalogram data.
The aEEG assesses brain electrical activity by real-time monitoring of EEG amplitude characteristics. This method typically involves computing the mean amplitude within specific EEG frequency bands and analyzing waveform trends. Raw EEG was band-pass filtered to the aEEG bandwidth (≈ 2–15 Hz) and time-compressed to generate the amplitude-integrated trace following standard methodology. We extracted the upper envelope (high amplitude) and lower envelope (low amplitude) of the EEG signal. Within each subject, the center amplitude was defined per channel as follows:
Where, upper and lower denote the time-median values of the aEEG margins over the full recording. We then aggregated across the 30 channels by taking the within-subject median, yielding a single whole-brain aEEG-center value per subject for group comparisons (Coma, VS, MCS) [34, 35, 36]. The primary analysis used Kruskal–Wallis test for independent groups with Dunn post hoc comparisons (all three pairwise contrasts).
Power spectral analysis, which is a fundamental methodology for decomposing
neural signals into constituent frequency components and quantifying the energy
distribution, utilizes the fast Fourier transform (FFT) to convert EEG signals
from the temporal domain to the frequency domain. Subsequently, squared amplitude
values were calculated to generate power spectra. To enhance visual
interpretability, power values are typically normalized using logarithmic decibel
(dB) scaling via the following formula: dB = 10
Relative power analysis quantitatively assesses cerebral electrophysiologic activity by evaluating the proportional contribution of specific frequency bands to total spectral power. Relative power analysis quantifies cerebral electrophysiologic activity by calculating the power spectral density (PSD) for each frequency band via Welch’s periodogram, then normalizing the band power with respect to the total power to obtain relative power ratios. This normalization reduces inter-subject variability due to anatomic and technical factors with results often visualized as cortical heat maps, facilitating reliable cross-cohort spectral comparisons.
Furthermore, absolute power topographic mapping visualizes spatial-frequency
abnormalities in DoC via 2D scalp projections derived from 3D data. The
computational pipeline includes the following elements: (1) FFT-based PSD
extraction; (2) spectral summation within clinically relevant bands
(
The wPLI is an extension of the Phase Lag Index (PLI) that integrates a weighting mechanism. This modification provides several potential benefits, such as improved statistical sensitivity for detecting changes in consistent phase lead/lag between signals, enhanced robustness to additional noise sources, and a reduced impact of small phase differences. Consequently, wPLI may provide a more reliable estimate of the coupling strength of neural oscillations in the brain. The calculation method is outlined as follows:
where,
Functional connectivity metrics, including coherence and the wPLI, offer complementary approaches for mapping neural interactions. Coherence captures linear signal synchrony but is confounded by volume conduction artifacts. In contrast, wPLI improves specificity to phase-lagged coupling by weighting phase differences, which effectively suppresses the spurious synchronization arising from volume conduction [37]. In graph-theoretical analyses these metrics are used to define the edge weights of networks where nodes represent brain regions. The resulting connection strengths can be visualized as spatial patterns, aiding the identification of neuropathologic network reorganization. However, interpretation of these findings requires addressing methodologic constraints, including threshold selection biases, signal non-stationarity in wPLI estimation, and integration with structural connectivity data to resolve neurophysiologic ambiguities.
Statistical analyses were performed using SPSS (Version 26.0, IBM Corp., Armonk,
NY, USA) and MATLAB (R2021a, The MathWorks Inc., Natick, MA, USA) with an
The aEEG system quantifies the functional state of the brain by extracting the upper envelope (high amplitude) and lower envelope (low amplitude) of the EEG signal, then calculating the median values of upper- and lower-margin amplitudes [38]. The Dunn’s post hoc test was performed between the groups (Coma–VS, Coma–MCS, and VS–MCS) when the Kruskal–Wallis test showed a significant result. The Kruskal–Wallis test was significant (p = 0.02228), and Dunn’s post hoc test identified a significant Coma–MCS difference (p = 0.02688), with Coma–VS and VS–MCS remaining non-significant (p = 0.6096 and p = 0.3649, respectively) (Fig. 1A). Collectively, the between-group effect was primarily driven by the Coma vs. MCS contrast, with no significant differences observed for the other pairings. These findings indicated that while aEEG center amplitude can effectively distinguish coma from MCS, it may lack sufficient sensitivity to discern not only the distinctions between coma and VS, but also the more subtle ones between VS and MCS.
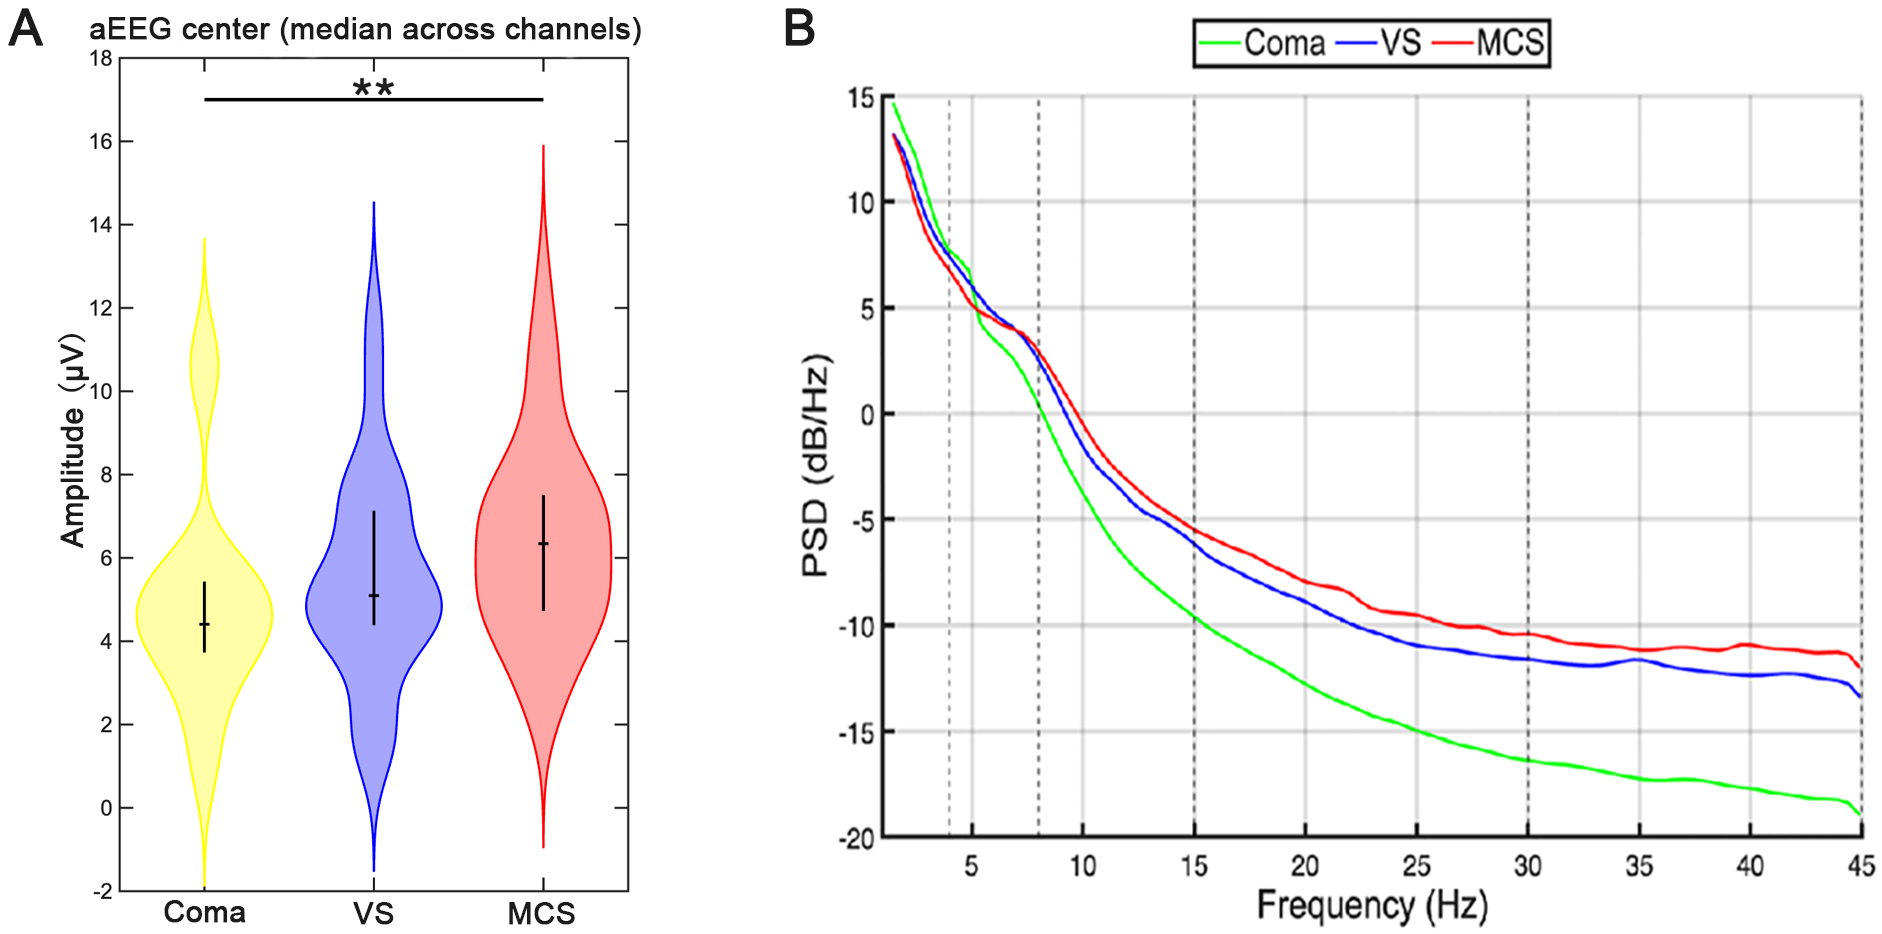 Fig. 1.
Power spectrum and aEEG center amplitude of patients with DoC.
The yellow, blue, and red columns in (A) correspond to the coma, VS, and MCS
groups, respectively. The Dunn’s post hoc test was used for intergroup
comparison. **p
Systematic analysis of EEG power spectral characteristics in patients with DOC
revealed distinct energy distribution patterns across frequency bands (Fig. 1B).
The absolute power exhibited a descending gradient (coma
Relative power, a core quantitative indicator in EEG analysis, untangles the distribution characteristics of different band oscillatory energy within the total power spectrum [39] (Fig. 2; Supplementary Tables 1,2). Group differences in each frequency band were analyzed to clarify the frequency- and region-specific differences across DoC states, as follows. Significant differences were observed in the delta band between the VS and MCS groups across the entire brain. In addition, the coma and MCS groups exhibited significant differences within the frontal lobe. Significant differences were identified in the theta band between the coma and MCS groups in the parietal and temporal regions with differences between the VS and MCS groups (specifically in the parietal region). Significant differences were identified in the alpha band between the coma and MCS groups and between the VS and MCS groups in the prefrontal cortex. Furthermore, all pairwise comparisons among the three groups (coma, VS, and MCS) had significant differences across all other brain regions. Significant differences were observed in the beta band between the coma and MCS groups and between the VS and MCS groups within the occipital lobe. Moreover, all pairwise comparisons among the coma, VS, and MCS groups demonstrated significant differences across all other brain regions. Significant differences were noted in the gamma band between the VS and MCS groups in the parietal lobe. Significant differences were observed in the occipital lobe between the coma and MCS groups and between the VS and MCS groups. Moreover, all pairwise comparisons among the three groups demonstrated significant differences across the prefrontal, frontal, and temporal cortical regions.
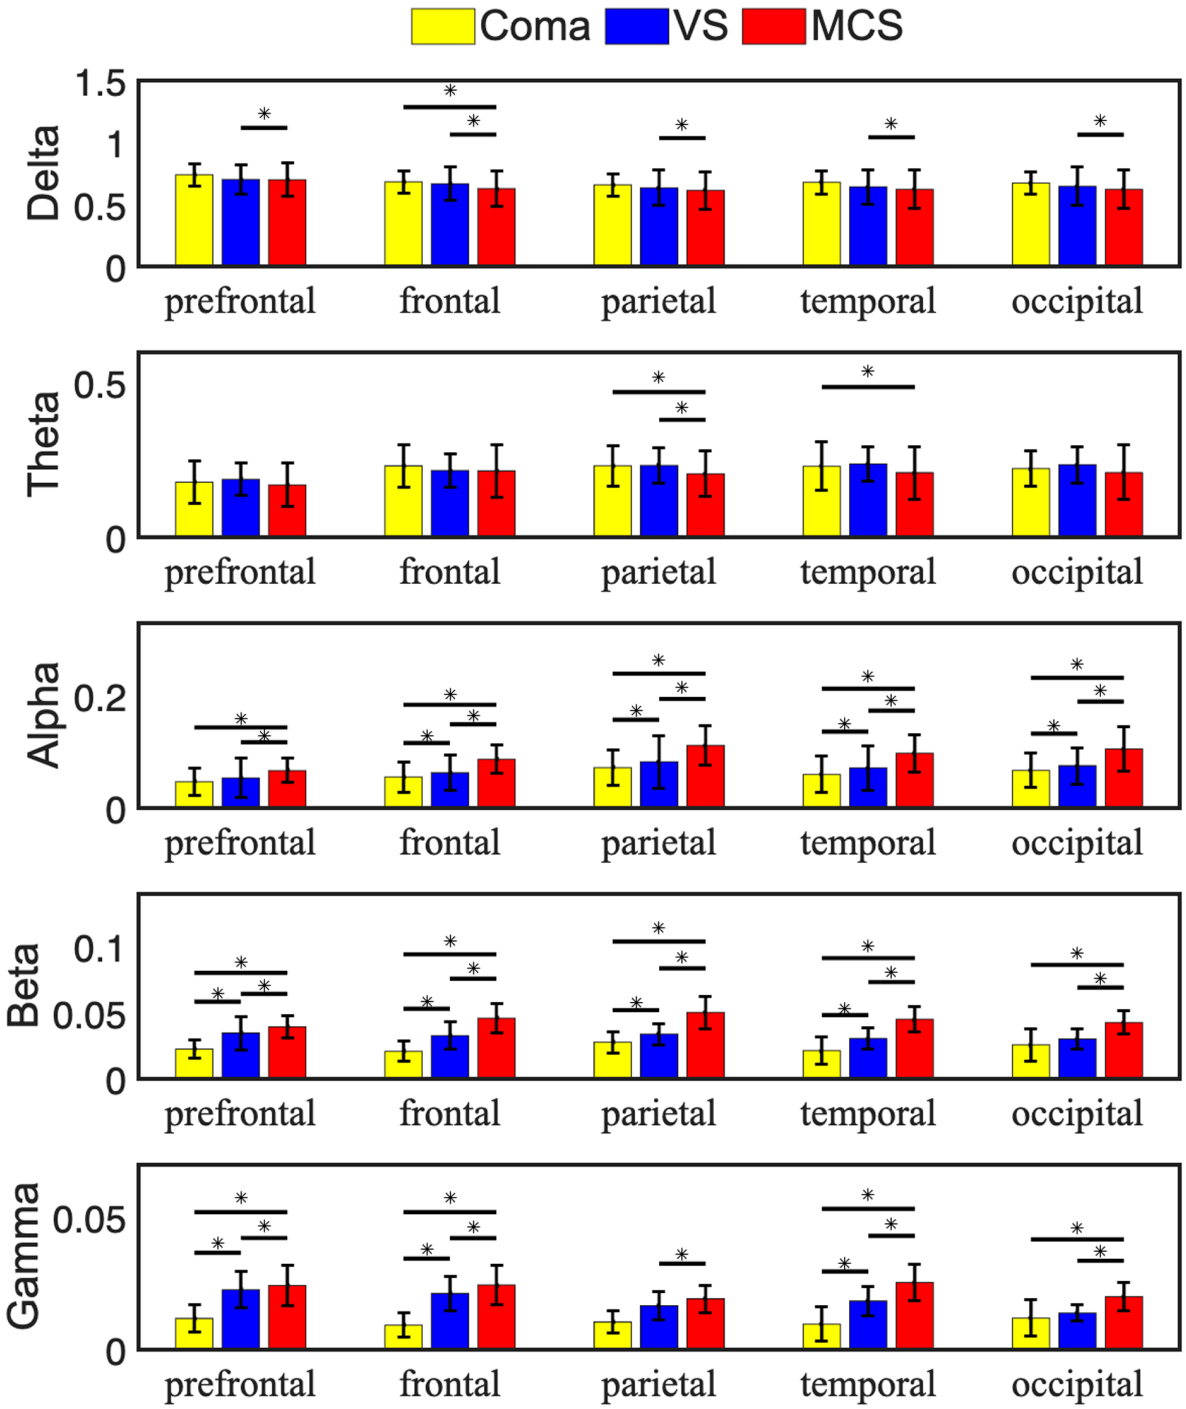 Fig. 2.
Average relative EEG power of patients with DoC. The average
data of three groups of patients with respect to different brain regions and
frequency bands were compared. In the histogram, yellow, blue, and red
represented coma, VS, and MCS groups, respectively. The error line represents the
standard deviation within the group. The Tukey–Kramer test was performed on the
data between each two groups when the results of the ANOVA were significant.
*p
Functional connectivity of the brain refers to the synergistic relationship between different brain regions, reflecting collaboration in processing information [40]. The wPLI was used to reveal functional interaction patterns between different brain regions and systematically analyze functional brain network connectivity patterns in different frequency bands in three groups of patients to quantitatively characterize functional brain network connectivity [41, 42] (Fig. 3).
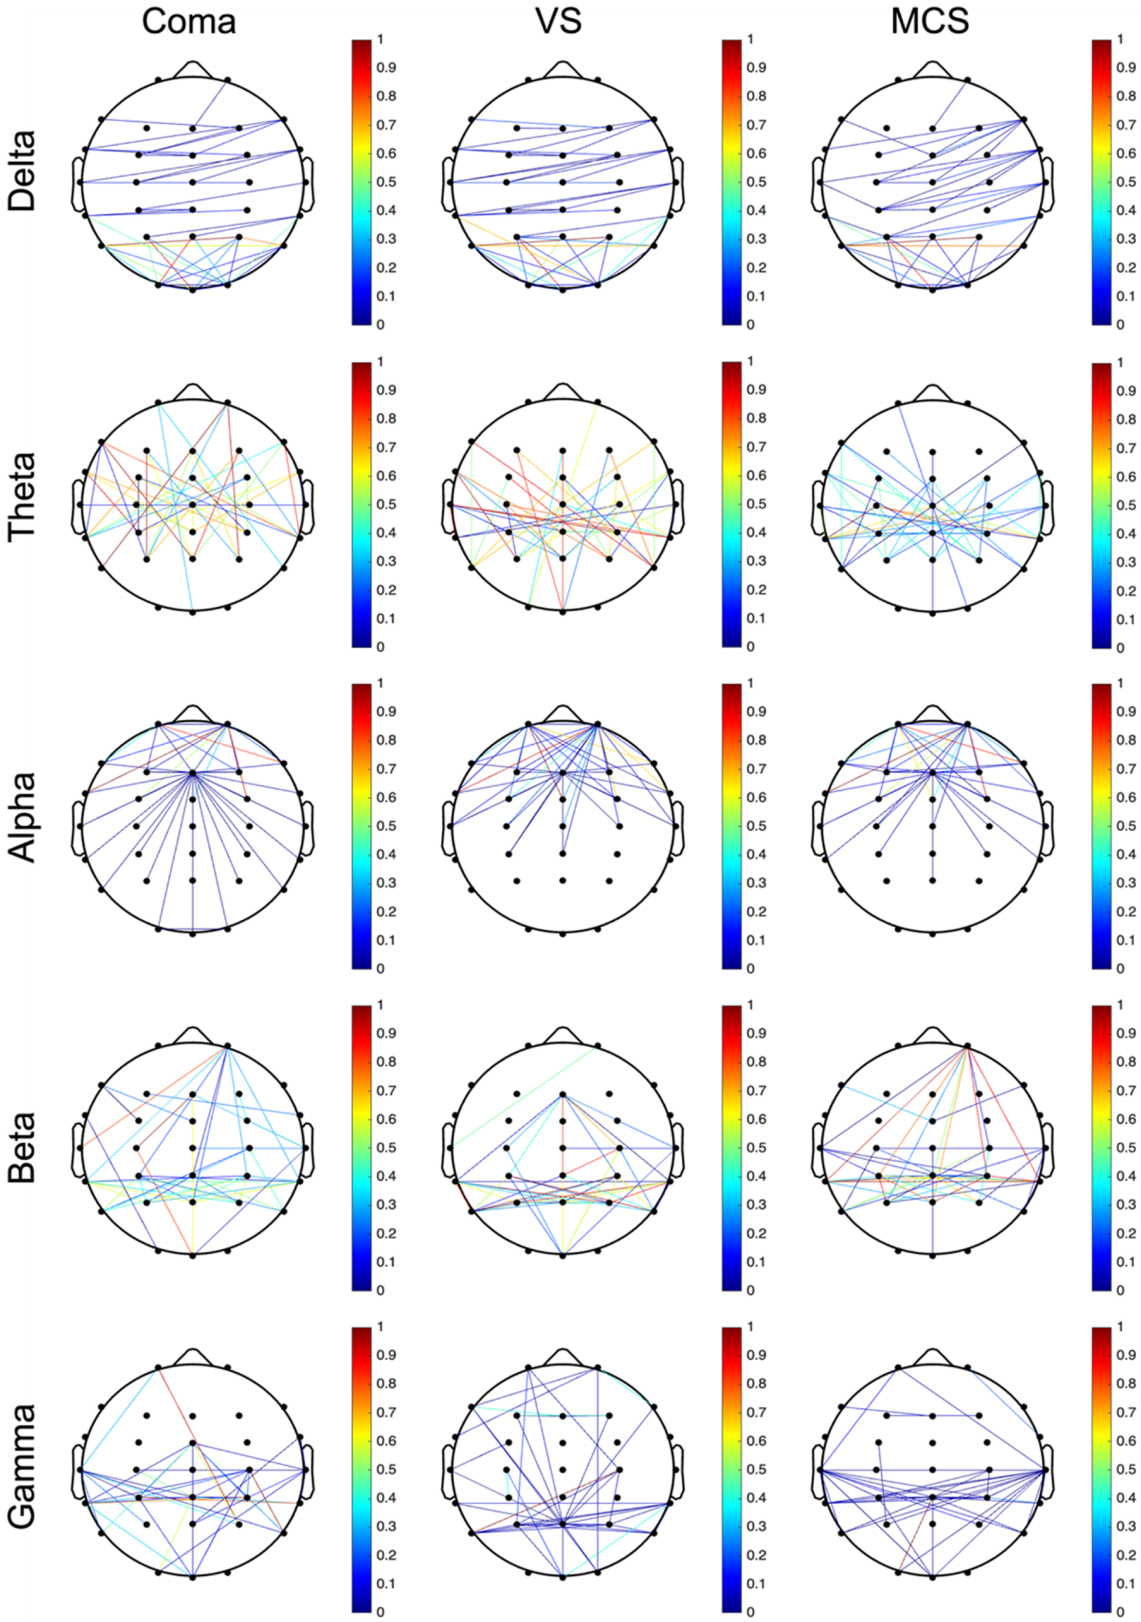 Fig. 3.
wPLI-based functional connectivity matrices of brain regions across five frequency bands. Reflecting to the functional connectivity between different brain compartments, the nodes (Nodes) usually represent electrode positions arranged in a 10–10 system and the lines connecting the nodes are edges (Edges), which indicate the strength of connectivity as calculated by the wPLI. The deeper the red color, the stronger the intensity; the deeper the blue color, the weaker the intensity. The connection lines for intensities greater than the threshold were drawn using the 90th percentile as the threshold and marking it at the top of the image. wPLI, Weighted Phase Lag Index.
All three groups showed dense connectivity in the delta band within the occipital lobe. Dense connectivity was observed in the theta band within the temporal, frontal, and parietal lobes across the three groups. The connectivity strength in the coma and VS groups was significantly higher than the MCS group with the VS group exhibiting the highest connectivity strength among the three. Dense connectivity was present in the alpha band within the bilateral parietal and temporal lobes across the three groups. In addition, the coma and MCS groups showed dense connectivity between the bilateral parietal, and temporal lobes and the right prefrontal cortex. The three groups demonstrated a radial connectivity pattern centered on the central brain region in the beta band. A diffuse connectivity pattern across multiple brain regions was observed in the gamma band.
The connectivity matrix of wPLI brain network connectivity indices for different brain regions reflects the connectivity characteristics and strengths of the patients under different bands (Fig. 4) [43]. The connection characteristics of each band were systematically compared to describe the network recombination of specific frequencies [44]. In addition, statistical matrices of brain networks were plotted for patients with DoC and different consciousness levels across each frequency band (Fig. 5).
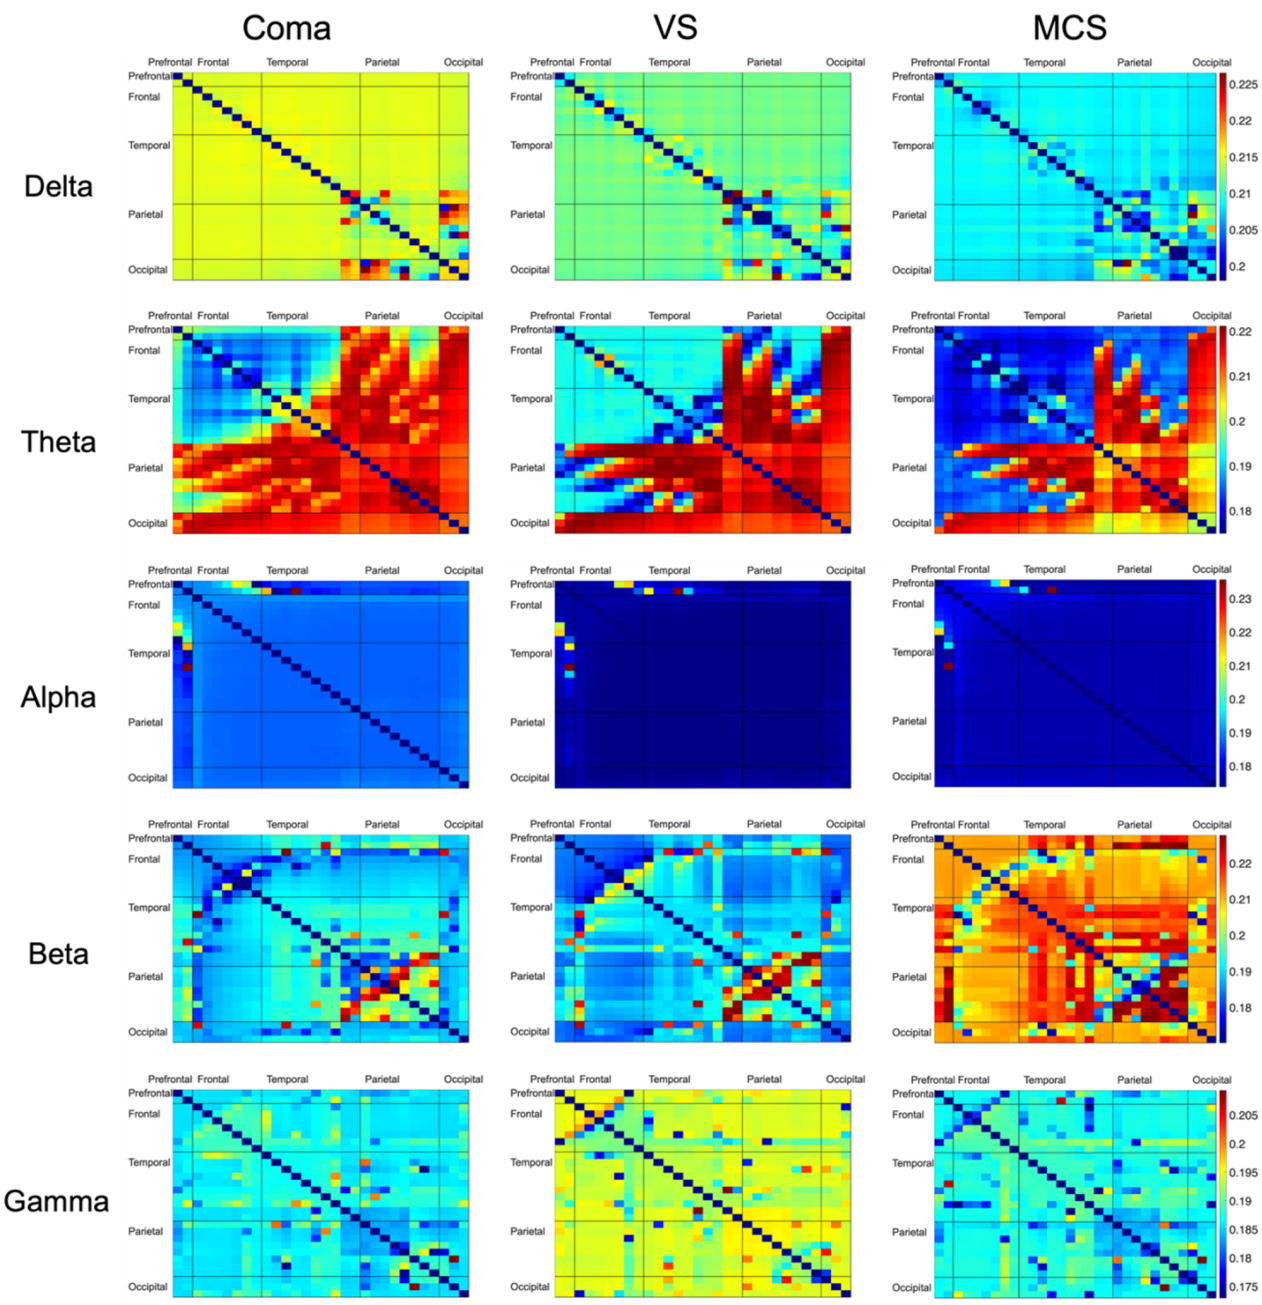 Fig. 4.
Connectivity matrix of wPLI brain connections in different brain regions of patients with DoC. The connectivity matrix of wPLI brain connections reflects the connection characteristics and intensity in different frequency bands and the closer the value is to 1 (the closer the color is to red), the stronger the connection coherence between the two channels. Rows and columns represent brain regions in turn (prefrontal, frontal, temporal, parietal, and occipital).
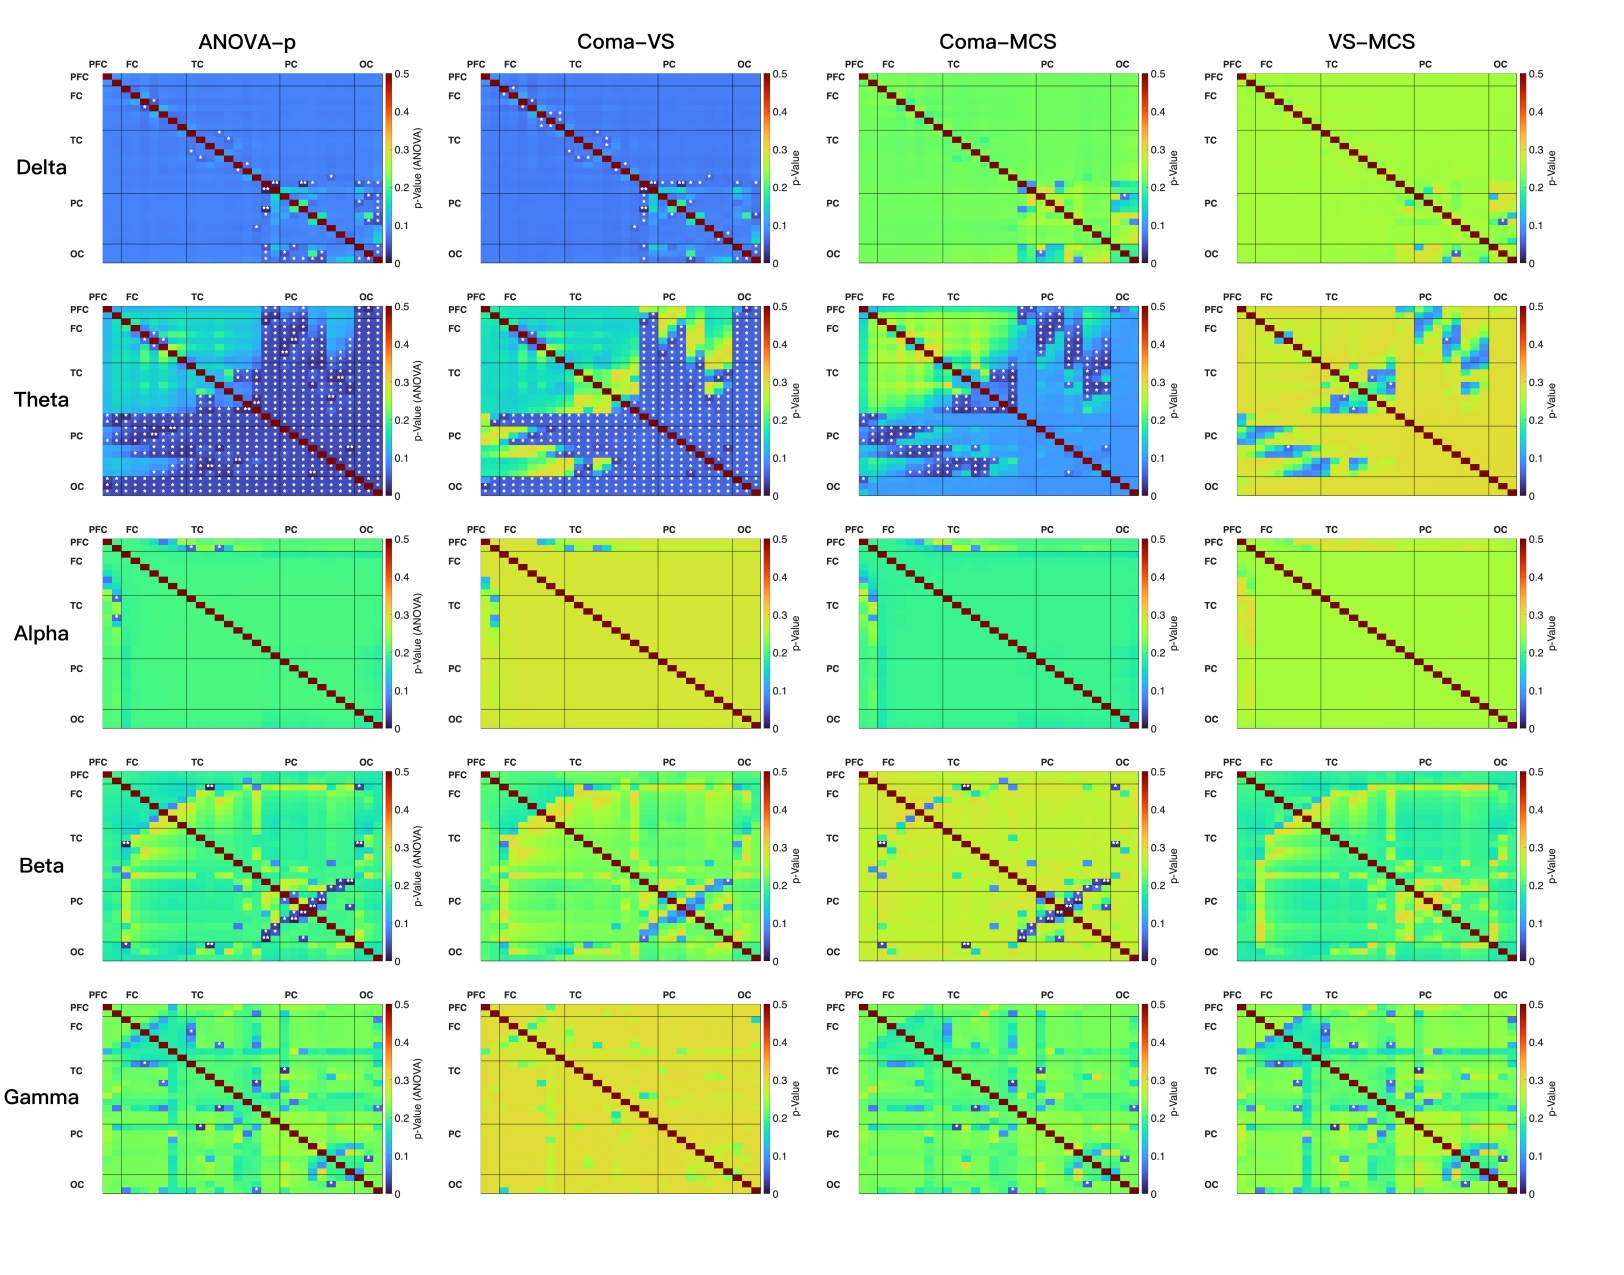 Fig. 5.
Statistical analysis matrix of brain networks connectivity of
patients with DoC. Edge-wise comparisons of functional connectivity indices were
performed within each frequency band across three independent groups (coma, VS,
and MCS). Connectivity strengths of the three groups were pooled (missing values
were excluded) for each channel pair (upper triangle of the 30
The overall connectivity strength among the three groups showed a gradually
decreasing trend in the delta band (coma
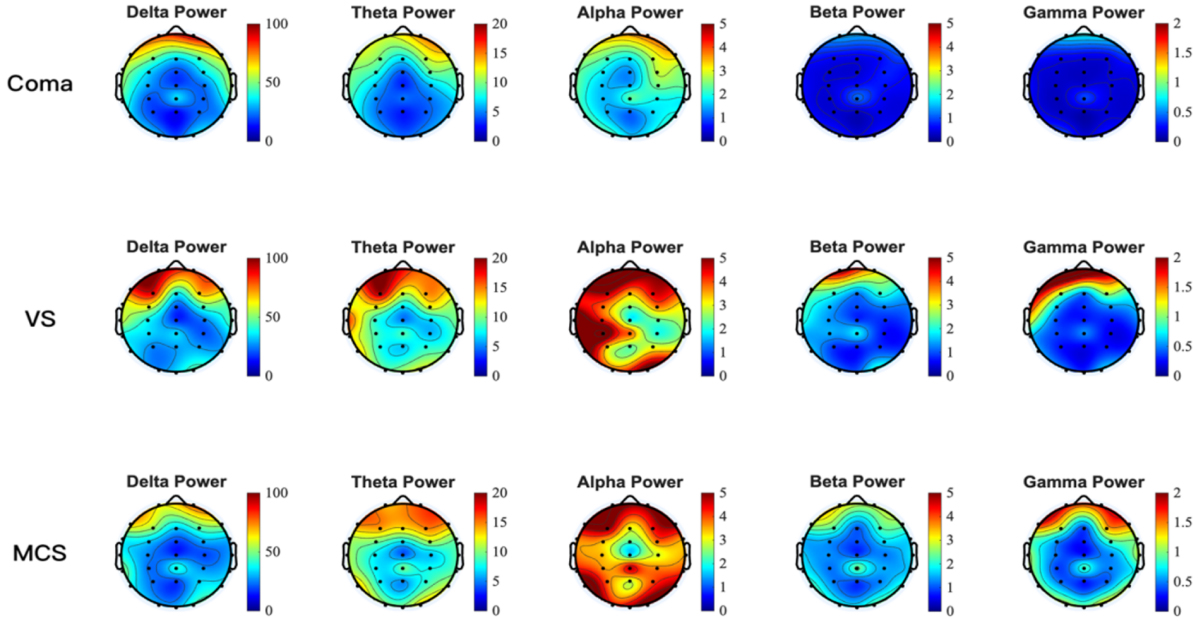 Fig. 6.
Absolute power topographic maps of five rhythms in patients with DoC. Nodes typically represent electrode positions arranged in a 10–10 system. The deeper the red color, the higher the absolute power and the deeper the blue color, the lower the absolute power.
The absolute power topographic map utilizes spatial visualization techniques to untangle the regional distribution characteristics of EEG energy intensity within specific frequency bands [45]. The color gradient mapping intuitively reflects the absolute power of neural oscillations in different brain regions. Based on this method, the current study compared the whole-brain and regional absolute power topographic maps (Fig. 6) across various bands for the three groups of patients with DoC. Distinct patterns of absolute power were observed among the three patient groups across the frequency bands.
The absolute power topographies of different DoC states across five frequency
bands revealed the following. There was no significant difference among the three
groups in all five frequency bands. The high power of the three groups was mainly
concentrated in the delta frequency band within the frontal lobe region. The high
power of the coma group in the theta band was primarily localized to the
prefrontal, bilateral frontal, and bilateral temporal regions. The VS and MCS
groups demonstrated a generalized increase in absolute power compared to the coma
group, which was accompanied by a more widespread distribution of these
high-power areas. The elevated power of the coma group remained concentrated in
the alpha band within the prefrontal area. The VS group showed enhanced activity
extending to the prefrontal, bilateral frontal, bilateral temporal, and partial
occipital regions. The MCS group, however, displayed a global increase in
absolute power across the entire brain with the most extensive distribution of
high-power regions. The distribution of high-power areas showed a gradually
expanding pattern in the beta and gamma frequency bands from the coma, VS, and
MCS groups. A pattern of increasing absolute power at the F3 electrode (left
dorsolateral prefrontal cortex) was observed across multiple frequency bands,
following the descriptive sequence: coma
Recent studies have demonstrated that multidimensional EEG indicators can
effectively distinguish patients’ levels of consciousness and provide an
important basis for clinical assessment and prognosis. Our analysis revealed
characteristic electrophysiological patterns across different states of impaired
consciousness. A significant difference in aEEG center values was observed
between coma and MCS patients. In terms of relative spectral power, significant
differences were found in the
The results of the current study aligned closely with the existing literature and further refined the spectrum of EEG features associated with different levels of consciousness. Significant intergroup differences in quantitative scores were detected. The low amplitude range in the coma group indicated a significant decrease in brain activity levels, which reflected a severe disruption of brain network integration [46]. The “Theory of Consciousness Index” proposed by Casali et al. [47] suggests that changes in conscious states may be accompanied by reorganization of some neural networks. This reorganization may manifest as the partial preservation of cortical-thalamic connections. Notably, while pediatric EEG studies typically use limited-channel setups due to cranial size constraints, this adult-focused investigation utilized high-density 30-channel EEG [48]. This approach compensated for the spatial resolution limitations inherent in low-channel configurations [49], thereby enabling precise characterization of the dynamic reorganization of the prefrontal-parietal network [50]. Even if overall functional connectivity weakens, connections in some key areas may persist. The medium amplitude observed in the VS group may reflect this partial preservation of cortical-thalamic connections, which align with the Casali perspective [47]. The highest amplitude observed in the MCS group was associated with the enhanced functional connectivity of the default mode network (DMN) [30]. Patients in the MCS state may exhibit limited consciousness or responsiveness, demonstrating some degree of reaction to certain external stimuli, such as sound or touch [51]. The aEEG data from the three groups in the current study showed significant differences and exhibited a change corresponding to the level of consciousness. This finding indicated that aEEG may be a useful quantitative indicator for assessing levels of consciousness. The thalamo-cortical network functional integrity model (ABCD model) is an EEG-based power spectral density classification system that assesses the functional integrity of the thalamo-cortical network through EEG dynamic characteristics [52]. The ABCD model is used to describe neural activity patterns in different states of consciousness, as proposed by Curley et al. [52] in a 2022 study. Type A is characterized by dominance in the delta band, reflecting a complete lack of cortical input, and is commonly observed in patients with severe brain injuries that disrupt thalamocortical connections [53]. The dominance of delta band power in coma patients aligned with the “A-type power spectrum” described in the literature, which is characterized by a loss of integrity and reduced excitability, reflecting severe inhibition of brain function [52, 54]. In contrast, the preservation and enhancement of high-frequency activity (alpha/beta/gamma) in the MCS group supported the theory in which restoration of consciousness depended on high-frequency oscillations [7, 55]. In addition, the elevated power in the gamma frequency band within the MCS group may be linked to higher-order cognitive processing [56]. The aEEG and power spectrum characteristics aligned with the classic pattern of low-frequency dominance and high-frequency attenuation observed in patients with DoC.
The close correlation between the power distribution of different frequency
bands in various brain regions and levels of consciousness was highly consistent
with recent studies on the neural mechanisms of consciousness [7]. The coma group
exhibited the highest relative power in the delta band across all brain regions
among the three patient groups. This finding supported the classic conclusion
that low-frequency oscillations serve as markers of conscious inhibition,
suggesting that the pathomechanism may be related to the generalization of
slow-wave activity due to disintegration of the thalamo-cortical loop. The
difference in theta power in the parietal lobe suggests that this area has a
crucial role in maintaining consciousness [57]. Engemann DA et al. [58] reported that alpha band power was one of the most prominently performing indicators for distinguishing MCS from UWS among more than 100 EEG recordings. Stefan et al. [14]
reported the neural characteristics of enhanced alpha band activity and elevated
beta coherence in patients with MCS through multidimensional EEG analysis,
including power spectra, connectivity, and information entropy, which provided a
reliable quantitative index for clinically differentiating between UWS and MCS.
Based on our analysis, patients in the MCS group demonstrated significantly
higher spectral power in the
The brain functional connectivity patterns of three patient groups across different frequency bands was systematically analyzed based on wPLI. The five-band wPLI brain connectivity matrix (Fig. 5) for different brain regions revealed the dynamic reorganization characteristics of patients with varying levels of consciousness in large-scale brain network integration and dissociation. The connection strength in the delta frequency band increased as the level of consciousness decreased, which may be related to inhibition of the cortical-thalamus circuit and enhancement of slow-wave activity [60]. All three groups of patients showed strong posterior regional connectivity in the delta frequency band. Delta activity is a hallmark of deep sleep and severe brain injury. The predominant distribution in the occipital cortex may reflect deafferentation of the visual pathways and a generalized suppression of cortical function [61]. This pattern was consistently observed across the three groups, indicating that severe cortical dysfunction is a common pathologic basis for patients with DoC. A particularly intriguing finding emerged in the theta band. The VS group exhibited the strongest frontal-temporal-parietal connectivity in the theta frequency, surpassing that of the MCS group. This result challenges the simplistic linear model that “stronger connectivity equals higher level of consciousness” and supports the “over-activation of thalamocortical circuits” hypothesis. The highest theta connectivity in the VS group may reflect enhanced thalamic drive leading to pathologic synchronization between cortical regions, whereas the relatively lower theta connectivity in MCS patients suggests that the thalamocortical system is beginning to break free from this rigid synchrony, transitioning toward more flexible and complex dynamic activity [62]. This finding is consistent with several fMRI studies, which have reported that thalamic functional connectivity abnormalities in VS patients are even more severe than in coma patients [63]. The alpha-band connectivity pattern, which is centered on the frontal-right prefrontal regions, may underlie the network foundation that sustains a basic level of consciousness [43]. The dense connections in the beta band among temporal, parietal, and frontal areas observed in the VS and MCS groups could correspond to residual cognitive processing and self-awareness capacities [64]. These findings echo fMRI studies that report damage to the DMN and executive control networks in DoC [65]. Gamma-band activity is considered the neural basis for consciousness integration and the “binding problem” [66]. Only diffuse, disorganized gamma connectivity was observed among all patients with DoC, strongly suggesting that the breakdown of high-frequency connections may be a key neurophysiologic substrate for the loss of conscious content.
The analysis of EEG absolute power topography across the entire brain and
different brain regions in the three patient groups under five EEG rhythms is
essential. This study compared EEG characteristics across frequency bands in
patients with coma, VS, and MCS using absolute power topographic maps. The
ubiquitous elevation of delta power in the prefrontal regions is consistent with
previous literature, potentially stemming from the desynchronization of
thalamocortical projections and the hyper-synchronous firing of cortical neurons
[30, 67]. VS and MCS patients demonstrated stronger power and more widespread
brain involvement in the theta band compared to the coma group, which aligns with
the role of theta oscillations in attention, memory, and network integration
[68, 69]. Some studies have indicated that the preservation of theta activity is
associated with the recovery of consciousness. Theta activity enhancement in MCS
patients may reflect the partial functional preservation of thalamocortical
circuits and the default mode network [70]. Chennu et al. [30] reported
that alpha power is positively correlated with the retention of default network
function, supporting use of alpha power as a predictor of recovery of
consciousness. De Koninck et al. [71] noted that transcranial
alternating current stimulation improves the state of consciousness by enhancing
alpha synchronization, suggesting that alpha activity in patients with MCS may
reflect residual neuroplasticity. Prefrontal beta activity correlated with dorsal
attentional network function. The VS and MCS groups exhibited oscillatory
activity in the beta band that was concentrated in the frontal regions with
significantly greater power than the coma group. Neural oscillations in the beta
frequency band had a key role in frontal-specific activation associated with
motor intention. The increase in parietal beta power in patients with MCS may
reflect a capacity for sensorimotor integration [72]. Gamma power was low in all
three groups but prefrontal localization was active in the MCS and VS groups,
which is consistent with the general observation of high-frequency oscillatory
suppression in DoC [73, 74]. Notably, the high-power regions across all frequency
bands involved the prefrontal lobes. Stender et al. [75] concluded that
for every 10% increase in prefrontal metabolic rate, the probability of patients
with MCS converting to conscious wakefulness increased 2.3-fold in the PET study.
Specifically, the left DLPFC (corresponding to the F3
electrode) functions as a critical hub between the executive control network
(ECN) and the DMN. The absolute power at the F3 electrode
exhibits a consistent trend of coma
EEG has made significant progress in the diagnosis and prognostic assessment of DoC, particularly in distinguishing between UWS/ VS and MCS. Toplutaş et al. [76] successfully distinguished between patients with VS and MCS by analyzing the duration, transition probabilities, and spatial topologic features of resting EEG microstates [76, 77, 78, 79]. The EEG spatial-spectral gradient model developed by Colombo et al. [58] in combination with support vector machines, achieved a classification accuracy of 92% in cross-center validation, outperforming the traditional CRS-R, which has an accuracy of approximately 75%. In addition, Pan et al. [80] successfully achieved online consciousness detection for patients with DoC using a P300 brain-computer interface network, attaining a response accuracy of 68%. Portable EEG systems have made significant advances in ICUs and rehabilitation wards, including real-time microstate tracking through mobile-based algorithms, multimodal stimulation paradigms integrating auditory, pain, and visual stimuli to enhance covert consciousness detection by 15%, and the integration of EEG features with clinical data to develop automated prognostic prediction models using elastic net regression [78]. The current study used a systematic analysis of multi-dimensional EEG features to uncover the differences in neural mechanisms among patients with DoC at varying levels of consciousness. The aEEG exhibited an increase corresponding to levels of consciousness and the power of high-frequency bands significantly increased with recovery of consciousness, further elucidating the association between high-frequency activity and consciousness recovery [30]. The elevated gamma-band power in MCS aligns with the existing literature. Gamma oscillations are associated with feature binding, attention, and conscious perception, and preservation of gamma oscillations in MCS may indicate residual cognitive capacity [33]. The increase in gamma power observed herein might reflect partially preserved thalamocortical and frontoparietal circuits, which are critical for consciousness. While previous studies have employed aEEG threshold criteria similar to those used in this research [10]—thereby providing a methodological precedent—it should be noted that standardized adult-specific threshold criteria remain to be established. Against this backdrop, the current study represents a methodologic breakthrough by integrating multi-dimensional EEG features, analyzing mechanisms across frequency bands, and validating findings with networks [81]. This approach transcends the limitations of single biomarkers and constructs a multi-scale model for consciousness recovery. In the future combining real-time neurofeedback with closed-loop regulation technology is expected to advance the assessment of DoC toward precision medicine.
However, although this study has made some advancements in methodology and existing evidence indicates that the level of consciousness serves as the primary determinant of neurophysiologic changes, it is still necessary to acknowledge the existence of certain limitations. First, its sample size was relatively limited, restricting the generalizability of findings. Second, it only focused on EEG features without integrating other neuroimaging modalities or comprehensive clinical variables. Third, the single-center design may introduce selection bias, and the follow-up period was not detailed. Fourth, diverse etiologies of DoC were not fully controlle. Future studies should increase the sample size, integrate multimodal neuroimaging and clinical data, extend the follow-up period, and conduct more explicit subgroup analyses in order to further validate and optimize the proposed model.
In summary, multidimensional EEG contributed to distinguishing different degrees
of DoC. The aEEG center amplitude effectively distinguishes MCS from coma
patients; relative power in the
Multidimensional EEG biomarkers extend prior single-domain EEG approaches by offering a concise, multiparametric framework that complements behavioral assessments and refines diagnostic classification in DoC. Future integration into bedside monitoring systems and automated analysis could enhance diagnostic accuracy, prognostication, and treatment monitoring.
The data presented in this study are available on request from the corresponding author.
SL and JG designed the study. YHS, SYL, JWC, MYZ collected the data. WJY and JZ analyzed the data and prepared the figures. YHS, SYL, JZ, WJY, JWC, MYZ drafted the manuscript. SL and JG brought major revisions in significant proportions of the manuscript. All authors read and approved the final manuscript. All authors have participated sufficiently in the work and agreed to be accountable for all aspects of the work.
The study was conducted under the Declaration of Helsinki of the World Medical Association and approved by the Ethics Committee of the Affiliated Hospital of Nantong University. The approval number for the study was 2024-K142-01. Before inclusion, the researcher fully informed the legal guardian of each patient about the study protocol and obtained informed consent.
We would like to express our gratitude to all those who acted as peer reviewers, providing us with their valuable opinions and suggestions.
This work was supported by the Jiangsu Province Research Hospital, China [grant numbers YJXYY202204], Natural Science Foundation of Jiangsu Province, China [grant number BK20241839] and Jiangsu Commission of Health, China [grant number M2022052].
The authors declare no conflict of interest.
Supplementary material associated with this article can be found, in the online version, at https://doi.org/10.31083/JIN44233.
References
Publisher’s Note: IMR Press stays neutral with regard to jurisdictional claims in published maps and institutional affiliations.