


 , Yiwei Fu 1,†, Li Hu 1,2, Xiaoxia Chen 1, Zhou Liu 1,*
1 Guangdong Key Laboratory of Age-Related Cardiac and Cerebral Diseases, Department of Neurology, Institute of Neurology, Affiliated Hospital of Guangdong Medical University, 524000 Zhanjiang, Guangdong, China
2 School of Basic Medical Sciences, Guangdong Medical University, 524000 Zhanjiang, Guangdong, China
†These authors contributed equally.
Abstract
Dorsal repellent axon guidance protein (draxin) is a secreted protein that plays an establishment role in the formation of proper connections between neurons. Although draxin is known to regulate the elongation of axons from various types of neurons in vitro, its specific role in mature neurons remains unclear. Draxin expression in the hippocampal region of patients with Alzheimer’s disease (AD) has been reported to be higher than in normal subjects. The present study investigated the effect of draxin on the expression of microtubule-associated protein 2 (MAP2) and neuronal nuclear antigen (NeuN), and on tau protein phosphorylation in mouse hippocampal neurons (HT22 cells) and AD cellular models. In addition, stereotactic techniques were used to inject neuronal-targeted adeno-associated virus (AAV) into the hippocampus of C57BL/6 mice to assess the effects of draxin overexpression on hippocampal neurons, as well as on behavioral and pathological features.
In vitro experiments were conducted using mouse hippocampal neuronal cells (HT22 cells) and established AD cellular models, focusing on evaluating draxin’s effects on the expression of neuronal markers (MAP2 and NeuN) and the phosphorylation status of tau protein. For in vivo validation, neuron-targeted AAV was delivered into the hippocampus of C57BL/6 mice via brain stereotactic injection to achieve draxin overexpression. Subsequent assessments included analyses of hippocampal neuronal integrity, behavioral tests (Y-maze and Morris water maze, to evaluate spatial learning and memory), and detection of AD-related pathological markers.
In vitro experiments revealed that draxin overexpression decreased the cell survival rate, increased the apoptosis rate, decreased the expression of MAP2 and NeuN, and showed a trend for increased phosphorylation of tau protein compared with the control group. Notably, the spatial learning memory ability of mice with draxin overexpression in the brain, as determined by the Y-maze and Morris water maze tests, was significantly diminished compared with the control group. These mice also showed elevated tau protein phosphorylation and altered expression of wingless-related integration site (Wnt)/β-catenin/glycogen Synthase Kinase 3 beta (GSK-3β) pathway components.
Our results suggest for the first time that neuronal overexpression of draxin may induce neuronal damage via the Wnt/β-catenin/GSK-3β signaling pathway, leading to AD-like neuropathological damage and cognitive dysfunction.
Keywords
- draxin
- hippocampal neurons
- cognitive dysfunction
- Alzheimer’s disease
Alzheimer’s disease (AD) is a neurodegenerative disease characterized by
progressive cognitive dysfunction. The main characteristic pathological changes
of AD are senile plaques formed by extracellular amyloid-
Dorsal inhibitory axon guidance protein (Draxin) is a secreted protein involved in axon guidance and the development of the forebrain and dorsal spinal cord [10, 11, 12]. Recent studies suggest that draxin may also be involved in the regulation of mature neurons. For example, draxin protein [13] can be detected in the peripheral blood of the elderly, and its expression level is elevated in patients with post-traumatic stress disorder [14]. Draxin expression is increased in the intestinal tissues of patients with inflammatory bowel disease and correlates with a poor response to treatment [15]. Furthermore, high draxin expression in gliomas correlates with a poor prognosis [16]. These findings suggest that draxin may exert a regulatory effect on the nervous system in adulthood and may have detrimental effects on mature neurons. Although direct evidence linking draxin to AD is limited, our previous bioinformatics analysis of the Alzheimer’s disease database (AlzData) database found that draxin expression in the hippocampus of AD patients is elevated compared with controls (p = 0.044). In addition, hydroxymethylation of the upstream region of the draxindraxin gene is associated with the formation of p-tau [17]. This suggests a potential role for draxin in the pathogenesis of AD, although the exact mechanism of action remains to be elucidated. In the present study, draxin was found to have injurious effects on mouse hippocampal neuronal cells. It was also found to increase the level of tau protein phosphorylation. Moreover, draxin overexpression significantly impaired the learning and memory capacities of mice and exacerbated the progression of AD-related pathology.
Male C57BL/6 mice (15 weeks old) weighing approximately 23–28 g were purchased
from Jiangsu Jicui Pharmachem Biotechnology Co., Ltd. (Nanjing, Jiangsu, China).
All mice were housed (five animals per cage) in specific pathogen-free facilities
at the Guangdong Medical University Laboratory Animal Center. They were
maintained at a constant temperature of 23
Phosphate-buffered saline (PBS), empty adeno-associated virus (AAV), and draxin-expressing AAV (GOSV0403972; Shanghai Genechem Co., Ltd., Shanghai, China) were delivered into the hippocampus of 15-week-old male C57BL/6 mice using stereotactic techniques. The animals were securely positioned in a stereotactic frame (018.116; NEUROSTAR, Malvern, PA, USA) with the head maintained in a flat skull position. The anterior fontanelle was exposed following a midline scalp incision with ophthalmic scissors. According to the mouse brain stereotactic atlas, the Cornu Ammonis 1 (CA1) region was targeted with the following coordinates relative to the anterior fontanelle: 2.1 mm posterior, 1.8 mm lateral from the midline, and 2.0 mm ventral from the skull surface. A total volume of 1 µL of each solution was slowly infused using a micro-syringe (980-02918-00; Ningbo Zhenhai Glass Instrument Factory, Ningbo, Zhejiang, China) at a rate of 0.1 µL/min. The needle was kept in place for an additional 5 min to facilitate adequate diffusion of the solution and minimize backflow. Subsequently, the needle was gradually withdrawn to prevent reflux. The wild-type C57BL/6 mice were assigned to three experimental groups based on the injected material. The wild-type (WT) +PBS group was injected with PBS, the WT+AAV-NC (negative control) group was injected with empty AAV, and the WT+AAV-draxin group was injected with draxin-expressing AAV. At the end of all experimental procedures (including behavioral tests), mice were euthanized via an intraperitoneal injection of sodium pentobarbital (150 mg/kg, Sigma-Aldrich, St. Louis, MO, USA) to ensure a humane death. Euthanasia was confirmed by the absence of vital signs (cessation of breathing, loss of corneal reflex, and no response to paw pinch) for at least 5 min. The brains were then rapidly dissected for subsequent histological and molecular analyses.
The HT22 ( iCell-m020) mouse hippocampal neuronal cell line used in the experiments was purchased from Cellverse (iCell) Bioscience Technology Co., Ltd. (Shanghai, China). All cells were authenticated by the vendor and tested negative for mycoplasma prior to use. Cell experiments were conducted in a sterile, ultra-clean facility within the cell room of the Institute of Neurology at Guangdong Medical University, adhering strictly to aseptic requirements. The cells were cultured in an incubator under optimal conditions, featuring a gas phase composition of 95% air and 5% carbon dioxide, a constant temperature of 37 °C, and a humidity range of 70%–80%.
(1) Lentivirus: pHBLV-CMV-MCS-3FLAG-EF1-ZsGreen-T2A-PURO, an empty load virus, and a draxin-overexpressing virus were purchased from Hanheng Biotechnology Co., Ltd. (HH20221222GYQ-LV01, Shanghai, China).
(2) Adeno-associated virus: GV753-hsyn promoter-EGFP-FT2A-MCS-WPRE-SV40 PolyA, empty load virus, and draxin-overexpressing virus were purchased from GeneChem Co., Ltd. (GOSV0403972, Shanghai, China).
Cells with favorable viability were plated into 96-well plates for subsequent
experiments, with cell numbers adjusted for the specific experimental
requirements. For cell viability assays, approximately 2
Tissues were homogenized in lysis buffer (2500070007, Solarbio, Beijing, China)
containing protease and phosphatase inhibitors (A32961; Thermo Fisher Scientific,
MA, USA) and centrifuged at 12,000 rpm for 20 min at 4 °C. Supernatant
was collected and the protein concentrations quantified using a bicinchoninic
acid assay (BCA) (3213970, ThermoFisher Scientific, Waltham, MA, USA). Proteins
(45 µg) were mixed with loading buffer, electrophoresed on SDS-PAGE gel,
and then transferred to a polyvinylidene difluoride membrane (PVDF IPVH00010,
Millipore Corporation, Burlington, MA, USA). The membranes were blocked with
TBS/0.1% Tween-20 (TBST) buffer containing 5% bovine serum albumin (V900933-100G;
Sigma-Aldrich) at room temperature, then incubated overnight at 4
°C with MAP2 antibody (rabbit, 1:1000, 8707S, Cell Signaling Technology,
Danvers, MA, USA), NeuN antibody (rabbit, 1:1000, 24307S, Cell Signaling
Technology), phosphorylated tau (Ser396) (p-tau396) antibody (rabbit, 1:1000,
AB109390, Abcam, Cambridge, Cambridgeshire, UK), phosphorylated tau (Thr231)
(mouse, 1:1000, PA5-117230, Invitrogen, MA, USA), draxin (sheep, 1:1000,
CDUB03240, R&D Systems, Minneapolis, MN, USA), or primary antibodies to
Relative mRNA levels were measured via quantitative real-time polymerase chain reaction (qRT-PCR) with validated primer pairs (Table 1). Total RNA was extracted from cells using TRIzol reagent (15596018CN, Ambion, Austin, TX, USA) and cDNA was synthesized using a reverse transcription kit (RR820Q, TaKaRa, Shiga, Japan). The assays were performed on a LightCycler 96 quantitative PCR instrument (ABI QuantStudio 6 Pro, Thermo Fisher Scientific) and a 96-well optical plate [18].
| Gene name | Sequence |
| GAPDH-F | TCCTGCACCACCAACTGCTTAG |
| GAPDH-R | TGCTTCACCACCTTCTTGATGTC |
| Draxin-F | CTGCTTCTGGGGCTGACTTTG |
| Draxin-R | CCTGCGTCTCTTGTGTTCTCTG |
| IL-1β-F | GGGCCTCAAAGGAAAGAATCT |
| IL-1β-R | GAGGTGCTGATGTACCAGTTGG |
| IL-6-F | TAGTCCTTCCTACCCCAATTTCC |
| IL-6-R | TTGGTCCTTAGCCACTCCTTC |
| IL-10-F | TGGTAGAAGTGATGCCCCAG |
| IL-10-R | ACTCTTCACCTGCTCCACTG |
| TNF-α-F | GTGGAACTGGCAGAAGAG |
| TNF-α-R | GAGAAGAGGCTGAGACATAG |
GAPDH, glyceraldehyde-3-phosphate dehydrogenase; Draxin, dorsal inhibitory axon guidance protein; IL, interleukin; TNF, tumor necrosis factor.
Mouse brain sections were washed three times with PBS. They were blocked in PBS containing 10% normal goat serum (240528; Affinity Biosciences Ltd., Changzhou, Jiangsu, China) for 1 h at room temperature, then incubated overnight at 4 °C with the primary antibody. After washing with PBS, sections were incubated in blocking buffer with secondary antibodies for 1 h. Cell nuclei were stained with Hoechst 33342 (C0031-01, Solarbio) for 8 min at room temperature. Following three PBS washes, images were acquired using a confocal microscope (FV3000, Olympus, Tokyo, Japan). Primary antibodies used for immunostaining were MAP2 (rabbit; 1:200, Cell Signaling Technology) and NeuN (rabbit, 1:200, Cell Signaling Technology). Secondary antibodies were Alexa Fluor 488 streptavidin anti-biotin (1:400, 702410ES03, Yeasen Biotechnology, Shanghai, China) and Alexa Fluor 488/555 coupled goat anti-rabbit IgG (1:800, cr3358443-5, Abcam).
The Morris water maze (MWM) was used to evaluate spatial learning and memory in
mice. Briefly, a circular pool (diameter 120 cm, height 50 cm) filled with water
(22
Spatial memory was assessed using a Y-maze with removable arm partition baffles, as previously described [19]. Mice were habituated to the experimental environment for 1 week before the formal experiment. After habituation, distinct colored and shaped stickers were affixed to the end of each arm. The formal experiments commenced with each mouse tested for 10 min per session. The Y-maze experiment consisted of two phases, spaced 1 h apart. During the first phase of training, the novel arm was blocked with a partition baffle, and mice were placed at the end of the starting arm. After 10 min of free exploration at the starting arm and other accessible arms, mice were returned to their home cages. The second phase of the test was conducted 1 h later, with the partition baffle removed from the novel arm, and each mouse repositioned at the end of the starting arm. The time spent, distance traveled, and number of arm entries were recorded during 10 min of free exploration across all three arms.
Draxin expression data were acquired from the AD-dedicated database AlzData
(http://www.alzdata.org/) by integrating five publicly available gene expression
datasets (GSE28146, GSE29378, GSE36980, GSE48350, GSE5281). Samples were selected
based on three stringent criteria: human hippocampal tissue, clear grouping into
AD patients or age-matched normal controls, and
Images were analyzed using ImageJ. All data were
expressed as the mean
Following a search of the AD database AlzData—encompassing the publicly
available datasets GSE28146, GSE29378, GSE36980, GSE48350, and GSE5281—draxin
expression in the hippocampal region of AD patients was found to be higher than
in normal subjects (p = 0.044; Fig. 1A). After considering data from
multiple brain regions, no difference in the FDR was found (Fig. 1B). To
investigate the role of draxin overexpression in the pathogenesis and progression
of AD, we constructed a mouse model of draxin overexpression by injecting
draxin-AAV into the bilateral hippocampus of WT mice. The
spontaneous green fluorescent protein (GFP) green signal of the virus was
visualized using fluorescence microscopy (Fig. 1C). A qRT-PCRassay showed that
the level of draxin expression in the WT+AAV-draxin group was significantly
increased relative to the WT+PBS and WT+AAV-NC groups (p
 Fig. 1.
Expression of draxin in the hippocampus of AD patients in
AlzData. (A) Distribution of draxin expression in the hippocampus of AD patients
and normal subjects (n = 68 in control group, n = 52 in AD group); (B) Draxin
expression in the hippocampus of AD patients and normal subjects. (C)
Fluorescence microscopy of the hippocampal gland of three groups of mice with
different virus expression. Scale bar = 100 µm. (D) qRT-PCR detection of hippocampal
draxin expression in three groups of mice. n = 4. * p
An AD cell model with overexpression of draxin was also constructed with HT22
cells. After mapping the optimal Multiplicity of Infection (MOI), draxin
lentivirus was successfully transfected into HT22 cells, with the spontaneous GFP
green signal of the virus visible by fluorescence microscopy (Fig. 1E). qRT-PCR
revealed that draxin expression was significantly higher in the lentivirus
(LV)-draxin group compared with the negative control (NC) and lentivirus-negative
control (LV-NC) groups (p
To investigate whether draxin has a detrimental impact on hippocampal neuronal
cells, the viability of cells in the NC, LV-NC, and LV-draxin groups was
evaluated by CCK8 assay, while the apoptosis rate was assessed by Hoechst
staining. The survival rate of cells in the LV-draxin group was significantly
decreased compared with the LV-NC group (p
 Fig. 2.
Effects of draxin on the activity, neuronal-associated
proteins, and Tau proteins of HT22 cells and AD cell models. (A) Hoechst
staining of the three groups of cells. Scale bar = 200 µm; (B) Cell
survival rate, as determined by CCK8 assay. Hoechst staining of the three groups
of cells was used to calculate the apoptosis rate. (C) Hoechst staining of three
AD cell models. Scale bar = 200 µm; (D) Cell viability, as determined by
CCK8 assay, and apoptosis rate as determined by Hoechst staining of the three AD
cell models. (E) Western blot detection of MAP2 and NeuN expression, and
quantification of the results in three groups of HT22 cells, MAP2 n = 3, NeuN n =
4. (F) Western blot detection of MAP2 and NeuN expression, and quantification of
the results in three groups of AD cell models, MAP2 n = 3, NeuN n = 3. (G)
Western blot detection of p-Tau231 and p-Tau396 expression and quantification of
the results in three groups of HT22 cells, p-Tau231 n = 4, p-Tau396 n = 4; (H)
Western blot detection of p-Tau231 and p-Tau396 expression and quantification of
the results in three groups of AD cell models, p-Tau231 n = 4, p-Tau396 n = 4.
mean
To determine whether draxin aggravated AD pathology, we examined the expression
levels of p-tau in three groups of cells: NC, LV-NC, and LV-draxin. A trend for
increased levels of phosphorylated tau proteins p-tau231 and p-tau396 was
observed in the LV-draxin group in contrast to the LV-NC group (Fig. 2G). The
level of phosphorylated tau protein p-tau396 in the NC group was significantly
higher than in the LV-NC group (p
 Fig. 3.
The effect of draxin on the levels of
Wnt/
The Y-maze test and MWM were used to evaluate the learning and memory ability in
the three groups of mice: WT+PBS, WT+AAV-NC, and WT+AAV-draxin. The spontaneous
alternation rate (alternation %) of mice in the WT+AAV-draxin group was
significantly lower than in the WT+AAV-NC group (p
 Fig. 4.
Behavioral experiments aimed at detecting the effects of draxin
on the learning and memory ability of normal mice. (A) Motion trajectory
diagrams of mice from the three groups exploring the new arm of the Y maze
spatial recognition experiment. (B) Y maze spontaneous alternation rate, number
of times exploring the new arm, and percentage of time exploring the new arm by
the three groups of mice in the alternation experiment; n = 10. ** p
In the MWM experiments, the time to find the platform (platform latency) of the
mice decreased progressively over time during navigation training in the
WT+AAV-NC and WT+PBS groups, but not in the WT+AAV-draxin group (Fig. 4C,D). In
the probe experiment on day 6, mice in the WT+AAV-draxin group exhibited a
significantly decreased number of platform crossings compared with the other two
groups (p
Neuropathological changes in the mouse brain were examined by detecting the
expression of MAP2, NeuN, and p-tau, as well as the
Wnt/
The level of p-tau396 in mice from the WT+AAV-draxin group was increased
compared with the WT+AAV-NC group (p
To explore the mechanisms underlying the detrimental impacts of draxin overexpression on the brain and neurons, RNA sequencing analysis was performed on HT22 cells from the LV-NC and LV-draxin groups. Significant changes were found in the expression of 66 genes, of which 31 were up-regulated and 35 were down-regulated (Fig. 5A). Heatmap clustering analysis showed different expression patterns among the samples (Fig. 5B). Gene ontology (GO) and kyoto encyclopedia of genes and genomes (KEGG) analyses revealed that the top 20 differentially expressed genes were significantly enriched in pathways for regulation of ribonuclease activity, adhesion of symbiont to host, response to protozoan, cellular response to interferon-beta, defense response to symbiont, defense response to virus, and regulation of nuclease activity. Amongst these, binding, cell part, and cellular process-related genes accounted for the highest percentage of biological processes (BP), cellular components (CC), and molecular functions (MF) (Fig. 5C).
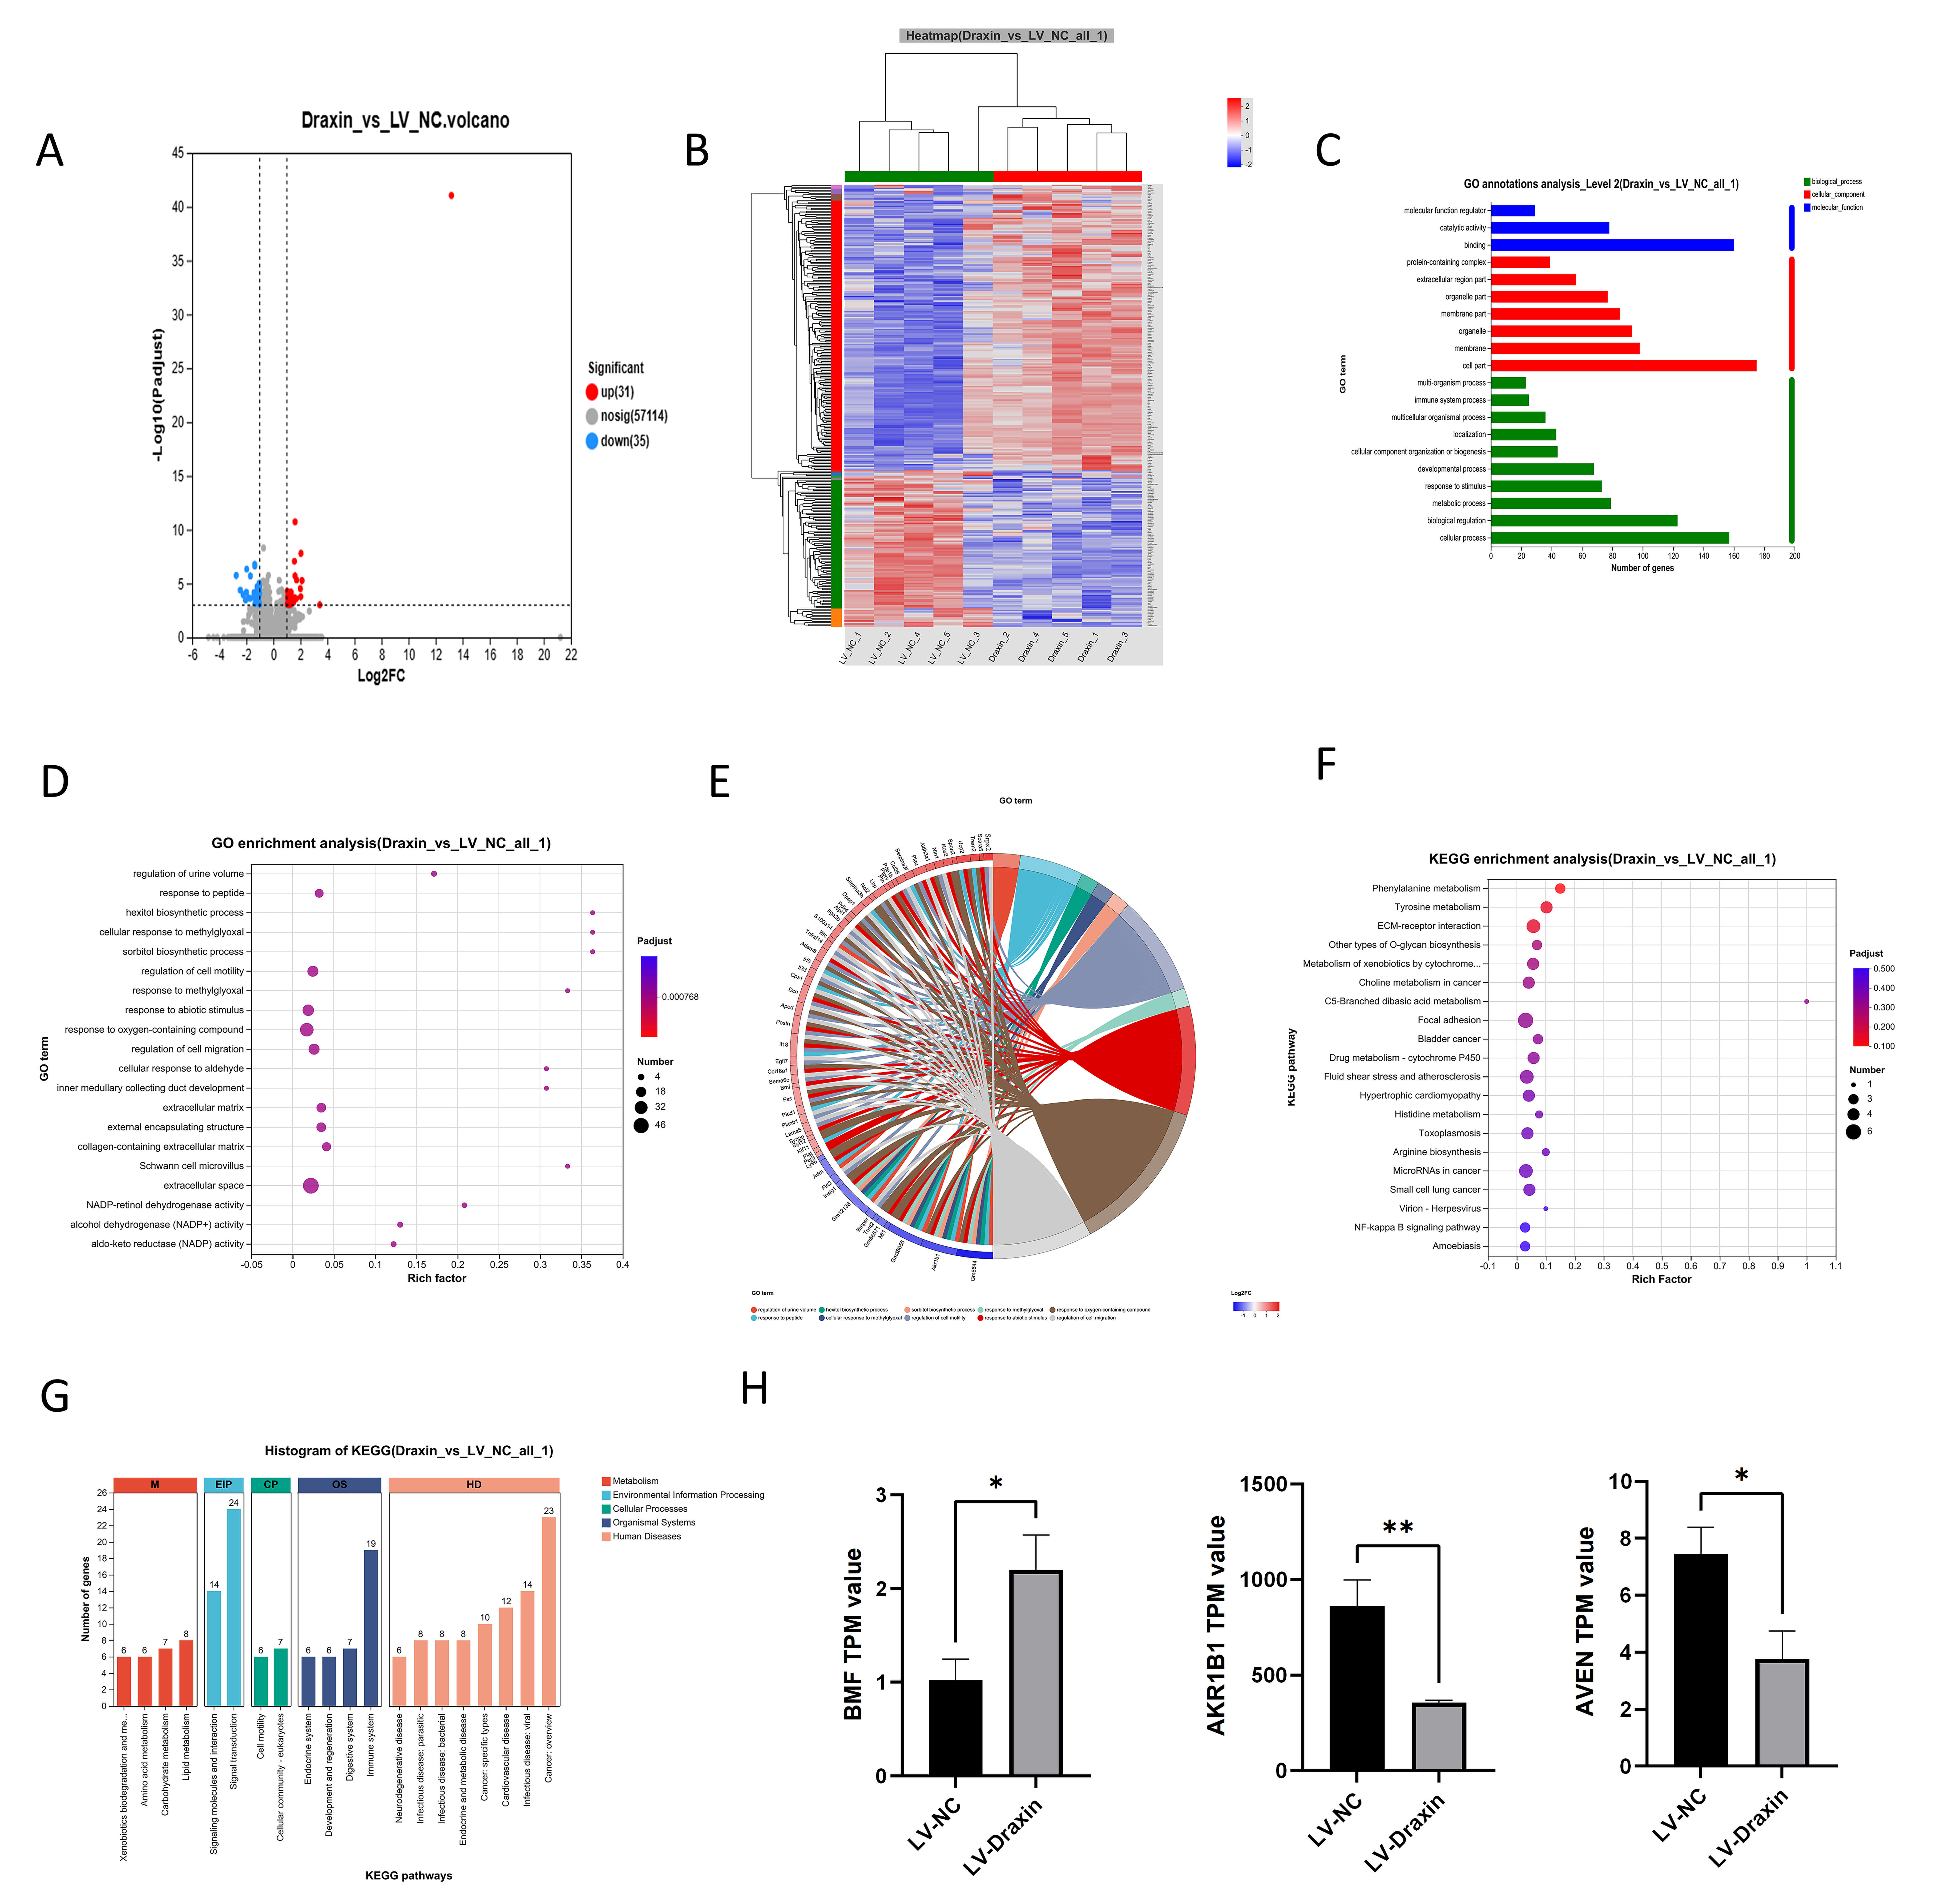 Fig. 5.
RNA sequencing analysis of HT22 cells with draxin
overexpression. (A) Differential gene volcano plot; (B) Clustering heatmap of
differentially expressed genes (red color indicates up-regulated gene expression;
blue color indicates down-regulated gene expression); (C) Differentially
expressed gene GO function annotation map; (D) Differentially expressed gene GO
enrichment bubble map; (E) Differentially expressed gene GO enrichment string
map; (F) Differentially expressed gene KEGG function annotation map; (G)
Differentially expressed gene KEGG enrichment bubble map; (H) Relative expression
of BMF, AKR1B1 and AVEN genes in the cells of the two groups. n = 5. *
p
Further analysis showed that draxin overexpression had a significant effect on
hippocampal neuron glucose metabolism and alcohol metabolism, as well as
regulating the stress response of aldehydes and the microvillus function of
Schwann cells (Fig. 5D,E). KEGG enrichment analysis revealed that the
differentially expressed genes were involved in a variety of metabolic
regulations, with C5-branched-chain dicarboxylic acid metabolism (rich factor
close to 1) being particularly significant. These genes were also enriched for
biological processes such as the NF-
Elevated draxin expression in the hippocampus of AD patients has not been
previously documented. The current study revealed for the first time the effects
of draxin overexpression on mouse neurons and cognitive functions. This
encompasses decreased expression of neuronal markers (MAP2, NeuN) and deficits in
spatial learning and memory. Furthermore, draxin overexpression significantly
promoted tau protein phosphorylation (p-tau231 and p-tau396) and neuronal
apoptosis and inhibited the Wnt/
MAP2 is considered a useful marker for mature neuronal cells. NeuN, a protein
encoded by the RBFOX3 gene, is also commonly used as a neuronal
biomarker. Previous studies have reported that draxin inhibits neuronal axon
growth in vitro [20, 21] and in vivo [22, 23]. This is
consistent with the present findings that draxin decreased cell viability,
decreased the expression of MAP2 and NeuN, and increased the apoptosis rate in
HT22 cells and an A
Furthermore, draxin overexpression in WT mice resulted in spatial learning and
memory dysfunction, as indicated by decreased time spent exploring the new arm in
the Y-maze, prolonged escape latency, and reduced platform crossings in the MWM
test. Moreover, mice with draxin overexpression showed reduced levels of
hippocampal MAP2 and NeuN expression, along with elevated p-tau396. Draxin has
been reported to be a competitive antagonist of Wnt proteins for binding to
low-density LRP6, which in turn inhibits the classical Wnt/
GSK-3
RNA sequence analysis revealed that relative expression of the BMF gene was significantly higher in the LV-draxin group compared with the LV-NC group, whereas the relative expression of AKR1B1 (aldo-keto reductase family 1 member B1) and AVEN (apoptosis and caspase activation inhibitor) was significantly lower. BMF is a member of the B-cell lymphoma-2 (Bcl-2) family of proteins, and promotes or inhibits cell death by regulating the mitochondrial pathway [30]. BMF protein regulates the permeability of the mitochondrial membrane by binding to other Bcl-2 family proteins, promoting destabilization of the mitochondrial membrane and the release of apoptosis-associated proteins [31]. Increased expression of BMF is usually associated with activation of the apoptotic pathway [31]. The AKR1B1 gene encodes a key enzyme that is involved in a variety of biological processes, including antioxidant defense [32] and metabolic homeostasis [33]. The downregulation of AKR1B1 in neurons may reduce cellular resistance to oxidative stress and increase the risk of cellular damage, thereby promoting apoptotic pathways. AVEN is known to inhibit apoptosis, in particular by interacting with Apaf-1, which blocks the release of cytochrome c from mitochondria to the apoptotic signaling pathway in the cytoplasm [34]. Thus, downregulation of AVEN may render neurons more susceptible to undergoing programmed cell death. Both the upregulation of BMF and the downregulation of AKR1B1 and AVEN suggest that draxin overexpression could potentially modulate AKR1B1- and AVEN-mediated apoptosis-related signaling pathways, although this requires further research.
In summary, our study demonstrated that draxin overexpression impairs learning
and memory abilities in mice. This appears to be mediated by inhibition of the
Wnt/
Our research yields strong evidence indicating that overexpressed draxin leads
to cognitive dysfunction in mice through its damaging effects on hippocampal
neurons. Suppression of the Wnt/
AD, Alzheimer’s disease; NFTs, neuroprogenitor fibrillary tangles; DCX, doublecortin; Sox2, sex determining region Y-box 2; PBS, phosphate-buffered saline; AAV, adeno-associated virus; CA1, Cornu Ammonis 1; qRT-PCR, quantitative real-time polymerase chain reaction; MWM, Morris Water Maze; FDR, false discovery rate; WT, wild-type; NC, negative control; BMF, BCL2-modifying factor; AVEN, Apoptosis And Caspase Activation Inhibitor; AKR1B1, Aldo-keto reductase family 1 member B1.
The data presented in this study are available from the corresponding author upon request.
ZL designed the study, directed the project, supervised the experiments and analyses, reviewed the manuscript, QC and YF performed experiments, interpreted results, and wrote the initial manuscript; LH participated in the acquisition of experimental data (Tissue Immunofluorescence) and the interpretation of key experimental data, drafted sections of the manuscript, and critically reviewed and edited the manuscript for important intellectual content. XC participated in the study design, provided targeted supervision on experimental design optimization, offered substantive intellectual input in the interpretation of complex data sets (RNA sequencing analysis), and participated in drafting and revising the initial manuscript. All authors contributed to editorial changes in the manuscript. All authors read and approved the final manuscript. All authors have participated sufficiently in the work and agreed to be accountable for all aspects of the work.
All animal-related experiments in this study were approved by the Ethics Committee of Guangdong Medical University (Ethics Approval No. GDMU-2023-000109) and adhered to the National Institutes of Health Guide for the Care and Use of Laboratory Animals (NIH Guide), a widely recognized international standard for the ethical care and use of laboratory animals.
Not applicable.
This research was funded by Guangdong Provincial Basic and Applied Basic Research Fund (2024A1515220002), the Clinical + Basic Research Project of Guangdong Medical University (4SG23284G, GDMULCJC2024003, GDMULCJC2024036), the Affiliated Hospital of Guangdong Medical University (LCYJ2020B009), the Guangdong Provincial Medical Association Clinical Research Fund - Healthcare Special (2024HY-A6006), the 2023 Special Project of the Songshan Lake Medical-Engineering Integration Innovation Center of Guangdong Medical University (4SG22307P), the Guangdong Medical University Affiliated Hospital High level Talent Research Launch Fund (GCC2022011), the Science and Technology Planning Project of Zhanjiang (2020B01395, 2020B01421), the Science and Technology Planning Project of GDMU (GDMUQ2021047, GDMU2021122).
The authors declare no conflict of interest.
Supplementary material associated with this article can be found, in the online version, at https://doi.org/10.31083/JIN47749.
References
Publisher’s Note: IMR Press stays neutral with regard to jurisdictional claims in published maps and institutional affiliations.