


 , Rui Qin 1,2,†, Xin Wang 3, Wei Wang 3, Huan Li 1,2, Li Xiang 1,2, Liangping Ni 1,2, Dai Zhang 1,2, Jun Zhang 3,*
 , Longsheng Wang 1,2,*
1 Department of Radiology, The Second Affiliated Hospital of Anhui Medical University, 230601 Hefei, Anhui, China
2 Medical Imaging Research Center, Anhui Medical University, 230601 Hefei, Anhui, China
3 Department of Neurology, The Second Affiliated Hospital of Anhui Medical University, 230601 Hefei, Anhui, China
†These authors contributed equally.
Abstract
White-matter hyperintensities (WMHs) are a signature feature of cerebral small-vessel disease and are associated with cognitive decline. This study used network-based statistics (NBS) to investigate global functional network changes and their association with cognitive function in individuals with WMHs.
The Montreal Cognitive Assessment (MoCA) was administered to 33 individuals with WMHs and 34 healthy controls. Whole-brain resting-state functional-connectivity (RSFC) differences were analyzed using NBS on resting-state functional Magnetic Resonance Imaging data. Significant connectivity of modular changes within and between networks was examined, and the relationship between MoCA and RSFC was analyzed. Support vector machine (SVM) models were used to evaluate the potential of functional networks as a supplement to structural imaging and a sensitive subclinical indicator.
Individuals with WMHs exhibited significantly lower MoCA scores than did healthy controls. Inter-regional RSFC analysis revealed reduced connectivity across some networks, including the Default Mode Network–Sensorimotor Network (DMN–SMN), DMN–Cingulo-Opercular Network (DMN–CON), and CON–Cerebellar Network (CON–CER). The SVM models demonstrated robust classification performance, with areas under the curve (AUC) of 0.864 ± 0.155 for DMN–SMN, 0.838 ± 0.175 for DMN–CON, and 0.821 ± 0.167 for CON–CER. Global RSFC strength and modular RSFC strength were positively correlated with MoCA scores.
WMHs are associated with widespread RSFC alterations, especially in networks involved in cognition and motor control; these differences may contribute to cognitive decline in WMHs and serve as potential biomarkers for early diagnosis and intervention.
Keywords
- white matter
- magnetic resonance imaging
- functional
- cognitive dysfunction
- biomarkers
Cerebral small vessel disease (CSVD) is one of the most common cerebrovascular diseases, and primarily affects arterioles, capillaries, and venules [1]. Studies have shown that the disease may cause cognitive and motor impairments in the elderly, affecting their daily lives [2, 3, 4]. White-matter hyperintensities (WMHs), observed in neuroimaging, are considered one of the hallmark features of CSVD [5, 6]. WMHs are characterized by abnormally high signals in the white matter, observed on T2-weighted or fluid-attenuated inversion recovery (FLAIR) sequences in magnetic resonance imaging (MRI). The pathological features of WMHs typically include demyelination, small vessel lesions, and white-matter tissue damage [7, 8, 9]. WMHs are commonly observed in middle-aged and elderly populations, with prevalence gradually increasing with age [10]. Studies have demonstrated that the severity of WMHs is strongly associated with various cerebrovascular risk factors, including hypertension and diabetes [11]. Furthermore, WMHs are strongly associated with declines in information-processing speed, executive dysfunction, and the onset of dementia, with the severity of these declines serving as a key predictor of cognitive impairment [12].
Numerous studies have shown that structural damage caused by WMHs disrupts the integrity of white-matter fiber bundles that connect cortical and subcortical regions, thereby weakening cross-regional functional communication that relies on these pathways, and manifesting as abnormalities in resting-state functional connectivity (RSFC) [13, 14]. Resting-state fMRI (rs-fMRI) measures spontaneous low-frequency brain fluctuations [15, 16], and the RSFC index characterizes activity synchronization between brain regions, thereby serving as a widely used measure to investigate brain functional networks and disease mechanisms [17, 18, 19, 20]. Many WMHs studies have relied on region-level or seed point analyses, which may overlook coordinated interactions across brain systems. For example, previous FC studies typically reported isolated or region-specific connectivity changes, which limited their ability to reveal coherent network-level changes [21]. In addition, rs-fMRI studies using local metrics such as low-frequency fluctuation, regional homogeneity, or brain entropy primarily capture regional activity abnormalities but provide limited insight into large-scale functional integration [22, 23, 24]. The brain functions as an integrated network, and disruptions in cross-nodal connectivity patterns can have broad effects beyond those observed in a single region [25]. Independent analysis of each brain region may overlook the complex interactions between multiple brain regions. Furthermore, recent evidence has suggested that increases in extracellular fluid are also observed in normal-appearing white matter in CSVD, and not just in WMHs regions [26], potentially indicating a more diffuse effect beyond the immediate area of the lesion. Therefore, methods that capture these network-level interactions are crucial for a comprehensive understanding of WMHs-related functional changes.
In rs-fMRI data analysis, network-based statistics (NBS) are a powerful tool for detecting significant connectivity differences within brain functional networks. NBS significantly improves the ability to detect overall differences in the network by modeling the brain network as a graph, consisting of nodes and connections, using non-parametric statistical methods for analysis [27]. Compared to traditional point-by-point analysis, NBS addresses the balance issue by identifying clustered connected components. It significantly enhances statistical performance and is particularly well-suited for analyzing low signal-to-noise-ratio data [27, 28, 29]. This method has been successfully applied in functional-connectivity studies across various disease groups, including injury and Alzheimer’s disease [30, 31, 32, 33], offering crucial statistical support for identifying both global and local differences within brain networks. NBS can effectively address the issue of multiple comparisons and detect functional connectivity at the network level more sensitively. The combination of rs-fMRI and NBS analysis can identify the overall functional network difference between WMHs groups and healthy controls more accurately, further enhancing the understanding of neural network changes in WMHs individuals.
The modularity of functional networks has attracted growing attention in the analysis of brain functional connectivity. Modular connectivity refers to the brain’s composition of multiple, relatively independent, yet synergistic functional modules, which play a crucial role in sustaining normal cognitive function [34]. Studies have demonstrated that different disease states, such as Alzheimer’s disease and stroke sequelae, lead to alterations in the connectivity between functional modules, thereby affecting the brain’s overall network-integration capacity [35, 36, 37]. Previous WMHs studies have focused mostly on the average functional-connectivity strength of the whole brain or specific brain regions [5]. Whether alterations in modular functional networks are linked to cognitive impairment in WMHs individuals still requires further study.
This study aimed to characterize functional connectivity alterations in individuals with WMHs compared with healthy controls and to further examine how these changes relate to cognitive decline. By combining rs-fMRI data with NBS, the changes in whole-brain and modular functional connectivity were evaluated. The classification performance of these functional-connectivity values was further evaluated using support vector machine (SVM) models to assess their potential effectiveness as a biomarker. Additionally, the correlation between these functional connections and cognitive functions was examined. In this study, we proposed the following hypothesis: Individuals with WMHs exhibit a broad range of functional network changes, potentially involving the default mode network, among others. The strength of these functional networks is associated with cognitive function and could serve as an effective classification model to distinguish individuals with WMHs from healthy controls.
Right-handed patients with white matter hyperintensities (WMHs; n = 33)
and healthy controls (HC; n = 34) were recruited from the Department of
Neurology of the Second Affiliated Hospital of Anhui Medical University.
Participants were 45–75 years old with at least three years of education. WMHs
burden was quantified using the Fazekas scale [38]. Two experienced radiologists,
blind to group allocation, independently rated the extent and severity of WMHs on
T2-FLAIR images. Periventricular WMHs (PVWMHs) and deep WMHs (DWMHs) were each
rated on a scale from 0 to 3, yielding a total Fazekas score ranging from 0 to 6.
In this study, all participants in the WMHs group had a total Fazekas score of
Based on previous power-estimation studies [39, 40], we used a previous power
analysis performed with G*Power 3.1.9.7 software (developed by Heinrich Heine University Düsseldorf, Düsseldorf, North
Rhine-Westphalia, Germany). The results showed that at
Resting-state MRI data of all subjects were acquired at the Second Affiliated
Hospital of Anhui Medical University using a 3.0T MRI scanner (MAGNETOM Vida,
Siemens AG, Munich, Germany). T1WI, T2WI, FLAIR diffusion-weighted, and
susceptibility-weighted imaging were used to diagnose WMHs. T1-weighted
structural images with voxel size = 1
Resting-state fMRI data were preprocessed using the AFNI (v. 22.2.10, National Institute of Mental Health, NIH, Bethesda,
MD, USA) and FSL (v. 6.0.5.2, FMRIB, University of Oxford, Oxford, Oxfordshire, United Kingdom)
software. To minimize signal instability, the first 10 time points of each
participant’s data were discarded. The preprocessing pipeline included
slice-timing correction, head-motion correction, brain extraction, spatial
smoothing with a full width at half maximum of 6 mm, intensity normalization, and
removal of linear trends. To further reduce noise, a temporal band-pass filter
(0.01–0.10 Hz) was applied to retain low-frequency signals. Nuisance regression
was performed using 12 motion parameters (6 head motion parameters and their
first-order derivatives), along with mean signals from cerebrospinal fluid and
white matter. Subsequently, functional images were aligned to each participant’s
structural image using FMRIB’s Linear Image Registration Tool, as implemented in FSL. The resulting
images were then nonlinearly warped to the MNI standard space using the FMRIB
Nonlinear Image Registration Tool. Head motion was assessed during preprocessing,
and all participants exhibited motion within acceptable limits (displace
To perform NBS analysis, a whole-brain RSFC network was first constructed for
each subject. The Dosenbach-160 atlas, based on functional-connectivity
optimization, divides the brain into 160 regions of interest (ROIs). This atlas
was more robust than traditional anatomical atlases in constructing
functional-connectivity networks and achieving a balance between anatomical
specificity and statistical power. It has been widely used in disease-related
studies [42, 43, 44]. The mean time series of each ROI was extracted, and Pearson
correlation coefficients were computed between the time series of all ROI pairs
to quantify functional connectivity. The resulting 160
In addition, the 160 ROIs were classified into six functional brain networks based on the Dosenbach-160 atlas: the default mode network (DMN); the frontoparietal network (FPN); the cingulo-opercular network (CON); the sensorimotor network (SMN); the visual network (VN); and the cerebellar network (CER). Significant functional connections identified from NBS analysis were further partitioned into intra- and inter-module connections. The average RSFC within and between modules was calculated to assess modular connectivity strength.
Previous studies have shown that functional imaging (especially rs-fMRI) has
sensitivity in identifying early lesion stages such as mild cognitive impairment
or CSVD, even before structural changes occur [19, 46, 47]. Based on this, a
machine-learning model was constructed to test the discriminative value of RSFC
metrics between WMHs and HC. Features included the global mean RSFC and the mean
RSFC strength of three subnetworks identified by NBS with connectivity changes
Statistical analyses were performed using IBM SPSS Statistics for Windows, V.
26.0 (IBM Corp., Armonk, NY, USA). The Shapiro-Wilk test was used to assess the
normality of continuous variables. For continuous variables that met normality
(such as age, years of education, MoCA scores, and RSFC intensity), two-sample
t-tests were used, and for categorical variables (sex), chi-square tests were
used. Specifically, to evaluate cognitive differences between WMHs and HC
individuals, two-sample t-tests were conducted to compare MoCA total scores
between the two groups. To explore the relationship between cognitive performance
(MoCA scores) and mean RSFC strength (the whole network and connected modules
with more than 10% of edges), partial correlations between MoCA scores and mean
RSFC strength were calculated, with age and sex included as covariates to control
for potential confounds. The Benjamini–Hochberg procedure was used to control
the false discovery rate (FDR) across multiple correlation tests, and adjusted
p-values (p-FDR) were reported. ROC curves were generated using
GraphPad Prism software to evaluate the discriminative power of RSFC metrics. For
identifying significant differences in RSFC between groups, the NBS toolbox in
MATLAB was used with a significance threshold of p
The demographic and cognitive characteristics of the two groups (WMHs,
n = 33; HC, n = 34) are summarized in Table 1. The Shapiro-Wilk
test confirmed normality for all continuous measures, including age, education
duration, and MoCA scores (p
| Variable | WMHs (n = 33) | HC (n = 34) | t/ |
p-value | 95% CI |
| Age (years) | 59.091 |
57.206 |
1.193a | 0.237 | –1.270, 5.040 |
| Sex, n (% male) | 13 (39.4%) | 18 (52.9%) | 1.236b | 0.266 | N/A |
| Education (years) | 7.909 |
9.559 |
–1.692a | 0.095 | –3.597, 0.298 |
| MoCA score | 21.606 |
23.676 |
–2.296a | 0.025 | –3.872, –0.269 |
Values are presented as mean
a t-tests were used for continuous variables;
b chi-square tests were used for categorical variables.
WMHs, Individuals with high white matter signals; HC, healthy controls.
MoCA, Montreal Cognitive Assessment.
To further validate the cognitive impairments observed in patients with WMHs, an
independent samples t-test was conducted to compare MoCA total scores
between WMHs and HC. The results were that the WMHs group had a significantly
lower mean MoCA score than did the HC group (WMHs: 21.606
NBS revealed marked RSFC differences between the WMHs and HC groups, with 232 connections reaching significance (Fig. 1A). These edges were primarily distributed across the DMN, CON, SMN, and CER. Cross-modular connections accounted for the majority of significant edges, with the higher proportions observed between DMN-SMN (26.29%), DMN-CON (15.09%) and CER-CON (12.50%). To understand the differences in network pairs selected at different thresholds, we plotted a line graph in the supplementary material (Supplementary Fig. 1) and reported the network pairs included at the 5%–10% threshold (Supplementary Table 1). Circos plots demonstrated the distribution of these significant connections across six functional networks (Fig. 1B) and highlighted the centrality of cross-module disruptions between DMN-CON in WMHs individuals (Fig. 1C).
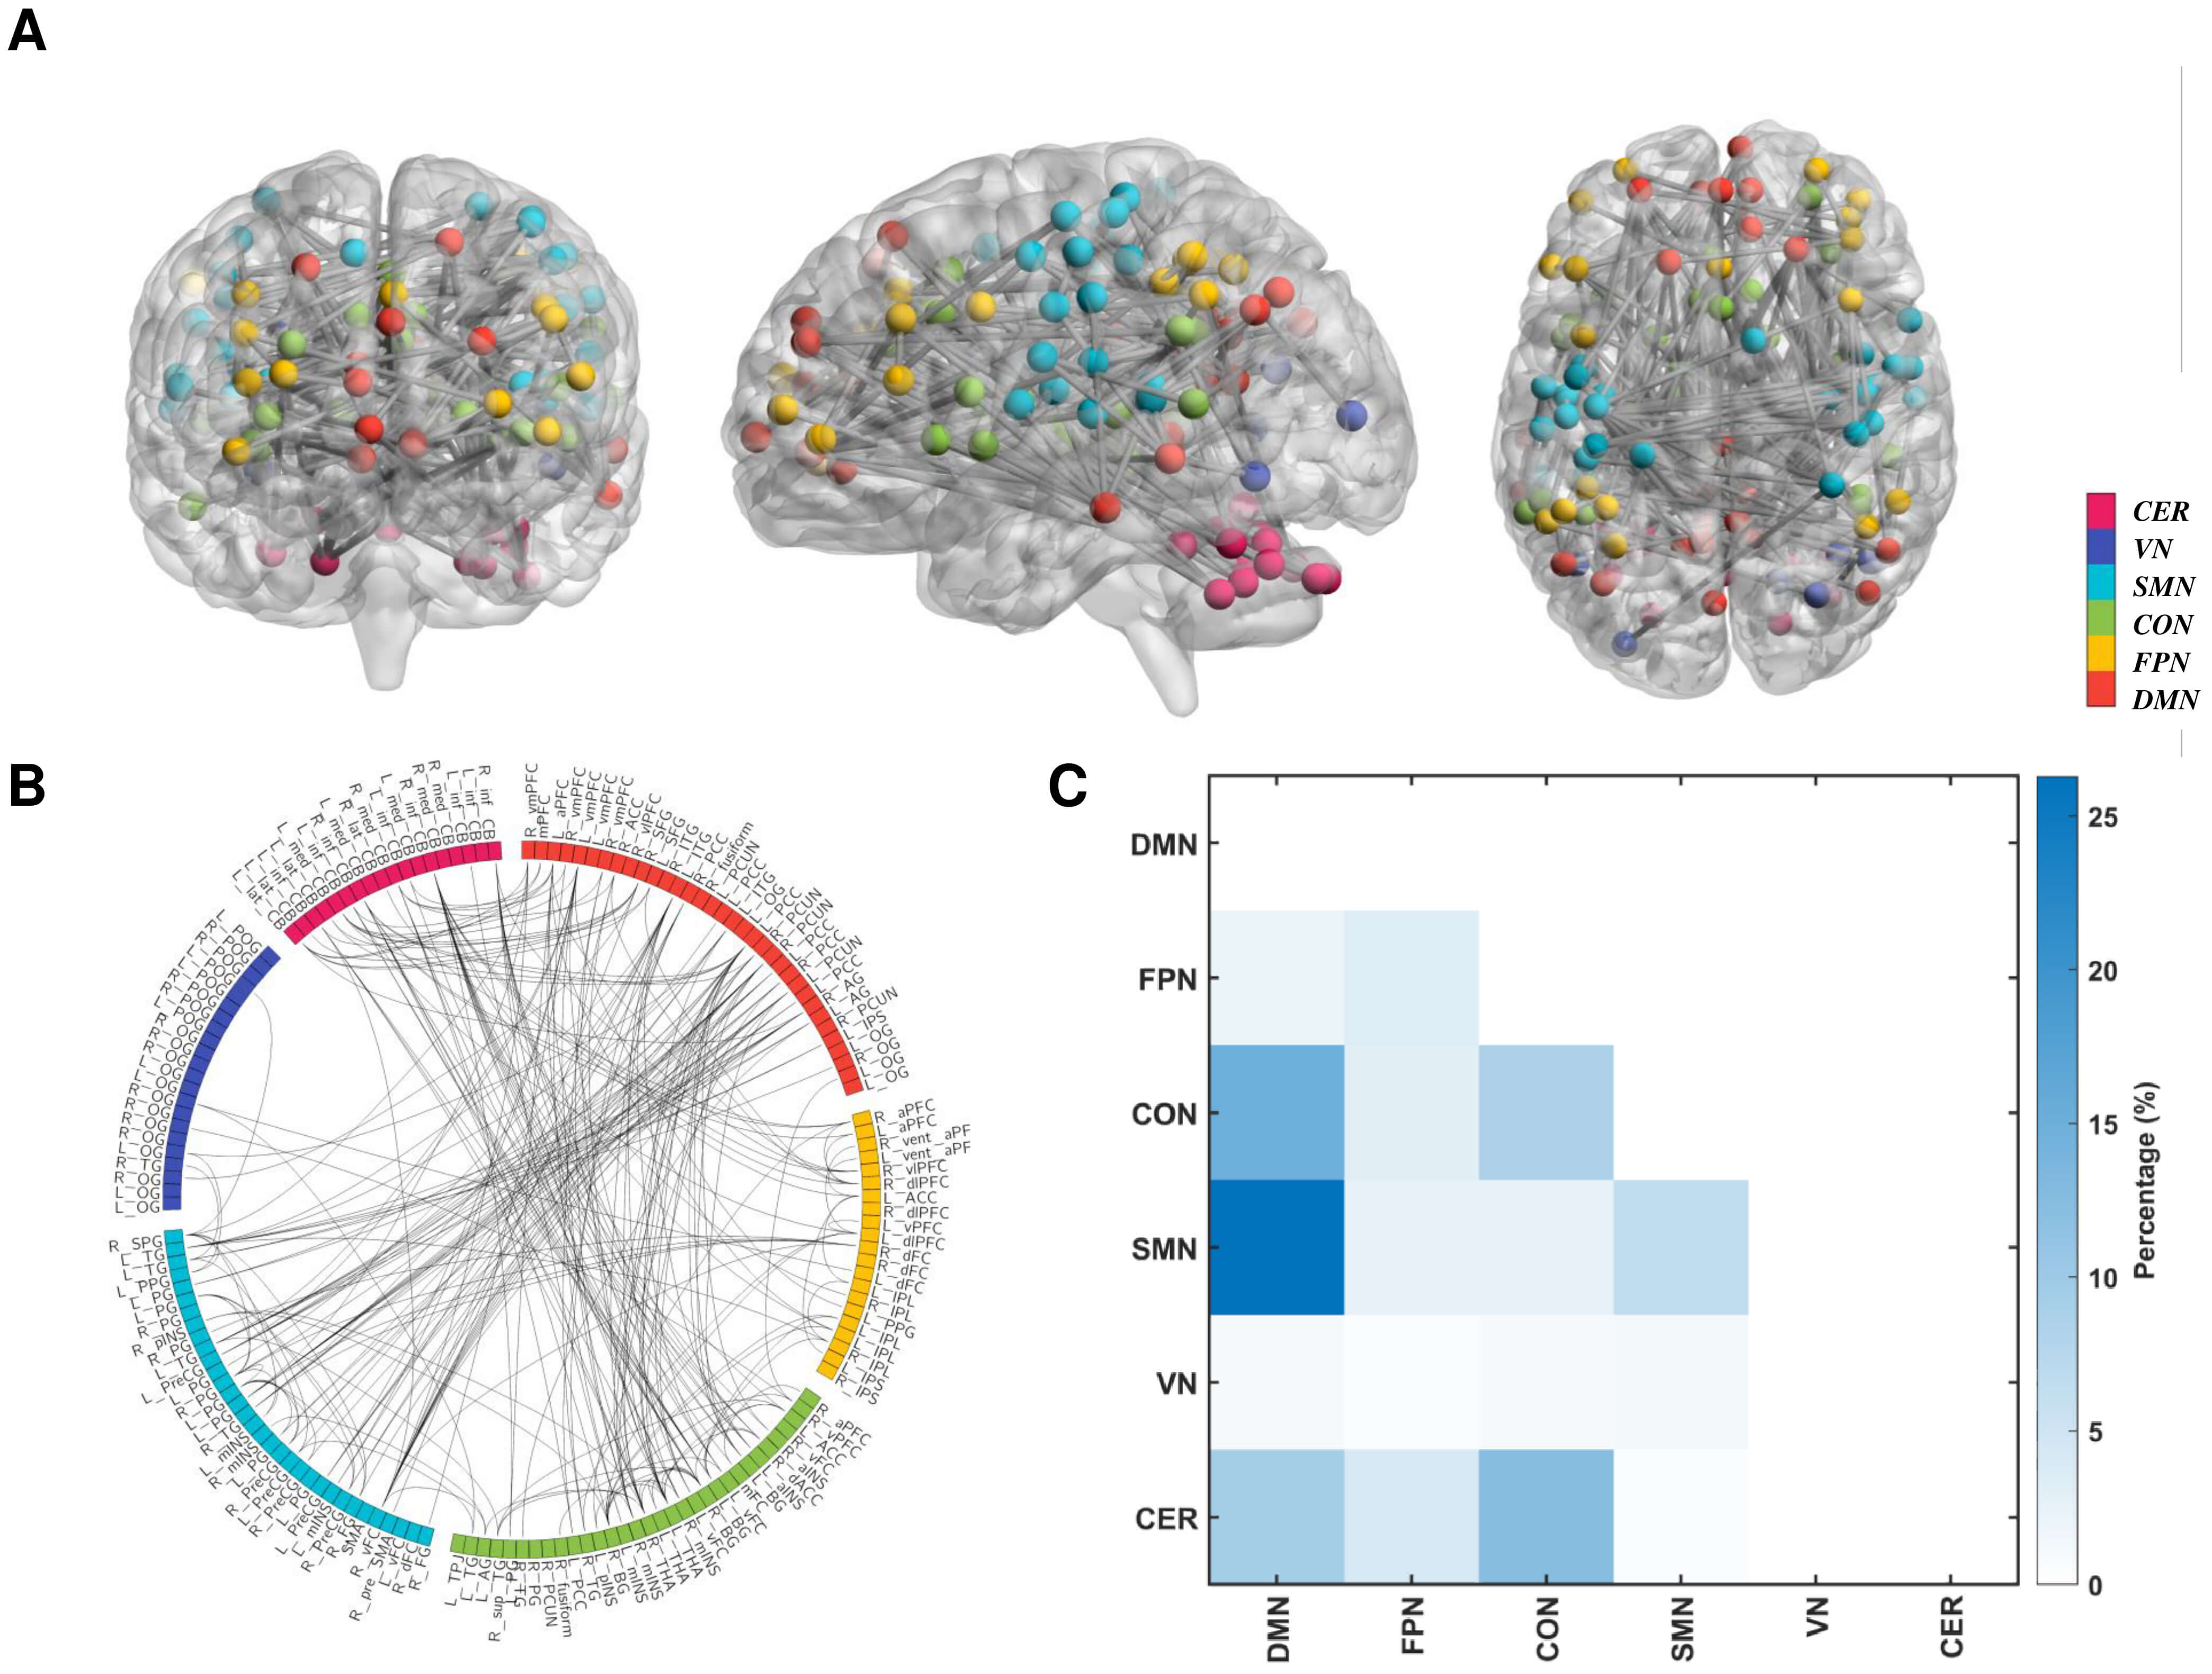 Fig. 1.
Visualization of significant differences in resting-state
functional connectivity (RSFC) between individuals with high white-matter signals
(WMHs) and healthy controls (HC). (A) Brain regions and connections with
significant RSFC differences were identified using the network-based statistics
(NBS) method. Edges represent significant connections, and node colors correspond
to different functional networks (DMN, FPN, CON, SMN, VN, and CER). (B) Circos
plot showing the distribution of significant RSFC differences and connections
between modules. Colors indicate network affiliations and lines represent
significant connections. (C) The main colormap shows the brain network modules to
which the significantly different edges belong. The color bar on the right shows
the proportion of connections within or between modules. All differences were
corrected using NBS (component p
To quantify the differences between groups further, independent sample t-tests
were performed on the overall RSFC strength and selected module-specific RSFC
pairs in SPSS. The WMHs group had significantly lower overall RSFC strength
(t = –9.936, p
To evaluate the discriminant values of RSFC changes, an ROC curve was drawn
using an SVM classifier. Using stratified 10-fold cross-validation repeated 10
times, all single-feature SVM classifiers demonstrated meaningful discriminative
performance. Among them, the global RSFC feature achieved the highest accuracy,
with an AUC of 0.966
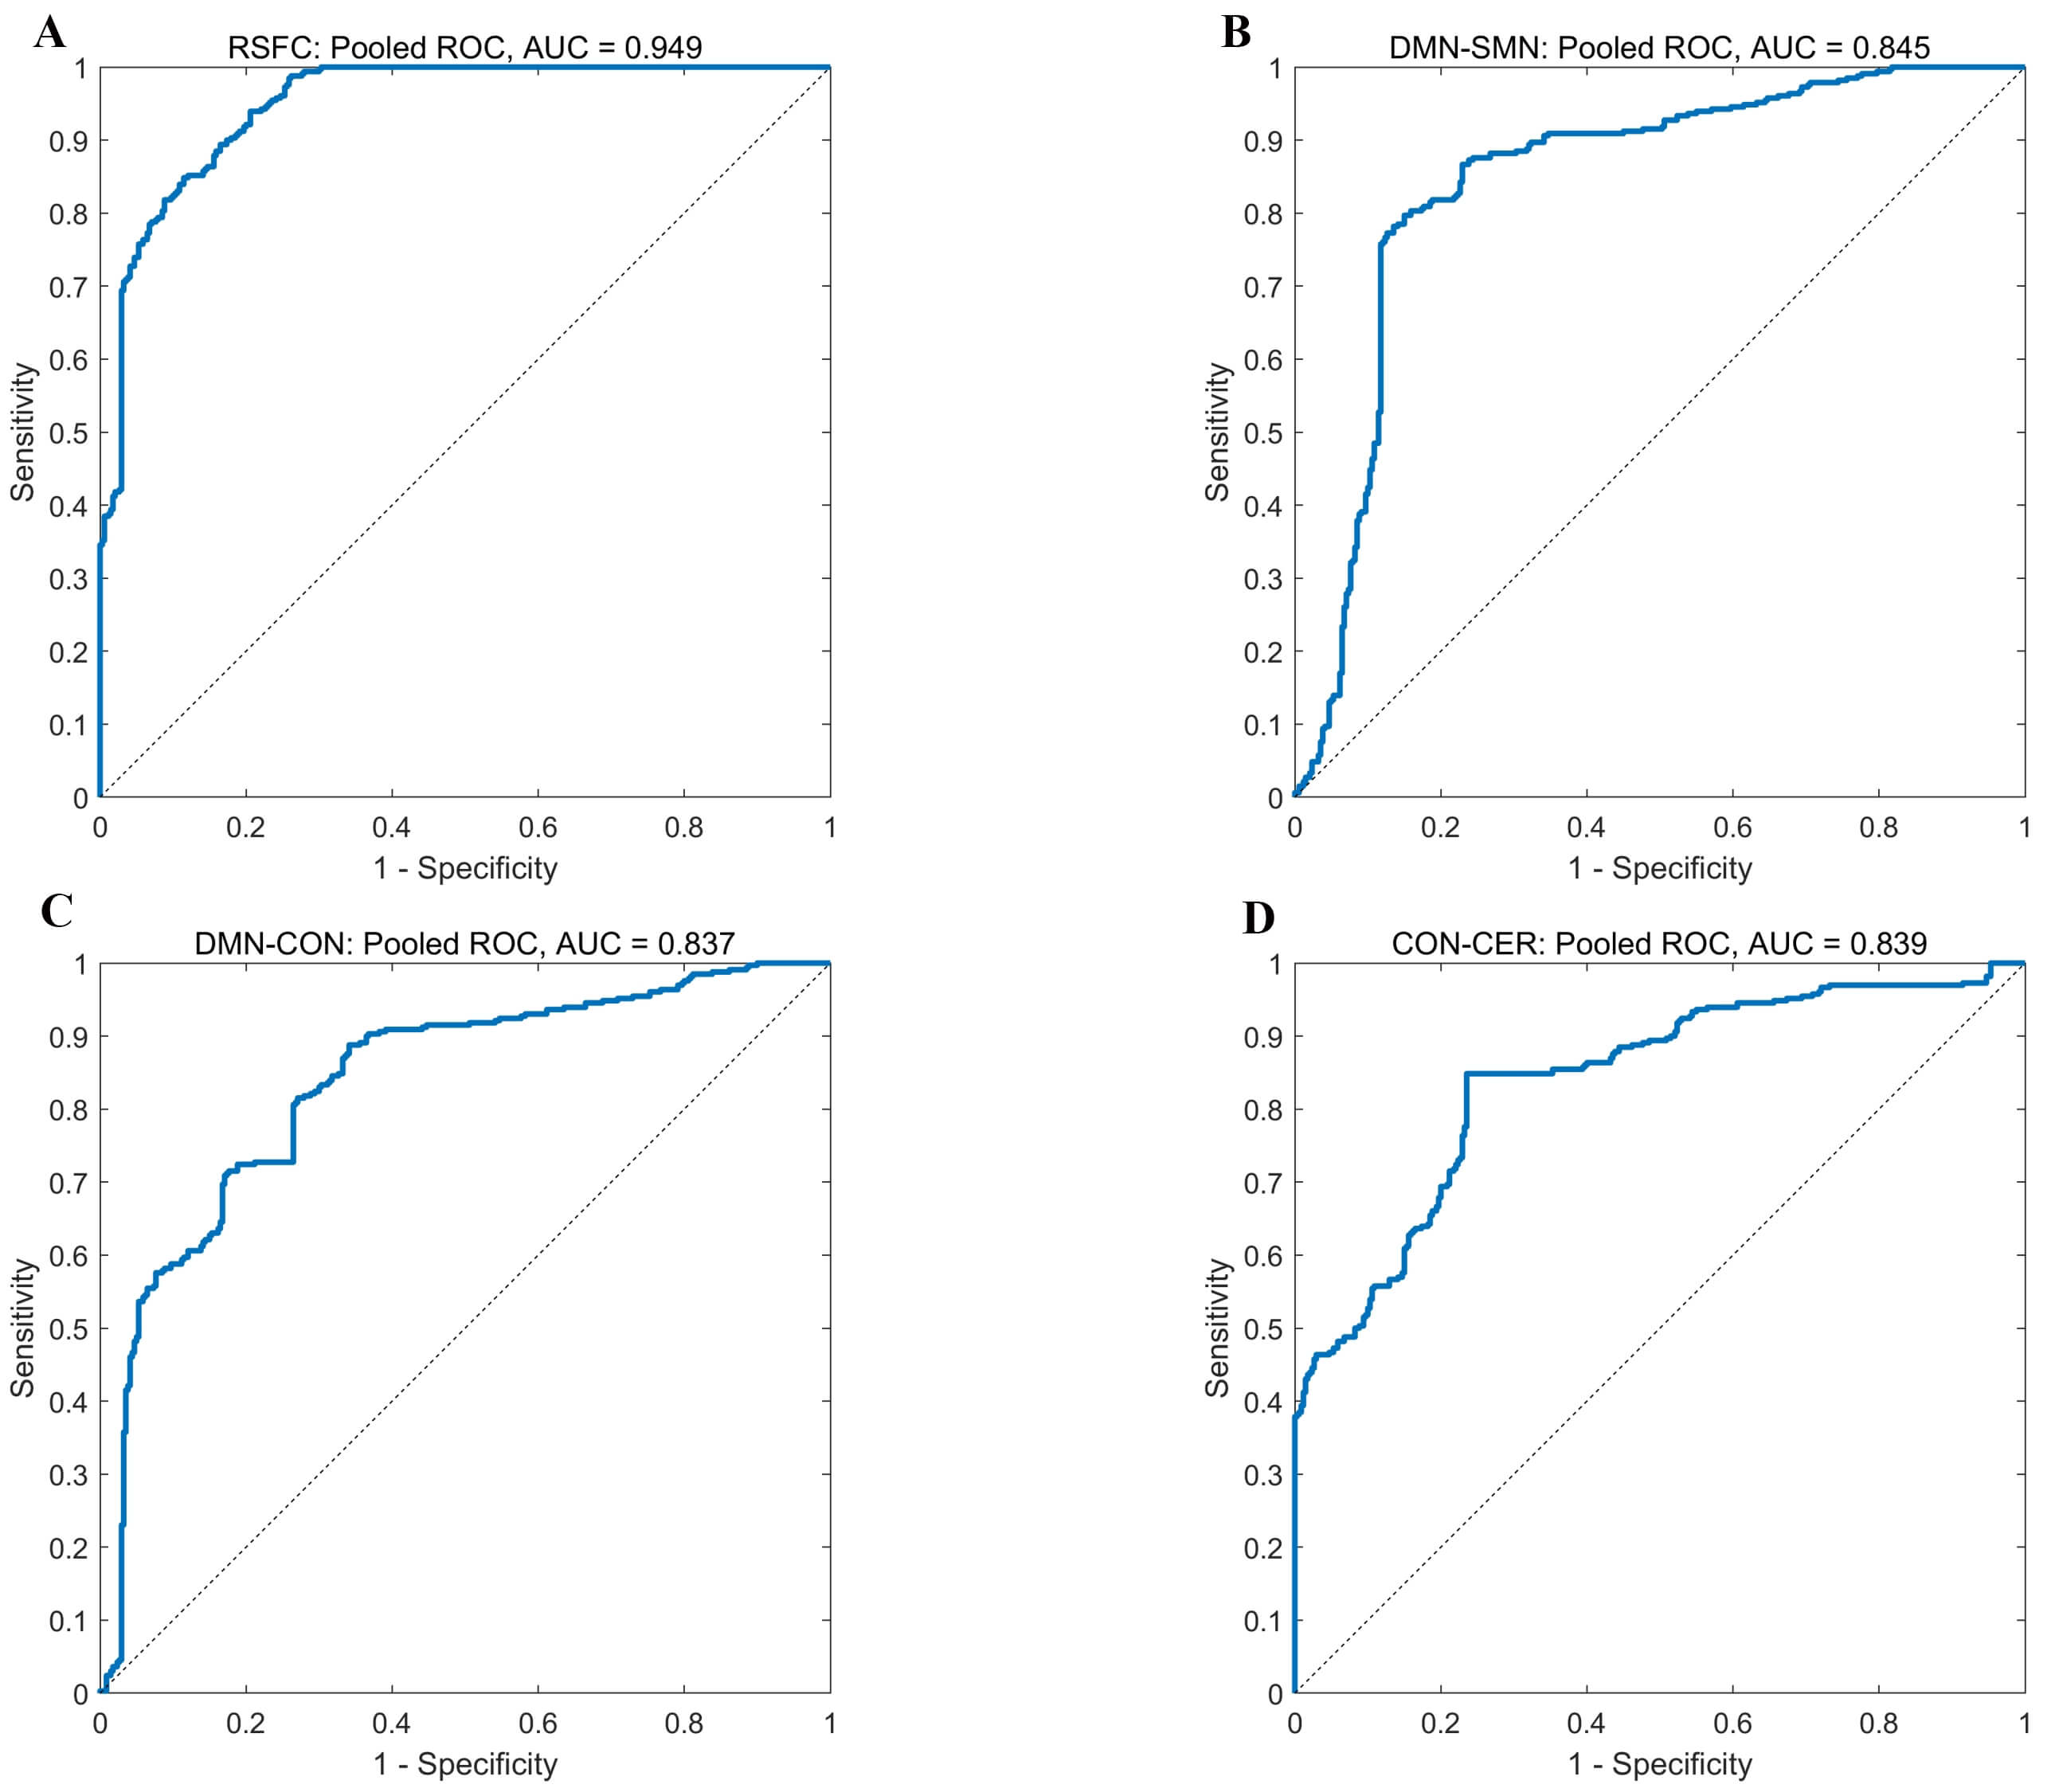 Fig. 2.
Pooled receiver operating characteristic curve (ROC) curves of
single-feature linear SVM classifiers. Pooled ROC curves were generated by
aggregating predicted probabilities from all test folds across stratified 10-fold
cross-validation repeated 10 times. The pooled area under the curve (AUC) values were
0.949 for global RSFC (A), 0.845 for DMN–SMN (B), 0.837 for DMN–CON (C), and 0.839 for
CON–CER (D). The diagonal dashed line represents the no-discrimination
reference (AUC = 0.5). Note: The AUC values shown here are pooled AUCs calculated
from all aggregated test-fold predictions, whereas the performance reported in
the main text (mean
| Feature | AUC | ACC | SEN | SPE | BA | MCC |
| RSFC | 0.966 |
0.865 |
0.846 |
0.883 |
0.865 |
0.747 |
| DMN-SMN | 0.864 |
0.808 |
0.818 |
0.802 |
0.810 |
0.645 |
| DMN-CON | 0.838 |
0.740 |
0.743 |
0.739 |
0.741 |
0.506 |
| CON-CER | 0.821 |
0.805 |
0.849 |
0.763 |
0.806 |
0.633 |
Abbreviation: AUC, Area Under the Receiver Operating Characteristic Curve; ACC, Accuracy; SEN, Sensitivity (true positive rate); SPE, Specificity (true negative rate); BA, Balanced Accuracy; MCC, Matthews Correlation Coefficient.
All performance metrics are reported as mean
All metrics showed significant classification performance, with permutation
p-values
WMHs individuals experience a significant decline in cognitive function (Fig. 3A). To investigate the relationship between RSFC and cognitive performance, we conducted partial correlation analysis, controlling for sex and age as covariates. Results showed that, overall, mean RSFC strength across individuals was significantly positively correlated with MoCA scores (Fig. 3B, r = 0.311, p = 0.012, p-FDR = 0.016, Cohen’s d = 0.65), representing a medium effect size according to Cohen’s conventional benchmarks (r = 0.1 small; 0.3 medium; 0.5 large) [40]. MoCA scores were significantly positively correlated with FC between CON and CER (Fig. 3C, r = 0.382, p = 0.002, p-FDR = 0.008, Cohen’s d = 0.83). Similarly, DMN-CON connectivity was significantly positively correlated with MoCA scores (Fig. 3D, r = 0.317, p = 0.010, p-FDR = 0.016, Cohen’s d = 0.67); both showed medium effect sizes. Despite the high prevalence of DMN-SMN disruption in individuals with WMHs, its positive correlation with MoCA scores was not statistically significant (Fig. 3E, r = 0.149, p = 0.237, p-FDR = 0.237, Cohen’s d = 0.30). This finding supports the idea that cognitive decline in WMHs is associated with both global and specific inter-modular functional disruptions, highlighting the importance of whole-brain network integrity in cognitive health.
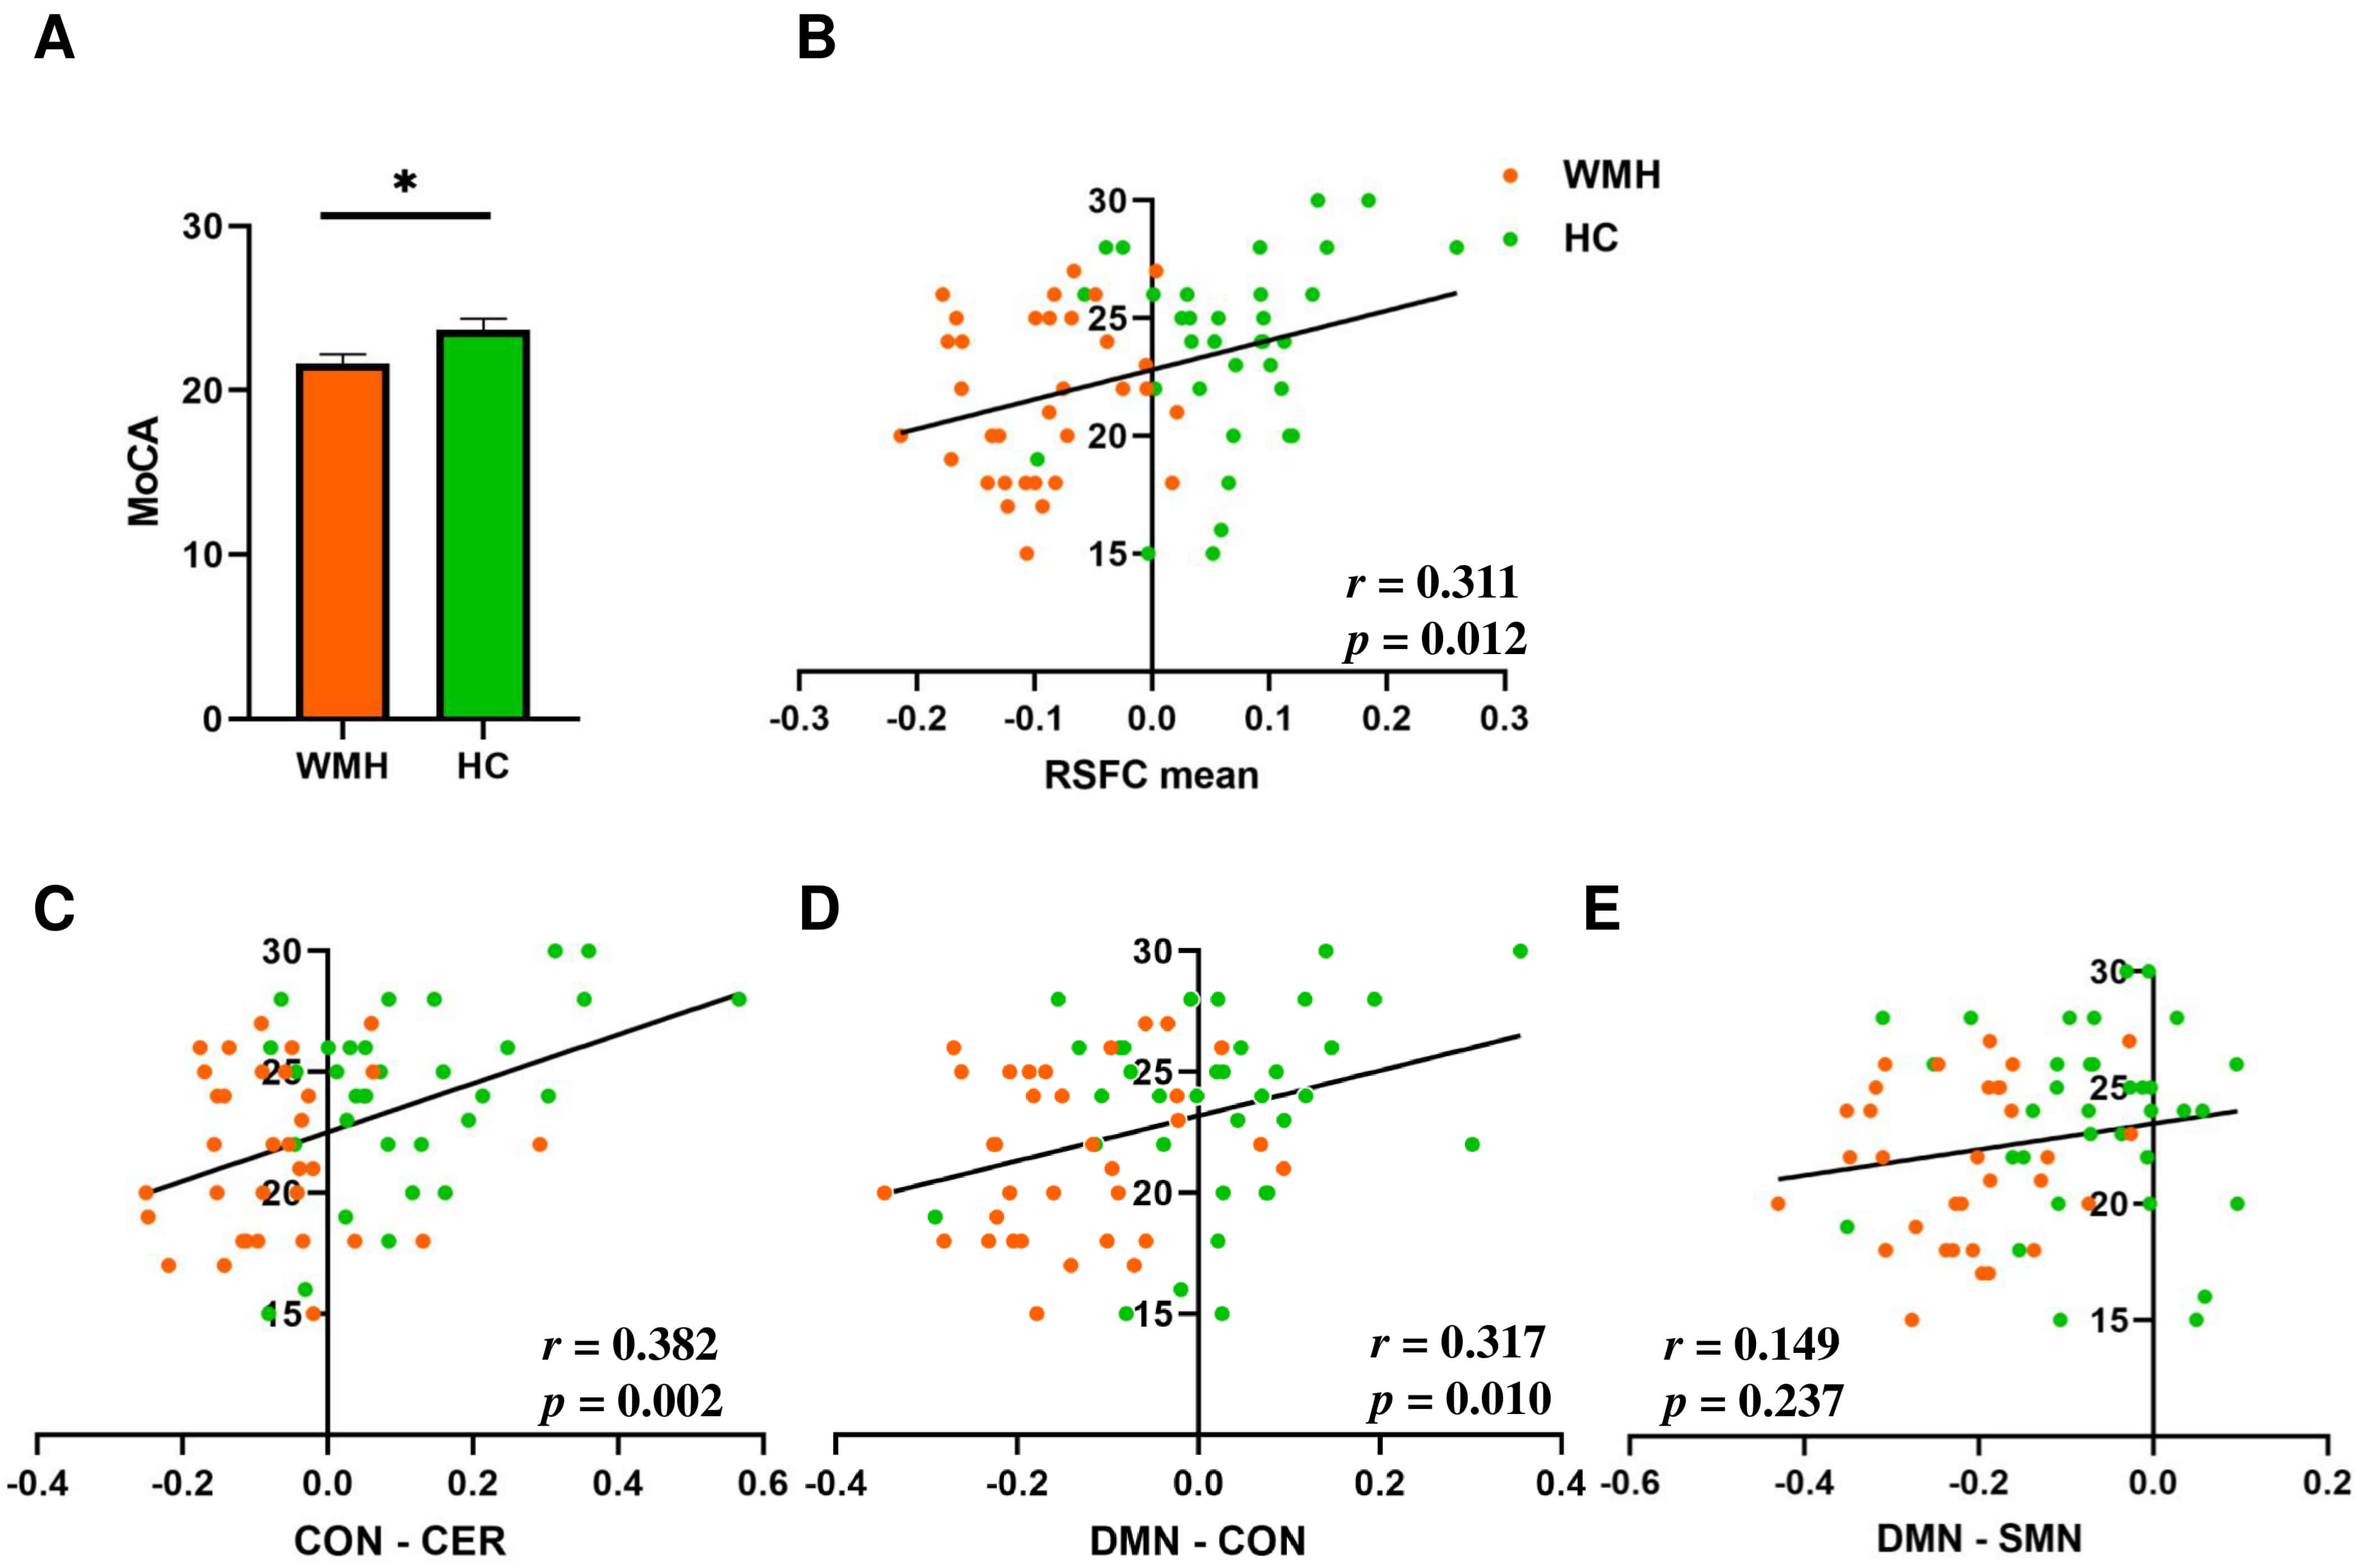 Fig. 3.
Correlation analysis of cognitive performance and RSFC in WMHs
and HC. (A) Group comparison of Montreal Cognitive Assessment (MoCA) scores
between WMHs and HC, assessed using independent-sample t-tests, revealed
significant differences (p = 0.025, t = –2.296). *, indicates
p
The present study used the NBS method to systematically analyze the differences in RSFC between individuals with WMHs and healthy controls, and explored the potential associations of these differences with cognitive decline. NBS results showed that WMHs patients had significant connectivity disruption in the whole-brain functional network, especially in cross-module connectivity. Furthermore, SVM models demonstrated that these functional-connectivity changes exhibited high classification performance in distinguishing individuals with WMHs from healthy controls. The significant correlations between these connectivity strengths and cognitive function (MoCA scores) suggested the potential for RSFC to serve as a biomarker for WMHs-related cognitive decline.
WMHs essentially reflect the degeneration of white matter microstructures, which can affect cognition [50]. Previous longitudinal diffusion tensor imaging studies have shown that low fractional anisotropy and high mean diffusivity are significantly associated with a decline in cognitive domains [51]. This disruption of microstructures may manifest as abnormalities in the RSFC at the functional level [47]. In that context, NBS provides a powerful methodological tool for detecting functional network alterations related to WMHs. Compared with the traditional method, NBS significantly improved statistical power by using the topological relationship between connections. By controlling for the issue of multiple comparisons, it effectively identified overall network changes in low signal-to-noise ratio data and better captured abnormal sub-networks with connectivity. The statistical results aligned more closely with the organizational structure of the complex brain network [27, 31]. In recent years, NBS has been successfully applied to the study of autism, aphasia, hepatic encephalopathy, and other diseases, providing a crucial tool for uncovering abnormal brain networks under pathological conditions [52, 53].
The intergroup-analysis results of this study were consistent with previous results on abnormal functional connectivity of WMHs individuals, and also revealed some new findings [54]. From the perspective of modular functional networks, the present study found that the DMN, CON, CER, and SMN were the regions most significantly affected by WMHs, with a significant decrease in RSFC intensity (Fig. 1). The DMN is primarily involved in the brain’s resting state, including internal thoughts, cognitive memory, and emotional processing [55, 56]. The current study showed that WMHs load was negatively correlated with RSFC of the DMN module, which is consistent with our findings [57]. The CON is one of the central networks involved in attention and executive function [58, 59, 60], in the resting state of individual WMHs, the overall efficiency was reduced at the level of certain nodes within the CON module [61]. The CER is not only involved in motor coordination, but is also closely related to higher cognitive functions [62]; the functional network strength has been found to be reduced in individuals with WMHs [63]. The SMN plays an important role in perception and motor execution [64]; disruption of sensorimotor and ventral attention networks due to WMHs may underlie global cognitive deficits in older adults with CSVD [65]. Furthermore, mounting evidence has suggested that changes in the FC in CSVD are not entirely independent of structural degeneration; patients often experience concurrent gray-matter atrophy in areas of impaired connectivity [66].
The functional connectivity between the CON and CER networks was significantly reduced in individuals with WMHs. This was consistent with previous reports [63]. CON-CER coupling plays a key role in higher-order cognitive regulation, especially in adaptive control and task restructuring [67]. This pathway plays an important role in cognitive monitoring, error detection, and adaptive regulation, and its disruption can affect the efficiency of behavioral adjustment, manifested as weakened executive control, decreased efficiency of response inhibition, and reduced task adaptation. These characteristics have been confirmed in WMHs patients with executive dysfunction and cognitive slowing [68, 69]. CON-CER disconnection may be responsible for inefficient error monitoring and reduced readiness to adjust cognitive strategies, with important negative consequences for cognitive abilities in WMHs.
Inter-module connectivity between the DMN and the CON showed significant decreases in individuals with WMHs and was associated with cognitive impairment. The effects of connectivity impairment between the DMN and CON on cognitive function have been widely reported in various psychiatric disorders [70, 71]. The integrity of DMN-CON function is crucial for executive control, attentional regulation, and task-set updating; its disconnection may impair task switching ability and executive speed, manifesting as difficulty in attentional allocation and decreased cognitive flexibility. For example, decreased DMN-CON connectivity in patients with late-onset depression significantly affects cognitive function, particularly in executive speed and working memory [72]. A similar mechanism is possible in WMHs and is an important cause of the symptoms of cognitive impairment.
In this study, the correlation between DMN-SMN connectivity and MoCA scores did not reach statistical significance. Several factors may account for this finding. First, NBS is designed to detect aberrant functional connectivity clusters that exhibit spatial coherence [27, 28, 29], and its computation does not incorporate cognitive or other behavioral measures. Therefore, the connection changes identified by NBS are not necessarily significantly correlated with cognitive performance. Second, from a functional standpoint, the DMN-SMN axis plays a key role in integrating intrinsic cognitive processes with sensorimotor information. previous studies have shown that DMN-SMN dynamic connectivity was significantly lower in patients with more severe WMHs burden and cognitive impairment than in those with milder symptoms [73, 74]. Disruption along this pathway may therefore exert a greater influence on sensorimotor integration and related functions that are not adequately captured by the MoCA. Finally, previous studies indicate that reductions in DMN-SMN dynamic connectivity become markedly more pronounced in individuals with heavier WMHs burden and more advanced cognitive impairment [75]. This suggests that the cognitive relevance of this pathway may emerge more clearly in later or more severe stages of network dysfunction. Taken together, although DMN-SMN involvement in WMHs-related network alterations is biologically plausible, the factors noted above may collectively explain the relatively weak behavioral correlations observed in our current sample.
Accumulating evidence has suggested that RSFC abnormalities precede overt structural lesions, and are highly sensitive in the early stages of cerebrovascular and neurodegenerative diseases [76]. Systematic reviews of small vessel disease have pointed out the higher sensitivity of rs-fMRI indices than traditional structural markers [22, 47, 77]. This has also been found in studies of Alzheimer’s disease [76, 78]. From previous studies, RSFC has been widely regarded as a potential biomarker for neuropsychiatric diseases [79, 80, 81]. The results of this study accord with previous work and extend the application of RSFC to the context of WMHs. Specifically, this study used the NBS method and ROC curve analysis to preserve the intrinsic relationships between functional connections while conducting cluster correction [27, 31]; RSFC signatures achieved meaningful AUC at both the whole-brain and module levels, confirming their diagnostic utility. It is important to note that this functional-based marker complements traditional FLAIR sequences as it has the potential to detect WMHs-related pathology before overt structural changes are apparent, and enables pinpointing of the most vulnerable networks at an early stage.
Although the present study advanced our understanding of the relationship between abnormal functional connectivity patterns and cognitive function in individuals with WMHs, there were several limitations. First, the relatively small sample size may have limited the generalizability of the findings. Future research should expand the sample size, include participants with varying levels of WMHs severity, incorporate a broader battery of cognitive assessments, and stratify analyses by impairment severity, so as to validate and extend the present findings and further elucidate the specific cognitive impacts of WMHs. Additionally, future research should incorporate additional parcellation atlases, such as the Power and Schaefer atlases, to verify and extend the WMHs-related network alterations identified in the present study. Then, the cross-sectional design of this study only captured the relationship between abnormal functional connectivity and cognitive function at a single point in time. Longitudinal studies are required to investigate the long-term impact of changes in functional connectivity on cognitive function. Finally, future studies should explore global topological properties of WMHs individuals (e.g., small-world characteristics) to better delineate WMHs-related network alterations. In summary, despite the limitations of this study, its results offered valuable insights into the relationship between individual functional connectivity in WMHs and cognitive decline. Overcoming these limitations in future studies will enable a deeper understanding of WMHs pathology.
This study systematically examined alterations in RSFC in individuals with WMHs and its relationship with cognitive function. The results demonstrated significant alterations in whole-brain functional connectivity in individuals with WMHs. ROC-curve analysis further verified and demonstrated that functional connectivity can be a useful supplement to traditional structural imaging diagnosis, and evaluated its potential as a sensitive subclinical indicator that helps to locate vulnerable networks. Moreover, abnormalities in these functional connections were strongly correlated with cognitive impairment in individuals with WMHs, providing neural evidence for CSVD-related cognitive deficits. This study supplemented the existing information on the changes in functional connectivity in individuals with WMHs, and demonstrated the utility of whole-brain and modular RSFC in classifying WMHs. This research provided evidence for the value of continued development of non-invasive diagnostic tools and personalized intervention strategies, and supports the continued development of accurate diagnosis and personalized treatment strategies for individuals with WMHs, thereby improving the quality of life.
Anonymized data and analysis codes are available upon reasonable request from any qualified investigator.
KC: Investigation, Methodology, Software. Writing – original draft. RQ: Methodology, Validation, Writing – original draft. XW: Data curation, Investigation, Validation. WW: Investigation, Software. HL: Formal analysis, Investigation. LX: Data curation, Validation. LN: Data curation, Investigation, Resources. DZ: Investigation, Methodology, Formal analysis, Software. JZ: Conceptualization, Project administration, Funding acquisition. Writing – review & editing. LW: Conceptualization, Supervision, Funding acquisition. Writing – review & editing. All authors contributed to editorial changes in the manuscript. All authors read and approved the final manuscript. All authors have participated sufficiently in the work and agreed to be accountable for all aspects of the work.
All participants provided written informed consent prior to inclusion in the study. This study was conducted in accordance with the principles of the Declaration of Helsinki. The study protocol was reviewed and approved by the Ethics Committee of the Second Affiliated Hospital of Anhui Medical University (approval number: 2021065).
We thank all participants who took part in the study.
This work was supported by the Clinical and Translational Research Project of Anhui Province (202427b10020083) and National Natural Science Foundation of China (82101538).
The authors declare no conflict of interest.
Supplementary material associated with this article can be found, in the online version, at https://doi.org/10.31083/JIN46727.
References
Publisher’s Note: IMR Press stays neutral with regard to jurisdictional claims in published maps and institutional affiliations.