


 , Guoyang Li 1,2, Fengju Mao 1,2, Hong Zhao 3, Long Zhao 3, Lei Liang 3, Yutong Guo 4, Chang Sun 5, Yang Yang 6, Xiangcheng Wang 3,*
 , Xiaoguang Luo 1,2,*
1 Department of Neurology, Shenzhen People’s Hospital (The Second Clinical Medical College, Jinan University; The First Affiliated Hospital, Southern University of Science and Technology), 518020 Shenzhen, Guangdong, China
2 Shenzhen Clinical Research Centre for Geriatrics, Shenzhen People’s Hospital, 518020 Shenzhen, Guangdong, China
3 Department of Nuclear Medicine, Shenzhen People’s Hospital (The Second Clinical Medical College, Jinan University; The First Affiliated Hospital, Southern University of Science and Technology), 518020 Shenzhen, Guangdong, China
4 Shenzhen United Imaging Healthcare Co. Ltd., 518048 Shenzhen, Guangdong, China
5 United Imaging Healthcare Group Co. Ltd., 201807 Shanghai, China
6 Beijing United Imaging Healthcare Co. Ltd., 100094 Beijing, China
Abstract
The stage-specific dynamics of functional brain networks in early Parkinson’s disease cognitive impairment (PD-CI) remain unclear. This study investigated caudate-centric hierarchical functional network reconfiguration across early PD-CI stages using simultaneous [18F]fluoropropyl-(+)-dihydrotetrabenazine positron emission tomography (18F-FP-DTBZ PET) and resting-state functional magnetic resonance imaging (rs-fMRI).
Forty-six Parkinson’s disease (PD) patients underwent simultaneous 18F-FP-DTBZ PET/MR with rs-fMRI sequences. Patients were categorized as normal cognition (PD-NC, n = 15), subjective cognitive decline (PD-SCD, n = 16), and mild cognitive impairment (PD-MCI, n = 15). PET-identified striatal regions with significant dopaminergic deficits were used as seeds for stepwise functional connectivity (SFC) analysis. Associations with cognitive factors and network coupling in early PD-CI were evaluated.
18F-FP-DTBZ PET revealed that the caudate nucleus was a critical dopaminergic hub in early PD-CI. Caudate seed-based SFC analysis revealed a triphasic reconfiguration: stable integration in PD-NC, compensatory hyperconnectivity in PD-SCD, and global inefficiency with rigidity in PD-MCI. Key circuits showed reduced connectivity in PD-MCI including caudate linkages with the globus pallidus, thalamus, right superior frontal gyrus, left inferior temporal gyrus, right superior orbitofrontal cortex, supplementary motor area, and right hippocampus. Clinical analysis showed that both global cognitive efficiency and memory control were associated with specific short- and long-range caudate connectivity.
The caudate nucleus is central to the interplay between dopaminergic metabolic deficits and functional network reconfiguration during early PD-CI progression, shifting from compensatory hyperconnectivity to network rigidity. These findings provide a mechanistic framework for targeted neuromodulation strategies in early PD-CI.
Keywords
- cognitive dysfunction
- dopamine
- functional neuroimaging
- Parkinson’s disease
- positron-emission tomography
Parkinson’s disease (PD) is the world’s second most prevalent neurodegenerative illness, presenting as a multisystem syndrome with progressive motor deterioration and heterogeneous non-motor symptoms [1, 2]. Cognitive impairment in PD (PD-CI) is a notably detrimental characteristic that affects more than 80% of patients [3, 4]. The progression of PD-CI encompasses three clinically acknowledged stages: subjective cognitive decline (PD-SCD), defined by self-reported deficits without objective impairment [5]; mild cognitive impairment (PD-MCI), distinguished by objective cognitive decline with preserved daily functioning [6]; and ultimately, dementia (PDD). PDD presents a considerable socioeconomic burden, driven by increased functional disability, carer burden, and healthcare costs [3, 4].
Given the typically irreversible nature of PDD, early intervention during the PD-SCD and PD-MCI stages is essential. Notably, PD-SCD affects 36% of PD patients and correlates with a threefold increased risk of PDD onset within three years, relative to cognitively normal PD patients (PD-NC) [5]. This gradual progression highlights the necessity to examine the fundamental neurodegenerative mechanisms across the continuum of early PD-CI stages, rather than focusing solely on discrete clinical categories.
Mounting evidence has suggested that striatal dopaminergic degeneration plays a pivotal role in driving network-level dysfunction in PD-CI [7, 8]. Recent breakthroughs in multimodal neuroimaging have facilitated the unparalleled merging of dopaminergic molecular imaging with functional network analysis. The quantification of vesicular monoamine transporter type 2 (VMAT2) availability with [18F]fluoropropyl-(+)-dihydrotetrabenazine positron emission tomography (18F-FP-DTBZ PET) enables precise mapping of striatal dopaminergic terminals [9]. Simultaneously, resting-state functional MRI (rs-fMRI) reveals dynamic functional connectivity patterns via blood-oxygen-level-dependent (BOLD) signals. Although previous rs-fMRI investigations identified altered connectivity between the default mode and the frontoparietal networks in PD-MCI [10, 11], traditional functional connectivity analyses are limited by their inability to distinguish direct and indirect connections.
To address these limitations, we conducted a multimodal neuroimaging study that integrated 18F-FP-DTBZ PET and rs-fMRI across the early PD-CI continuum, using the novel stepwise functional connectivity (SFC) analytical approach. SFC overcomes the constraints of conventional functional connectivity methods by reconstructing hierarchical connectivity architectures from disease epicenters. This method has been effectively used in the study of Parkinsonian motor subtypes [12] and frontotemporal dementia [13], but it remains unexplored in the context of PD-CI staging.
In this study, we identified striatal subregions that exhibited the most severe dopaminergic deficits across the early stages of PD-CI by VMAT2 topographic profiling. These regions were subsequently used as seed points for SFC analysis to map hierarchical functional network disconnections along the early PD-CI continuum, spanning PD-NC to PD-SCD and PD-MCI. Finally, we examined the cognitive factors associated with these network alterations. By integrating molecular imaging with advanced connectivity analytics, our study attempted to delineate the neural network mechanisms underlying early PD-CI progression and identify potential neuroimaging biomarkers for early therapeutic intervention.
From June 2024 to May 2025, 46 PD patients were recruited from Shenzhen People’s Hospital to participate in this cross-sectional study. Inclusion required: (1) probable PD diagnosis based on the 2015 Movement Disorder Society (MDS) criteria [14], and (2) reduced striatal 18F-FP-DTBZ uptake. Exclusions were major systemic diseases, cognitive assessment incompatibility, cerebrovascular/atrophic changes, magnetic resonance (MR) contraindications, and claustrophobia. Clinical assessments, 18F-FP-DTBZ PET, and rs-fMRI were performed on all individuals. Neurologists who were blind to the participants’ condition collected demographics, levodopa equivalent daily dose (LEDD) data, disease duration, and OFF-state Unified Parkinson’s Disease Rating Scale Part III (UPDRS-III) scores [15].
Cognitive examinations were done in the ON-state to minimize motor symptom
interference. SCD was defined as an SCD-Scale-9 score
Diagnostic classifications followed established criteria: PD-MCI: impairment on
All imaging was performed on a 3.0 T PET/MR scanner (uPMR 790, United Imaging,
Shanghai, China) with a 24-channel head coil. To minimize acute medication
effects, all participants were required to discontinue their anti-Parkinson’s
medications for at least 12 h before undergoing the 18F-FP-DTBZ PET scan.
All participants underwent simultaneous PET and MRI scanning. PET scanning
commenced 90 min post-intravenous 18F-FP-DTBZ injection, with participants
positioned supine and instructed to remain still throughout the scan [17]. Images
were reconstructed using ordered subset expectation maximization (OSEM) with
time-of-flight (TOF), and Dixon-based MR attenuation correction (acquisition: 10
min; matrix: 192
PET images were preprocessed with the Statistical Parametric Mapping 12 (SPM12) toolbox implemented in MATLAB R2023b (Wellcome Trust Centre for Neuroimaging, London, UK; https://www.fil.ion.ucl.ac.uk/spm) [17]. Initially, for each subject, the PET image was rigidly coregistered to the corresponding T1-weighted anatomical MRI using normalized mutual information. Subsequently, tissue segmentation of the T1-weighted image was performed to generate probabilistic maps of gray matter, white matter, and cerebrospinal fluid, which were also utilized for partial volume effect (PVE) correction. The coregistered PET images were then normalized to the Montreal Neurological Institute (MNI) standard space with isotropic voxels of 2 mm using the forward deformation fields derived from tissue segmentation. Finally, the normalized PET images were smoothed using an isotropic Gaussian kernel with an 8 mm FWHM. Preprocessed PET images were coregistered to the Automated Anatomical Labeling (AAL 116) template for region-based analysis. 18F-FP-DTBZ binding ratios were calculated using the following formula, based on standardized uptake value (SUV):
Striatal subregions included the caudate nucleus and putamen. The occipital reference region comprised all occipital lobe areas in the AAL 116 atlas, including the calcarine, cuneus, lingual gyrus, superior occipital gyrus, middle occipital gyrus, and inferior occipital gyrus. Regions exhibiting significant group differences in 18F-FP-DTBZ binding were defined as regions of interest (ROIs).
Rs-fMRI images were preprocessed with the Data Processing & Analysis for Brain Imaging toolbox (DPABI V8.2, http://www.rfmri.org/dpabi). The first 10 time points were discarded to allow for signal equilibration and participant habituation. Slice timing correction was applied, followed by realignment for head motion correction. Nuisance covariates, including 24 head motion parameters, white matter, cerebrospinal fluid, and global mean signals, were regressed out of the time series. The normalized functional images were then spatially smoothed with a 4-mm FWHM Gaussian kernel. Finally, a temporal band-pass filter (0.01–0.1 Hz) was applied to the time series to retain low-frequency fluctuations relevant for resting-state connectivity analysis. Participant data with excessive head motion (more than 30% of frames with framewise displacement exceeding 0.3 mm) were excluded from further analyses.
SFC quantifies direct and indirect (multi-step) brain area functional
interactions using fMRI-derived functional connectivity matrices [12, 13]. After
fMRI data preprocessing, a whole-brain functional connectivity matrix was
constructed for each participant by calculating the Pearson correlation
coefficients between the BOLD time series of all brain region pairs. Only
positive connections that were statistically significant (false discovery rate
(FDR)-corrected with q
In line with previous studies [20], the stable step was calculated for each
participant to quantify the convergence rate of SFC patterns. The stable step was
defined as the minimum step k at which the Pearson correlation coefficient
between SFC spatial maps remained
To interpret SFC patterns within the context of canonical cortical functional networks, we quantified the overlap between the SFC maps and the seven intrinsic networks defined by the Yeo-7 atlas [21]. Specifically, for each group-level SFC map at multiple-step distances, the SFC image derived from the AAL template was resampled to match the spatial resolution and orientation of the Yeo-7 network template. During this process, each AAL-based SFC image was spatially aligned to the Yeo-7 template, and nearest-neighbor interpolation was used to preserve the discrete labeling of network regions. For each step and each group, mean SFC values were computed separately within each of the seven canonical Yeo-7 network masks. To facilitate group- and step-wise comparison of hierarchical network involvement, the mean SFC values for each network and each step were visualized as heatmaps. These visualizations enabled a systematic comparison of SFC pattern evolution across cortical networks and between diagnostic groups.
Factor analysis is used to reduce the number of clinical indicators and extract
key features. The suitability of the dataset for factor analysis was first
evaluated using the Kaiser-Meyer-Olkin (KMO) measure and Bartlett’s test of
sphericity. Only datasets meeting standard thresholds (KMO
Differences among groups in demographics and neuropsychology were assessed using
one-way analysis of variance (ANOVA), Kruskal-Wallis tests, or
This study included 46 PD patients divided into three cognitive subgroups: PD-NC
(n = 15), PD-SCD (n = 16), and PD-MCI (n = 15). As shown in Table 1, the groups
exhibited comparable demographics (age, sex, education) and clinical parameters
(disease duration, levodopa dosage; all p
| Characteristics | PD-NC | PD-SCD | PD-MCI | Statistics | p-value | |
| N | 15 | 16 | 15 | |||
| Age, y | 63.9 (1.6) | 64.3 (1.7) | 68.7 (1.6) | F(2, 43) = 2.63 | 0.084 | |
| Sex, F:M | 7:8 | 9:7 | 7:8 | 0.826 | ||
| Education, y | 11.0 (6.5–13.0) | 8.0 (5.5–11.0) | 8.0 (8.0–11.0) | H(df = 2) = 2.28 | 0.320 | |
| Age at PD onset, y | 59.1 (1.4) | 59.6 (2.2) | 64.2 (1.5) | F(2, 43) = 2.53 | 0.092 | |
| PD duration, y | 5.0 (3.0–5.5) | 4.0 (2.0–5.5) | 5.0 (3.0–5.0) | H(df = 2) = 0.21 | 0.901 | |
| LEDD, mg/d | 375.0 (212.5–537.5) | 381.3 (137.5–648.5) | 400.0 (349.6–542.0) | H(df = 2) = 0.24 | 0.885 | |
| UPDRS-III | 24.9 (3.2) | 24.4 (2.5) | 35.6 (2.8) | F(2, 43) = 4.83 | 0.013 | |
| Neuropsychological assessments | ||||||
| SCD-Scale-9 | 0.0 (0.0–1.0) | 5.0 (3.5–6.0) | 6.5 (5.5–7.0) | H(df = 2) = 33.01 | ||
| Language | ||||||
| VFT | 15.0 (11.0–16.0) | 11.0 (10.0–12.5) | 7.0 (3.5–8.5) | H(df = 2) = 22.80 | ||
| BNT | 25.0 (23.0–27.0) | 22.5 (20.0–24.5) | 16.0 (12.0–19.0) | H(df = 2) = 17.06 | ||
| Memory | ||||||
| LASSI-L B1 recall | 6.0 (5.0–6.5) | 5.0 (4.0–7.0) | 2.0 (2.0–3.0) | H(df = 2) = 19.48 | ||
| LASSI-L B2 recall | 10.0 (9.0–12.0) | 8.0 (7.0–10.5) | 4.0 (3.0–5.5) | H(df = 2) = 24.00 | ||
| LASSI-L A3 recall | 5.0 (5.0–8.5) | 5.0 (4.0–6.0) | 3.0 (2.0–4.0) | H(df = 2) = 14.71 | 0.001 | |
| Attention/Working memory | ||||||
| DST | 12.0 (11.5–13.0) | 11.0 (10.0–12.0) | 9.0 (6.0–10.5) | H(df = 2) = 13.40 | 0.001 | |
| SDMT | 31.0 (28.0–36.5) | 26.5 (24.5–29.5) | 16.0 (12.0–18.0) | H(df = 2) = 30.17 | ||
| Visuospatial ability | ||||||
| JLO | 24.0 (23.0–26.5) | 20.0 (20.0–23.5) | 15.0 (10.0–19.0) | H(df = 2) = 20.82 | ||
| Executive function | ||||||
| STT | 174.0 (152.5–200.0) | 237.0 (199.0–281.5) | 400.0 (378.5–412.0) | H(df = 2) = 28.09 | ||
| SCWT | 20.0 (12.0–27.0) | 30.0 (21.0–35.0) | 34.0 (27.5–42.5) | H(df = 2) = 13.54 | 0.001 | |
| Mood assessments | ||||||
| HAMD | 8.0 (5.0–11.0) | 11.0 (6.0–13.0) | 10.0 (6.0–14.0) | H(df = 2) = 2.94 | 0.230 | |
| HAMA | 7.0 (4.0–8.0) | 12.0 (9.0–13.0) | 12.0 (6.0–12.0) | H(df = 2) = 4.96 | 0.084 | |
Values are presented as mean (standard error) or median (interquartile range,
IQR). The H statistic is for the Kruskal-Wallis test, the F statistic for one-way
analysis of variance, and the
Neuropsychological assessments revealed significant cognitive differences in all
five domains (PD-MCI vs. PD-SCD/PD-NC; all p
Quantitative analysis of the 18F-FP-DTBZ specific uptake ratio in the dorsal striatum revealed significant differences in caudate nucleus VMAT2 availability across cognitive subgroups of PD (Table 2). PD-MCI patients had significantly lower caudate nucleus VMAT2 activity than PD-NC and PD-SCD cohorts (left caudate: ANCOVA FDR p = 0.0320; right caudate: ANCOVA FDR p = 0.0357, Supplementary Fig. 2). We also observed increased VMAT2 activity in the bilateral caudate nucleus in patients with PD-SCD. In contrast, putamen showed no significant intergroup variations. These findings supported the selection of the caudate nucleus as the seed region for SFC analyses. The left and right caudate masks were merged to form a single bilateral composite seed for all SFC analyses.
| Region | PD-NC | PD-SCD | PD-MCI | p-value | p-FDR |
| Caudate_L | 0.73 (0.24) | 1.18 (0.22) | 0.29 (0.24) | 0.016 | 0.032 |
| Caudate_R | 0.64 (0.25) | 0.99 (0.24) | 0.21 (0.19) | 0.036 | 0.036 |
| Putamen_L | 0.97 (0.27) | 1.10 (0.12) | 1.26 (0.4) | 0.776 | 0.776 |
| Putamen_R | 0.74 (0.15) | 0.94 (0.12) | 1.17 (0.38) | 0.483 | 0.776 |
Values are presented as mean (standard error). Intergroup comparisons were performed using analysis of covariance, adjusted for age, sex, and years of education. FDR correction for multiple comparisons. FDR, false discovery rate; L, left; R, right.
SFC analysis revealed progressive alterations in caudate-centered network across the PD cognitive subgroups (Fig. 1). In PD-NC, the caudate nucleus maintained stable moderate-strength connections with the prefrontal (orbitofrontal cortex, OFC; inferior frontal gyrus, IFG), motor (supplementary motor area, SMA), subcortical (lentiform nucleus), and limbic regions. As connection steps increased, connectivity with temporal lobe decreased, whereas the thalamic connectivity strengthened at longer path distances, indicating preserved network adaptability. In PD-SCD, direct connectivity between the caudate and OFC was lower than in PD-NC. Nevertheless, widespread hyperconnectivity with limbic and frontal regions emerged, reflecting early compensatory reorganization of brain networks. In contrast, PD-MCI exhibited globally attenuated connectivity, with notable disconnection between the caudate and SMA, as well as disrupted distance-dependent network organization. Collectively, this delineated a triphasic trajectory of network dysfunction in early PD-CI: stable connectivity in PD-NC developed into hyperconnected reorganization in PD-SCD, then progressed to broad-scale network inefficiency in PD-MCI.
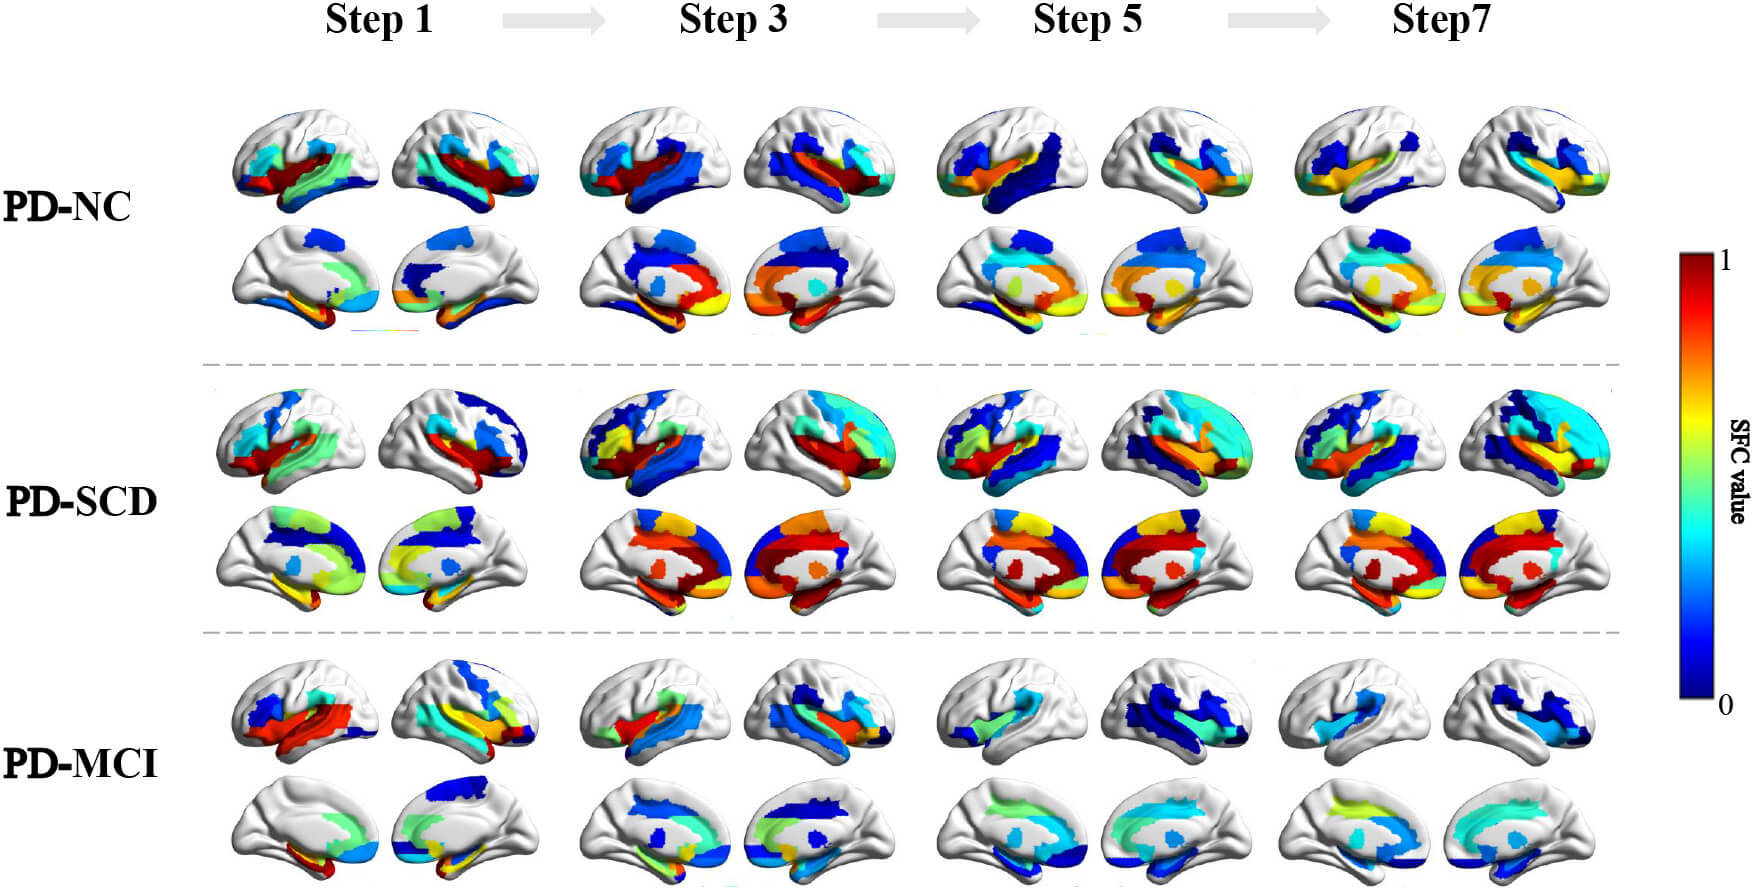 Fig. 1.
SFC strength for odd-step distances in PD-NC, PD-SCD, and PD-MCI groups. Color bar: Represents SFC value, ranging from 0 to 1. The color scale transitions from blue to red, encode the increasing magnitude of SFC value. SFC, stepwise functional connectivity.
To further contextualize caudate-centered network dynamics in early cognitive progression of PD, we mapped the stepwise functional connectivity of the caudate nucleus onto the Yeo-7 networks (Fig. 2). PD-NC showed moderate caudate overlap with several functional networks, including the frontoparietal, somatomotor, salience, limbic, and default mode networks—with spatial overlap ranging from 11% to 39%. PD-SCD exhibited marked hyperintegration (up to 59%), particularly in the salience, frontoparietal, and somatomotor networks. In contrast, PD-MCI showed reduced and scattered integration (2%–30%) across all networks.
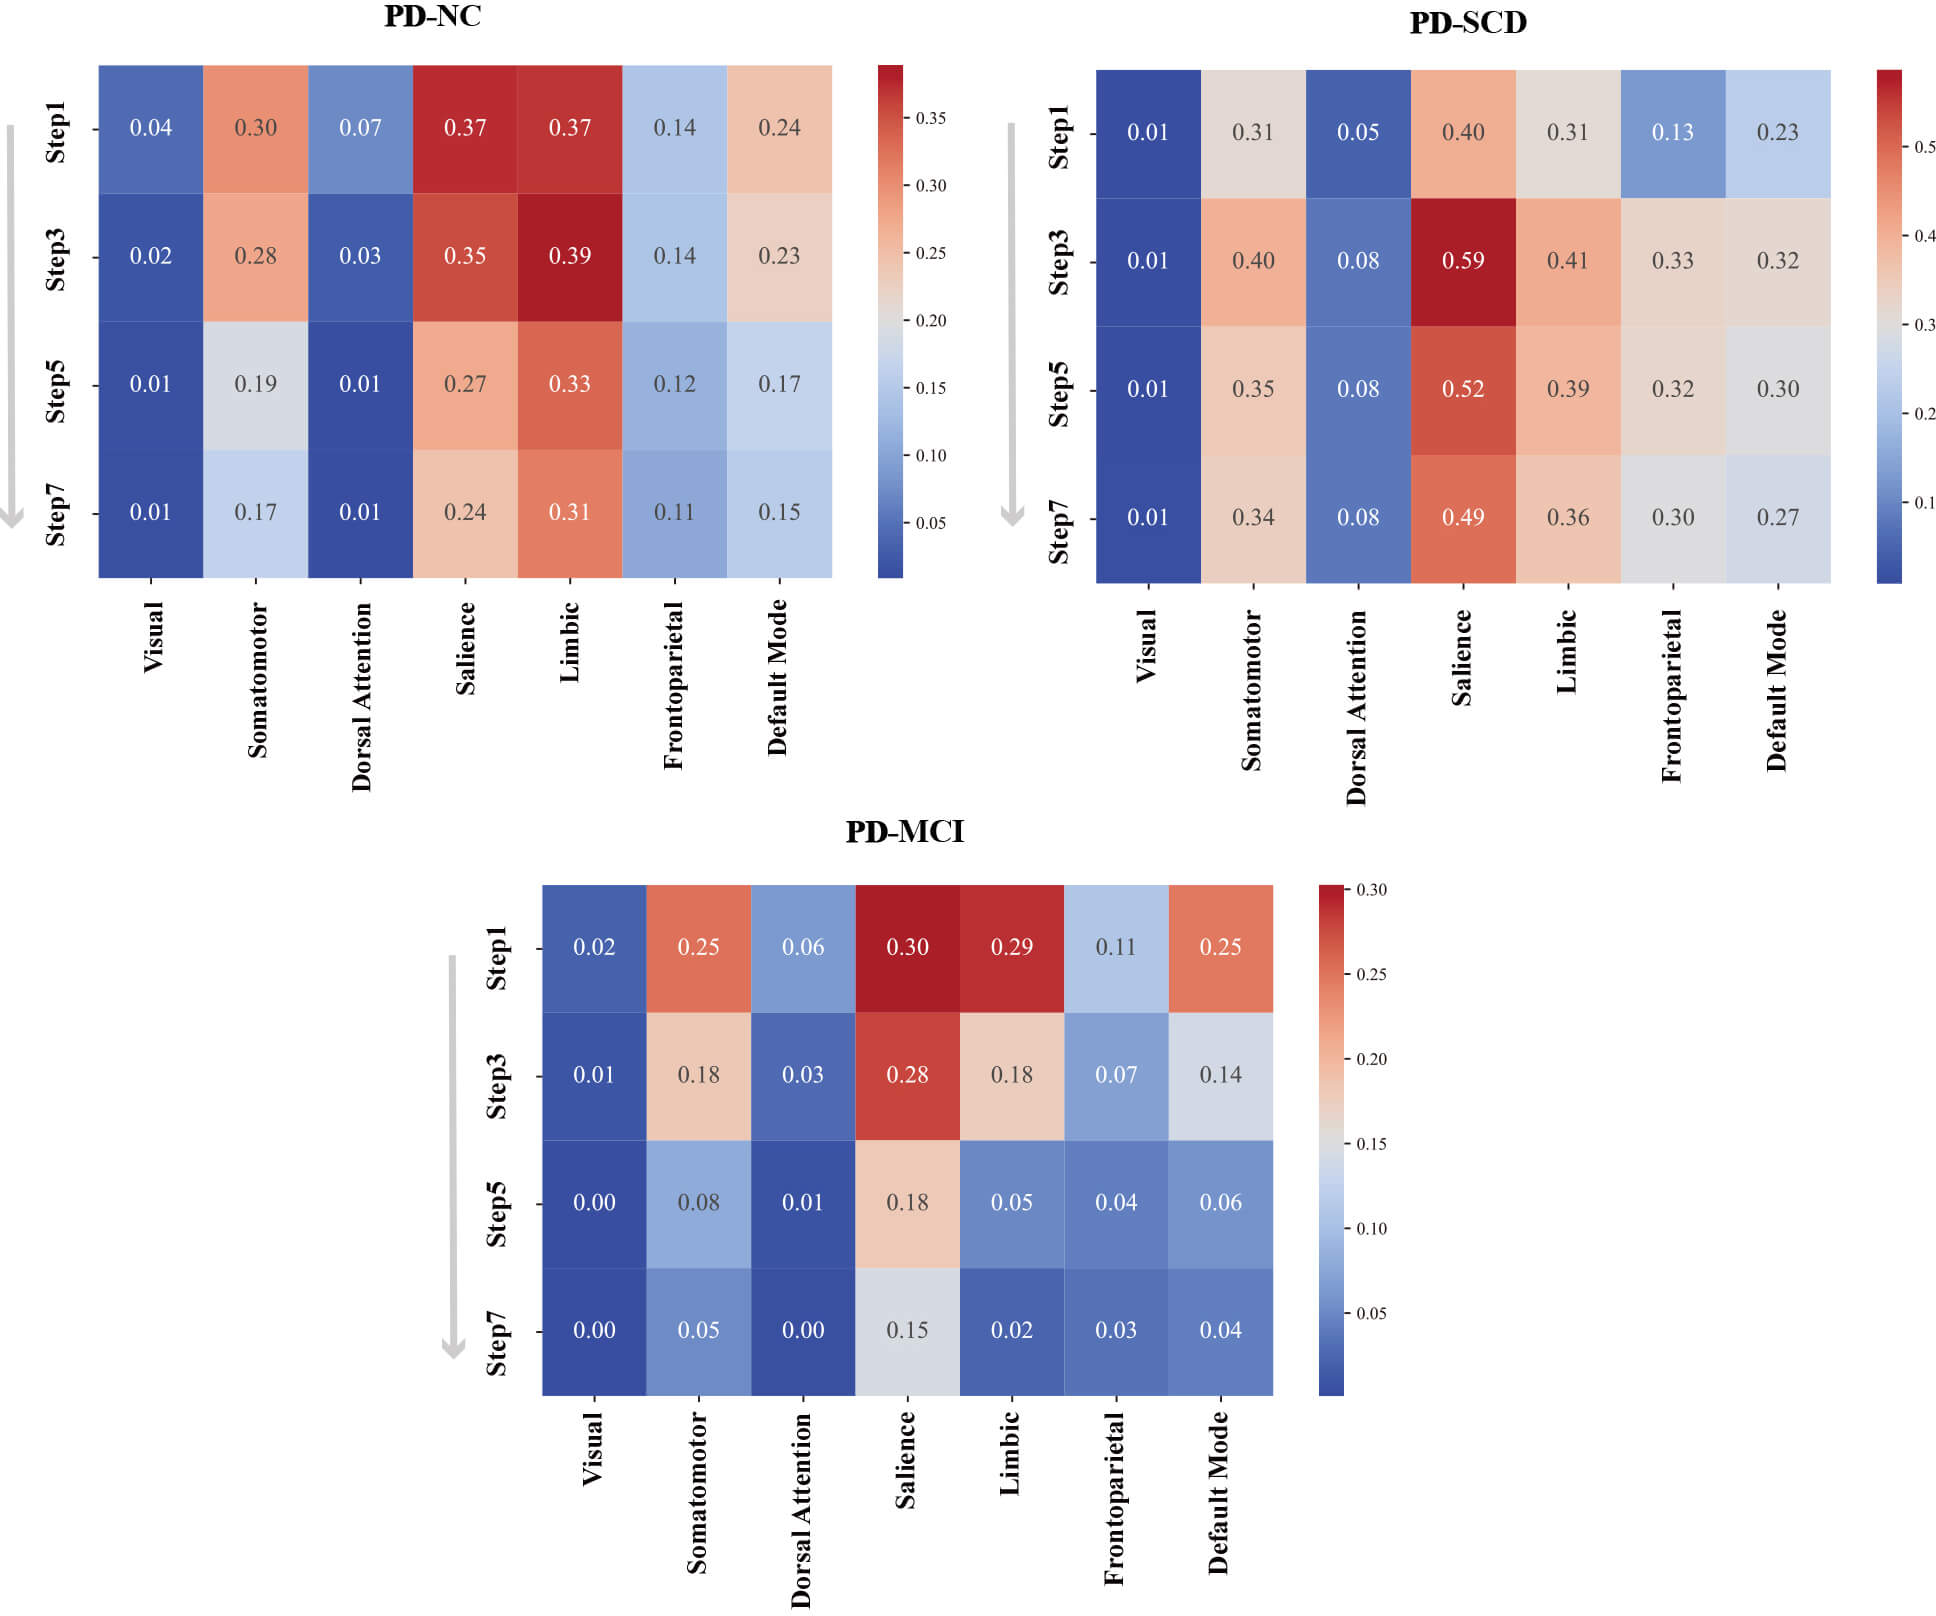 Fig. 2.
Heatmap quantification of spatial overlap between SFC odd-step maps and Yeo-7 cortical networks across PD subtypes. Matrix rows represent SFC step lengths (1, 3, 5, 7), and columns denote the seven canonical networks. Cell color intensity and numeric values indicate the percentage of overlapping voxels relative to the total network volume, and warm colors indicate high spatial overlap.
Fig. 3 illustrates significant intergroup differences in caudate-centered
stepwise functional connectivity (FDR, p
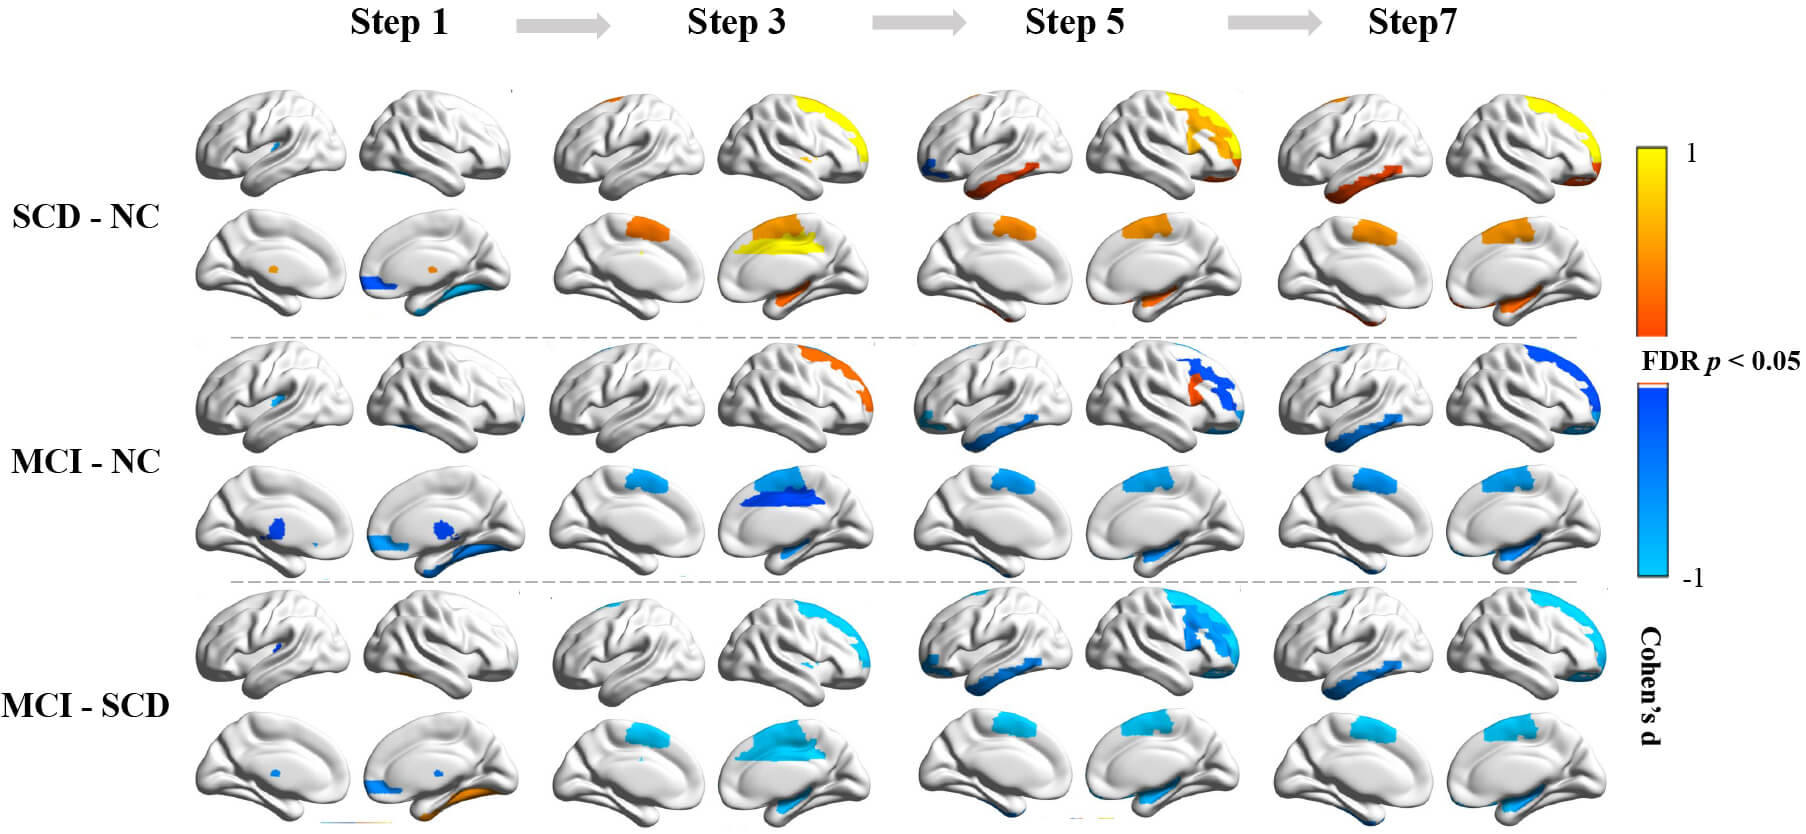 Fig. 3.
Intergroup differences in SFC strength for odd-step distances.
Top to bottom: Pairwise comparisons of PD cognitive subgroups (PD-SCD vs. PD-NC;
PD-MCI vs. PD-NC; PD-MCI vs. PD-SCD). Group differences were assessed using an
analysis of covariance adjusted for age, sex, and years of education. All results
survive FDR correction at p
PD-MCI had fewer direct caudate-thalamus and caudate-right ORBsup connections than did PD-NC. From step 3 to step 7, progressive disengagement was observed in the connections between the caudate and the SMA, right hippocampus, and GP. Mid-to-long-range connections (steps 5–7) demonstrated decreased left ITG integration. Right MCC (step 3) and MFG (step 5) showed phase-specific decreases, whereas the right SFG exhibited initial hyperconnectivity at step 3, followed by progressive attenuation at step 7.
The intergroup analysis between PD-MCI and PD-SCD revealed that the patterns of functional connectivity alterations were largely consistent with those identified in the PD-MCI versus PD-NC comparisons. Two notable exceptions were identified: PD-MCI exhibited more accelerated disconnection of the right SFG at step 3 and attenuation of right IFG connectivity at step 5.
Stable steps for caudate nucleus connections varied significantly among PD early
cognitive subgroups (Fig. 4). PD-MCI patients had longer stable steps than did
PD-NC and PD-SCD (ANCOVA; p
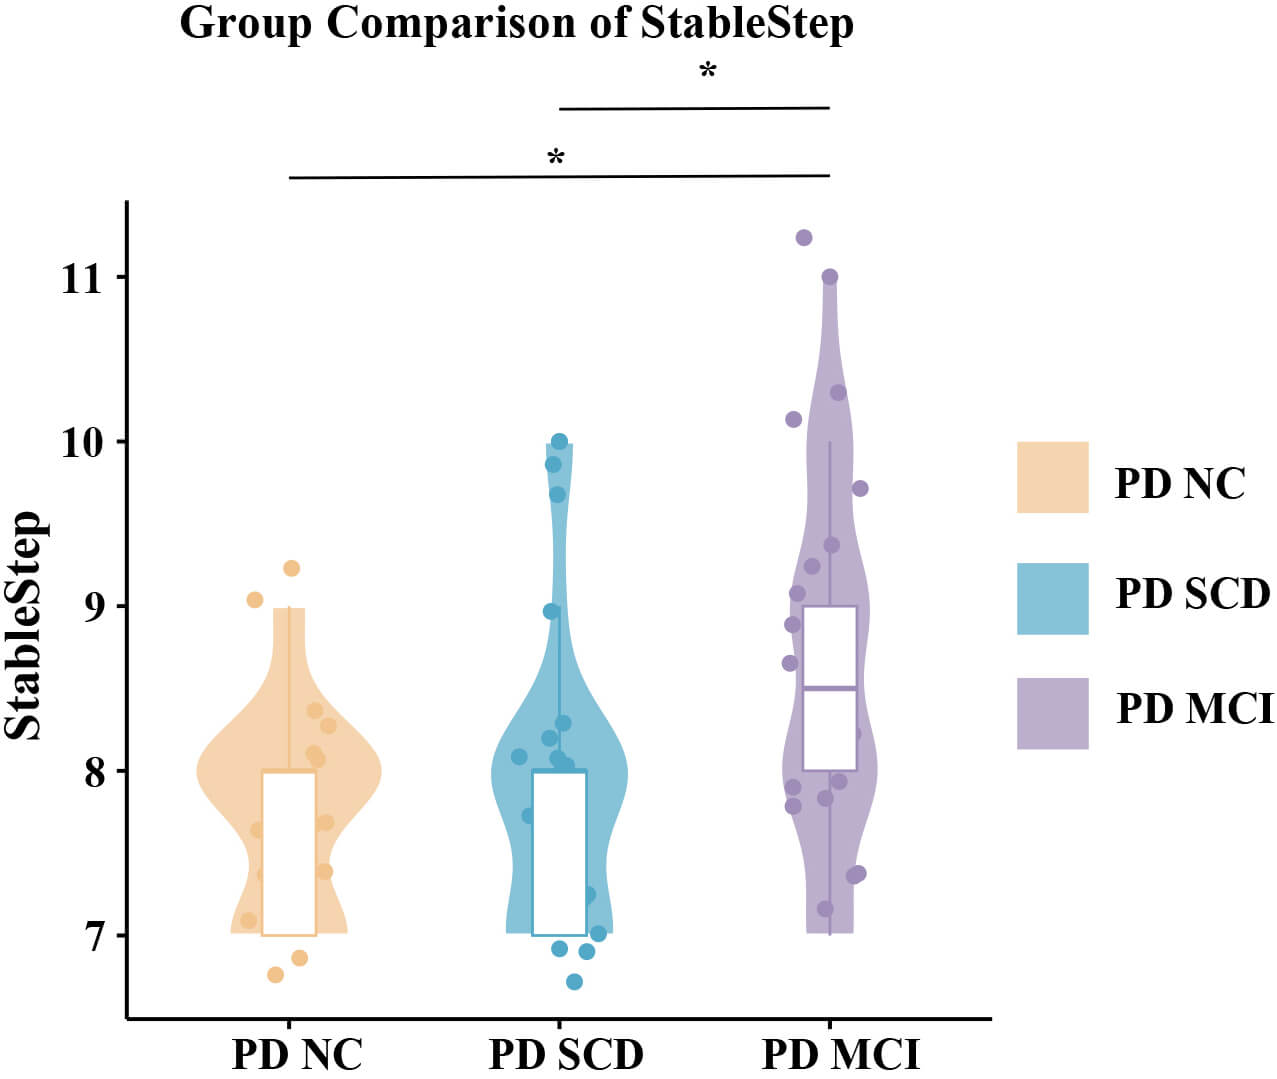 Fig. 4.
Group comparisons of stable step. Differences in stable steps
among PD cognitive subgroups were assessed using analysis of covariance adjusted
for age, sex, and years of education. * indicates statistically significant
differences (FDR-corrected p
Partial correlation analyses were performed to assess metabolic-functional
coupling between caudate nucleus 18F-FP-DTBZ uptake ratios and SFC metrics
(Table 3). We observed a significant negative correlation of stable steps with
left caudate uptake (r = –0.366, p = 0.019). Furthermore,
bilateral caudate 18F-FP-DTBZ uptake demonstrated positive correlations with
multi-step SFC values in the right hippocampus and GP (all p
| SFC metrics | Caudate_L | Caudate_R | |||
| R value | p value | R value | p value | ||
| Stable Step | –0.366 | 0.019 | |||
| Step 1 | |||||
| Step 3 | |||||
| Hippocampus_R | 0.445 | 0.004 | 0.390 | 0.012 | |
| Step 5 | |||||
| Hippocampus_R | 0.425 | 0.006 | 0.357 | 0.022 | |
| Pallidum_R | 0.325 | 0.038 | |||
| Step 7 | |||||
| Hippocampus_R | 0.414 | 0.007 | 0.345 | 0.027 | |
| Pallidum_R | 0.350 | 0.025 | 0.312 | 0.047 | |
Adjusted for age, sex, and years of education.
Factor analysis addressed multicollinearity among the 10 neuropsychological parameters, extracting two oblique cognitive factors that collectively explained 87.75% of the variation (Table 4). Factor 1 (global cognitive efficiency; 78.15% variance) integrated high-loading scores from five cognitive domains: language (VFT, BNT), attention/working memory (DST, SDMT), visuospatial processing (JLO), memory (LASSI-L A3), and executive control (STT, SCWT). Factor 2 (memory control; 9.6% variance) was primarily driven by LASSI-L indices of proactive semantic interference and recovery, reflecting inhibitory efficiency during memory encoding and retrieval.
| Variable | Factor 1 | Factor 2 |
| VFT | 0.9191 | –0.0325 |
| BNT | 0.8989 | –0.1229 |
| LASSI-L B1 | –0.0341 | 1.0096 |
| LASSI-L B2 | 0.3251 | 0.6793 |
| LASSI-L A3 | 0.6061 | 0.1441 |
| DST | 0.8475 | –0.0898 |
| SDMT | 0.7413 | 0.1706 |
| JLO | 0.7610 | 0.0374 |
| STT | –0.8257 | –0.0983 |
| SCWT | –0.7146 | 0.0570 |
Factor loadings with absolute values higher than 0.6 are in bold characters.
Partial correlation analyses were performed to assess the relationships between SFC values of each brain region at each step and cognitive factor scores (Fig. 5). Global cognitive efficiency (Factor 1) was positively correlated with left GP connectivity at step 3 (r = 0.3156, p = 0.0422) and right ORBsup connectivity at step 7 (r = 0.3244, p = 0.0366), suggesting that striatal-OFC networks integration mediate advanced cognitive operations across early processing through late-stage coordination. Memory control (Factor 2) demonstrated robust associations with the left ITG at step 5 (r = 0.3738, p = 0.0153) and step 7 (r = 0.3503, p = 0.0235), indicating that caudate-ITG circuit engagement supports interference-resistant memory during mid-to-long-range connections.
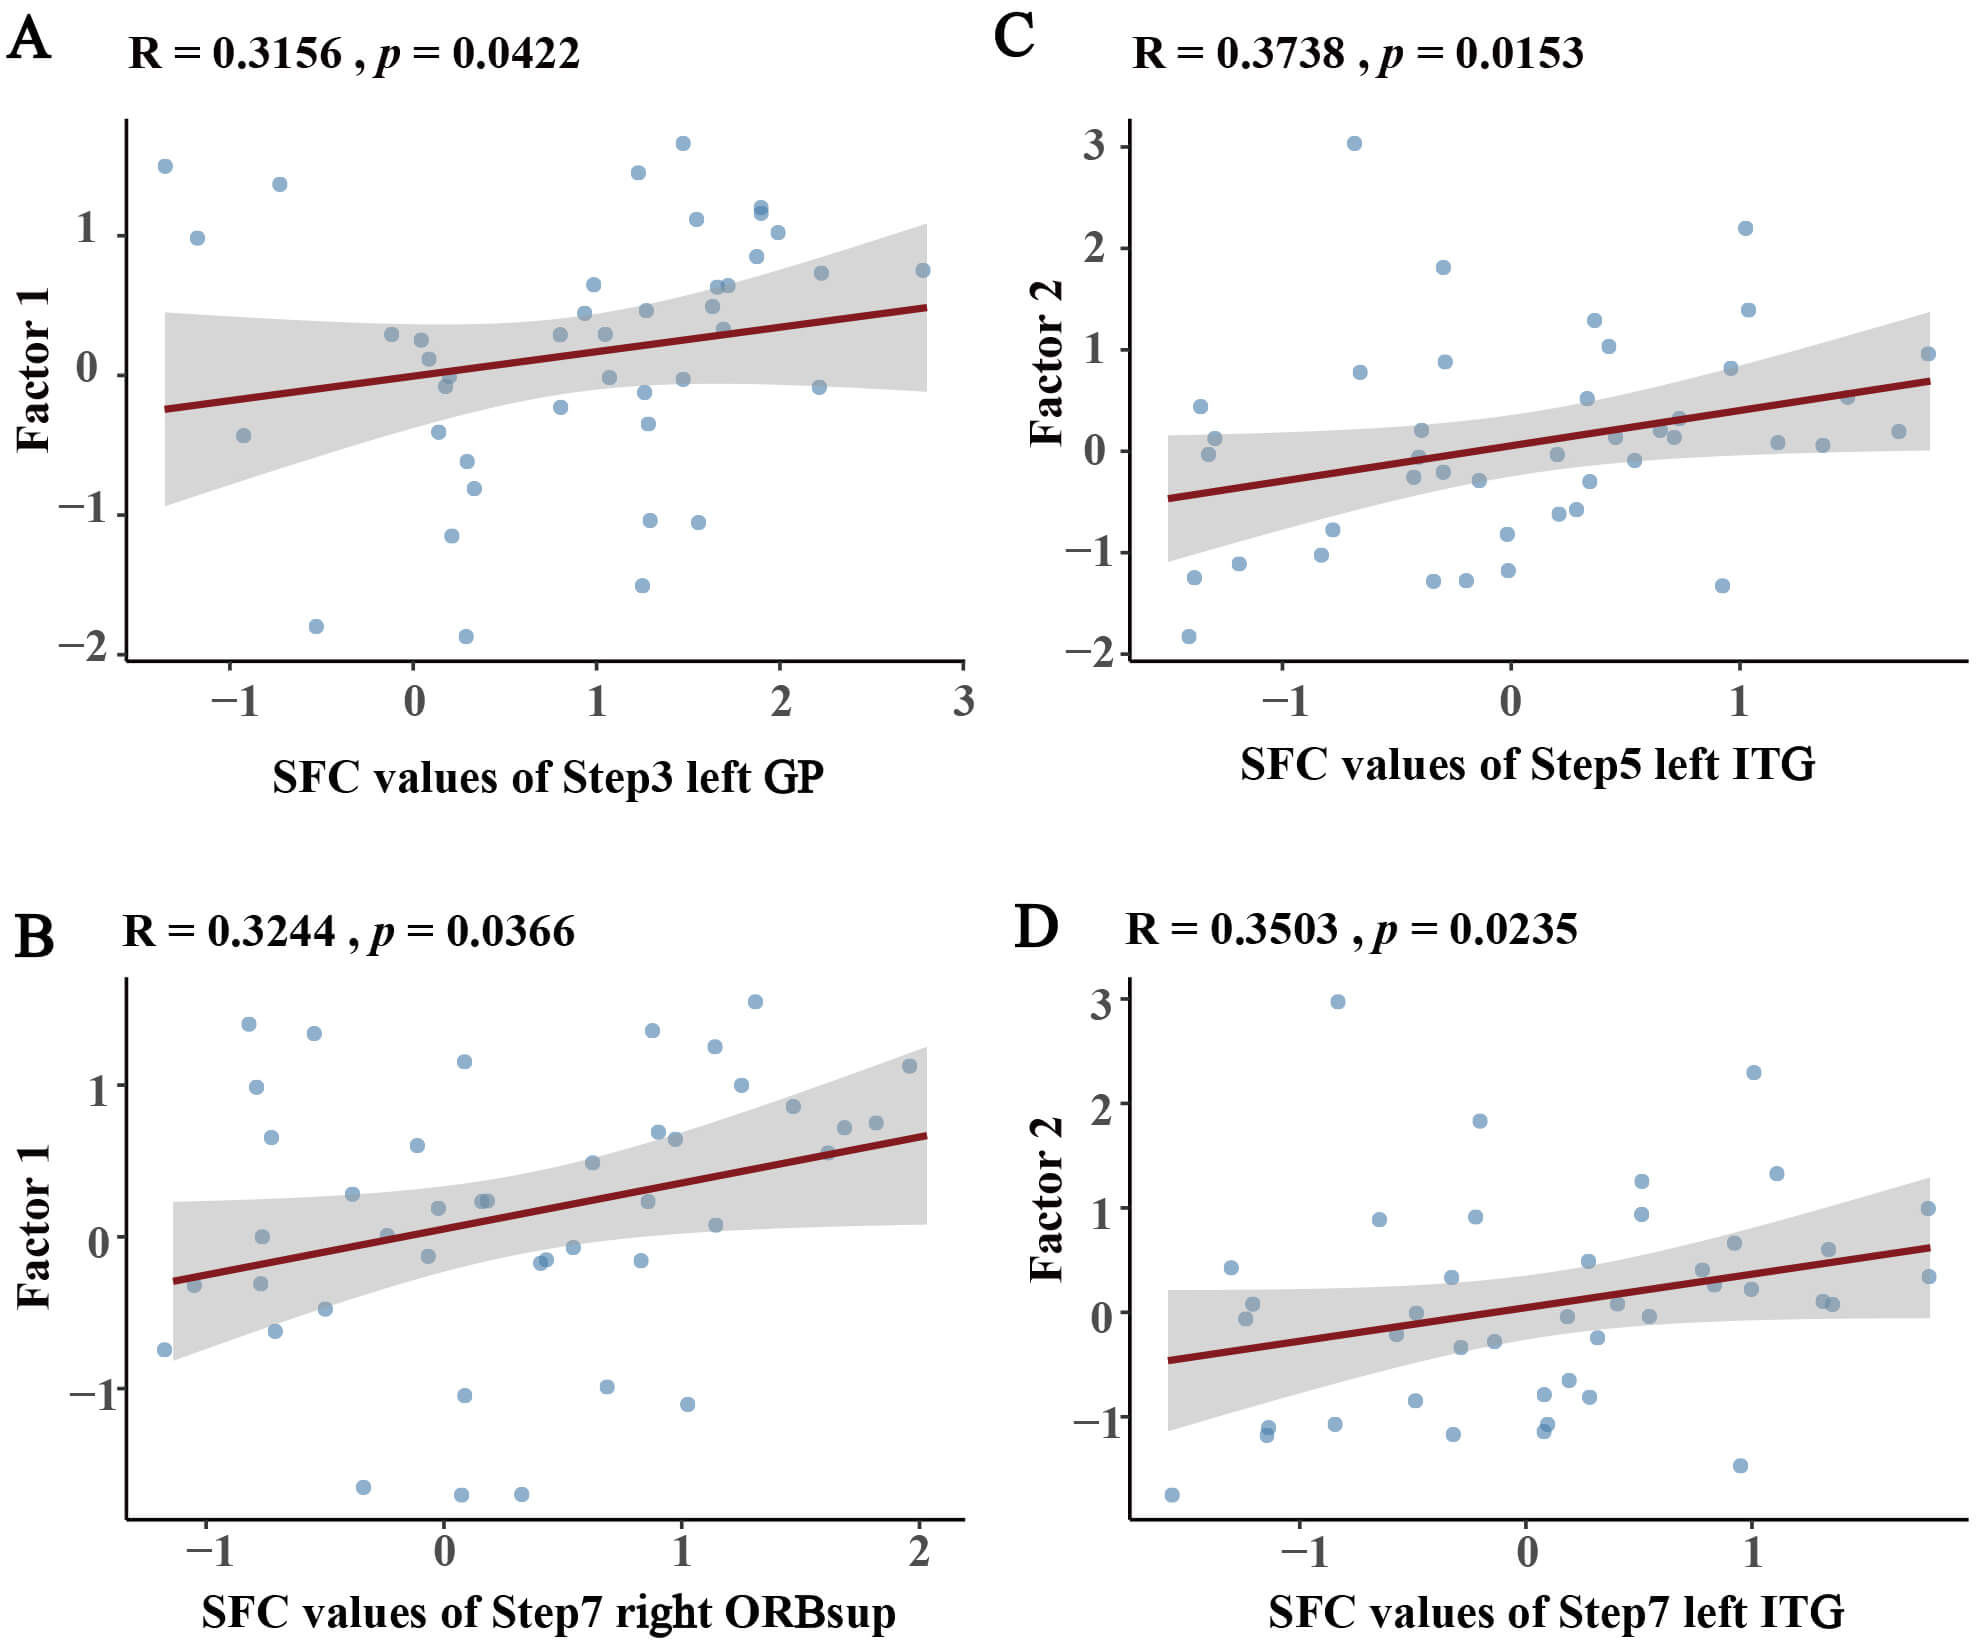 Fig. 5.
Partial correlations between cognitive factors and SFC values adjusted for age, sex, and years of education. (A,B) Factor 1 correlations with SFC values at (A) Step 3 left-GP and (B) Step 7 right-ORBsup. (C,D) Factor 2 correlations with SFC values at (C) Step 5 and (D) Step 7 left ITG. GP, globus pallidus; ORBsup, superior orbitofrontal cortex; ITG, inferior temporal gyrus.
In the present study, we used integrated PET/MR imaging to combine molecular and functional information, enabling us to trace both the metabolic epicenters and the patterns of functional connectivity disruption at increasing topological distances across different stages of early PD-CI. 18F-FP-DTBZ PET molecular imaging highlighted the caudate nucleus as a critical dopaminergic hub in early PD-CI, providing direct evidence of region-specific dopaminergic deficits associated with early cognitive decline. SFC analysis further delineated a triphasic trajectory of caudate nucleus connection with whole-brain networks; preserved network stability in PD-NC transitioned to compensatory hyperconnectivity in PD-SCD, and then to widespread network inefficiency and rigidity in PD-MCI. Key circuits connecting the caudate to the GP, thalamus, right SFG, left ITG, right ORBsup, SMA, and right hippocampus were dysregulated. Elevated caudate 18F-FP-DTBZ uptake mediated metabolic-functional coupling with stable steps, right hippocampal, and GP connectivity. Integrating clinical neurocognitive correlations with imaging results further revealed distinct hierarchical connections: Global cognitive efficiency was associated with short-range caudate-left GP connection and long-range caudate-right ORBsup integration, whereas memory control was positively correlated with mid-to-long-range caudate-left ITG connection.
To our knowledge, this study was the first to provide a thorough mapping of SFC features across the PD early cognitive continuum, including PD-NC, PD-SCD, and PD-MCI. A major contribution of this study was the identification of the core dopaminergic metabolic impairment regions in early PD-CI, as well as a triphasic trajectory of caudate functional network reorganization across these stages. Mechanistically, our findings showed that early caudate hyperconnectivity is linked to neuronal reserve before clinically detectable cognitive decline.
We observed a reduction in 18F-FP-DTBZ binding in the caudate nucleus of PD-MCI patients, supporting previous evidence of caudate specific dopaminergic deficits in PD-CI [23, 24]. Crucially, the caudate nucleus dynamically integrates sensory, motor, and cognitive inputs to manage executive control, episodic memory, and attentional allocation in the striatal-thalamo-cortical circuits [23, 24, 25]. Dopaminergic neuron degeneration in the substantia nigra pars compacta affects integrative function, causing executive inflexibility and memory dysfunction. Additionally, increased bilateral caudate nucleus 18F-FP-DTBZ binding in PD-SCD patients possibly indicated compensatory neurochemical mechanisms prior to measurable cognitive decline. Therefore, considering the crucial role of the caudate in the dopaminergic circuitry underlying early PD-CI, we used this region as the seed in our SFC analysis.
The distance-dependent connectivity gradient in PD-NC showed largely sustained network efficiency. In this state, brain areas develop local connections to save metabolic costs and maintain restricted long-range connections for effective information transfer. Our study showed that the caudate nucleus retains moderate-strength functional connectivity across multiple resting-state networks. Cognitively intact PD patients show retained connection between critical networks (salience, limbic, somatomotor, default mode, frontoparietal), supporting inter-network integration and complex cognition through effective resource allocation [26, 27]. Although PD-NC showed network abnormalities compared to healthy controls [28], adopting it as the baseline reference is methodologically justified for this study. Our strategy targeted early PD-CI continuum network changes, not general PD-related connectivity alterations.
In the PD-SCD stage, we observed that enhanced caudate-cortical connections may be the earliest neural alterations of preclinical cognitive decline. According to the neural efficiency hypothesis [28, 29], cognitively efficient individuals (PD-NC) have stable, moderate connection and simplified brain processing. With emerging cognitive impairments (PD-SCD), neural resources increase, causing hyperconnectivity. Compensatory hyperconnectivity may mobilize neural reserves to preserve cognition in early neurodegeneration. As in Alzheimer’s disease, neural hyperactivity often precedes clinical decline [30]. It is important to note that the transient hyperconnectivity of PD-SCD may offset early damage. However, concurrent disconnection from the OFC indicates sensitivity to functional degeneration, improving our understanding of network-level pathophysiology in early PD-CI.
The clinical transition to PD-MCI, characterized by increasing connection deficits, may be caused by neural resource depletion and compensatory mechanisms failing. The global connectivity attenuation and longer stable steps in PD-MCI imply exhausted network reconfiguration capacity and reduced cross-network integration efficiency [31, 32]. This functional pattern is consistent with established anatomical findings [33, 34], that include broad cortical thinning (especially fronto-temporo-parietal) and thalamus and hippocampal volumetric reduction. Notably, PD-MCI has demonstrable residual connections despite global diminished connectivity strength. This reflects a transitional phase with reduced inter-network connectivity and functional rigidity that may wane with treatment or lead to irreversible PDD.
By integrating SFC connectivity findings across the three clinical stages, we observed progression abnormalities involving the caudate nucleus and its connections with the GP, thalamus, right SFG, left ITG, right ORBsup, SMA, and right hippocampus. Five parallel, topographically organized circuits connect the basal ganglia to the cerebral cortex: two motor (skeletomotor and oculomotor) and three non-motor circuits involving the caudate nucleus, which originate from the dorsolateral prefrontal cortex, anterior cingulate cortex, and OFC, as previously described [35]. Critically, the regions we found correspond to key nodes in these three non-motor circuits, revealing broad basal ganglia-cortical-limbic networks disruption. Our results also showed marked laterality in brain regions. This suggests the dysfunction may start unilaterally and progress to bilateral involvement, a hypothesis requiring further study.
The accumulation of iron in the brain may represent a pathophysiological factor in PD-CI. A study by Uchida et al. [36] demonstrated that PD-MCI patients exhibited significantly higher quantitative susceptibility values in the cuneus, precuneus, head of caudate nucleus, fusiform gyrus, and OFC than did PD-NC patients, and these values negatively correlated with cognitive scores. Notably, the iron deposition observed in the head of the caudate nucleus and OFC aligned with regions that are also key foci in our current study of PD-CI. This convergence suggests a potential mechanism whereby iron accumulation in these areas may lead to altered functional connectivity between the caudate and OFC, ultimately contributing to cognitive decline in PD. This plausible mechanism warrants further investigation.
Our findings explored metabolic-functional relationships in early PD-CI. Specifically, the inverse correlation between left caudate VMAT2 availability and stable step reflected integrated dopaminergic-connectivity coupling, with left-lateralized dominance potentially. Concurrently, positive associations of bilateral caudate VMAT2 availability with multi-step SFC in the right hippocampus/GP demonstrated regionally selective dopaminergic sensitivity. Neuroanatomically, hippocampal circuitry mediates episodic memory processing [37], whereas the GP regulates neural gating within basal ganglia networks [38]. Dysfunction in both structures underlies critically dopaminergically-mediated PD-CI.
The combination of clinical cognitive scores and SFC results revealed specific patterns of brain connectivity underlying cognition in PD. Our findings showed that fast subcortical information gating via basal ganglia circuits and OFC-guided cognitive resource allocation contribute to cognitive efficiency in PD. Enhanced caudate-GP connection may optimize neural gating by suppressing task-irrelevant activity and facilitating resource allocation for executive functions, thereby boosting cognitive flexibility [38]. The ORBsup, a major OFC subregion, guides decision-making by integrating affective, motivational, and cognitive inputs [39]. It optimizes cognitive resource deployment in the basal ganglia by dynamically evaluating task value and effort costs [40]. The memory control positively associations with caudate-left ITG connection, supporting interference-resistant semantic consolidation. The ITG integrates visual and linguistic information to generalize semantics from concrete instances to abstract categories while suppressing irrelevant competitors [41]. Neuroimaging studies have shown that this region’s cortical thinning may cause category-specific deficiencies in visual recognition memory [42].
Our findings have important therapeutic implications for PD-CI. Targeted dopaminergic circuit modulation and compensatory neural processes may slow PD-CI. Identification of disturbed functional connectivity networks is essential for restoring neural communication treatment [43]. Non-invasive neuromodulation techniques, such as transcranial magnetic stimulation (TMS) could be strategically applied to the circuit-specific disruptions revealed in this study as a means to restore neural communication in PD-CI [44].
Several limitations of the present study should be considered. First, the cross-sectional method prevents causal inferences about network-cognition links, hence longitudinal validation is needed to corroborate the triphasic trajectory. Second, the interpretation of the subgroup-specific SFC patterns should be considered in the context of the sample sizes. Our study included 46 participants in total, which was reasonable for a complex PET/fMRI protocol; however, when divided into subgroups, the sample size in each group (n = 15–16) became relatively modest. This may have affected the generalizability of the identified SFC maps. Consequently, these findings should be viewed as preliminary and require replication in larger, independent cohorts. Third, although levodopa doses were similar, existing dopaminergic medication may have distorted connectivity results. Fourth, other cognition-related brain regions, such as the thalamus and hippocampus, deserve focused investigation in future studies. Future research should combine longitudinal multimodal imaging and neuropathology to investigate synucleinopathy, network dynamics, and cognitive trajectories.
In summary, this study integrated PET-based dopaminergic mapping with SFC analysis to identify the caudate nucleus as a neural hub in early PD-CI, outlining a triphasic trajectory of stable integration, compensatory hyperconnectivity, and widespread fragmentation. These stage-specific signatures provide a mechanistic foundation for developing precise neuromodulation therapies targeting PD-CI progression.
PD, Parkinson’s disease; CI, Cognitive impairment; NC, Normal cognition; SCD, Subjective cognitive decline; MCI, Mild cognitive impairment; PDD, Parkinson’s disease with dementia; SFC, Stepwise functional connectivity; VMAT2, Vesicular Monoamine Transporter Type 2; VFT, Verbal Fluency Test; BNT, Boston Naming Test; LASSI-L, Loewenstein-Acevedo Scales for Semantic Interference and Learning; DST, Digit Span Test; SDMT, Symbol Digit Modalities Test; JLO, Judgement of Line Orientation; STT, Shape Trails Test; SCWT, Stroop Color and Word Test; HAMD, Hamilton Depression Scale; HAMA, Hamilton Anxiety Scale; OFC, Orbitofrontal Cortex; IFG, Inferior Frontal Gyrus; SMA, Supplementary Motor Area; ORBsup, Superior Orbitofrontal Cortex; SFG, Superior Frontal Gyrus; GP, Globus Pallidus; MCC, Middle Cingulate Cortex; MFG, Middle Frontal Gyrus; ITG, Inferior Temporal Gyrus; AD, Alzheimer’s Disease.
The datasets used and analysed during the current study are available from the corresponding author on reasonable request.
XL, XW: Supervision, Design, Acquisition & interpretation of data, Writing-review & editing, Funding acquisition; WZ: Investigation, Data collection and analysis, Writing-original draft, review & editing; GL, FM: Investigation, Data collection, Writing-original draft, review & editing; HZ, LZ, LL: Data collection, Writing-original draft, review & editing; YG, CS, YY: Data analysis, visualization, Writing-original draft, review & editing. All authors read and approved the final manuscript. All authors have participated sufficiently in the work and agreed to be accountable for all aspects of the work.
This study protocol was approved by the Ethics Committee of Shenzhen People’s Hospital (LL-ZLJS-2023092-01), complied with the Declaration of Helsinki ethical guidelines. Written informed consent was obtained from all patients or their legal guardians.
We express profound gratitude to the patients whose invaluable contributions made this study possible.
This work was supported by the Shenzhen Science and Technology Program (JCYJ20241202130703005).
Yutong Guo, Chang Sun, and Yang Yang are employees of United Imaging Healthcare Group Co., Ltd. The authors declare that their affiliation with the aforementioned company did not influence the design, data collection, analysis, or interpretation of the study. All other authors have reported no conflicts relevant to the contents of this paper to disclose.
Supplementary material associated with this article can be found, in the online version, at https://doi.org/10.31083/JIN46634.
References
Publisher’s Note: IMR Press stays neutral with regard to jurisdictional claims in published maps and institutional affiliations.