1. Introduction
Alzheimer’s disease (AD) is a progressive degenerative brain disorder affecting
memory, cognition and behaviour [1]. It is the most common cause of dementia
accounting for 60–70% of cases, and numbers are expected to exceed 150 million
cases worldwide by 2050 [2]. Pathologically, end-stage AD is characterised by the
formation of neurofibrillary tau tangles and extracellular amyloid beta-protein
(A) [3], and both pathologies may contribute to the neuronal dysfunction
and cognitive decline observed in AD [4]. Amyloid- is generated from the
amyloid precursor protein (APP) through a series of enzymatic cleavages [5, 6]. In
the amyloidogenic pathway, APP is first cleaved by -secretase to produce
a secreted form of APP (sAPP) and a membrane-bound carboxyl terminal
fragment (CTF or C99) — the latter is further cleaved by the
-secretase complex (a four-unit protease complex with presenilin as the
catalytic subunits) to release A peptides including A40 and
A42. Both, A40 and A42, are neurotoxic and an increase
in the A42/A40 ratio has been associated with a more pronounced
plaque pathology due to higher oligomerization of A42 [7, 8, 9, 10]. In the
non-amyloidogenic pathway, APP is cleaved by -secretase producing
sAPP and CTF (or C83).
Early work has revealed A as the main constituent of senile plaques
establishing its central role in AD pathophysiology [11, 12, 13, 14, 15, 16]. Additionally,
genetics and genomic studies have so far identified 52 pathogenic APP mutations
including the Swedish (K670N/M671L), Florida (I716V), and London (V717I)
mutations, all of which are located near the -secretase or
-secretase cleavage sites and are associated with increased A
accumulation in familial or early-onset AD (for review [17]). In addition, the
Icelandic A673T mutation has recently been identified in Icelandic and
Scandinavian populations and carriers have a significantly lower risk of
developing AD [18]. The protective effect of the A673T mutation is believed to be
primarily achieved through decreased A production [19, 20].
Over the past decades, several A-based mouse models have been developed
to study the role of A in AD, such as mice carrying mutations in APP and
presenilin-1 (PS1). The APP/PS1 model carries the Swedish APP mutation
(K670N/M671L) and the PS1 mutation (M146V). The 5×FAD mice overexpress human APP
with the Swedish (K670N/M671L), Florida (I716V), and London (V717I) mutations, as
well human PS1 with the M146L and L286V mutations and is one of the most
frequently used and best characterised models of AD [21]. These mice develop
robust amyloid plaque pathologies that are suggested to trigger synaptic and
neuronal loss [21, 22, 23, 24], inflammatory responses [25] and loss of synaptic proteins
[26, 27]. The protective effect of the human form of the Icelandic A673T mutation
has been studied in vitro [18, 28, 29, 30], in vivo using A
injection models [31], as well as humanised APP knock-in mice and rats [32, 33].
However, the effect of the murine A673T mutation, mAPPA673T, in transgenic
APP mice remains elusive, but it has been suggested that endogenous mouse
A may alter human A in transgenic models [34]. We therefore
here performed histopathological, immunoblot and enzyme-linked immunosorbent assay (ELISA) immunoassays to access
whether the introduction of mAPPA673T in a 5×FAD background reduces
A levels and rescues subsequent A pathologies in vivo.
2. Materials and Methods
2.1 Animals and Study Design
All animal experiments were performed in accordance with the European
Communities Council Directive (63/2010/EU) with local ethical approval under the
UK Animals (Scientific Procedures) Act (1986) and its amended regulations (2012),
and under the project licence number PP2213334 compliant with the ARRIVE
guidelines 2.0 [35]. The study was exploratory. No power calculations were
performed a priori.
Mice were bred at our local animal facility. Heterozygous 5×FAD mice, on a black
C57Bl6/J background (B6.Cg Tg (APPSwFlLon, PSEN1*M146L*L286V; 6799Vas/Mmjax, JAX
MMRRC Stock# 034848)) were crossed with mice harbouring the Icelandic mutation
generated by Clustered Regularly Interspaced Short Palindromic Repeats–CRISPR-associated (CRISPR-Cas) gene editing of a single nucleotide into the murine APP
gene at position 673 on a black C57Bl6/J background, termed mAPPA673T mice.
Screening for potential off-target sites confirmed 4 low frequency targets (score 3.5; for comparison, A673T score is 100) with unlikely consequences on the
phenotype. These were therefore not confirmed. Crosses were bred from
heterozygous 5×FAD (male or female) with heterozygous mAPPA673T (male or
female). Ear biopsies were genotyped for the 5×FAD and the A673T mutation in the
murine APP gene by Transnetyx Inc. (Cordova, USA) and yielded heterozygous
offspring only. Mice were grouped by sex and according to one of the four
genotypes: C57Bl6/J wild type (WT), mAPPA673T, 5×FAD and
5×FAD × mAPPA673T. A total of seventy-one male and female mice, 6- to
7-month-old, were included in the study (Table 1). Experimental mice were kept in
sex- and genotype-specific litters 2 in stock box open housing under
constant environmental conditions (20–22 °C temperature, 50–65%
humidity, an air exchange rate of 17–20 changes per hour, and a 12-h light/dark
cycle with lights turned on at 7 am with simulated sunrise/sunset) and ad
libitum chow (Special Diet Services, Witham, UK) and water throughout. Mice were
provided with corncob bedding, paper strips, and cardboard tubes (DBM, Edinburgh Scotland, UK) as enrichment throughout the experiment. They were kept in the
same holding room throughout the study except when they were transferred to the
euthanasia room for sacrifice and tissue harvest. Experimenters and care takers
were blinded to the genotype of mice during maintenance and tissue collection.
Following tissue collection, independent experimenters, also blinded to the
genotype of mice, performed immunohistochemistry, ELISAs, and all statistical
analyses relating to these measurements.
Table 1.
Study groups and cohort sizes.
|
Male (N) |
Female (N) |
| WT |
9 |
4 |
| mAPPA673T |
9 |
9 |
| 5×FAD |
17 |
4 |
| 5×FAD × mAPPA673T |
14 |
5 |
| N - Total |
∑ 49 |
∑ 22 |
WT, C57Bl6/J wild-type mice; mAPPA673T, mice with the A673T Icelandic
mutation in the murine APP gene; 5×FAD, five familial Alzheimer’s disease mice;
5×FAD × mAPPA673T, crosses carrying both the 5×FAD mutations and the murine
A673T mutation; N, number of mice. Mice were 6- to 7-month-old when they were
perfused for tissue collection.
2.2 Animal Perfusion and Brain Tissue Collection
Brain tissue was harvested from all seventy-one mice (Table 1). All chemicals
were purchased from Merck Millipore (Burlington, MA, USA) if not otherwise
stated. Mice were euthanised via intraperitoneal injections of a lethal dose of
sodium pentobarbital (#08007/4034, Dolethal (200 mg/mL), Covetrus, UK) before undergoing
intra-cardiac perfusion with heparinised phosphate-buffered saline (0.1 M PBS
with 0.05% (v/w) heparin, pH 7.4 (#9041-08-1, Sigma-Aldrich, Darmstadt, Germany)) for 5 minutes. Skulls were dissected and whole
brains retrieved. The right brain hemisphere was dissected, fixed overnight at
room temperature in 10% (v/v) neutral-buffered formalin (#HT501128, Merck, Darmstadt, Germany), dehydrated and embedded
in paraffin. Sagittal sections were prepared at 5 µm using a rotary
microtome (HM 325, Leica Biosystems, Sheffield, UK), and mounted onto glass
slides (SuperFrostTM, Thermo Fisher Scientific, Lutterworth, UK). Sagittal
sections were collected from regions at interaural 0.96 to 1.44 mm lateral of
midline [36], and three sections were collected on one slide for each mouse and
antibody. After brain removal, the left-brain hemisphere was transferred
immediately to liquid nitrogen and kept at –80 °C until used for
protein extraction, ELISA and immunoblot quantification.
2.3 A immunohistochemistry and Quantification of A
Plaques
Wax-embedded sagittal sections were stained in a sex-specific way using four
immunohistochemistry staining boxes for male and two for female samples. Each box
included a balanced number of all four genotypes. All chemicals were purchased
from Merck Millipore (Burlington, MA, USA) unless otherwise stated. Sections were
stained according to our standard protocol [37] using the
VECTASTAIN® ABC-HRP kit (VECTOR laboratories #PK-4000), the
ImmPACT DAB substrate (VECTOR laboratories, Newark, CA, USA #SK-4105), and the 6E10
anti-A antibody (Biolegend, San Diego, CA, USA # 803004, diluted 1:1000). Images of
hippocampal cornu ammonis (CA1), the dentate gyrus (DG), the visual
cortex (CTX), the prefrontal cortex (PFC), and the cerebellum (CB) were taken
using a light microscope at a 100 magnification (Axio Imager M1, Carl
Zeiss, Jena, Germany) and saved as TIFF file format. Entire microscopic images
were analysed using ilastik (Version 1.4.0.post1, https://www.ilastik.org) [38] and Fiji (Version 2.14.0, https://fiji.sc)
[39]. The pixel and object classification tool in ilastik enabled training of the
software based on a small subset of samples and then apply them to larger sets of
images [38]. Models were trained to segment images into positively stained pixels
and unstained background tissue or artefacts, and additionally to specifically
recognise extracellular A plaques. Variability in staining across
different slices was accounted for by including faint, high and intermediate
staining intensity images during the training process. After applying these
models to all images, the percentage of positively stained area for the entire
image, as well as extracellular plaques characteristics (number, size, and area)
were quantified using Fiji. The total stained area (%), plaque count, average
plaque size (µm2) and plaque area (µm2) were
each analysed.
2.4 NeuN and GFAP Immunohistochemistry
Wax-embedded sagittal sections were dewaxed and stained as described above using
NeuN (Millipore #mAB377 diluted 1:1000) and glial fibrillary acidic protein
(GFAP) (ThermoFisher, Waltham, MA, USA #14-9892-82, diluted 1:100) antibodies. Images from CA1,
DG, CTX, PFC and CB were taken, and positive area was quantified as described
above (percentage of positively stained area).
2.5 Protein Extraction
All chemicals were purchased from Merck Millipore (Burlington, MA, USA) unless
otherwise stated. The left hemibrains were pulverized in a liquid nitrogen
prechilled stainless steel mortar and pestle (BioPulverizer, BioSpec, Oklahoma,
USA) and homogenized with a pestle and hammer. RIPA lysis buffer (Thermo Fisher
Scientific, #89900) containing Pierce Protease and Phosphatase Inhibitor Mini
Tablets (Thermo Fisher Scientific, # A32959) and 1mM AEBSF
(4-(2-aminoethyl)benzenesulfonyl fluoride hydrochloride) (Thermo Fisher
Scientific #78431) were added in a ratio of 5:1 (mL buffer to mg wet tissue) and
the homogenate was incubated for 30 minutes on ice with occasional agitation.
After centrifugation at 19,000 g for 2 hours at 4 °C (Centrifuge 5427 R
– Microcentrifuge (Eppendorf, Hamburg, Germany), using the FA-45-48-11 rotor), the supernatant (referred to as
the RIPA-soluble supernatant fraction S1) was transferred into new reaction
tubes. The residual pellet was homogenised in 5 volumes TBS (pH 7.6) containing 5
M guanidine hydrochloride (GuHCl) and 1mM AEBSF and incubated with mild agitation
(11 rotations per minute, Multi Bio RS-24, Biosan, Riga, Latvia) for 16 hours at
room temperature. After centrifugation at 15,000 g for 30 minutes at room
temperature, the resultant supernatant fractions (referred to as GuHCl fraction, or RIPA-insoluble fraction or S2) was were each transferred into new tubes. AEBSF was added to
both S1 and S2 extraction buffers at a 1 mM final concentration to prevent
degradation of A. S1 and S2 fractions were stored at –20 °C
until use. Total protein concentration of S1 and S2 fractions was determined
using the bicinchoninic acid (BCA) protein assay (Pierce™ BCA
Protein Assay Kit, Thermo Fisher Scientific, #23225) with bovine serum albumin
(BSA: 0.125–2.000 mg/mL) as a reference standard.
2.6 A, Tau and Synaptic Proteins ELISA
All ELISAs were conducted according to the manufacturer’s instructions, and each
sample was measured in duplicates.
RIPA-soluble S1 was used to measure human A40 (Invitrogen #KHB3481),
human A42 (Invitrogen, Waltham, MA, USA # KHB3441), mouse tau (Invitrogen #KMB7011),
mouse synaptosomal associated protein 25kDa (SNAP25, MyBiosource #MBS451917),
mouse syntaxin 1A (STX1A, MyBiosource #MBS452386), and mouse synaptophysin (SYP,
MyBiosource #MBS453910). First, all S1 samples were diluted to a protein
concentration of 4 µg/µL in RIPA (including protease
and phosphatase inhibitors + AEBSF). For A40 and A42, S1
samples were further diluted 1:5 in dilution buffer provided within each kit. All
5×FAD and 5×FAD × mAPPA673T samples were used, and one WT and one
mAPPA673T sample was included on each plate as a control. For tau, S1
samples at 4 µg/µL in RIPA were used, and
quantification was conducted for all 71 mice. For synaptic proteins, S1 samples
were further diluted in PBS at 1:2 for STX1A and 1:10 for SYP and SNAP25 and
quantification was conducted for 70 mice (1 female WT excluded for SYP/SNAP25 due
to sample preparation error). Additionally, A40 and A42 were
quantified in GuHCl S2 fractions using the same kits as above. All S2 samples
were first diluted to a protein concentration of 1
µg/µL in TBS (pH 7.6) containing 5M GuHCl (including
protease and phosphatase inhibitors + AEBSF) and further diluted 1:1000 for
A40 or 1:7500 for A42 using the dilution buffer provided within
each kit. All 5×FAD and 5×FAD × mAPPA673T samples were used, and one WT and
one mAPPA673T sample was included on each plate as a control.
2.7 Quantification of APP and APP Fragments by Immunoblotting
S1 RIPA-soluble samples were used for immunoblotting (4
µg/µL in RIPA buffer including protease and phosphatase
inhibitors + AEBSF). All chemicals were purchased from Merck Millipore
(Burlington, MA, USA) if not otherwise stated. In brief, protein extracts were
mixed with 4 Laemmli sample buffer (Bio-Rad Laboratories, Hercules, CA, USA,
#1610747) and incubated for 15 minutes at 37 °C. Twenty µg
protein per lane was loaded onto stain-free 4–15% gradient glycine gels
(Bio-Rad Laboratories #4568086) and a protein standard (Bio-Rad Laboratories #
1610376) was loaded onto each gel as molecular weight (MW) marker. Proteins were
separated in Tris-glycine-buffer (192 mM glycine, 25 mM Tris and 0.9% (w/v) SDS)
at 100 V for around 2 hours on ice using a Mini-PROTEAN Electrophoresis Cell
(Bio-Rad Laboratories). Proteins were transferred to methanol-activated PVDF
membranes (Bio-Rad Laboratories #1620177) at 5V for 30 minutes in Towbin
transfer buffer (25 mM Tris, 200 mM glycine, 0.1% (w/v) SDS and 20% (v/v)
ethanol). Membranes were then blocked for 1 h at RT in blocking solution (4%
(w/v) BSA) in TBS-T (TBS with 0.2% (v/v) Tween-20) and incubated overnight at 4
°C in 5 mL primary antibody (Table 2) diluted in blocking solution. The
next day, membranes were washed 3 10 minutes in TBS-T and incubated
for 1 h at RT in 25 mL secondary antibody (goat anti-mouse IgG, Bio-Rad
Laboratories #5178-2504, or goat anti-rabbit IgG, Bio-Rad Laboratories
#5196-2504, 1:5000) diluted in blocking solution containing StrepTactin-HRP
conjugate (Bio-Rad Laboratories #1610381; 1 µL conjugate per 100 mL
blocking solution). After washing 3 10 minutes in TBS-T, membranes
were overlaid for 1 min with ECL solution (Bio-Rad Laboratories #1705061). The
chemiluminescence signals were detected by the ChemiDoc Imaging System and the
Image Lab software (ChemiDoc™ XRS+ Imaging System (Bio-Rad Laboratories #1708255)) and normalised to protein loading signals using Coomassie Blue
stain (0.1% Coomassie in 20% acetic acid and H2O). A mixture of all
samples was included on each gel for between-gel normalization.
Table 2.
List of antibodies.
| Antibody |
Species/Types |
Immunogen |
Supplier |
ID |
Dilution |
| 2B3 |
Mouse monoclonal |
Synthetic peptide in C-terminus portion of human sAPP |
IBL |
11088 |
1:500 |
| Poly8134 |
Rabbit polyclonal IgG |
Soluble fragment cleaved N-terminal to the -secretase cleavage site of APP |
Biolegend |
813401 |
1:1000 |
| CT695 |
Rabbit polyclonal |
Synthetic 22 amino acid peptide at APP C-Terminus |
Invitrogen |
51-2700 |
1:1000 |
Primary anti-A antibodies used for immunoblotting.
APP, amyloid precursor protein.
2.8 Data Analysis
No a priori exclusion criteria were set. However, some immunohistochemistry
(IHC) samples were excluded due to tissue damage during sectioning or lack of
staining possibly due to sample preparation errors, and additionally some samples
were excluded after immunoblotting due to damage of the gel. Details are
specified in the respective sections below. Data were analysed and graphs
generated in R (Version 4.4.3, R Core Team, Vienna, Austria) using linear models
or generalized linear models and analysed using 2- or 3-Way ANOVA or Wald
2 tests. Where appropriate, post-hoc tests were performed using
Bonferroni correction. For 6E10 and NeuN IHC staining, males and females were
analysed separately and the effects of brain region, genotype and their
interaction on each parameter were assessed. For each analysis, it was first
determined whether data met assumptions for normality or if any data
transformations were necessary. Data met necessary assumptions after
transformation using either simple methods (square root, log) or more advanced
methods (Box-Cox or Yeo-Johnson transformation). As IHC was performed over
several days, a nuisance factor “Staining Day” was included in statistical
models if it had a significant effect on the variable being analysed. Total
6E10-positive area showed a significant nuisance factor effect in both males and
females. Meanwhile in the analysis of plaque parameters, NeuN and GFAP positive
area, the staining day showed only a weak or non-significant effect and was
therefore excluded as a factor. A similar approach was taken for ELISA data,
where the effects of sex, genotype and their interaction on protein levels were
assessed. Data were first tested for necessary assumptions and transformed if
necessary. For A and tau ELISA, data were transformed using either
simple or more advanced methods (see above) while synaptic protein data already
met assumptions for two-way ANOVA. Due to the large number of samples multiple
ELISAs were performed, which in part were from different lots and performed on
different days. This was accounted for by inclusion of a nuisance factor where
necessary. Nuisance factor was included in S1 A42 and analysis of
synaptic proteins. Western blot data were analysed using one-way ANOVA with
factor genotype following data transformation where necessary (for details, see
figure legends). All statistical outcomes are reported based on linear or
generalised linear models of transformed data, but figures show untransformed
data. Due to a sample preparation error, one sample (female WT) had to be excluded
from SYP and SNAP25 ELISA. No other samples or data points were excluded from
analysis. For each genotype and sex Pearson correlation matrices were generated
from A ELISA and A IHC data and compared visually and
statistically using the Jennrich test [40] to determine if the matrices were
significantly different from each other. To determine whether the level of
soluble or insoluble A42/A40 affected plaque counts and whether
this effect varies between genotypes, generalized linear modelling was used.
Negative binominal models were used and nested models (with or without
interaction/factors) were compared using likelihood ratio tests to determine
significance of each main effect (A42/A40 ratio and genotype)
and interaction. Similarly, linear modelling was applied to determine the effect
of A42/A40 ratio on plaque area and whether this differs
between genotypes. All data are presented as mean standard deviation
(SD) and alpha was set to p 0.05.
3. Results
We have experienced increased mortality in female 5×FAD mice during cohort aging
(data not shown). The survival rate (until tissue harvest) was lowest in female
5×FAD (57%) compared to all other genotypes/sexes (between 80 and 100%). The
remaining experimentally used mice were generally in good health when they were
investigated at the age of 6 months (normal activity, no piloerection etc.).
Furthermore, body weights differed considerably between genotypes
(FGenotype(3,63) = 4.86, p = 0.0042) and sexes (Fsex(1,63) =
133, p 0.0001). In male cohorts, 5×FAD and 5×FAD × mAPPA673T were
generally lighter than WT and mAPPA673T mice (WT: 35.23 2.59 g;
mAPPA673T: 35.80 3.76 g; 5×FAD: 32.47 3.43 g;
5×FAD × mAPPA673T 33.79 3.83 g). This was also the case in female
cohorts (WT: 25.98 0.82 g; mAPPA673T: 26.93 2.55 g; 5×FAD:
22.60 1.45 g; 5×FAD × mAPPA673T 23.20 0.84 g).
3.1 Icelandic Mutation and A Pathology
We proceeded to assess via IHC whether the introduction of the Icelandic
mutation in a 5×FAD background changed A levels using the monoclonal
antibody 6E10. This antibody is widely used in AD research; it recognises APP
fragments that contain the A sequence (including full-length
A40 and A42, as well as smaller fragments when used during
immunoblotting) and is expected to label both intracellular and extracellular
deposits of APP and A. Representative micrographs of male 5×FAD and
5×FAD × mAPPA673T (Fig. 1A), female 5×FAD and 5×FAD × mAPPA673T (Fig. 1B),
as well as WT and mAPPA673T mice (Supplementary Fig. 1A) reveal
uniform and punctate cytosolic staining (Fig. 1A,B & Supplementary Fig.
1A, black arrowheads) and frequent nuclear as well as occasional axonal/
dendritic staining (Fig. 1A,B & Supplementary Fig. 1A, white
arrowheads). In WT and mAPPA673T mice (Supplementary Fig.
1A), there were abundant 6E10-positive neurones across all cortical layers in
visual cortex and PFC and especially in the pyramidal cell layer of CA1 and
granular cell layer of DG. Fewer 6E10-positive cells were found in other CA1 and
DG layers as well as in the hilus. In CB granule cell layer showed widespread
cytoplasmic labelling while fewer positive cells were seen in the molecular
layer. Additionally, large Purkinje cells were also frequently positive for 6E10
labelling. A similar cytosolic and axonal/ dendritic staining was also seen in
5×FAD and 5×FAD × mAPPA673T (Fig. 1A,B).
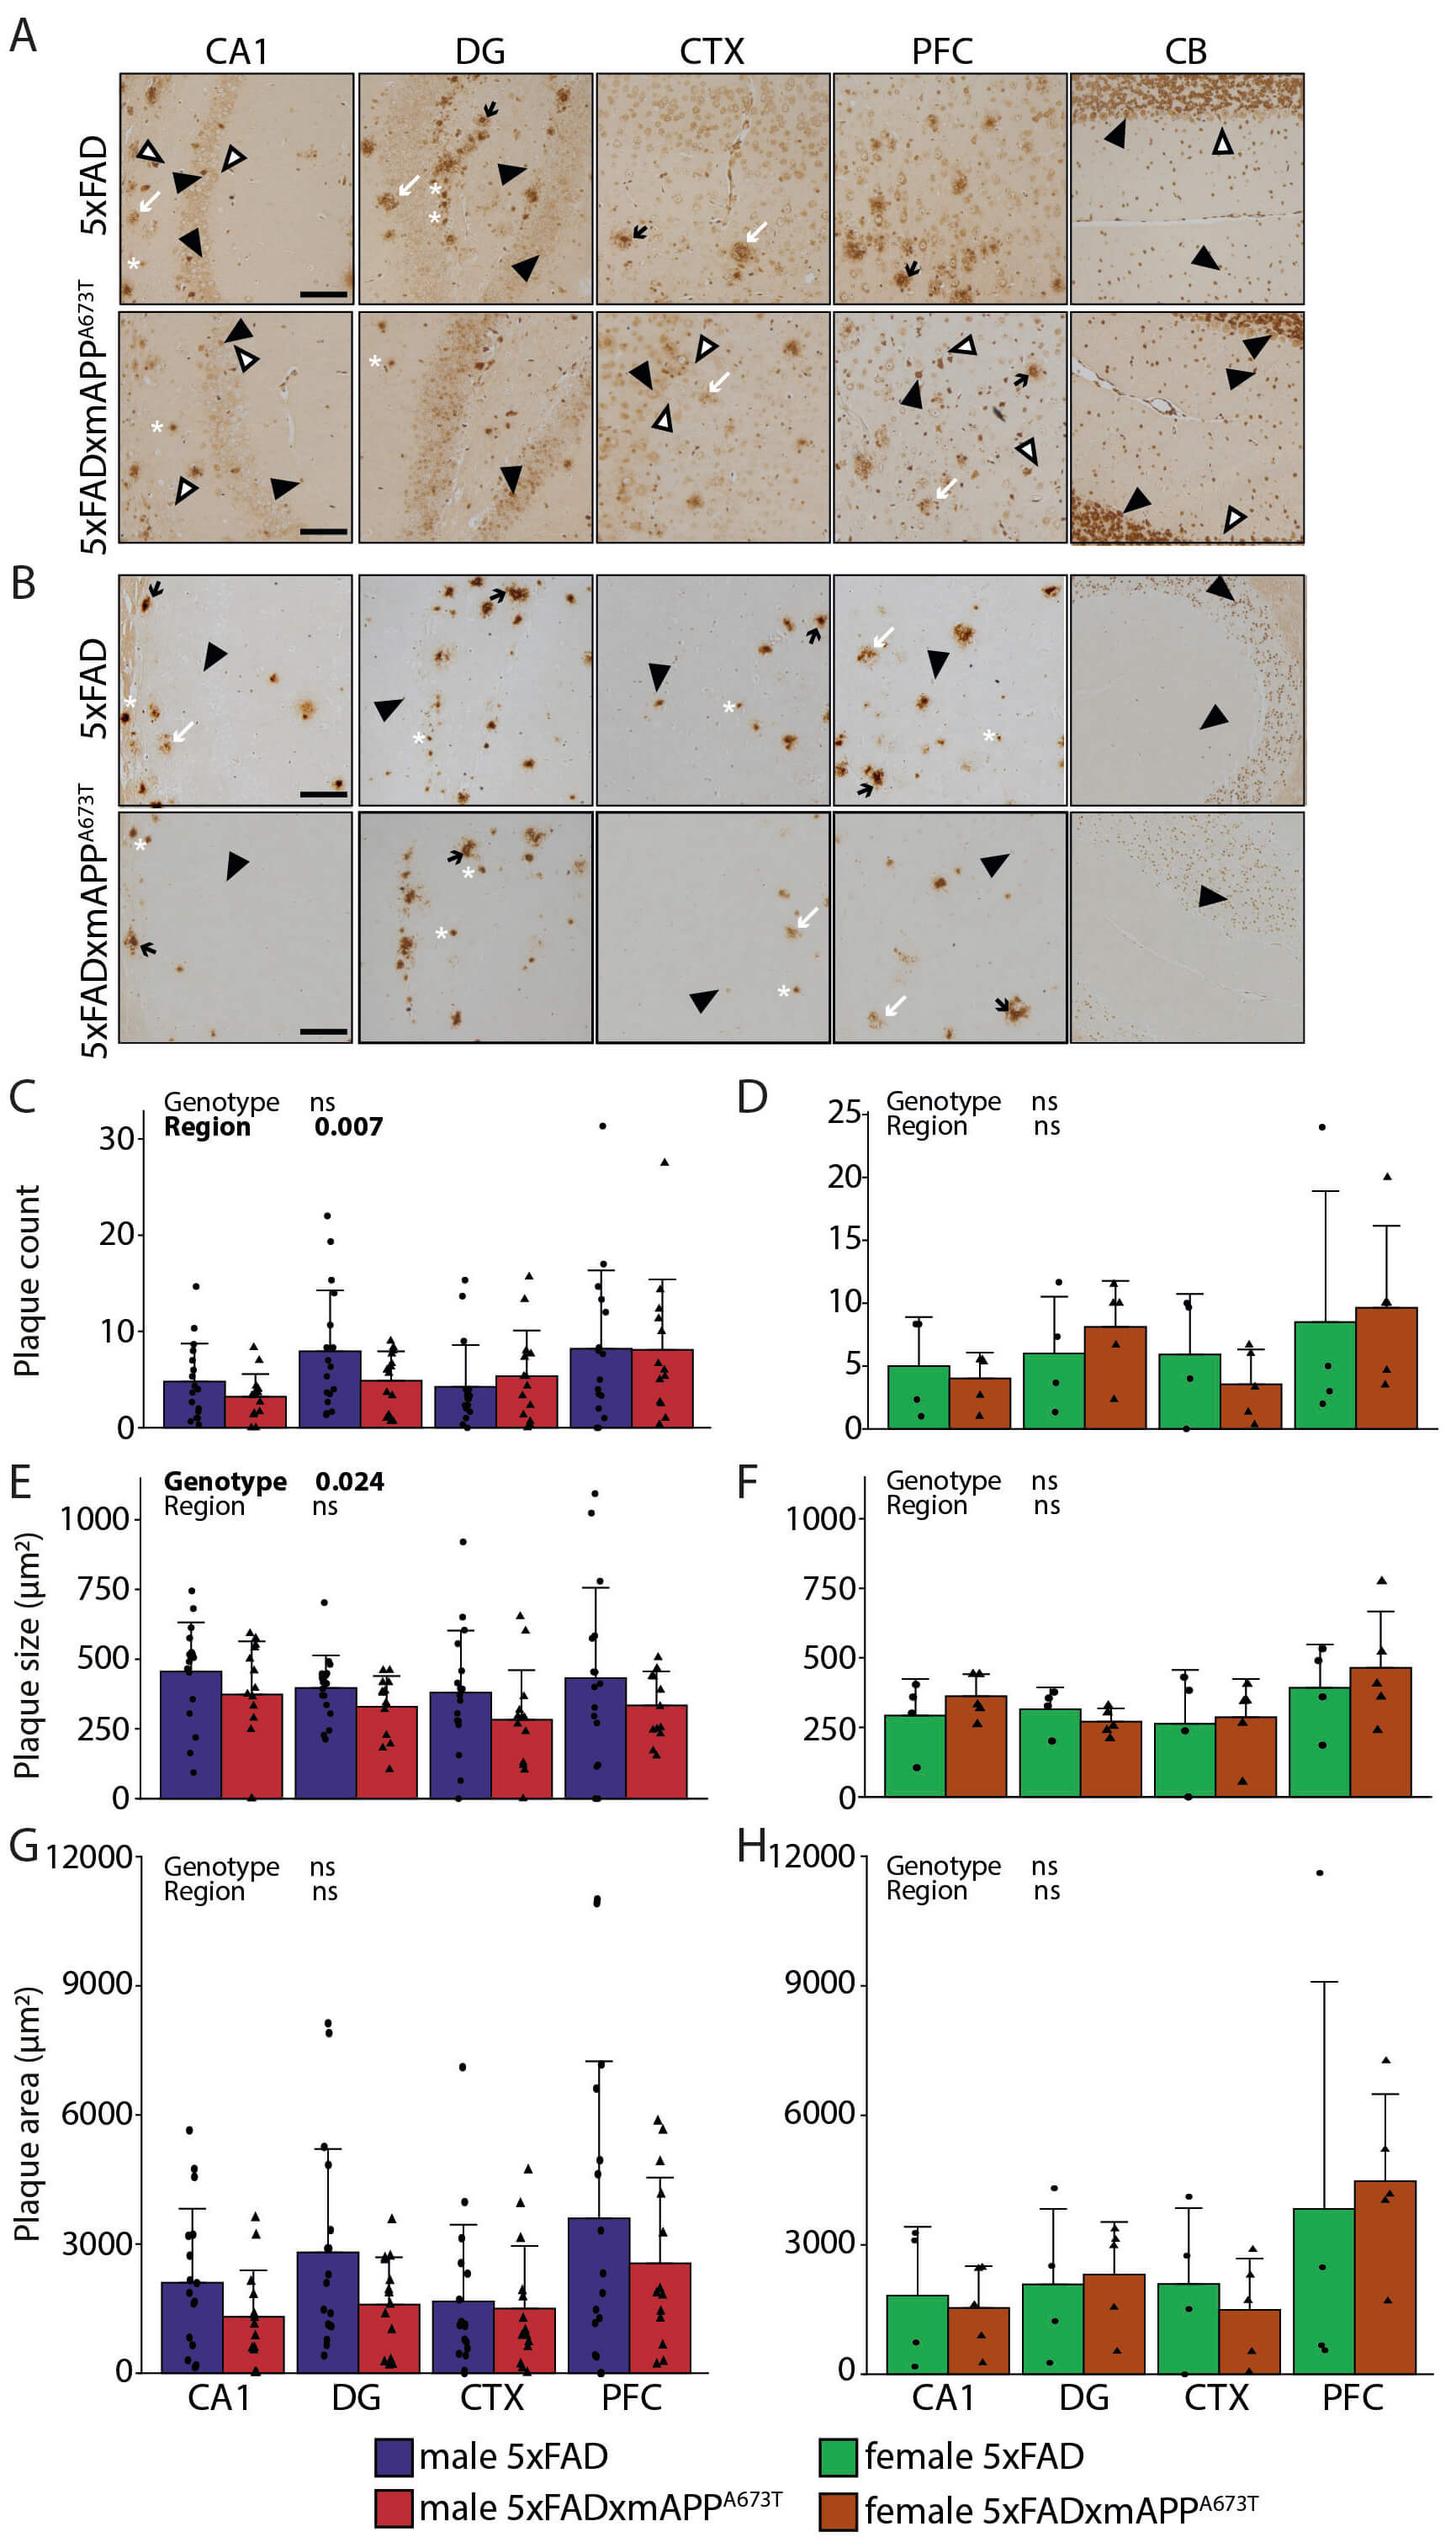 Fig. 1.
A immunohistochemistry using the antibody
6E10. Representative A immunohistochemistry images of brain sections of
male (A) and female (B) 5×FAD and 5×FAD × mAPPA673T mice stained with the
antibody 6E10 (Biolegend # 803004, diluted 1:1000). Images from CA1, DG, CTX and
PFC were taken using a light microscope at a 100 magnification.
Black arrowheads, cytosolic staining; white arrowheads, axonal/dendritic
staining; black arrows, dense core plaques with halo; white arrows, small dense
plaques with no/little halo; asterisk, diffuse plaques; scale bars, 100
µm. 6E10 labelling was quantified using ilastik for plaque counts
(C,D), plaque size (E,F) and plaque area (G,H) in male and female 5×FAD and
5×FAD × mAPPA673T mice in four brain regions. Data is shown as individual
values, group mean, and S.D. Statistical analysis entailed Wald 2
test (C,D) or two-way ANOVA (E–H) with genotype and region as independent
variables. Significance of each factor and the interaction is indicated above
each graph. No data transformation was performed for plaque counts (C,D) while
size and area were Box-Cox (E,F,H) or square-root transformed (G). Males: 5×FAD:
n = 17 (PFC n = 16), 5×FAD × mAPPA673T: n = 14 (PFC n = 13). Females: 5×FAD: n
= 4, 5×FAD × mAPPA673T: n = 5. Abbreviations: CA1, hippocampal CA1; CTX,
visual cortex; DG, dentate gyrus; ns, not significant; PFC, prefrontal cortex;
5×FAD, 5× familial Alzheimer’s disease; APP, amyloid precursor protein; SD,
standard deviation.
Extracellular A deposits were absent in WT and mAPPA673T mice
(Supplementary Fig. 1A), but 5×FAD and 5×FAD × mAPPA673T mice of both
sexes showed abundant extracellular A deposits (Fig. 1A,B). These
consisted of characteristic A plaques with an intensely labelled core
and a fainter diffuse halo (Fig. 1A,B, black arrows). In addition, deposits of
smaller, intensely labelled core-only plaques with little to no halo (Fig. 1A,B,
asterisk) and less intensely labelled diffuse plaques with no discernible core
(Fig. 1A,B & Supplementary Fig. 1A, white arrows) were identified. All
three types of plaques were found in hippocampal and cortical areas in 5×FAD and
5×FAD × mAPPA673T, but none were seen in CB (Fig. 1A,B). Plaque number, size
and area were measured to quantify extracellular A deposits. These three
parameters differed significantly between the four genotypes, confirming the
A plaque pathology phenotype in 5×FAD and 5×FAD × mAPPA673T male and
female crosses (Supplementary Fig. 1B–G, p values
0.001). When the total 6E10 signal was quantified, these genotype differences
persisted only in female but not male cohorts (Supplementary Fig. 1H, p not significant in males and Supplementary Fig. 1I, p 0.001 in females). However, while the number of
plaques was similar between 5×FAD and 5×FAD × mAPPA673T male (Fig. 1C) and
female mice (Fig. 1D), male 5×FAD × mAPPA673T had significantly smaller
plaques than male 5×FAD (Fig. 1E, FGenotype(1,114) = 5.24, p =
0.024), but no genotype-related differences were measured for this parameter in
female cohorts (Fig. 1F). The plaque area was also similar between genotypes in
male (Fig. 1G) and female mice (Fig. 1H). Finally, the number of plaques varied
significantly between brain regions in male 5×FAD and 5×FAD × mAPPA673T males
(Fig. 1C, 2Brain Region(3) = 12.14, p = 0.007), where
significantly more plaques were counted in PFC than in CA1 (post-hoc test
p = 0.009).
In summary, we have confirmed the A plaque pathology phenotype in 5×FAD
and 5×FAD × mAPPA673T male and female cohorts and show, for males, that the mA673T mutation significantly decreases the size of A plaques in
5×FAD × mAPPA673T crosses compared to 5×FAD.
Given this significant reduction of A plaque size in male
5×FAD × mAPPA673T crosses, we further explored, using ELISA, whether this led
to changes in soluble and insoluble A40 and A42 isoforms (Fig. 2). While all 5×FAD and 5×FAD × mAPPA673T samples were measured, only one WT
and one mAPPA673T samples were included. Both presented with very low
signals, or signals below detection thresholds and confirmed the specificity of
the ELISA assays for human A (data not shown). Female 5×FAD and
5×FAD × mAPPA673T crosses had almost twice as much soluble A40 than
their male counterparts (Fig. 2A, Fsex(1,36) = 12.77, p = 0.001),
and this was also the case for soluble A42 (Fig. 2B, Fsex(1,35) =
8.35, p = 0.007), while the A42/A40 ratio was similar
between cohorts (Fig. 2C). Similarly, females of both genotypes had more
insoluble A40 (Fig. 2D, Fsex(1,36) = 7.67, p = 0.008), and
A42 (Fig. 2E, Fsex(1,36) = 8.02, p = 0.007), but again a
similar A42/A40 ratio (Fig. 2F) compared to their male
counterparts. Neither soluble, nor insoluble A40 and A42 nor
their ratios differed between 5×FAD and 5×FAD × mAPPA673T crosses, but a trend
towards reduction for A42/A40 in S2 was observed for
5×FAD × mAPPA673T compared to 5×FAD (Fig. 2F, FGenotype(1,36) = 3.31,
p = 0.077).
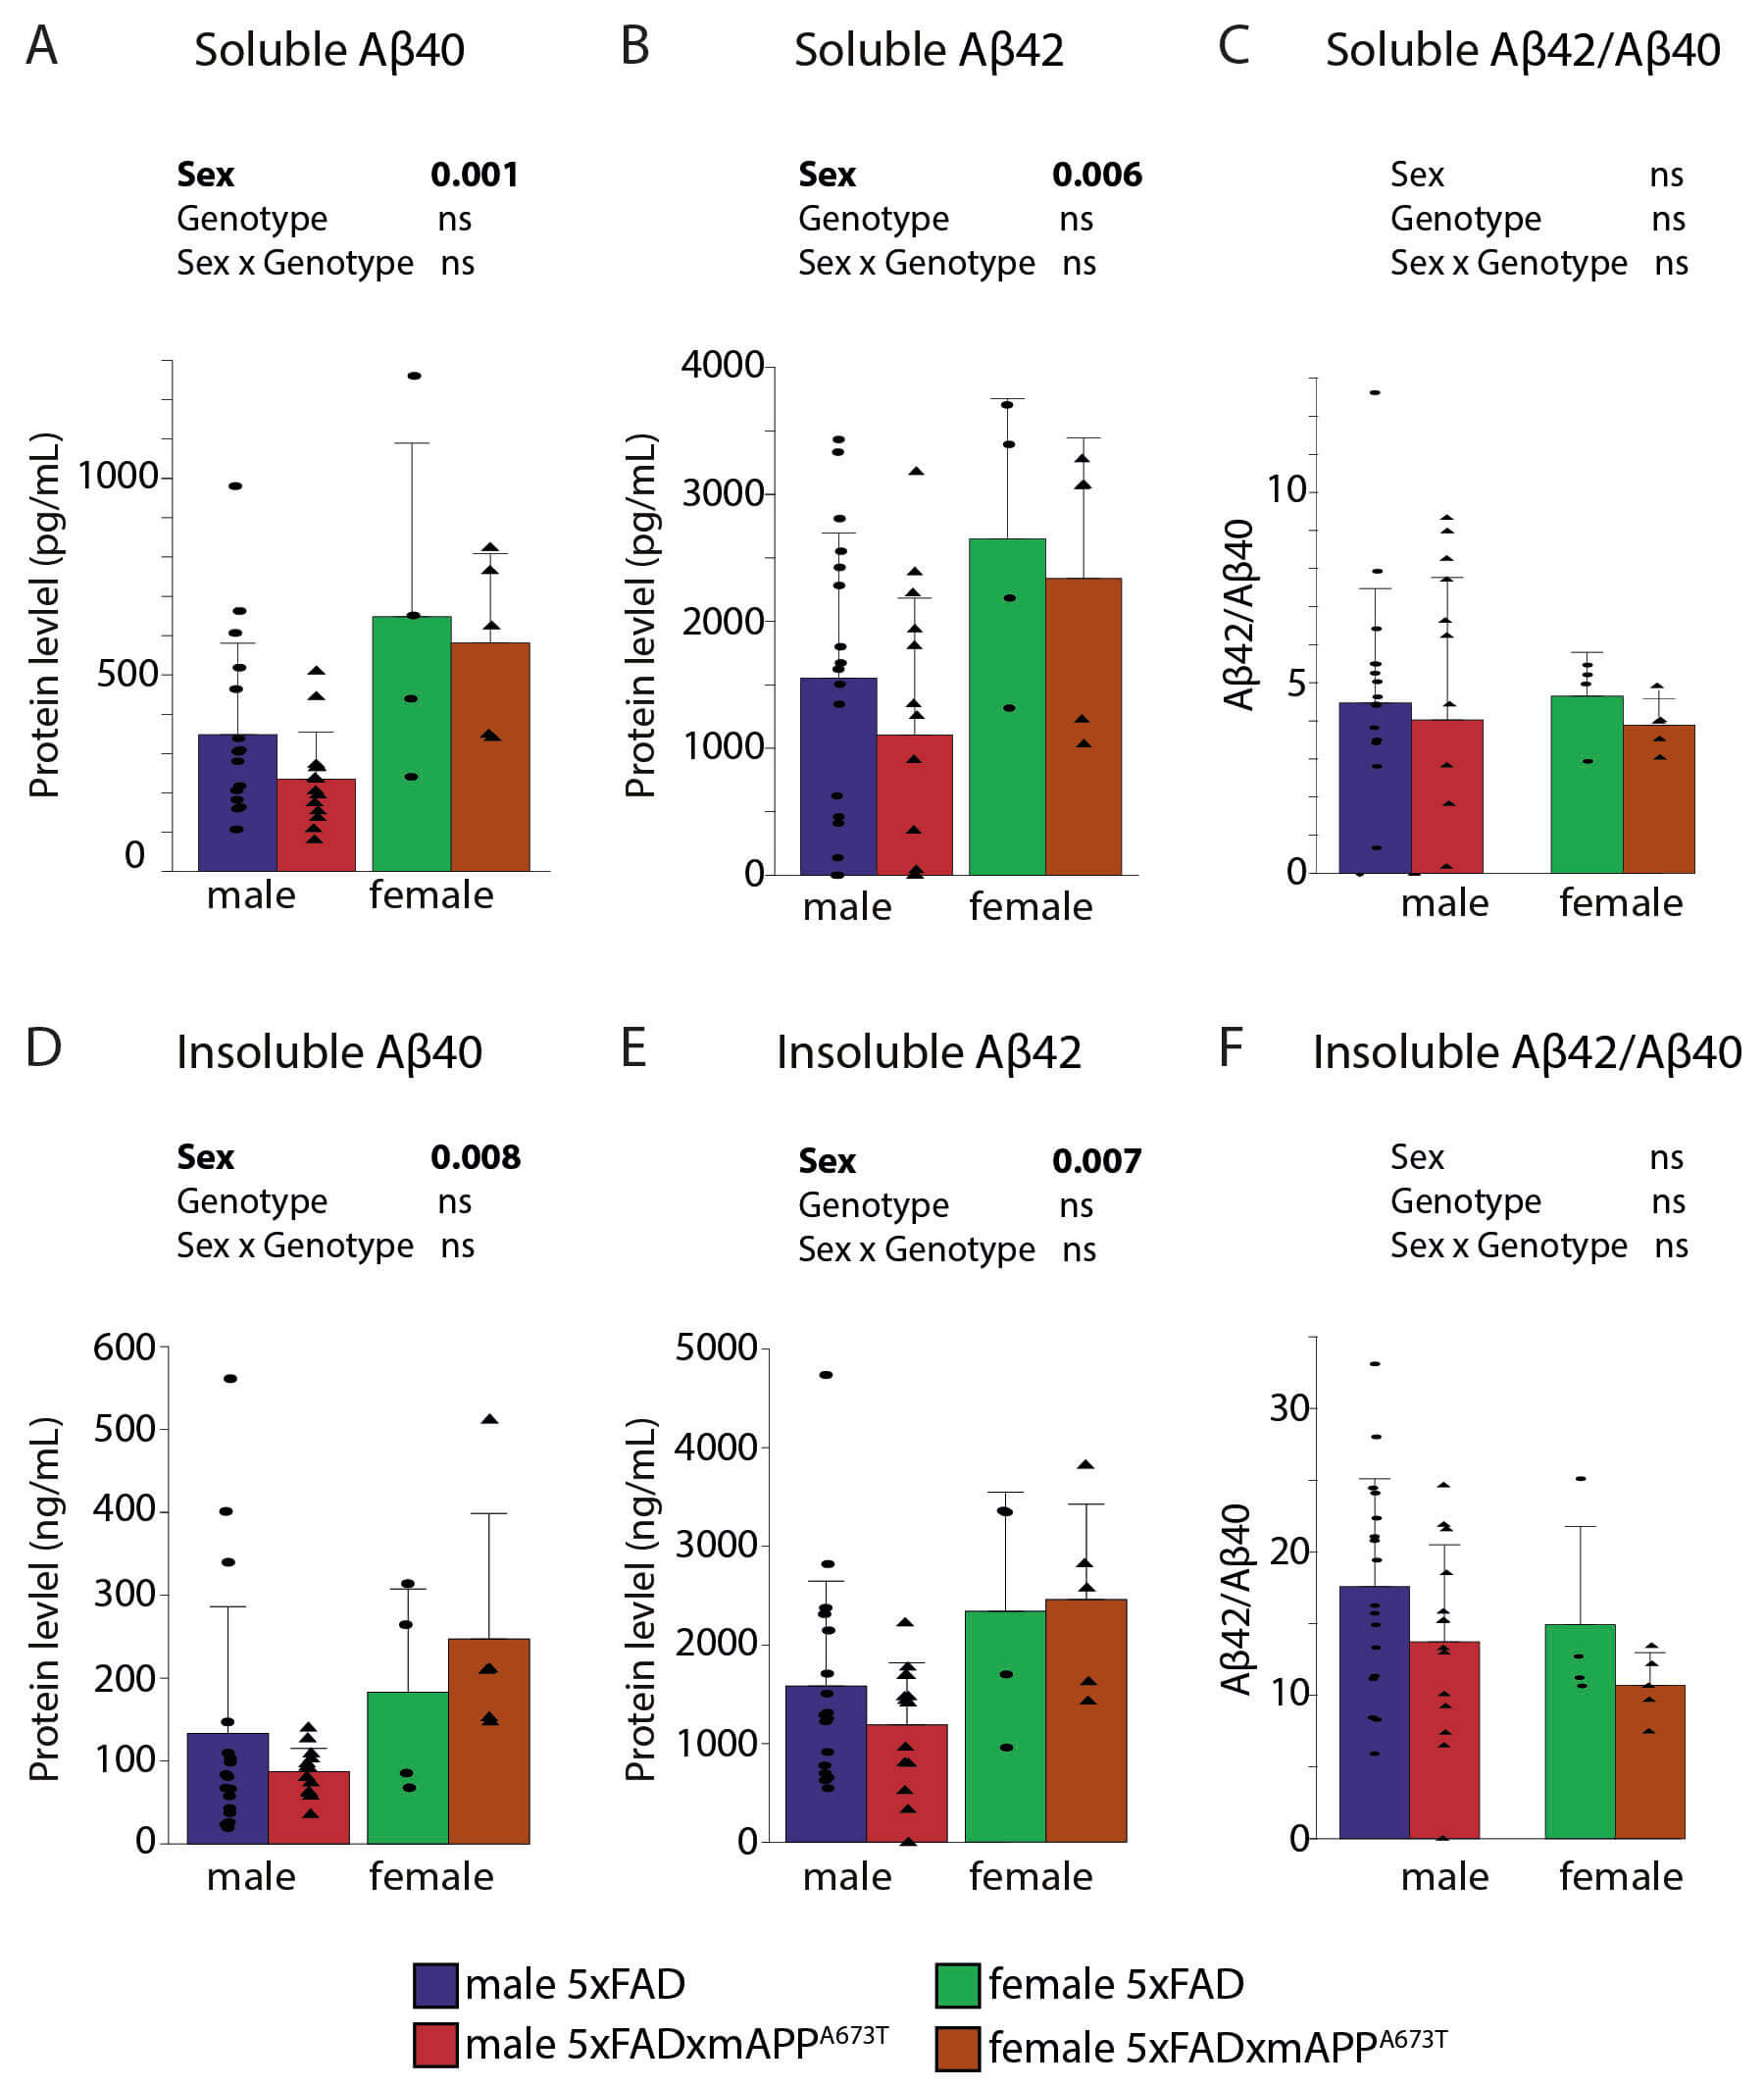 Fig. 2.
Quantification of soluble and insoluble A. Human
A40 and A42 and
A42/A40 ratios were quantified in RIPA-soluble (A–C) and
insoluble fractions (D–F) in male and female WT, mAPPA673T, 5×FAD and
5×FAD × mAPPA673T mice. Data were analysed using two-way ANOVA with sex and
genotype as independent variables. Significance of each factor and the
interaction is indicated above each graph. Ratios did not require data
transformation and remaining data were transformed using Yeo-Johnson (A,D) or
Box-Cox (B,E) transformation. Data is shown as individual values, group mean, and
S.D. Males: 5×FAD: n = 17, 5×FAD × mAPPA673T: n = 14. Females: 5×FAD: n = 4,
5×FAD × mAPPA673T: n = 5. One wild-type and one mAPPA673T were included
on each ELISA plate as a control (see Methods). Abbreviations: ns, not
significant; WT, wild type.
We next investigated A, APP, and its metabolites using immunoblotting
to assess whether the murine A673T mutation would shift the processing of the
human isoforms from the amyloidogenic to the non-amyloidogenic pathway (Fig. 3
and additionally see Supplementary Fig. 2 for uncropped images of the
complete cohort). We have used three different anti-APP/A antibodies
(Table 2) on male cohorts as only these returned genotype-specific differences
for A plaques (Fig. 1).
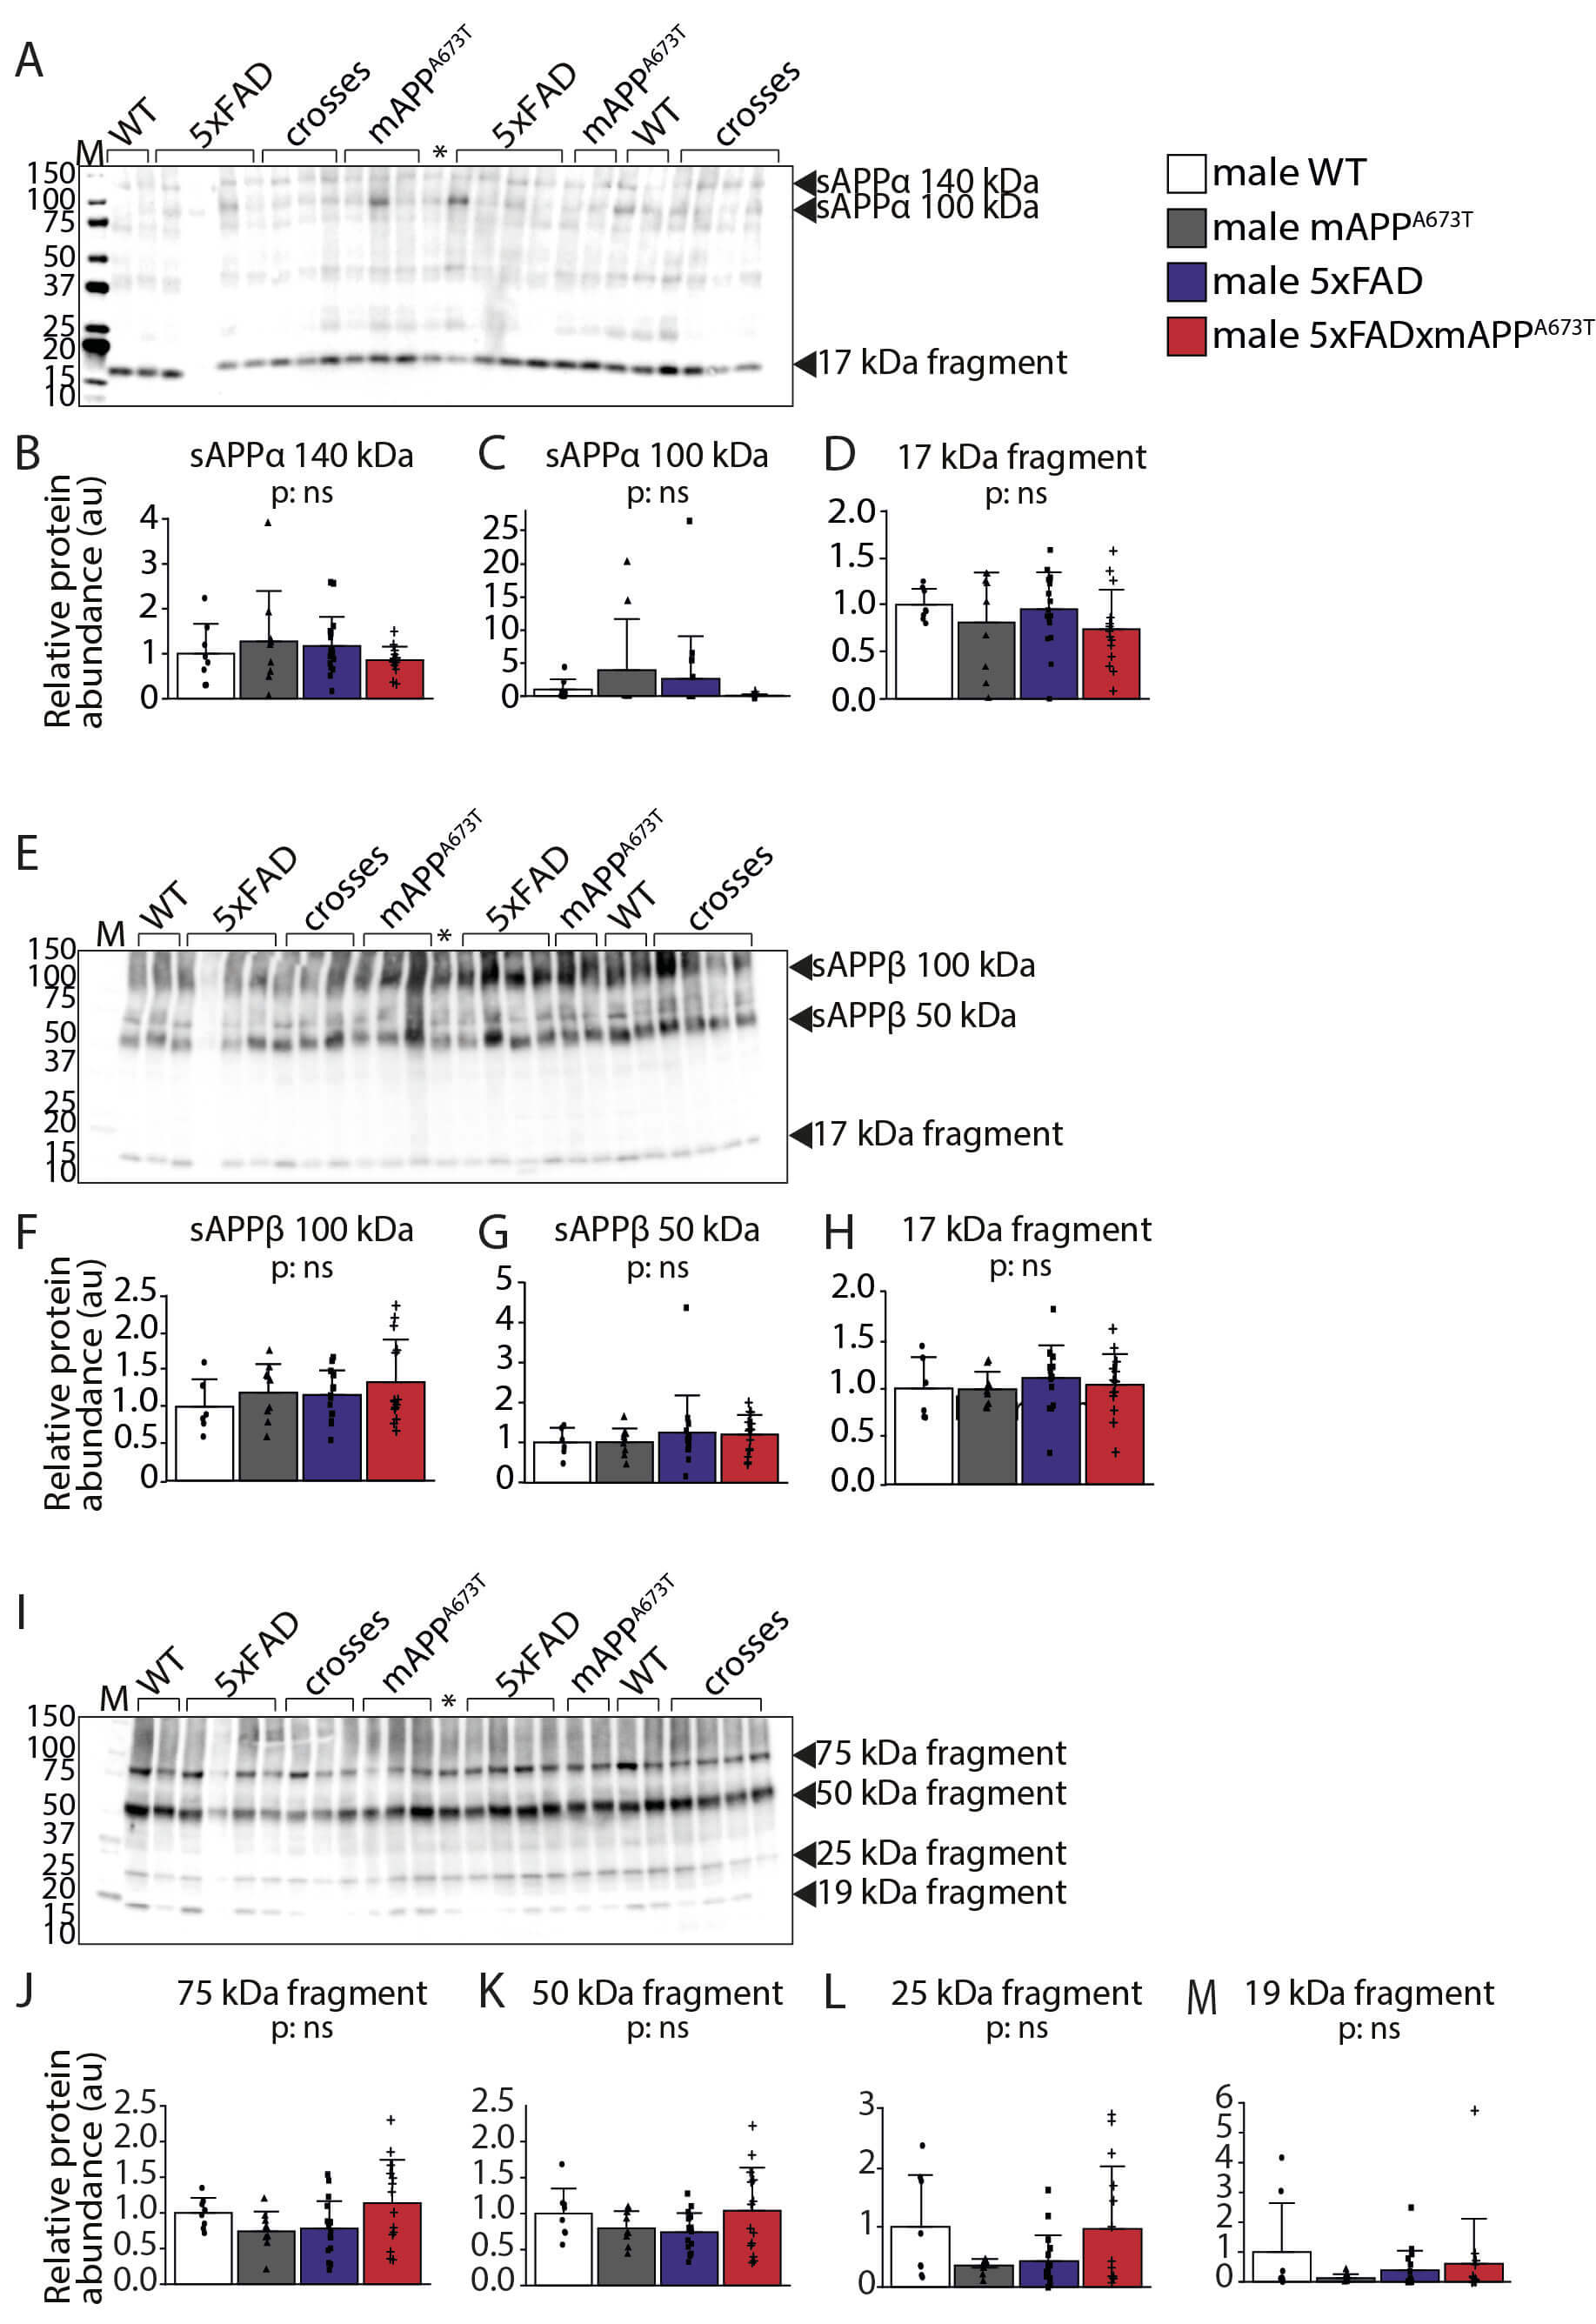 Fig. 3.
Quantification of APP/A species using
immunoblotting. Proteins from RIPA-soluble S1 fractions were separated by
SDS-PAGE (20 µg per lane) and labelled with the antibody 2B3 against
sAPP (A), Poly8134 against sAPP (E), and CT695 against CTFs
(I). Densitometric quantification of the bands of interest (arrowheads) was
conducted using the Image Lab software and normalisation to total protein
loading. For antibody 2B3, three bands at 10 kDa (B), 100 kDa (C) and 17 kDa (D)
were identified. For the antibody Poly8134, three bands were quantified at 100
kDa (F), the 50 kDa (G) and 17 kDa (H). The third antibody, CT695 revealed four
bands at 75 kDa (J), 50 kDa (K), 25 kDa (L) and 19 kDa (M). Data is shown as
individual values, group mean, and SD Data were analysed using 1-way ANOVA with
genotype as independent variable and significance is indicated above each graph.
No data transformation was required. Males: WT: n = 8 (n = 6 for Poly8134
antibody), mAPPA673T: n = 9, 5×FAD: n = 17 (n = 15 for Poly8134 antibody),
5×FAD × mAPPA673T: n = 14. Abbreviations: crosses, 5×FADx mAPPA673T; ns,
not significant; *: loading control.
The monoclonal antibody 2B3 is directed against the C-terminus of
human sAPP. Applying our immunoblotting protocol to RIPA-soluble S1
fractions, this antibody revealed three bands: two higher molecular weight bands
at around 140 and 100 kDa (sAPP-140 and sAPP-100), as well as
a 17-kDa fragment (Fig. 3A, see black arrowheads). The levels of these three
bands, however, was similar between genotypes (Fig. 3B–D). The second antibody,
Poly8134, is polyclonal and directed against APP.
It too revealed three bands: sAPP-100 (MW ~100 kDa),
sAPP-50 (MW ~50 kDa) and a 17-kDa fragment (Fig. 3E, see
black arrowheads), all of which were similar across the four genotypes (Fig. 3F–H). The third antibody, CT695, reacts with CTFs of
human APP and revealed four fragments: CTF75 (~75 kDa), CTF50
(~50 kDa), CTF25 (~25 kDa), and CTF19 (19 kDa,
Fig. 3I, see black arrowheads). Again, all these four bands were similar in
quantity between genotypes (Fig. 3J–M). All three antibodies revealed
considerable cross-reactivity for murine and human APP and their metabolites (e.g.,
similar bands for WT and 5×FAD mice), likely because mouse and human APP differ
by only three amino acids [41].
3.2 Icelandic Mutation, Tau and Synaptic Proteins
Given the synergetic and reciprocal regulatory effect of A and tau, and
their established role in inducing synaptic protein alterations in AD patients
and AD mouse models, we have further examined whether the A673T mutation in the
murine APP gene changes endogenous tau levels and/or rescue alterations of
synaptic proteins. Mouse tau and three synaptic proteins—SYP, SNAP25, and
STX1A—were measured using mouse-specific ELISAs (Fig. 4). Tau was similar
across genotypes and sexes (Fig. 4A), as were SYP (Fig. 4B) and SNAP25 (Fig. 4C,
all F values 1). STX1A however, was different between the 4 genotypes (Fig. 4D, FGenotype(3,62) = 3.1, p = 0.034), but none of the differences
reached statistical significance in post-hoc tests.
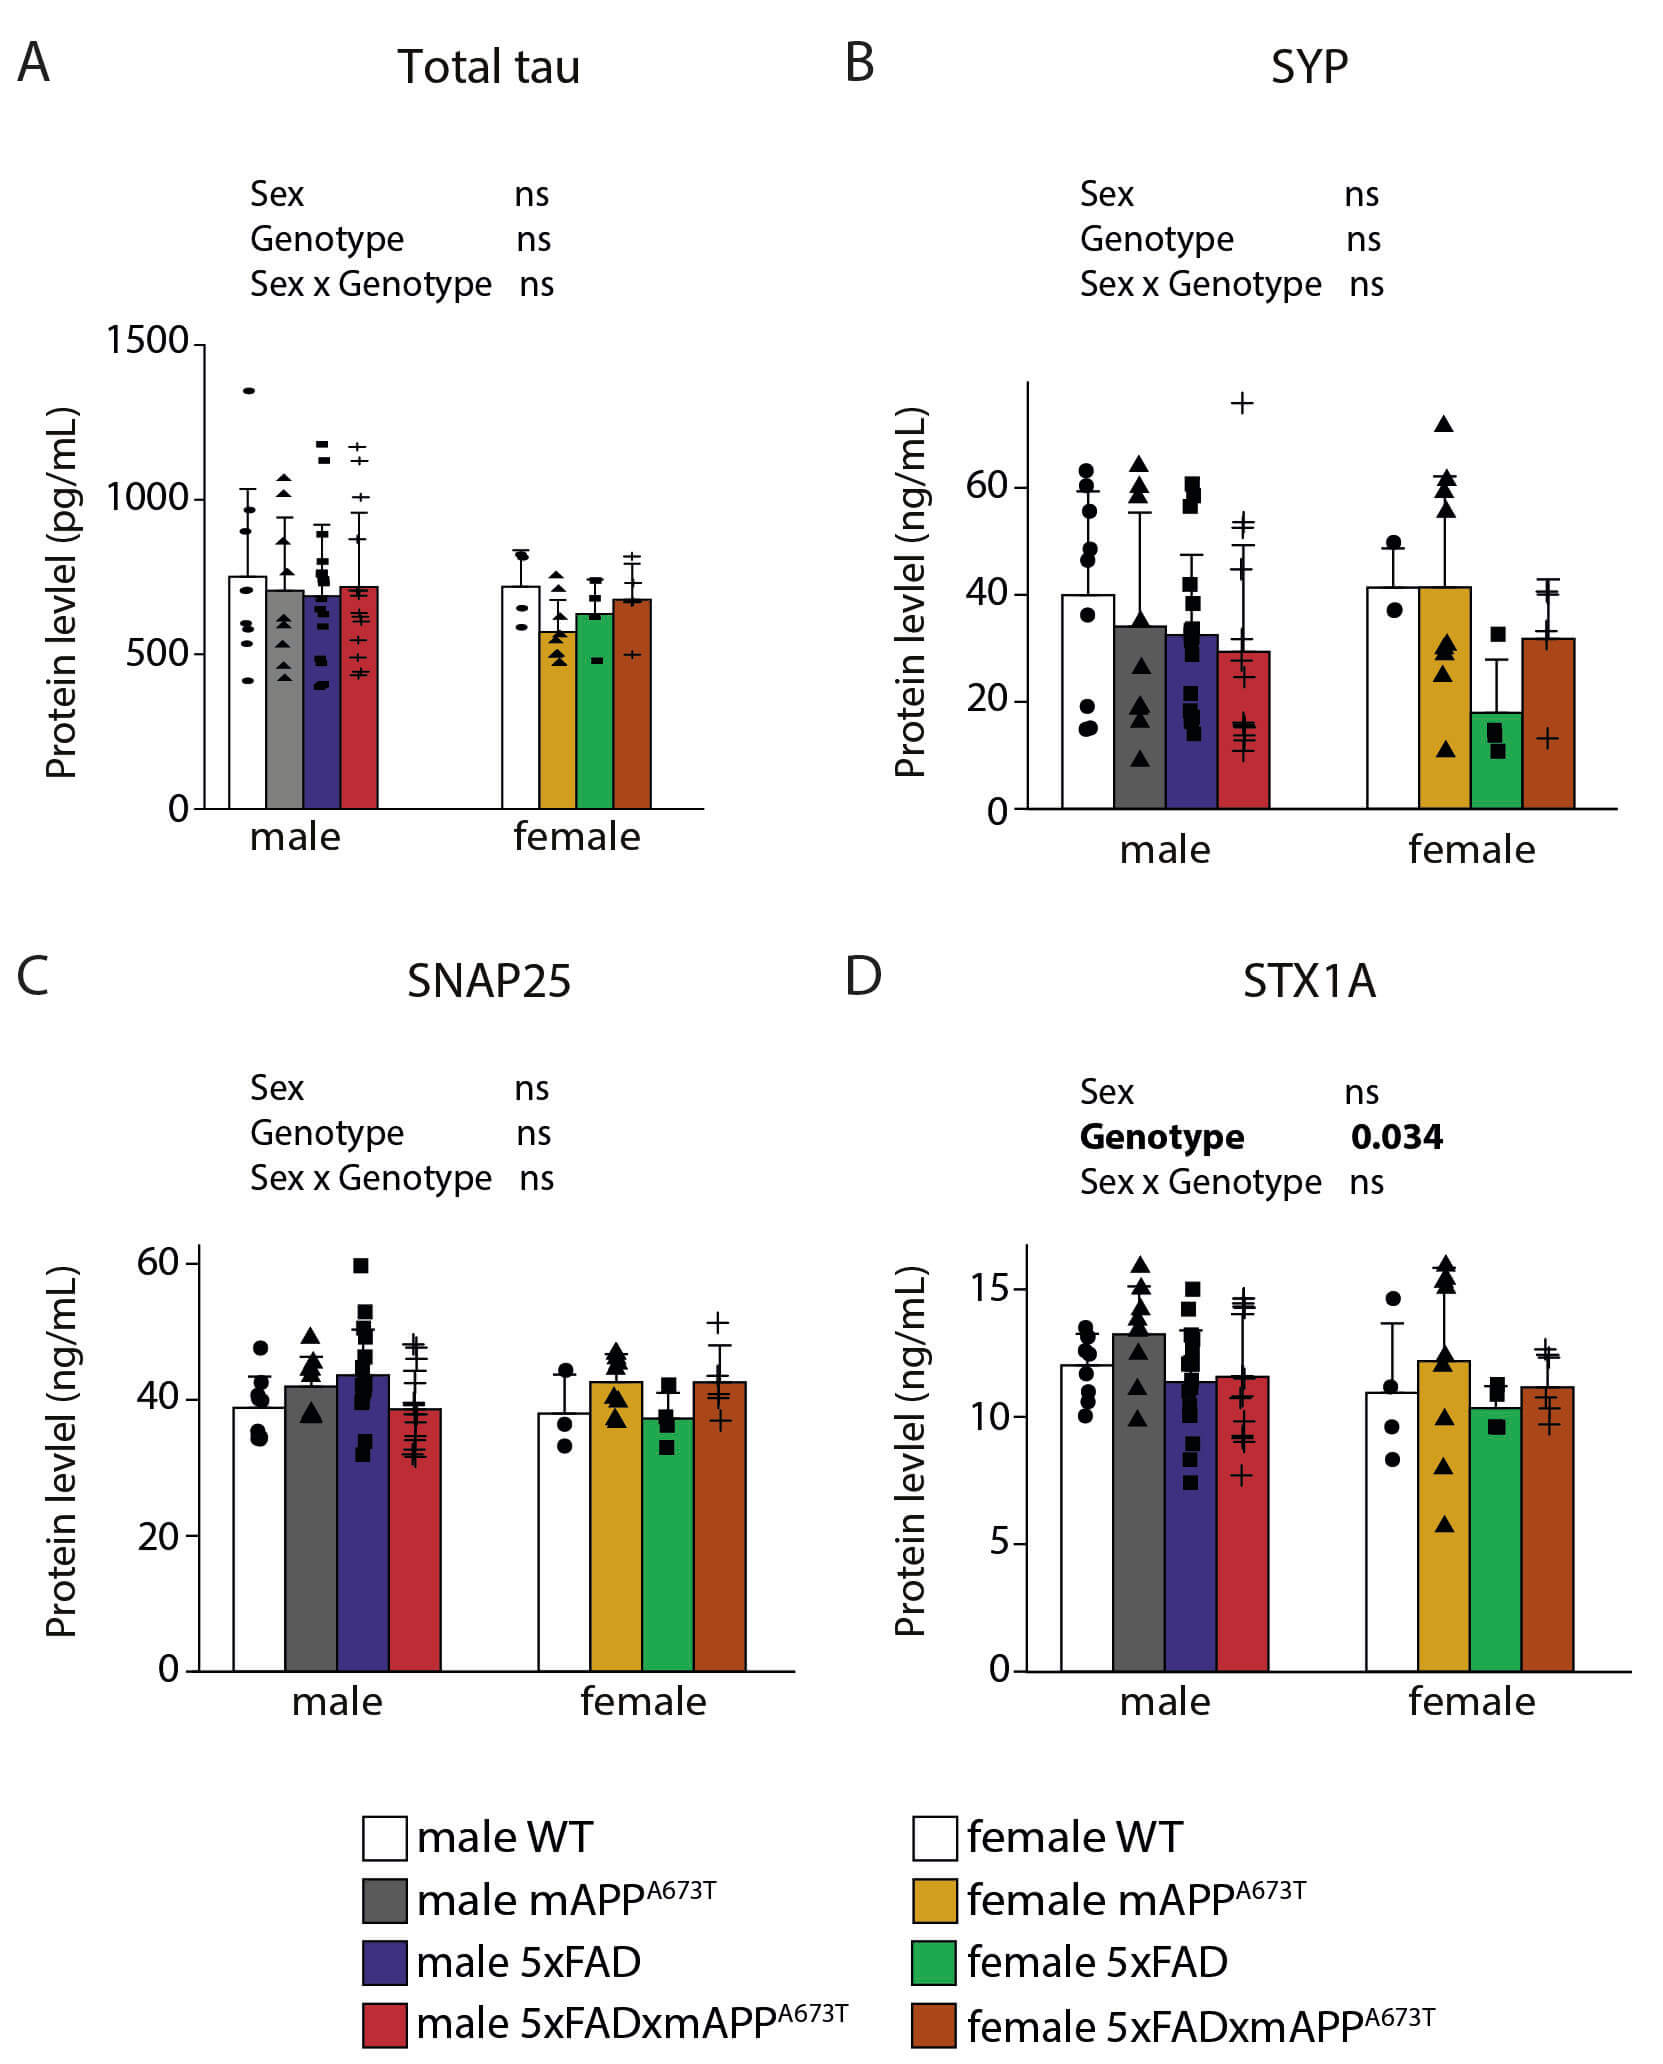 Fig. 4.
Quantification of tau and synaptic proteins. (A) Mouse tau, (B) mouse synaptophysin, (C) mouse synaptosomal associated protein 25kDa, and (D) mouse syntaxin 1A were quantified in RIPA-soluble S1 fractions
in male and female WT, mAPPA673T, 5×FAD and 5×FAD × mAPPA673T mice. Data
were analysed using two-way ANOVA with sex and genotype as independent variables.
Significance of each factor and the interaction is indicated above each graph. No
data transformation was needed. Males: WT: n = 9, mAPPA673T: n = 9, 5×FAD: n
= 17, 5×FAD × mAPPA673T: n = 14. Females: WT: n = 4 (SYP, SNAP25 n = 3),
mAPPA673T: n = 9, 5×FAD: n = 4, 5×FAD × mAPPA673T: n = 5. Abbreviations:
ns, not significant; SNAP25, synaptosomal associated protein 25kDa; STX1A,
syntaxin 1A; SYP, synaptophysin.
3.3 Icelandic Mutation and Prediction of Amyloid Pathology
Pearson correlations were generated for data from 5×FAD and 5×FAD × mAPPA673T
male and female mice. These correlation matrices included A pathology
(IHC and ELISA) and tau quantification (Supplementary Fig. 3, see
supporting information). Correlation matrices differed significantly between male
5×FAD and 5×FAD × mAPPA673T mice (Supplementary Fig. 3A,B, p 0.001, see supporting information). Although differences were obvious between
female 5×FAD and 5×FAD × mAPPA673T, sample sizes were too small to compare
correlation matrices statistically (Supplementary Fig. 3C,D, see
supporting information). Overall, there was a high degree of correlation for
A (IHC with ELISA), especially in 5×FAD males, while almost no
correlations were observed between A and tau in either genotype. When
only amyloid pathologies are correlated (Fig. 5A–D), we found that male 5×FAD
mice showed significant positive correlations between A40 and
A42 levels with plaque counts and plaque area which were almost entirely
absent in 5×FAD × mAPPA673T (Fig. 5A and Fig. 5B, see asterisks for
significant correlations). Additionally, 5×FAD males showed significant negative
correlations between A42/A40 ratio in S2 with plaque
counts/area. In female mice, the A42/A40 ratio in S1 fraction
correlated significantly with plaque count/area in 5×FAD mice, but this was not
the case in 5×FAD × mAPPA673T (Fig. 5C and Fig. 5D, see asterisks for
significant correlations).
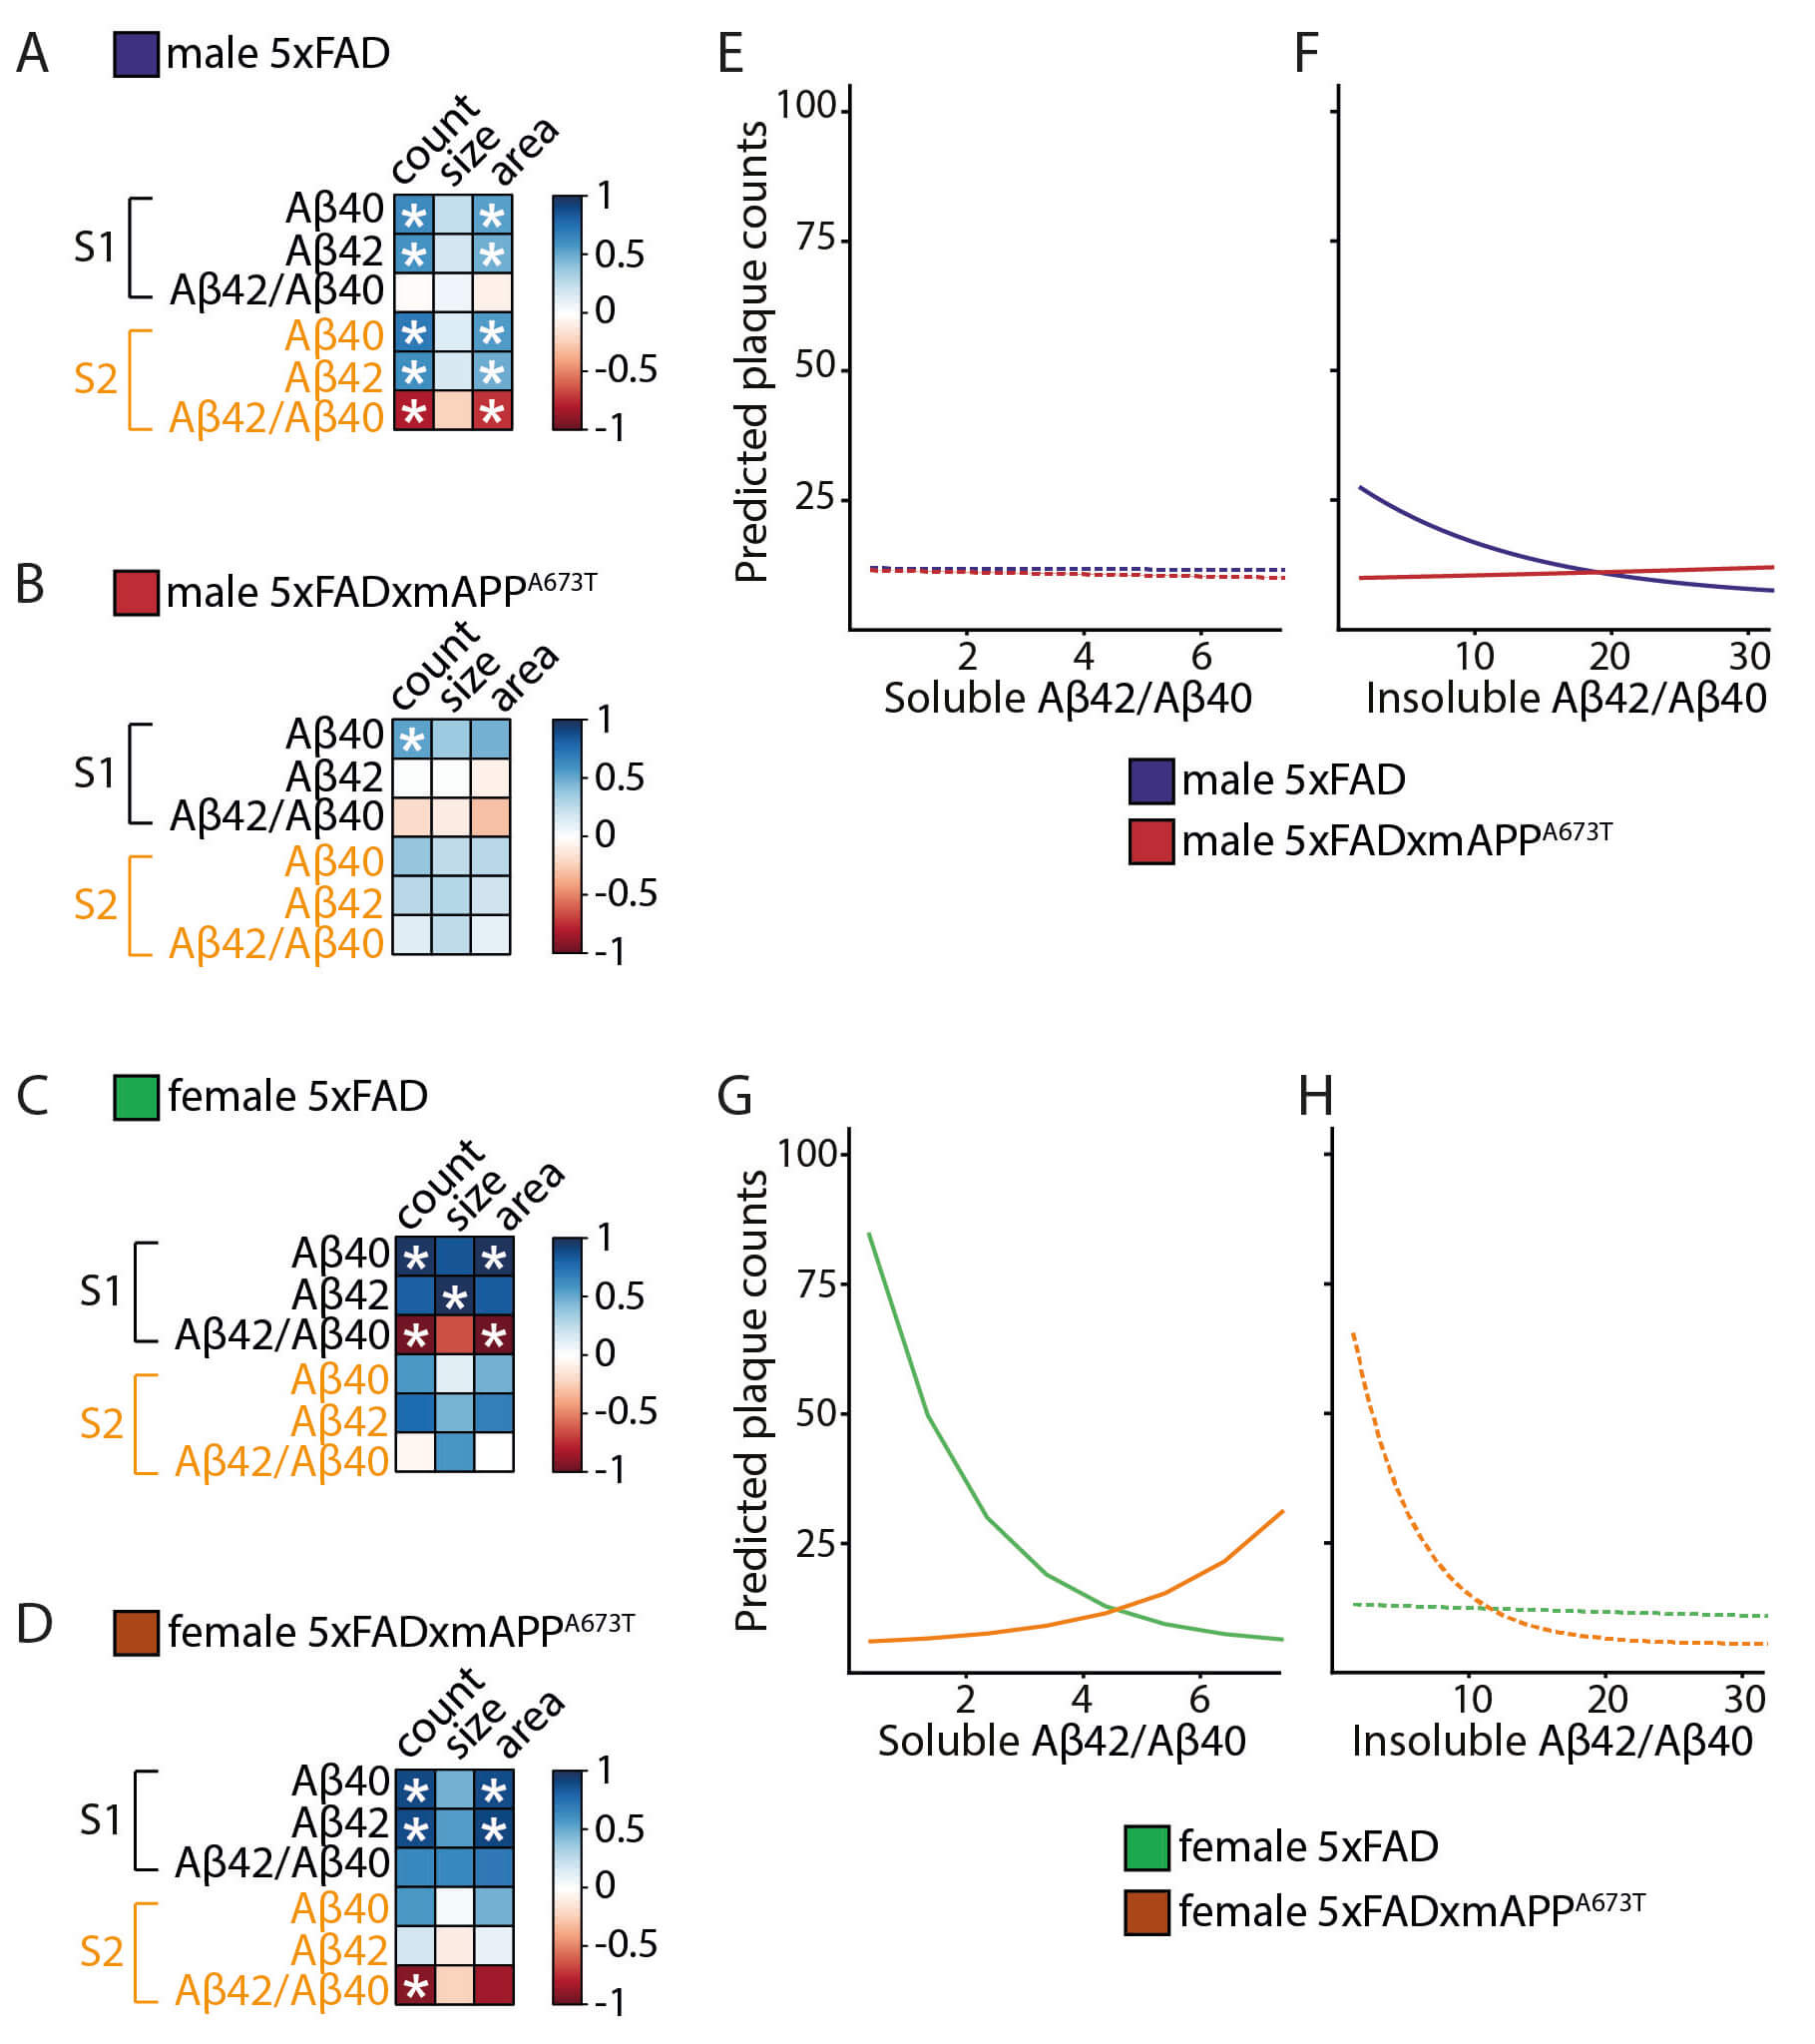 Fig. 5.
Correlation matrices and linear modelling for the different
A measurements. (A–D) Pearson correlation matrix between A40
and A42 levels and their ratio (A42/A40) in soluble
and insoluble fractions and plaque measurements (count, size, and area) are
displayed for 5×FAD male (A), 5×FAD × mAPPA673T male (B), 5×FAD female (C) and
5×FAD × mAPPA673T female (D) mice with blue for positive correlations, red for
negative correlations and white where no correlation was seen (* p
0.05). A levels were quantified using ELISA and plaque counts, size and
total area were quantified using immunohistochemistry (averaged across brain
regions). Data were analysed using Jennrich test to detect differences between
matrices. (E–H) Generalized linear modelling to explore the effect of
A42/A42 ratio in S1 and S2 on plaque counts and whether this
differed across genotypes. Model-predicted plaque counts depending on
A42/A40 ratio for 5×FAD and 5×FAD × mAPPA673T male in S1 (E)
and S2 (F), as well as 5×FAD and 5×FAD × mAPPA673T female in S1 (G) and S2 (H)
are presented. Dashed lines indicate non-significant effects.
To further explore these differences in correlations, generalised linear
modelling was used to determine whether the A42/A40 ratio in
insoluble and soluble fractions would predict plaque count and whether this
effect differs between genotypes (Fig. 5E–H). In males, independent of genotype,
the A42/A40 ratio in S1 did not influence plaque count (Fig. 5E). By contrast, in S2, 5×FAD males showed a negative association between
A42/A40 ratio and plaque count (Fig. 5F, p 0.001).
The relationship showed a positive direction in 5×FAD × mAPPA673T (p 0.001), resulting in lower plaque counts in 5×FAD × mAPPA673T than 5×FAD
males when the A42/A40 ratio is low, with a significant
difference between both genotypes for the number of plaques which depended on
A42/A40 (Fig. 5F, likelihood ratio test: 2(1) =
8.79, p = 0.003). In 5×FAD female mice, increase in
A42/A40 ratio in S1 was associated with a predicted decrease in
plaque counts (Fig. 5G, p 0.001). The opposite was the case in
5×FAD × mAPPA673T females, with increasing A42/A40 values
associated with an increase in plaque counts (Fig. 5G, p = 0.001). This
resulted in lower predicted plaque counts in 5×FAD × mAPPA673T compared to
5×FAD females for low values of A42/A40, and a significant
difference between genotypes in the prediction of plaque count based on the
A42/A40 ratio (Fig. 5G, likelihood ratio test: 2
(1) = 7.52, p = 0.0061). The A42/A40 ratio in S2 was
not significantly associated with plaque counts in females independent of
genotype (Fig. 5H). The same patterns were seen when investigating the
relationship between A42/A40 and total plaque area
(Supplementary Fig. 4).
3.4 Icelandic Mutation, Neurodegeneration, and Inflammation
Neuronal loss and gliosis associated with A plaque pathologies have
been reported for 5×FAD mice as early as 6 months of age [21, 23]. Therefore,
neurons and astrocytes were quantified in different regions of the brain using
NeuN and GFAP as markers. This was done in 5×FAD, 5×FAD × mAPPA673T crosses,
as well as their control counterparts WT and mAPPA673T (Fig. 6).
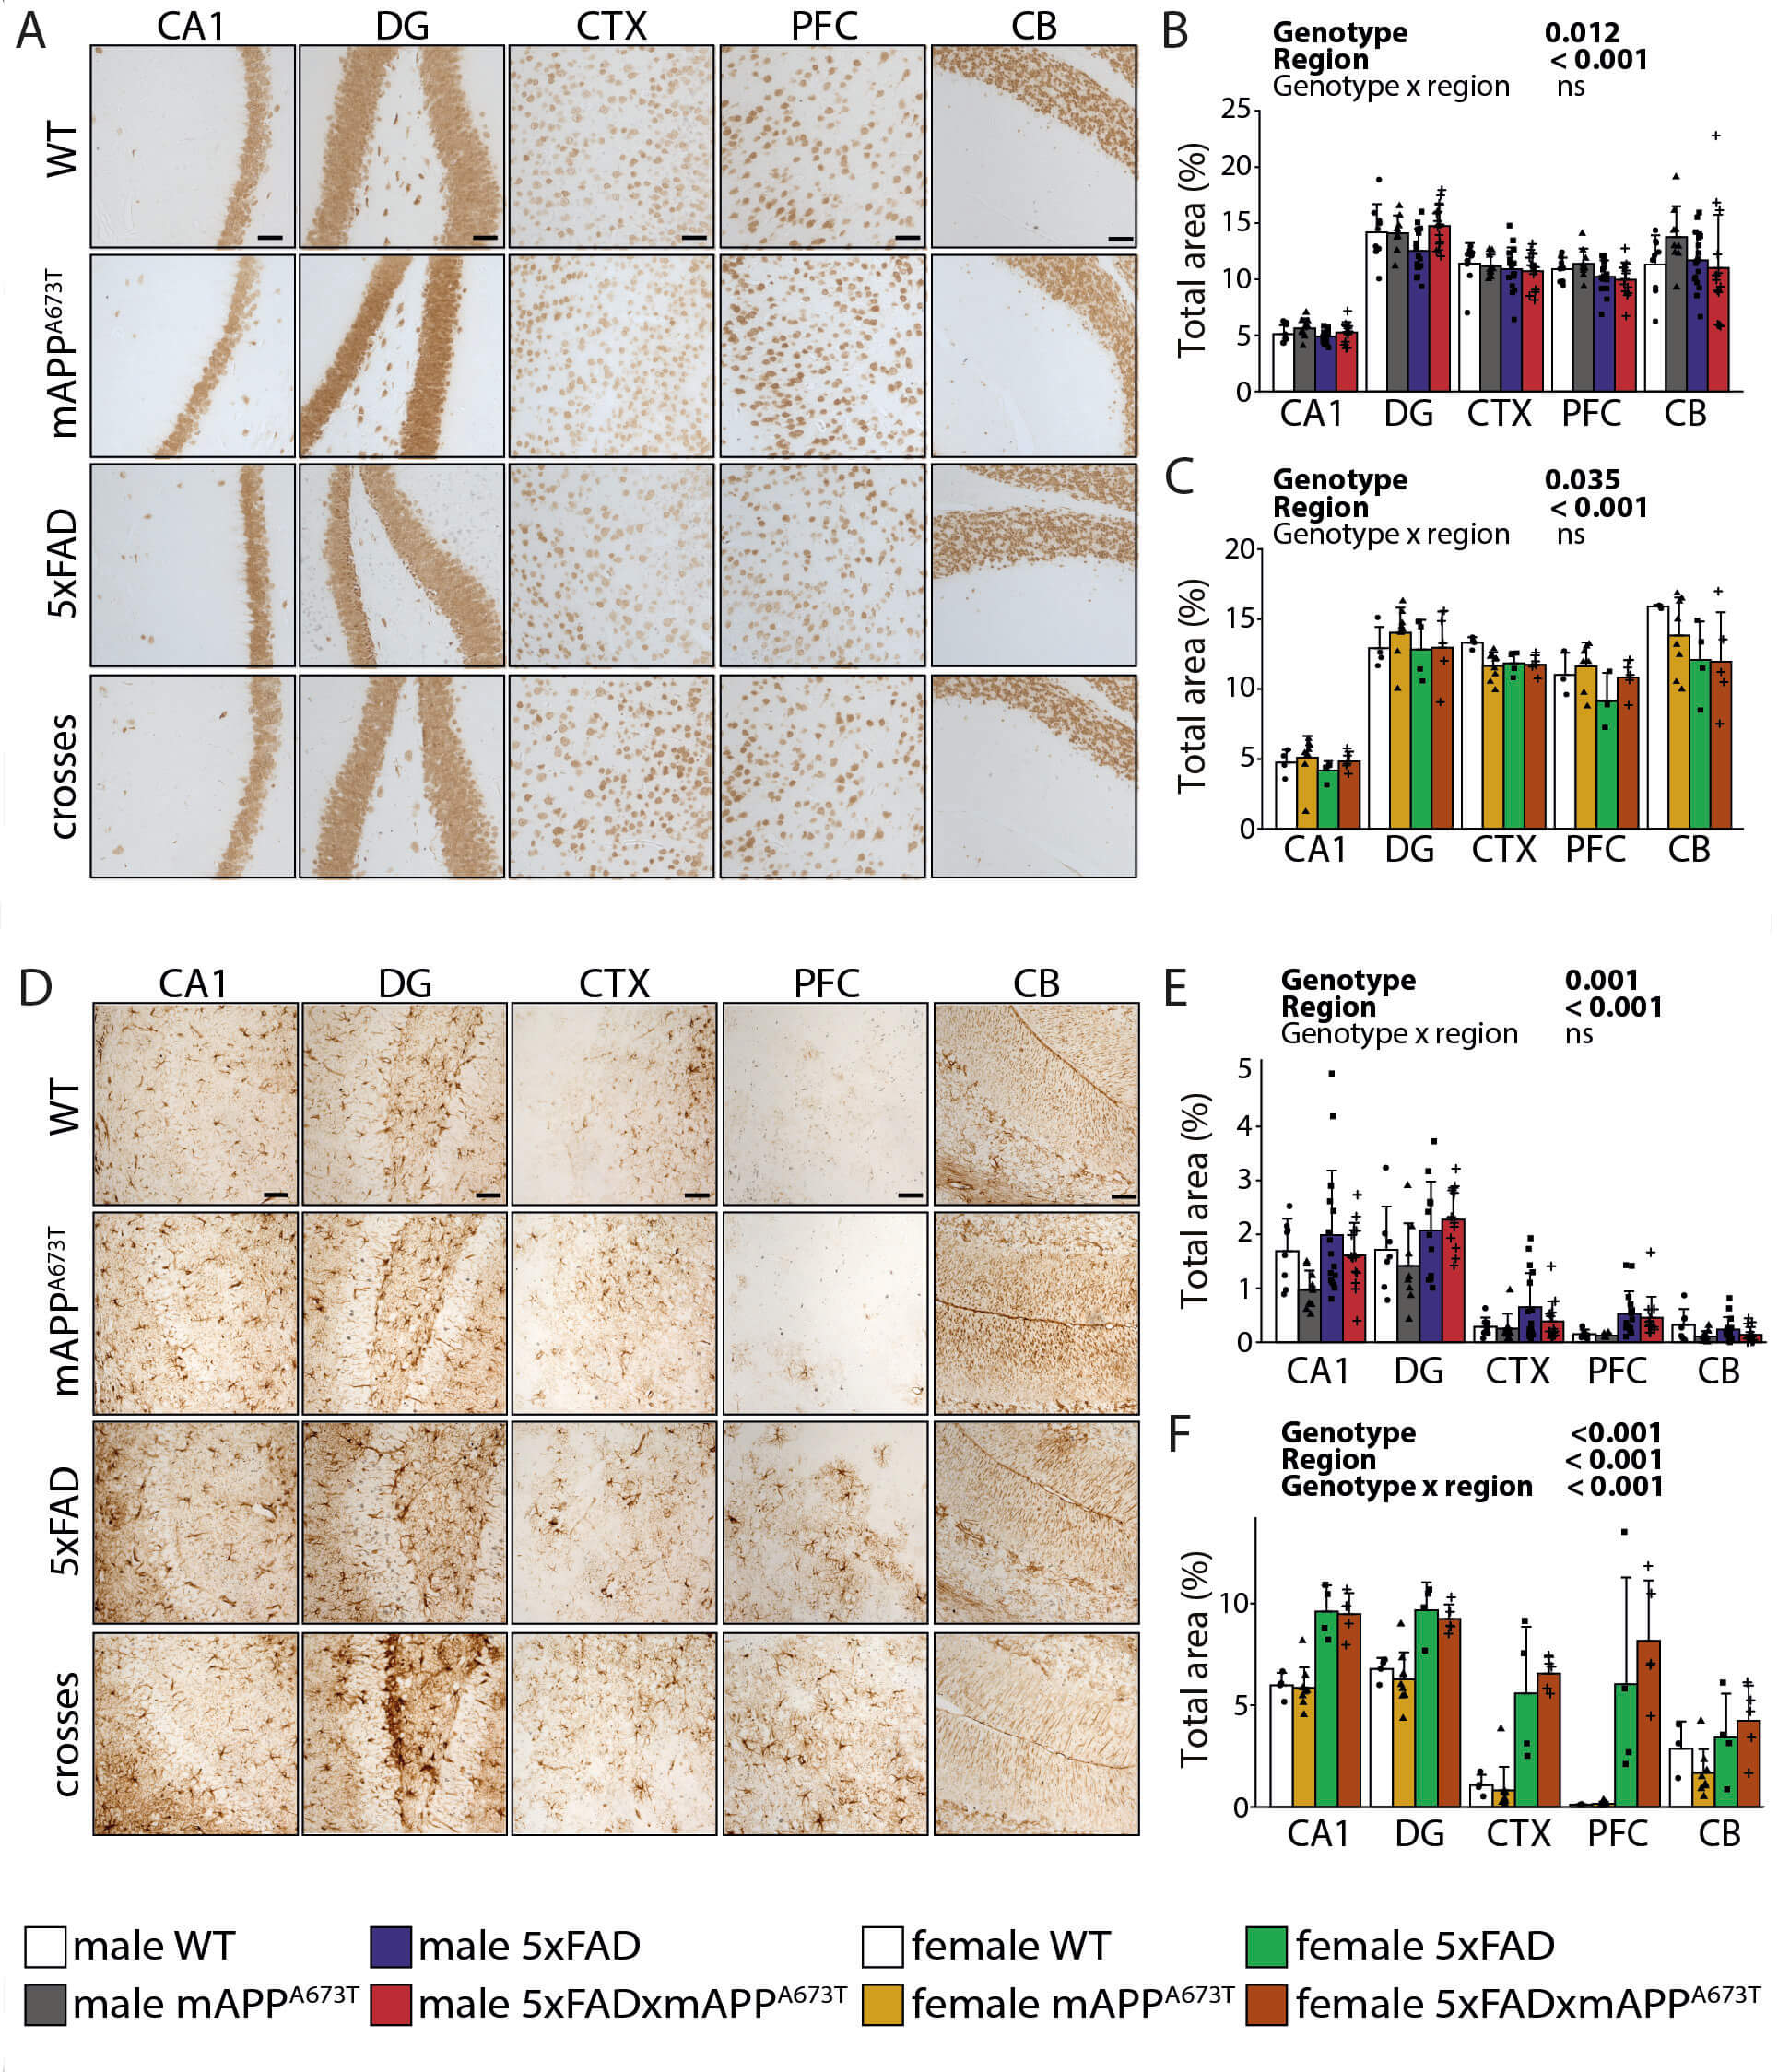 Fig. 6.
NeuN and GFAP immunohistochemistry. (A) Representative NeuN
immunohistochemistry images in brains of male WT, mAPPA673T, 5×FAD and
5×FAD × mAPPA673T mice stained with the antibody NeuN. Images from CA1, DG, CTX, PFC, and CB were taken using a light
microscope at a 100 magnification. scale bars, 100 µm. NeuN
levels were quantified using ilastik as total stained are in male (B) and female
(C) mice in five individual brain regions. (D) Representative GFAP
immunohistochemistry images in brains of male WT, mAPPA673T, 5×FAD and
5×FAD × mAPPA673T mice stained with the antibody GFAP. Images from CA1, DG, CTX, PFC, and CB were taken
using a light microscope at a 100 magnification. scale bars,
100 µm. GFAP levels were quantified using ilastik as total stained
area in male (E) and female (F) mice in five individual brain regions. Data are
shown as individual values, group mean, and S.D. Statistical analysis entailed
two-way ANOVA with genotype and region as independent variables. Significance of
each factor and the interaction is indicated above each graph. Data were
transformed using square-root transformation. NeuN - Males: WT: n = 9,
mAPPA673T: n = 9, 5×FAD: n = 17 (PFC n = 16), 5×FAD × mAPPA673T: n = 14
(CTX and PFC n = 13). NeuN - Females: WT: n = 4 (CB and PFC n = 3),
mAPPA673T: n = 9 (PFC n = 7, CB n = 8), 5×FAD: n = 4 (PFC n = 3),
5×FAD × mAPPA673T: n = 5. GFAP - Males: WT: n = 8 (PFC n = 6, CB, DG n = 7),
mAPPA673T: n = 9 (PFC n = 5, DG n = 8), 5×FAD: n = 17 (CA1, CTX n = 16, CB,
PFC n = 15, DG n = 11), 5×FAD × mAPPA673T: n = 14 (PFC, CTX, n = 13, DG n =
11). GFAP - Females: WT: n = 4 (CB, PFC n = 3), mAPPA673T: n = 9 (CB, PFC n
= 8), 5×FAD: n = 4, 5×FAD × mAPPA673T: n = 5.
Representative NeuN images from CA1, DG, CTX, PFC, and CB are shown (Fig. 6A).
Their quantification revealed significant genotype differences in male (Fig. 6B,
FGenotype(3,222) = 3.72, p = 0.012) and female cohorts (Fig. 6C,
FGenotype(3,84) = 3.00, p = 0.035). In males, the average over the
five brain regions confirmed the difference between the genotypes
(FGenotype(3,45) = 2.30, p = 0.090, data not shown) revealing a
modest reduction of NeuN in 5×FAD compared to WT (–5.7%), while this reduction
was even less pronounced in 5×FAD × mAPPA673T crosses compared to WT
(–2.8%). A similar, although not significant, observation was seen in females
(data not shown), where NeuN was reduced in 5×FAD compared to WT (–12.3%), and
again the reduction was less pronounced in 5×FAD × mAPPA673T crosses compared
to WT (–7.9%). Additionally, the NeuN signal differed significantly between
brain regions both in male (Fig. 6B, FBrain Region(4,222) = 146.05,
p 0.001) and female cohorts (Fig. 6C, FBrain Region(4,84) =
90.75, p 0.001). Post-hoc analyses yielded a lower NeuN signal in
CA1 compared to all other regions in males (Fig. 6B, all p values 0.001), and females (Fig. 6C, all p values 0.001).
Astrocytes were labelled using GFAP (Fig. 6D), and quantification revealed
genotype differences in male (Fig. 6E, FGenotype(3,194) = 9.57, p =
0.001), and female cohorts (Fig. 6F, FGenotype(3,86) = 72.11, p
0.001). A significant difference between brain regions was also seen. For
example, in males CA1 and DG had more GFAP-labelled astrocytes than CTX, PFC and
CB (Fig. 6E, FBrain Region(4, 194) = 106.04, p 0.001), and
similar results were observed for female cohorts (Fig. 6F, FBrain
Region(4,86) = 54.51, p 0.001). In male mice, post-hoc
tests revealed that mAPPA673T had significantly less GFAP-positive area than
5×FAD × mAPPA673T (p 0.001) and 5×FAD (p 0.001)
mice. In females, post-hoc analysis revealed that WT and mAPPA673T,
both had less GFAP than 5×FAD and 5×FAD × mAPPA673T in CTX and PFC (all
ps 0.001). In male and female mice, post-hoc tests revealed
that 5×FAD and 5×FAD × mAPPA673T had significantly more GFAP-positive area
than WT and/or mAPPA673T (p values 0.001); 5×FAD and
5×FAD × mAPPA673T mice, however, were not significantly different from each
other.
4. Discussion
Here, we have investigated the effect of the protective Icelandic mutation,
mA673T, on A pathology in the 5×FAD mouse model of AD [21]. 5×FAD mice
were bred with mAPPA673T mice resulting in 5×FAD × mAPPA673T crosses,
that are heterozygous for both the 5×FAD mutations and the mA673T mutation in the
APP gene. The overarching aim was to examine A pathology, as well as tau
and synaptic protein levels in 5×FAD and 5×FAD × mAPPA673T mice, including
their respective WT and mAPPA673T controls. The main findings that we report
are:
i. The mAPPA673T mutation significantly decreases the size of A
plaques in 5×FAD × mAPPA673T male crosses compared to 5×FAD mice.
ii. A40, A42 and A42/A40 ratios were similar
between 5×FAD and 5×FAD × mAPPA673T crosses. However, the Icelandic mutation
changed the association between A42/A40 plaque count/area: at
low ratios, 5×FAD × mAPPA673T tended to show lower predicted plaque burden
than 5×FAD while the opposite was true for high ratios.
iii. No differences were measured between 5×FAD and 5×FAD × mAPPA673T crosses for
A immunoblot species, tau, synaptic proteins (SYP, SNAP25, and STX1A),
neuronal loss, or astrocytic gliosis.
The pathological accumulation of A, either caused by its decreased
clearance and/or increased oligomerisation and aggregation, leads to synaptic
alterations, neuroinflammation, and eventually neuronal cell death [42]. Several
aggregation-promoting mutations have been identified near the -secretase
or -secretase cleavage sites in the APP gene (amyloidogenic APP
pathway), such as the Swedish K670N/M671L, Florida I716V, or London V717I
mutations. A mutation with opposite effects, the Icelandic A673T mutation, has
been identified in Nordic populations, and carriers of this mutation have a
significantly lower risk of developing AD presumably due to increased
-secretase cleavage [18, 19, 20]. In cellular models, human A673T reduced
amyloidogenic processing of human APP and decreased A aggregation by
reducing the release of sAPP [28, 29]. When the human A673T was expressed
in cell culture models expressing human APP with the Swedish and London
mutations, it reduced sAPP but A42, A40 and the
A42/A40 ratio remained unchanged [30] and it has also been
shown in cells combining 29 FAD mutations with the human A673T mutation that the
protective effect of the human A673T mutation was specific to certain mutations,
e.g., the London mutation (V717I) but was absent in the Florida (I716V) and
Swedish (KM670/671NL) mutations [43]. It was therefore reasonable to hypothesise
that the Icelandic mutation in the murine APP gene, mA673T, could counteract, at
least in part, some of the effects introduced by the Swedish/Florida/London
mutations in terms of A and other pathologies in 5×FAD mice, especially
because it has been suggested that endogenous mouse A may alter human
A in transgenic models [34].
4.1 Icelandic Mutation and A
Histopathologically, the mA673T mutation led to a decrease in A plaque
size in 5×FAD × mAPPA673T males compared to 5×FAD. While both A40 and
A42 are found in plaques, however an increased cerebral
A42/A40 ratio is another well-established biomarker of
A pathology in patients and 5×FAD mice, due to the greater aggregation
propensity of A42 [44, 45]. While no overt differences were identified
for soluble/insoluble A40 and A42, we found the way in which
their ratio was associated with plaques differed considerably between 5×FAD and
5×FAD × mAPPA673T; male 5×FAD mice showed significant positive correlations
between insoluble A40 and A42 with plaque counts and area. These
were almost entirely absent in 5×FAD × mAPPA673T. Similarly, in females with
heightened soluble and insoluble A40 and A42 levels ([25], this
study), the A42/A40 ratio in soluble fractions correlated
significantly with plaque count/area in 5×FAD mice, but this was not the case in
5×FAD × mAPPA673T. When modelling these, genotype-differences depended on
A42/A40 ratios; a protective effect (i.e., reduced plaque
burden in 5×FAD × mAPPA673T) was seen at low ratios that disappeared or is
reversed at high ratios. These differences suggest a genotype-dependent
sensitivity to A accumulation. They would also suggest the strength of
the amyloid burden in 5×FAD mice is too aggressive and the protection is too weak
to counteract their aggregation propensity.
Only a few publications have addressed the potential protective effects of the
Icelandic mutation in AD models in vivo. The first used a knock-in rat
model of humanized A673T-APP, K670N/M671L-APP (Swedish mutation) or both, and
found a reduction of A40 and A42 pathology (using ELISA) for
A673T-APP compared to wild-type APP but not when the Icelandic mutation was
combined with the Swedish mutation [33]. Using immunoblotting, they corroborated
an increase in non-amyloidogenic APP metabolites (sAPP) and a decrease
in amyloidogenic APP metabolites (sAPP and CTF) again for the
Icelandic mutation alone, but not when combined with the Swedish mutation. The
authors suggested that the Swedish and Icelandic mutations may act independently
but the magnitude of the protective effect caused by the Icelandic mutation is
smaller than the aggressive pathogenic effect of the Swedish mutation. We have
found no differences in APP fragments between genotypes using immunoblotting,
confirming a lack of efficacy of mA673T when combined with the Swedish mutation
and suggesting no shift in APP processing in 5×FAD mice when the mA673T mutation
is introduced on a Swedish/Florida/London background. The second study generated
knock-in mice with humanized APP with the Arctic (E693B) and Beyreuther/Iberian
(I715F) mutations and compared them to mice also carrying the Icelandic mutation
[32]. The protective A673T mutation reduced plaque area in cortex and hippocampus
at 8 months of age but at 12 months, only the number of plaques larger than 20
µm was decreased while smaller plaques showed similar levels in both
genotypes. They additionally report a decrease in CTF at 3 months (where
no A pathology is established yet) but it is unclear if this persists at
older age, where we also could not see any shift in APP processing. In our male
5×FAD × mAPPA673T mice, only the plaque size was decreased compared to 5×FAD,
suggesting a more aggressive A pathology produced by the
Swedish/Florida/London mutations as compared to the Arctic or Beyreuther/Iberian
APP mutations. This is also supported by in vitro findings, where it has
been shown that the protective effect of the human A673T mutation was specific to
the London mutation (V717I) but was absent in the Florida (I716V) and Swedish
(KM670/671NL) mutations [30, 43]. Another study inoculated APPswe/PS1dE9
transgenic mice with either recombinant non-mutant human A or human
A containing the A673T mutation once at 2 months of age and found no
changes in A levels when analysed at 6 months. There was only a rescue
in synapse density and spatial memory which remained unexplained [31]. In this
model, similar to our 5×FAD mouse, the role of PS1 mutations remain unexplored
and individual contributions of these mutations to the amyloid load, and a
possible block of the A673T protection are elusive to date. Lastly, a recent
study that introduced the mA673T mutation into a tau-transgenic model, L66,
reported no modulation of mouse A or human tau pathologies and no rescue
of motor and neuropsychiatric behaviour in these mice [46].
5×FAD mice overexpress randomly integrated mutant human A, while in
mAPPA673T mice, the Icelandic A673T mutation was generated in the murine APP
gene. It has been shown that co-expression of murine APP can alter A
pathology in APP23 transgenic mice but not in the much faster
A-depositing APPPS1 transgenic mice [34]. Moreover, the targeted
knock-in of human BACE1 lead to amyloidosis purely based on murine A [47]. On the contrary, Jankowsky and co-workers showed that overexpression of
mouse APP did not alter A pathology when expressed on a PS1dE9
background, while it increased A pathology when expressed on a more
aggressive APPswe/PS1dE9 background [48]. These data suggest a differential
effect of murine A on human A deposition in the different APP
mouse models and may explain the mild effects observed in this study.
4.2 Icelandic Mutation and Tau
Several lines of evidence suggest a connection between A and tau in the
pathophysiology of AD, with both proteins being abundant and often co-localising
at synapses [49, 50, 51, 52, 53]. It is therefore important to quantify tau levels to confirm
if they are affected by APP alterations. A study investigating the effect of the
Icelandic mutation in an APP/PS1 mouse model of AD reported a decrease in
phospho-tau pathology in the A673T-A groups, but this reduction remains
unexplained [31]. By contrast, the mA673T mutation did not affect tau levels and
was unable to rescue behavioural impairment in a tau-transgenic mouse model [46].
A recent exploratory study in 6 non-AD patients (unconfirmed idiopathic normal
pressure hydrocephalus cases) comparing CSF of three APPA673T carriers to
three age- (and sex-) matched control subjects reported that disease-relevant
soluble APP- and A42 levels were significantly reduced in the
CSF of APPA673T carries. Yet, soluble APP-, total tau and phosphorylated
tau (p-tau 181) were not altered [30]. This is in line with our finding that the
Icelandic mutation had no effect on tau, as 5×FAD and 5×FAD × mAPPA673T mice
presented with similar tau levels. It is worth mentioning that 5×FAD showed
normal tau levels not dissimilar of WT mice and is in line with unchanged total
tau levels in 5×FAD compared to WT at 3 months of age [54].
4.3 Icelandic Mutation and Synaptic Proteins
Synapse loss is a key event in AD that strongly correlates with cognitive
decline [55, 56]. Additionally, a link between A plaque formation and
synaptic dysfunction has been established [57]. The presynaptic proteins SYP and
SNAP25 were chosen as established markers for synapse loss in AD and AD mouse
models, while STX1A was chosen as negative, non-changing, marker [26, 55, 58]. The
expression of the mAPPA673T mutation in 5×FAD did not alter levels of these
three synaptic markers, in line with a recent report investigating the exact same
mutation in a tau-based animal model [46]. However, they also were unchanged
across all genotypes despite previous reports of a general reduction of synaptic
proteins in 5×FAD as early as 6 months [26], most notably a reduction between 30
and 45% for SYP [59, 60, 61]. These discrepancies likely relate to the different
quantification methods used (immunoblotting/immunofluorescence vs. ELISA).
4.4 Icelandic Mutation, Neurodegeneration, and Inflammation
Neuronal loss is a further key pathological feature of neurodegenerative disease
such as AD [62]. Conflicting findings were reported for neuronal loss in 5×FAD
mice. On one hand, stereologically counted neuron numbers were lower in cortical
layer 5 starting at 9 months [63] and persisted at 12 months [23], while on the
other neuronal loss appeared as early as 6 months in the subiculum [64]. Our
analyses based on area stained in microscopic images using the ilastik software
returned no significant changes of the NeuN staining in 5×FAD mice in any of the
five brain regions analysed, and no effect of the mA673T mutation. Contrary, more
GFAP-positive astrocytes were found for in 5×FAD mice, but no protective effect
was observed in 5×FAD × mAPPA673T crosses.
Abbreviations
5×FAD, five familial Alzheimer’s disease mice; 5×FAD × mAPPA673T, mouse crosses carrying both the 5×FAD mutations and the A673T mutation in the murine APP gene; A, amyloid beta-protein; AD, Alzheimer’s disease; AEBSF, 4-(2-aminoethyl) benzenesulfonyl fluoride hydrochloride; APP, amyloid precursor protein; mAPPA673T, mice with the A673T Icelandic mutation in the murine APP gene; BCA, bicinchoninic acid; CA1, hippocampal cornu ammonis; CB, cerebellum; CTF, carboxyl terminal fragment; CTX, visual cortex; DG, dentate gyrus; GFAP, glial fibrillary acidic protein; GuHCl, guanidine hydrochloride; IHC, immunohistochemistry; NeuN, neuronal nuclear antigen; PFC, prefrontal cortex; PS1, presenilin-1; S.D., standard deviation; S1, RIPA-soluble supernatant fraction; S2, GuHCl fraction or RIPA-insoluble fraction; SNAP25, synaptosome associated protein 25kDa; STX1A, syntaxin 1A; SYP, synaptophysin; WT, C57Bl6/J wild-type mice.


 , Karima Schwab 1,*,†