


 , Sivasankari Krishnakumar 2
1 Department of Computer Science and Engineering, Akshaya College of Engineering and Technology, Coimbatore, 642109 Tamil Nadu, India
2 Department of Electronics and Communication Engineering, Akshaya College of Engineering and Technology, Coimbatore, 642109 Tamil Nadu, India
Abstract
Parkinson’s Disease (PD) is a neurological condition characterized by motor symptoms that fluctuate throughout the day depending on medication. Continuous and objective monitoring is essential, but conventional clinical assessments are episodic and subjective, while wearable and video-based solutions may raise privacy concerns. This study aims to develop a real-time, privacy-preserving deep learning framework that utilizes 2D skeleton pose data to simultaneously classify medication states (ON or OFF) and continuously estimate motor symptom severity.
To enable privacy-preserving and real-time monitoring of Parkinson’s motor fluctuations, a Multi-Scale Temporal Attention-Transformer Network (MS-TATNet) was developed based on 2D skeleton pose data collected from the REal-world Mobility Activities in Parkinson’s disease dataset (REMAP) dataset. The MS-TATNet captures complex, variable, and multi-scale temporal dynamics of PD motor symptoms through a multi-scale temporal convolutional network, scaled dot-product attention mechanism, stacked transformer encoder blocks with a multi-head self-attention mechanism, temporal pooling layer, softmax classifier, and regression layer.
The experimental results demonstrate that the MS-TATNet achieved 99.63% accuracy, 99.50% recall, 99.33% specificity, and 99.67% F1-score for medication state classification. For continuous severity estimation, the predicted scores showed a Pearson correlation coefficient of 0.97 with clinical assessments.
Thus, this work highlights the MS-TATNet’s potential for scalable, privacy-preserving remote monitoring of PD.
Keywords
- motor symptoms
- multi-scale temporal convolutional network
- Parkinson’s disease
- skeleton pose data
- symptoms severity
- transformer encoder blocks
Parkinson’s Disease (PD) is a long-term neurological condition caused by the continuous degeneration of cells that produce dopamine. Dopamine is a neurotransmitter that enhances muscle activation and helps in movement organization [1, 2]. The number of persons with PD increased to over 6 million during 1990 and 2015, making it the fastest-growing neurological ailment globally, while Fig. 1a illustrates the number of deaths attributed to PD across different age groups [3]. PD can be identified by a range of motor symptoms, including tremors, muscle weakness, stiffness, or unstable posture, and also non-motor symptoms, such as exhaustion, dysphagia, diminished sense of smell, depressive disorders, and sleep disorders like rapid eye movement (REM) behavioral disorder, might be present decades before being diagnosed [4, 5, 6, 7, 8]. People between the ages of 60 and 65 account for the majority of PD cases. The number of people with PD has increased along with the aging population, reaching 8.5 million patients in 2019. Fig. 1b presents prevalence trends of PD per 1,000 population across World Health Organization regions, disaggregated by sex [9]. Accurate monitoring of symptom variations is crucial for the optimal treatment decisions that can alleviate the disease [10].
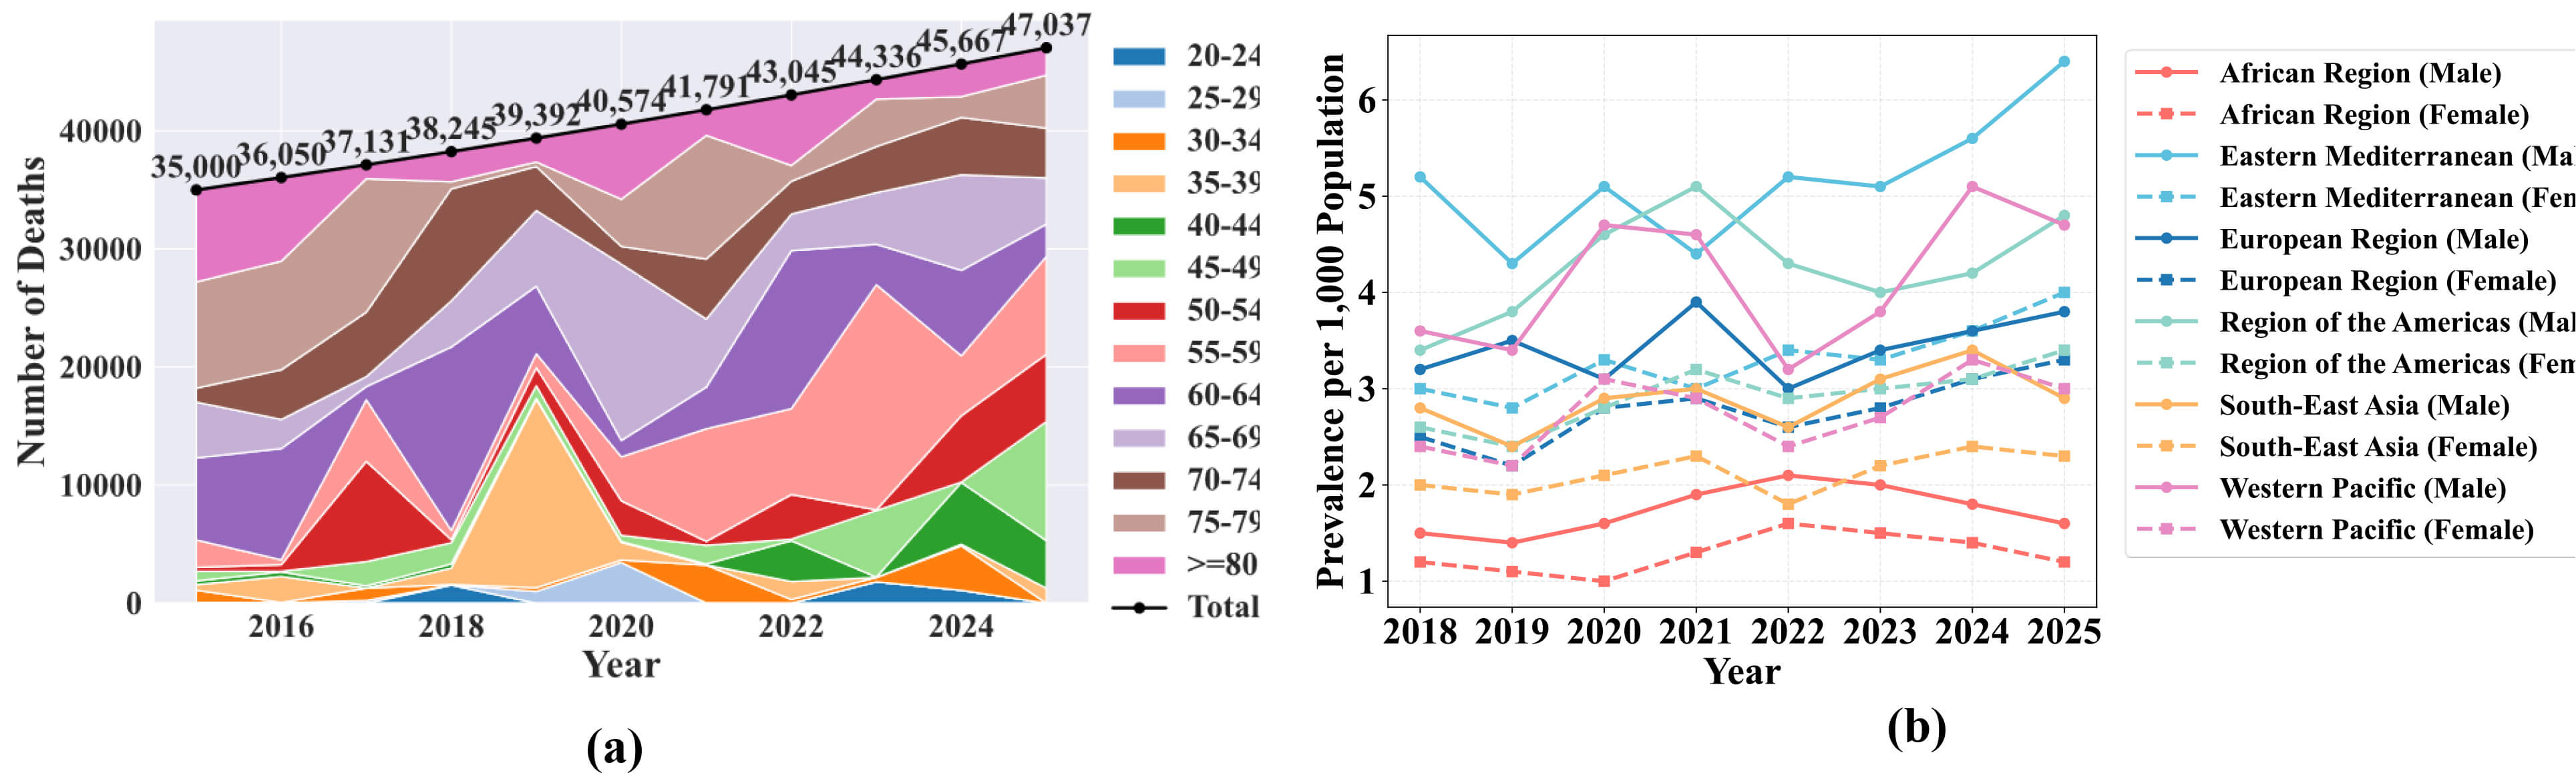 Fig. 1.
Parkinson’s Disease mortality and prevalence trends. (a) Shows the number of deaths attributed to Parkinson’s Disease (PD) across different age groups over recent years. (b) Presents prevalence trends across World Health Organization regions, with data disaggregated by sex.
Recently, wearable sensors and other emerging technologies have drawn a lot of attention in the treatment of PD [11, 12]. Machine Learning (ML) algorithms and commercial off-the-shelf devices based on STM32 have been developed for the early identification and categorization of PD [13]. To classify the PD patient’s “ON” and “OFF” states, an interpretable ML model was created using a temperature sensor, a three-axis gyro, and a three-axis magnetometer [14]. A new tool was presented to aid in the identification of PD motor disorders by analyzing data obtained from a wrist-worn sensor [15].
PD is a progressive neurodegenerative condition that is characterized by fluctuating motor symptoms like tremor, rigidity, and bradykinesia. Accurate and consistent measurement of the ON and OFF medication states is necessary to optimize treatment and improve the quality of life. However, current approaches are based on episodic and subjective clinical assessments or intrusive wearable and video-based systems that raise usability, scalability, and privacy concerns. These challenges highlight the need for a non-intrusive, objective, and privacy-preserving solution that can provide real-time and fine-grained monitoring of Parkinson’s motor symptoms in real-world environments.
The objective of this work is to develop a Multi-Scale Temporal Attention-Transformer Network (MS-TATNet) framework for Parkinson’s motor symptom monitoring using 2D skeleton pose data. Specifically, the framework aims to accurately detect when patients are in the ON state (when medication is effective and symptoms are reduced) and the OFF state (when the effect of medication reduces and symptoms reappear or worsen), while simultaneously estimating the continuous severity of motor symptoms.
The main contributions of the proposed MS-TATNet Framework are as follows:
• Privacy-Preserving MS-TATNet Framework: The work proposes a Multi-Scale Temporal
Attention-Transformer Network (MS-TATNet) framework to monitor PD motor symptoms
using 2D skeleton pose data, instead of raw video or wearable sensors. This
approach allows for privacy-preserving and non-intrusive analysis appropriate for
real-world deployment. • Dilated Multi-Scale Temporal Convolutional Modeling: The work develops a
Multi-Scale Temporal Convolutional Network (MS-TCN) to capture short, medium, and
long-term temporal dependencies in motor fluctuations by using a different
dilation rate to effectively represent a range of symptom dynamics, such as
tremor, rigidity, and bradykinesia. • Dual-Task Learning for Classification and Regression: The proposed work
introduces an integrated end-to-end model that jointly performs ON/OFF medication
state classification and continuously estimates symptom severity to provide both
discrete and fine-grained assessments within a single framework. • Attention-Integrated Transformer for Advanced Sequence Representation: The
proposed MS-TATNet model incorporates Scaled Dot-Product Attention (SDPA) and
stacked transformer encoder blocks to highlight the most informative temporal
scales and capture higher-order dependencies, which produce robust and clinically
meaningful sequence representations.
The remaining part of this paper is structured as follows. The existing works on PD detection using various approaches are reviewed in Section 2. The suggested MS-TATNet framework is presented in Section 3, the experimental findings are described in Section 4, and the study is concluded in Section 5.
This section analyzes related works on PD detection using wearable sensor-based approaches and video-based approaches. Each study was analyzed thoroughly based on the objectives, methodologies, advantages, and limitations to identify the key gaps and scope for improvement.
Lin et al. [16] utilized raw kinematic signals from inertial measurement unit sensors to create a model that uses ML to distinguish early-stage PD from essential tremor based on gait and postural transition parameters. Even though the model was highly stable, it was not appropriate for real-time applications or personal usage at home for monitoring PD patients. Davidashvilly et al. [17] created a Deep Neural Network (DNN) for PD patients’ activity recognition using wearable sensor data. The model demonstrated better activity recognition performance using healthy data. However, there was an inconsistency in the activity-matching procedure with the dataset. This was due to the lack of an activity label that matched those in the dataset used in that work. Johnson et al. [18] used a multivariate ML model to remotely screen early-stage PD using a consumer-grade wearable device. This approach successfully generated high-dimensional information from several sensors. But there were problems with the non-demographically matched research group and the non-clinically proven PD diagnosis due to its diminished control over enrollment screening. Rodriguez et al. [19] introduced and applied an ML algorithm to assess the intensity of tremor in free-living PD patients using wearable sensor data with an Inertial Measurement Unit (IMU) securely attached to patient’s wrist and ankles. Even though the model enhanced therapeutic relevance in continuously monitoring PD symptoms, the assessments during unrestrained action in free-living situations continue to be challenging. Hammoud et al. [20] developed a wrist-worn IMU sensor to identify and monitor the development of PD using ML approaches. With both left and right wrist sensors, the model showed better performance with the left hand. Nevertheless, the model could not account for anatomical and physiological aspects to determine why the left-hand sensor performed better.
Brien et al. [21] presented a simple, non-invasive PD classification algorithm using video-based eye tracking and ML methods. While the model attained comparable measures of sensitivity and specificity, it was still challenging to evaluate what is sensitive to PD rather than age, particularly cognitive ratings. Sarapata et al. [22] created a scalable and autonomous video-based human activity identification system for PD motor dysfunction using Spatio-Temporal Graph Convolutional Network (ST-GCN). The system successfully attained reasonable accuracy in activity categorization and frame-by-frame precise annotation for high resolution. However, the model has difficulties to identify identical body postures and movement patterns. Zeng et al. [23] introduced a computerized video-based gait analysis model using a skeleton-silhouette fusion convolution network. The model provides fine-grained extra characteristics for high-resolution gait measurement in addition to accurately predicting the Movement Disorder Society-Unified Parkinson’s Disease Rating Scale (MDS-UPDRS) gait score. However, the model did not include patients with severity score 3 and 4, which limits its applicability to more severe cases. Liu et al. [24] established a global temporal-difference shift network to predict the PD tremors’ MDS-UPDRS score from video. The model demonstrated an increased ability for generalization ability for the most severe score prediction of PD tremor. But the model faced challenges in accurately detecting patients with mild and moderate severity of PD. Gao et al. [25] developed an DL-based model for eye movement analysis-based PD assessment using regular red, green, and blue (RGB)-video data. The model combined the 1D-Convolutional Neural Network with Attention-based Network exhibited superior performance in PD classification. The model had problems with higher interference cost and generalizability issues. Most prior studies use raw video or high-resolution images, raising patient privacy concerns and require large storage or bandwidth. No models jointly perform motor state classification and continuous symptom severity regression on pose data. There is a need for non-invasive, objective, and scalable methods to detect motor symptom fluctuations in real-world settings. Thus, this work develops a real-time AI system that monitors PD motor symptoms using skeleton pose data to detect patients’ medication and its severity.
This work develops an MS-TATNet framework for Parkinson’s motor symptom monitoring using 2D skeleton pose data from the REMAP Open dataset. The model begins with a Multi-Scale Temporal Convolutional Network, where parallel dilated 1D convolutions at short, medium, and long temporal windows extract hierarchical motion features. These multi-scale representations are fused through an SDPA mechanism to emphasize the most informative time scales. The fused representation is processed through stacked transformer encoder blocks with Multi-Head Self-Attention (MHSA) for advanced temporal dependency modeling. Finally, temporal pooling generates representations that branch into two prediction heads, a softmax classifier for ON or OFF medication state, and a regression layer for continuous symptom severity estimation. The detailed architecture of the MS-TAT framework is depicted in Fig. 2.
 Fig. 2.
The proposed multi-scale temporal attention-transformer network for Parkinson’s motor symptom monitoring using 2D skeleton pose data.
This work utilizes 2D skeleton pose data from REMAP [26], a human rater-labelled
dataset of real-world mobility behavior in PD including Sit-To-Stand (STS)
transitions and turns in gait while living in a home environment. These distinct
activities are recorded during clinical evaluation as well as during unstructured
and unobserved free-living. It involves 24 subjects, twelve participants (mean
age 61.25; seven males, five females) have PD, while the remaining twelve (mean
age 59.25, three males, nine females) do not have PD. The dataset was collected
using wall-mounted Microsoft Kinect cameras in communal rooms of a fully
furnished test-bed house, capturing RGB video at 640
| Activity labelled | Parameters |
| Turning of gait | Turning duration |
| Angle of turn to nearest 45 degree | |
| Number of turning steps | |
| Type of turn | |
| PD or control status | |
| “On” or “off” medication status for PD participants | |
| “On” or “off” Deep Brain Stimulation (DBS) status for PD participants | |
| Clinical assessment “Yes” or “No” | |
| Sit-to-stand | Whole episode duration |
| Final attempt duration | |
| Extra detail about STS transition: uses flat surface(s) to push off from arms of chair, | |
| MDS-UPDRS question 3.9 rating on 0–4 scale | |
| PD or control status | |
| “On” or “off” medication status for PD participants | |
| “On” or “off” DBS status for PD participants | |
| Clinical assessment “Yes” or “No” | |
| Non-turning, non-sit-to-stand | Action labelled |
| Episode duration | |
| PD or control status | |
| “On” or “off” medication status for PD participants | |
| “On” or “off” DBS status for PD participants | |
| Clinical assessment “Yes” or “No” |
STS, Sit-To-Stand; MDS-UPDRS, Movement Disorder Society-Unified Parkinson’s Disease Rating Scale.
The REMAP dataset includes multiple recording sessions for each participant, and each session contains several linked data files rather than a single sample, resulting in a significantly larger number of usable instances. For the STS task, each participant contributes approximately 5–7 linked recording files, with each file containing 150–300 sequential frames representing a complete sit-to-stand movement cycle. The STS metadata file includes fields such as Transition ID, Participant ID, PD or Control, sts_whole_episode_duration, sts_final_attempt_duration, on_or_off_medication, Deep Brain Stimulation (DBS)_state, Clinical_assessment, STS_additional_features, and MDS-UPDRS score 3.9 (arising from chair). Each corresponding linked file contains time-series motion data, where each row represents one frame of the movement via the time(s) column, and skeleton joint positions are stored as coordinates labeled x0, y0, x1, y1 … up to x24, y24, representing all 25 tracked body joints. Most STS clips were 17 seconds long, with 2 seconds/2000 milliseconds included before the transition and a variable amount of data included afterwards to make up the total duration. The skeleton included 25 joints that can be divided into different parts of the body as shown in Fig. 3, in the head (0 nose, 15 and 16 eyes and 17 and 18 ears), trunk (1 neck and 8 mid hip), arms (2 and 5 shoulders, 3 and 6 elbows and 4 and 7 wrists), legs (9 and 12 hips, 10 and 13 knees, 11 and 14 ankles), and feet (19 and 22 big toes, 20 and 23 small toes and 21 and 24 heels).
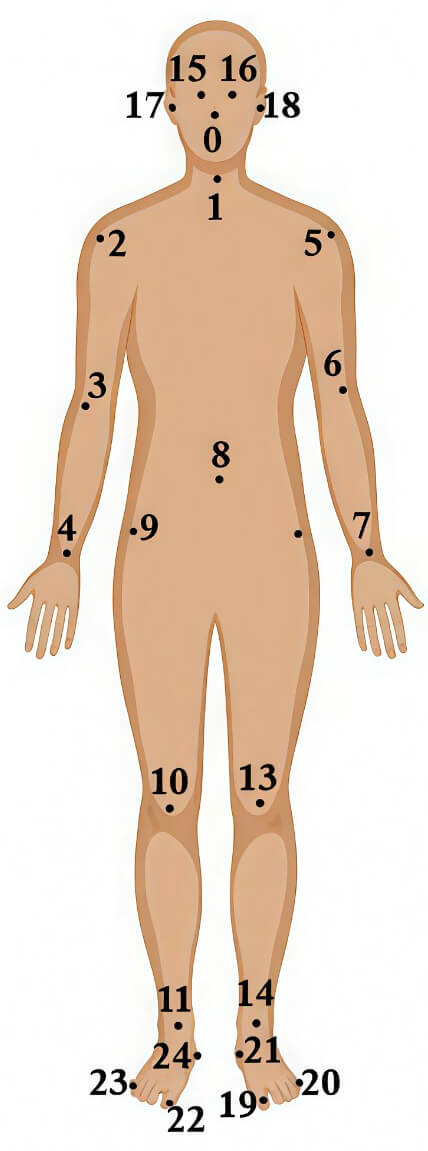 Fig. 3.
Layout of 2-dimensional skeleton joints used in sit-to-stand data comprises 25 joints.
For turning of gait episodes, the RGB video clips were trimmed to contain the turning action with 6 frames of data/200 milliseconds included both before and after the action itself, comprises 17 body joints. The resulting frame-by-frame skeleton data provided structured representations of mobility actions suitable for quantitative analysis. Each participant provides multiple turning trials, resulting in several linked key-point files per subject. The Turning metadata file includes Turn ID, Participant ID, PD or Control, number_of_turning_steps, turning_angle, type_of_turn, turning_duration, On_or_Off_medication, DBS_state, and clinical_assessment. Together, the repeated STS and turning recordings across all participants create a rich motion-sequence dataset with thousands of frames and a large number of movement samples, enabling detailed analysis despite the limited number of subjects.
The dataset first undergoes column normalization using dictionary mapping and string standardization. Categorical and text values were encoded through rule-based normalization, and missing values were handled thorough imputation. After these preprocessing steps, the dataset was split into 64% training, 20% testing, and 16% validation sets. Feature scaling and normalization were then applied using statistics computed from the training set, ensuring no information leakage into the validation or test sets.
To effectively capture the diverse temporal dynamics of Parkinson’s motor symptoms, this work develops an MS-TCN [27]. The motor fluctuations of PD occur on various temporal scales, while tremors are captured in rapid oscillatory behavior, rigidity and bradykinesia slowly evolve over time. A single receptive field is not suitable for modelling such variability. Therefore, the model uses parallel temporal convolutional branches with multiple dilation factors to extract short, medium, and long-term temporal dependencies. Each stage contains four dilated 1D convolution layers with dilation rates of 1, 2, 4, and 8, enabling the network to capture short-, medium-, and long-range dependencies within the movement sequence. The stages use progressively larger kernel sizes and channel capacities, Stage 1 uses a kernel size of 3 with 64 channels, Stage 2 uses a kernel size of 5 with 96 channels, and Stage 3 uses a kernel size of 5 with 128 channels, resulting in a total of 12 convolutional layers.
Formally, given a skeleton pose sequence
where
where
To dynamically identify and prioritize the most relevant information of the
input sequence, the proposed model incorporates the SDPA mechanism. The SDPA
mechanism uses the dot product [28], which is scaled by the square root of the
key vector’s dimension to calculate attention scores between a query
vector
where
The model uses a stacked Transformer encoder with Multi-Head Self-Attention (MHSA) to capture higher-level temporal dependencies [29]. The encoder consists of three identical layers connected sequentially. Each layer processes the output of the previous one using MHSA with four attention heads, followed by a feed-forward network with a hidden dimension of 256. The embedding dimension of each token is 128. The input to the Transformer is a temporal sequence reduced to 3–8 tokens depending on the duration of the movement trial. Learnable positional embeddings of size 128 are added to preserve temporal ordering. By stacking multiple encoder layers, the model gradually extracts more complex and long-range temporal relationships. The final contextualized representation is used as the final output, as depicted in Fig. 4.
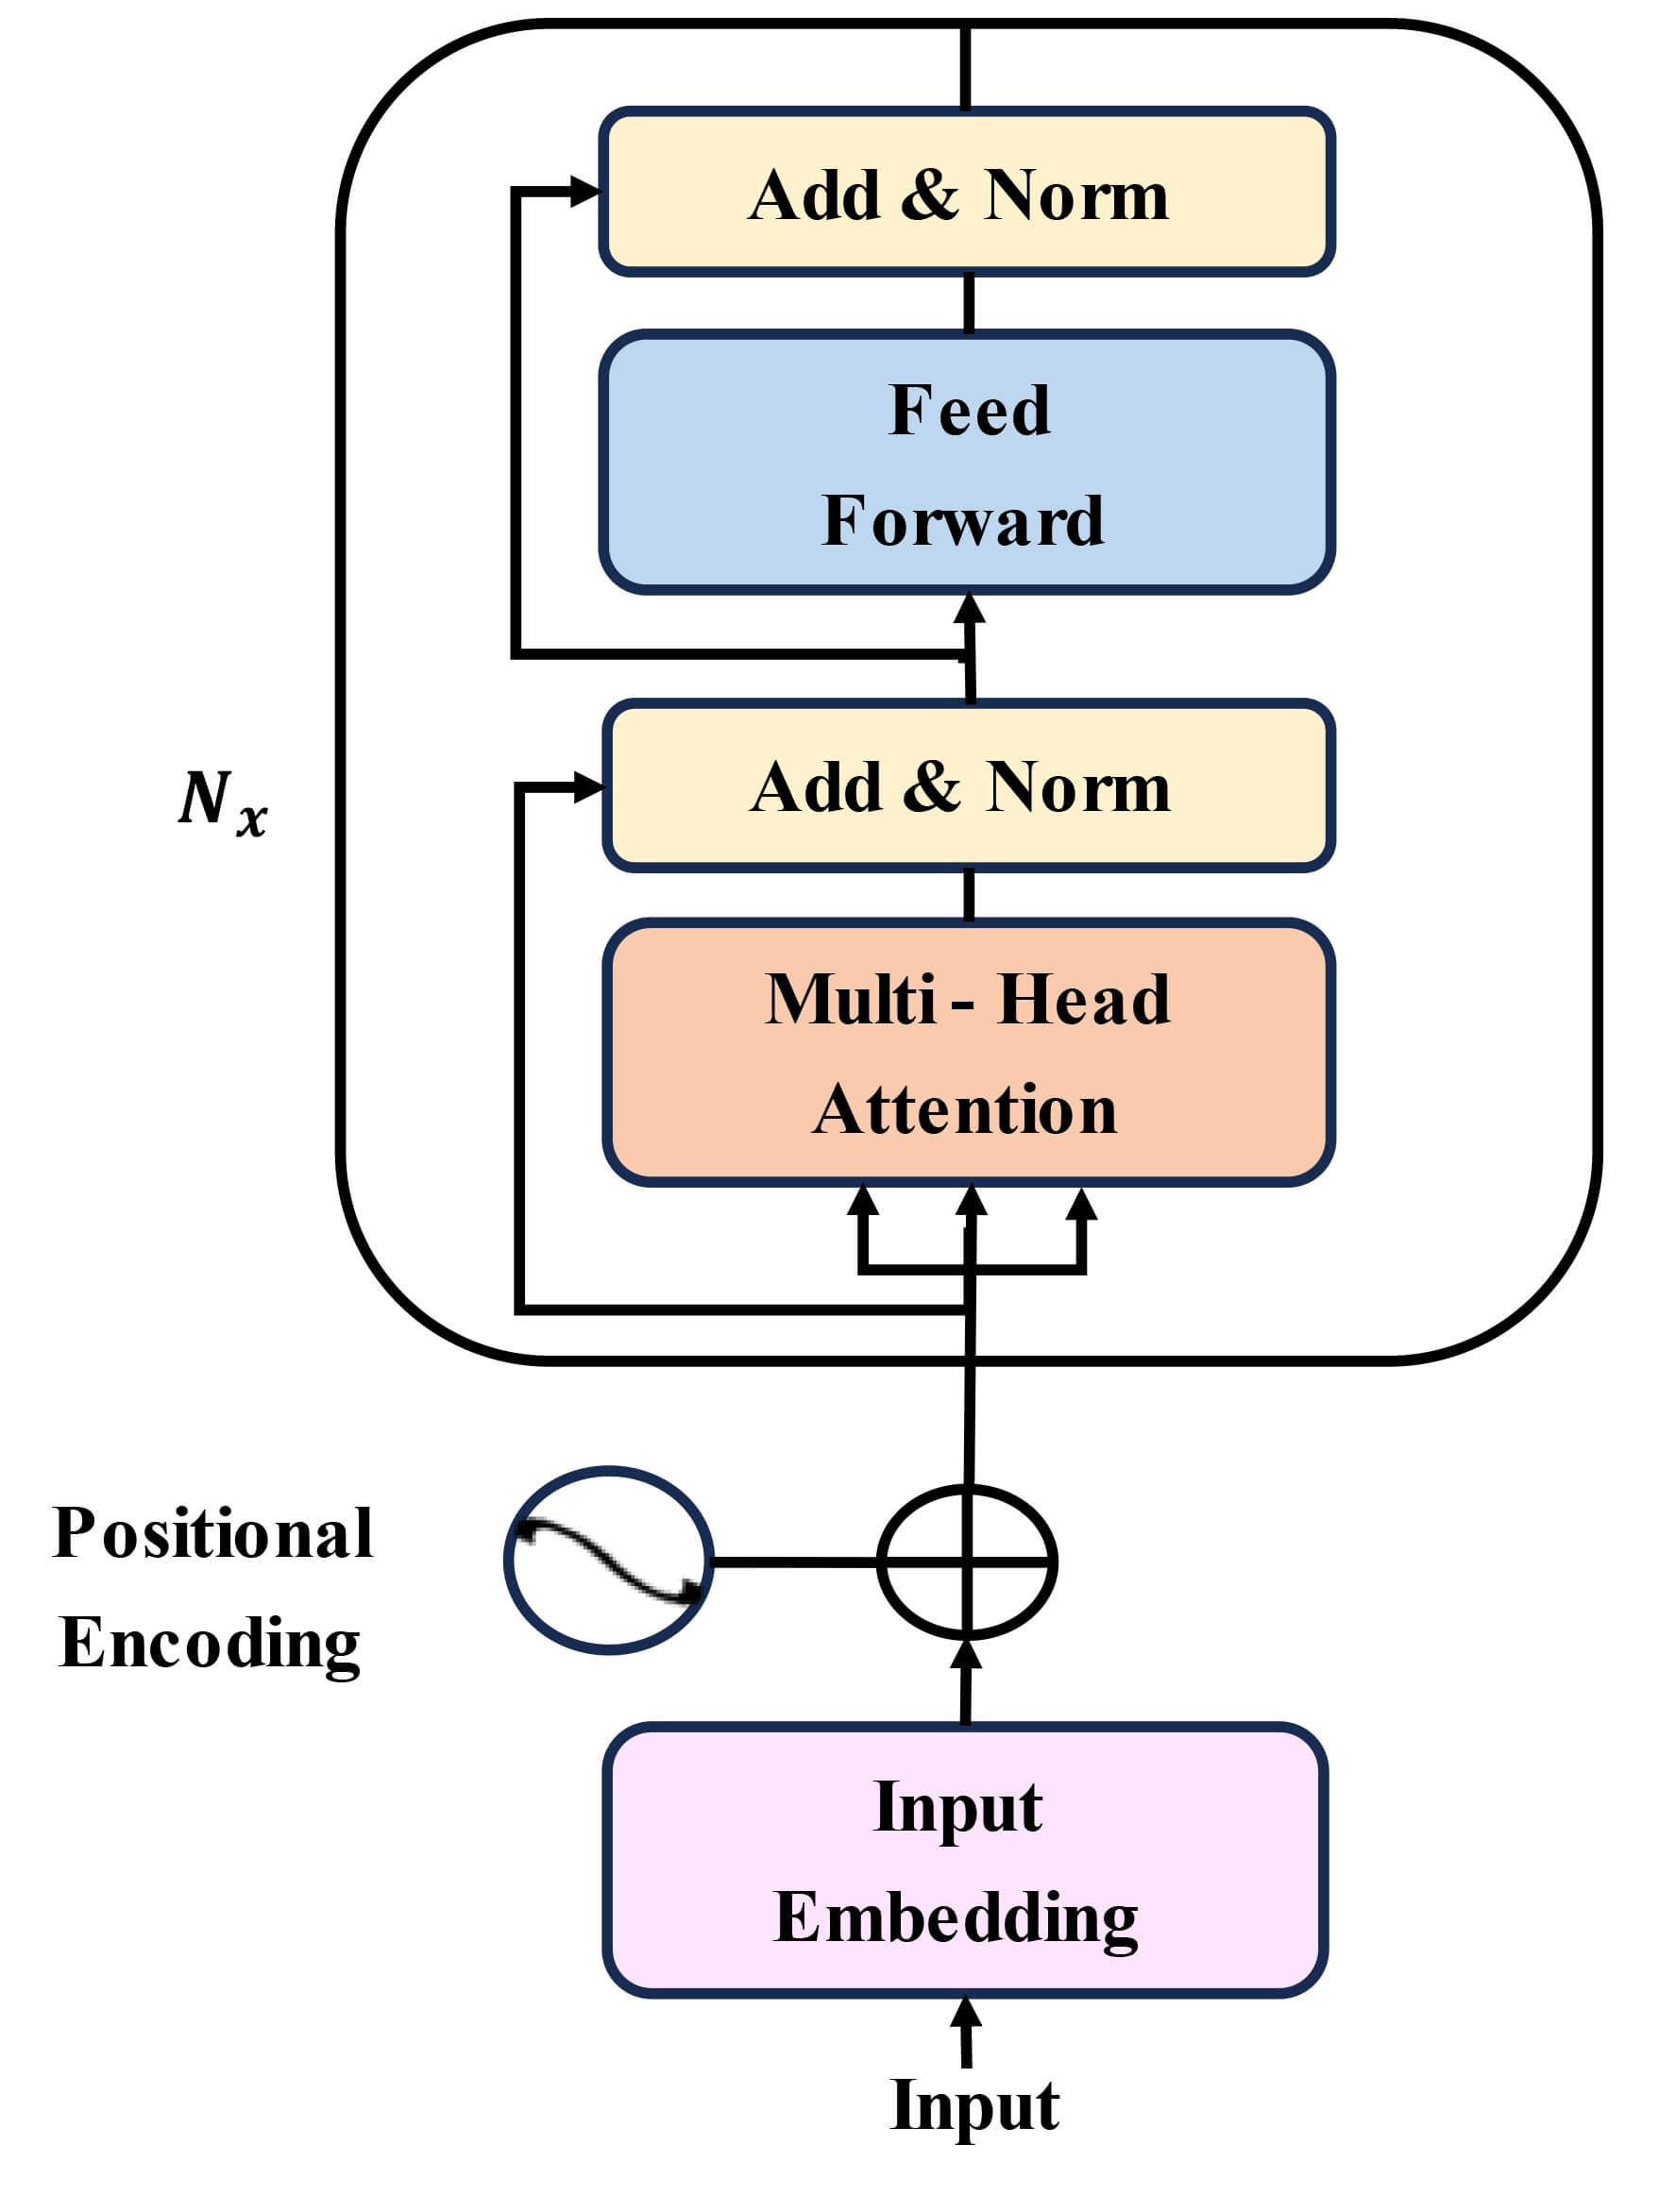 Fig. 4.
Architecture of stacked transformer encoder blocks with multi-head self-attention mechanism for advanced temporal dependency modeling.
Temporal pooling is a procedure that is commonly employed in sequence modeling for transforming input sequences of variable-length into smaller fixed size representations. Temporal pooling summarizes information across time, enabling the model to process longer input sequences with fewer computations [30]. In this study, temporal pooling is applied after the transformer encoder blocks to produce compact representations that preserve the most relevant temporal information. This process allows for short-term variability and long-term dependencies, which are encoded by the previous multi-scale and attention mechanisms. The pooled representation provides a stable input for the dual-output prediction heads, the softmax classifier for classify the medication state of the patients, and a regression layer for measuring the severity of the disease.
A softmax classifier is a multi-class generalization of logistic regression [31]. It is applied to normalize the raw output scores (logits) of a neural network into probability values, ensuring that the outputs sum to one and are all lie in the range [0, 1]. The function for a softmax classifier function is defined mathematically as shown in Eqn. 4.
where
The MS-TATNet framework incorporates a regression layer to estimate the severity of motor symptoms in patients [32]. Formally, the regression head is implemented as a fully connected layer applied to the pooled temporal representation, is shown in Eqn. 5.
where
The experimental setting was implemented on Windows 10 (version 1909, Microsoft, Redmond, WA, USA) operating system. The model was developed by Python 3.10 (Python Software Foundation, https://www.python.org) with Visual Studio Code 1.96.4 (Microsoft, https://code.visualstudio.com). The model inference latency and real-time capability were evaluated on an Intel i7 CPU (Intel Corporation, Santa Clara, CA, USA). The average latency per sequence is 27 ms, corresponding to 35 frames per second (FPS), confirming that the system operates in real-time on CPU hardware. Table 2 displays the parameters used in MS-TATNet framework.
| Category | Parameter | Value |
| Data | Batch size | 16 |
| MS-TCN | Input size | 1 |
| Hidden size | 64 | |
| Kernel sizes | [3, 5, 7] | |
| Dropout | 0.2 | |
| Activation | ReLU | |
| Attention & transformer | Multi-head Attention heads | 4 |
| Transformer layers | 2 | |
| Transformer hidden size (d_model) | 64 | |
| Batch first | True | |
| Optimizer & training | Optimizer | Adam |
| Learning rate | 0.001 | |
| Weight decay | 0.0001 | |
| Epochs | 50 | |
| Loss function | Classification: CrossEntropyLoss, Regression: MSELoss |
MS-TATNet, Multi-Scale Temporal Attention-Transformer Network; MS-TCN, Multi-Scale Temporal Convolutional Network.
Table 3 presents the hyperparameter tuning results of the MS-TATNet framework with different learning rates between 0.0001 to 0.01 and training epochs of 10 to 50. The very low learning rates of 0.0001–0.0005 show steady convergence of the model, but require more epochs to approach its best performance. The most balanced performance was obtained with a learning rate of 0.001. The standard deviation (SD) values reported in the table indicate the stability of model performance across multiple runs, with lower SD reflecting more consistent results. In addition, the inclusion of 95% confidence intervals provides a statistical measure of reliability for the observed accuracy values, allowing clearer interpretation of the model’s robustness under different learning-rate and epoch combinations. Overall, this provides evidence that the precise tuning of learning rate and epochs significantly increases detection performance and stability in the MS-TATNet framework.
| Learning rate | Epochs | Accuracy (%) | Precision (%) | Recall (%) | F1-score (%) | R2 Score (%) | Std Dev | 95% confidence score (%) |
| 0.0001 | 10 | 98.00 | 97.50 | 97.59 | 97.55 | 94.00 | 0.39 | 97.76–98.24 |
| 20 | 98.53 | 98.00 | 98.10 | 98.05 | 94.50 | 0.28 | 98.35–98.71 | |
| 30 | 98.78 | 98.25 | 98.40 | 98.32 | 94.80 | 0.27 | 98.60–98.96 | |
| 40 | 98.80 | 98.43 | 98.50 | 98.45 | 95.00 | 0.21 | 98.65–98.95 | |
| 50 | 98.00 | 98.30 | 98.60 | 98.55 | 95.20 | 0.25 | 97.83–98.17 | |
| 0.0005 | 10 | 98.54 | 98.10 | 98.20 | 98.15 | 94.60 | 0.22 | 98.38–98.70 |
| 20 | 98.80 | 98.41 | 98.50 | 98.45 | 95.00 | 0.21 | 98.65–98.95 | |
| 30 | 99.00 | 98.60 | 98.70 | 98.65 | 95.40 | 0.21 | 98.85–99.15 | |
| 40 | 99.12 | 98.70 | 98.80 | 98.75 | 95.60 | 0.20 | 98.98–99.26 | |
| 50 | 99.24 | 98.81 | 98.90 | 98.85 | 95.80 | 0.18 | 99.11–99.37 | |
| 0.001 | 10 | 98.70 | 98.30 | 98.40 | 98.35 | 95.00 | 0.21 | 98.55–98.85 |
| 20 | 98.90 | 98.32 | 98.60 | 98.55 | 95.20 | 0.25 | 98.73–99.07 | |
| 30 | 99.10 | 98.70 | 98.80 | 98.75 | 95.60 | 0.20 | 98.96–99.24 | |
| 40 | 99.21 | 98.80 | 98.80 | 98.85 | 95.80 | 0.18 | 99.08–99.34 | |
| 50 | 99.63 | 98.34 | 99.50 | 99.67 | 96.38 | 0.56 | 99.28–99.98 | |
| 0.005 | 10 | 98.80 | 98.40 | 98.50 | 98.45 | 95.00 | 0.21 | 98.65–98.95 |
| 20 | 99.00 | 98.60 | 98.70 | 98.65 | 95.40 | 0.21 | 98.85–99.15 | |
| 30 | 99.15 | 98.75 | 98.85 | 98.80 | 95.60 | 0.22 | 98.99–99.31 | |
| 40 | 99.25 | 98.85 | 98.55 | 98.90 | 95.80 | 0.25 | 99.08–99.42 | |
| 50 | 99.35 | 98.95 | 99.05 | 99.00 | 96.00 | 0.21 | 99.20–99.50 | |
| 0.01 | 10 | 98.30 | 98.10 | 98.20 | 98.15 | 94.60 | 0.12 | 98.21–98.39 |
| 20 | 98.75 | 98.35 | 98.45 | 98.40 | 95.20 | 0.20 | 98.61–98.89 | |
| 30 | 98.90 | 98.30 | 98.60 | 98.55 | 95.40 | 0.25 | 98.73–99.07 | |
| 40 | 99.05 | 98.65 | 98.75 | 98.70 | 95.60 | 0.21 | 98.90–99.20 | |
| 50 | 99.29 | 98.82 | 98.92 | 98.81 | 95.80 | 0.21 | 99.14–99.44 |
The ROC curve evaluating the performance of the model as presented in Fig. 5, which shows TPR against FPR at different decision thresholds. The ROC curve approaches the top-left corner of the plot, with AUC value of 0.9901. The results suggest the model performed extremely well with little amounts of false positives and false negatives.
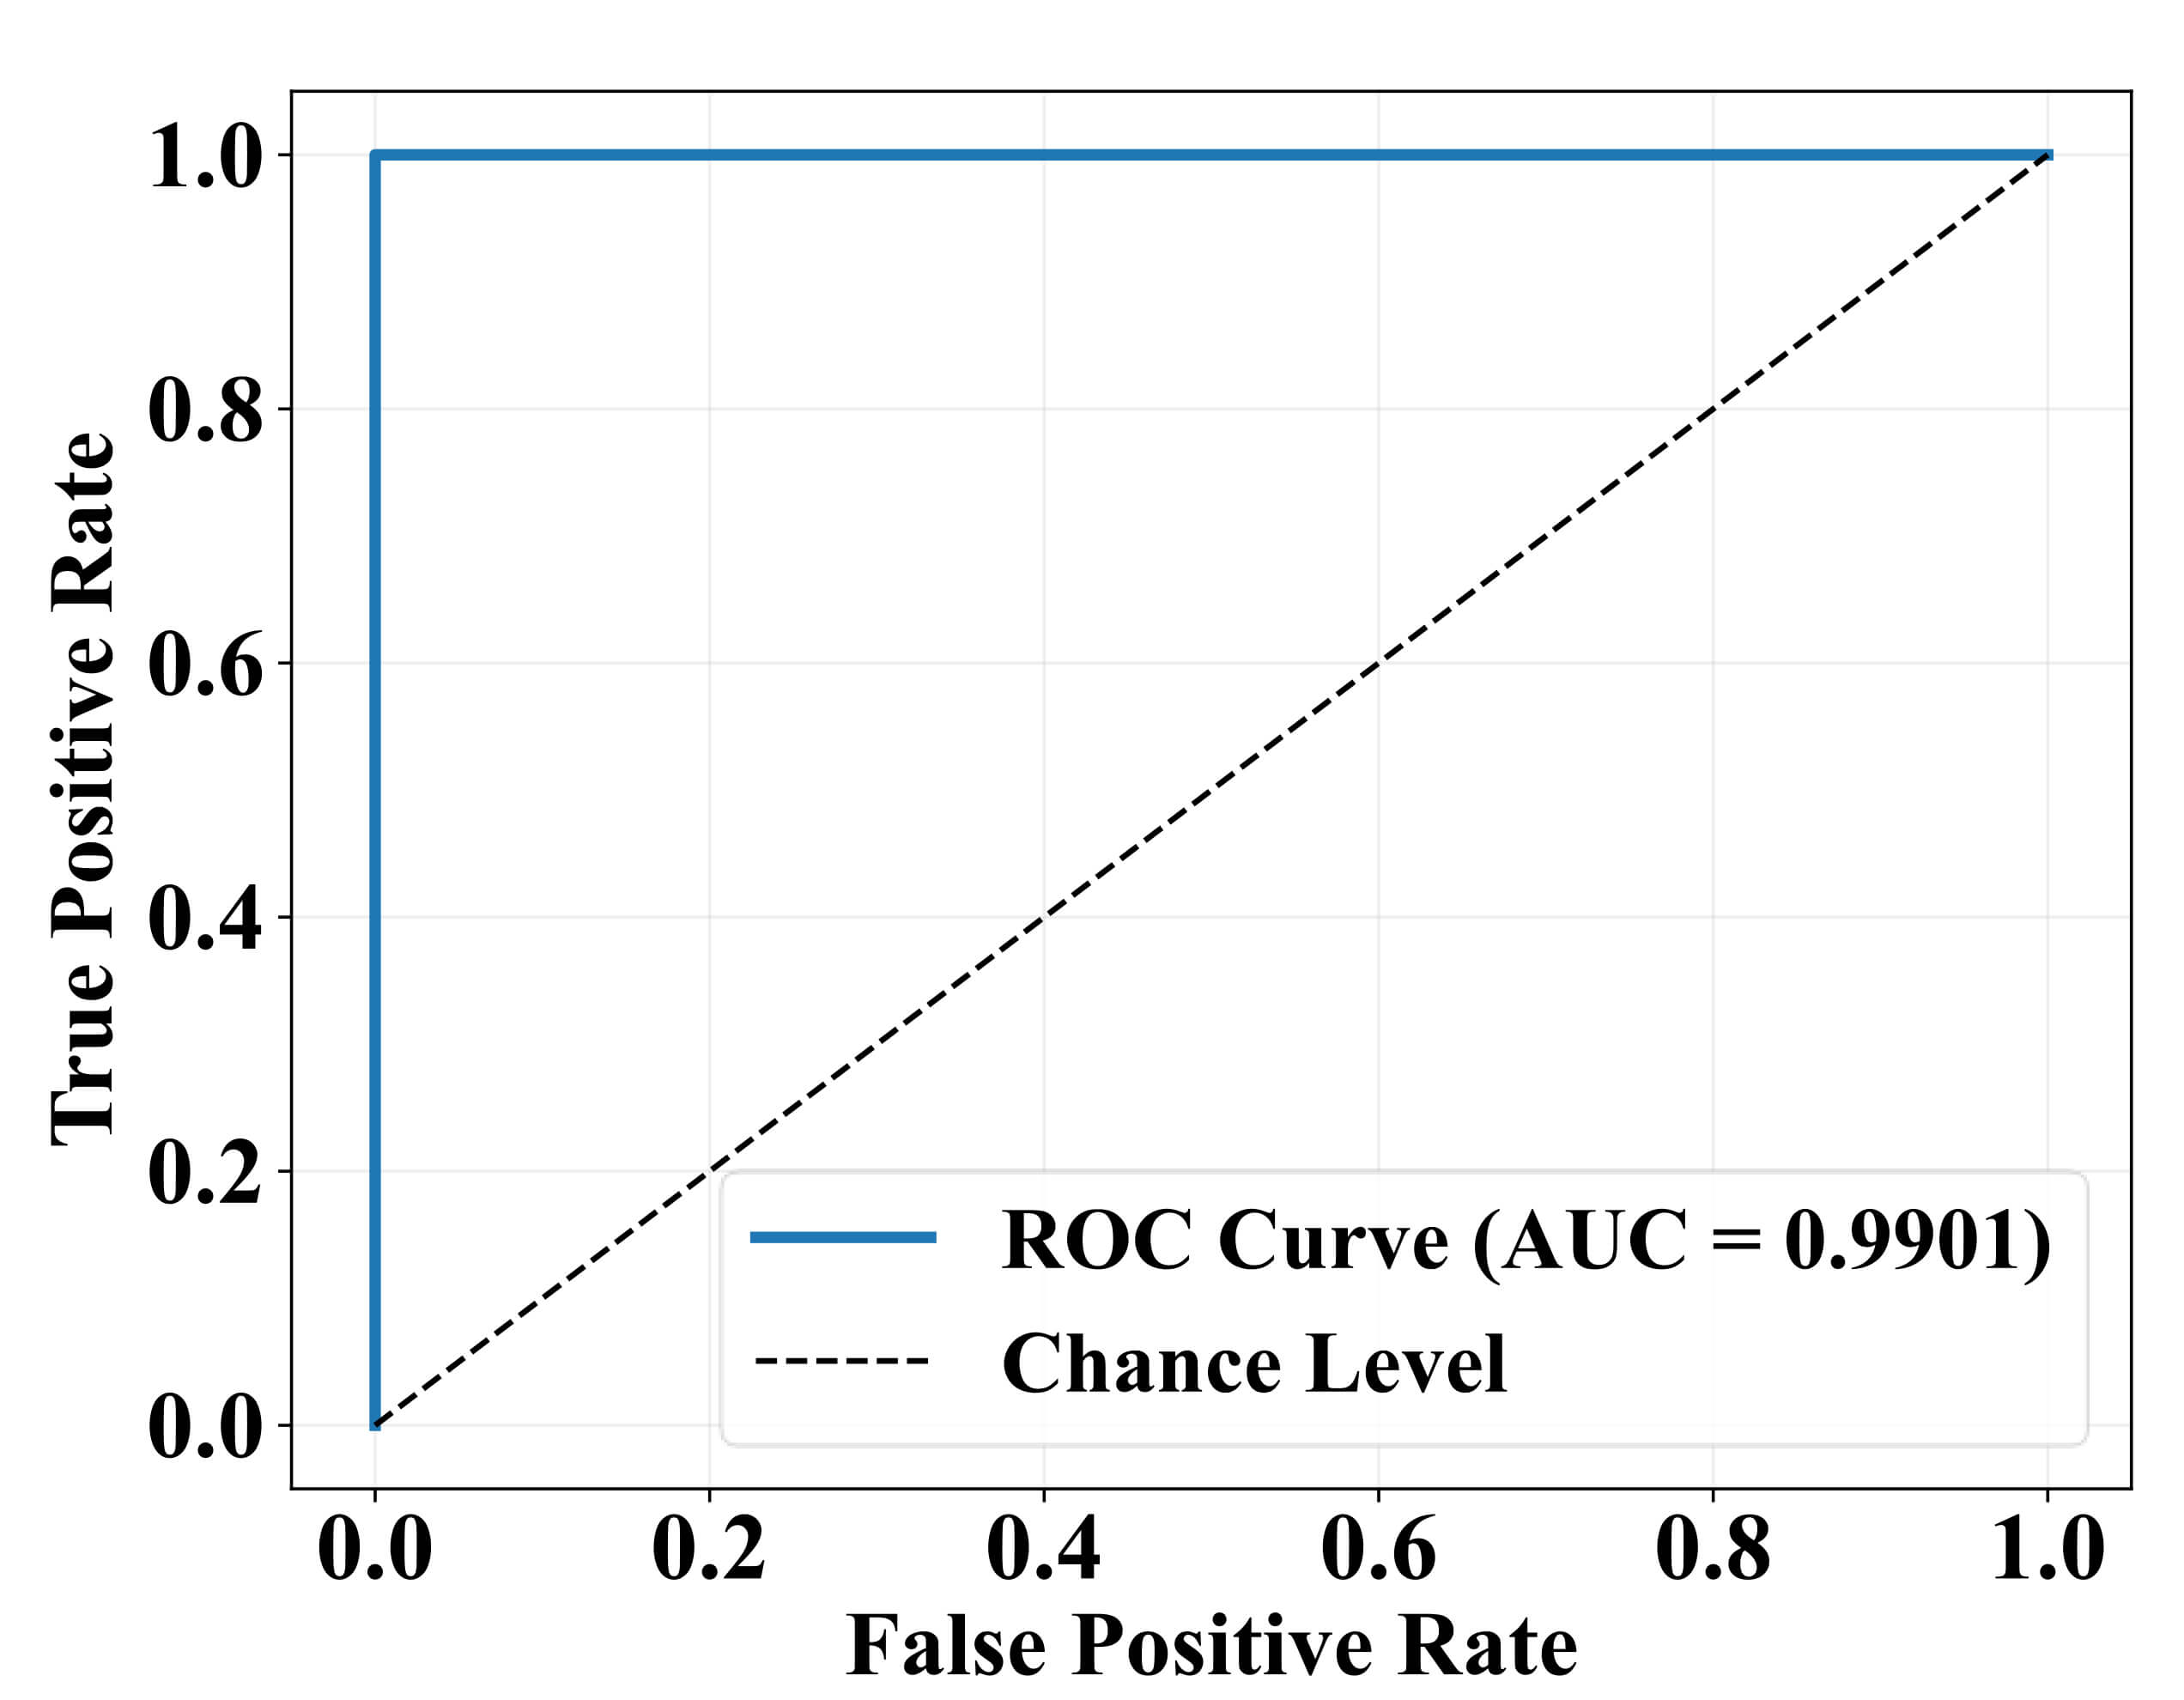 Fig. 5.
Receiver operating characteristic (ROC) curve with area under curve (AUC).
Fig. 6 illustrates the performance of the classification model by comparing the predicted labels against the actual labels. The matrix shows that the model correctly predicted 1180 instances as “YES” and 534 instances as “NO”. Misclassifications include 15 false positives and 10 false negatives. This indicates high accuracy with relatively few misclassifications, demonstrating the model’s effectiveness in distinguishing between the two classes.
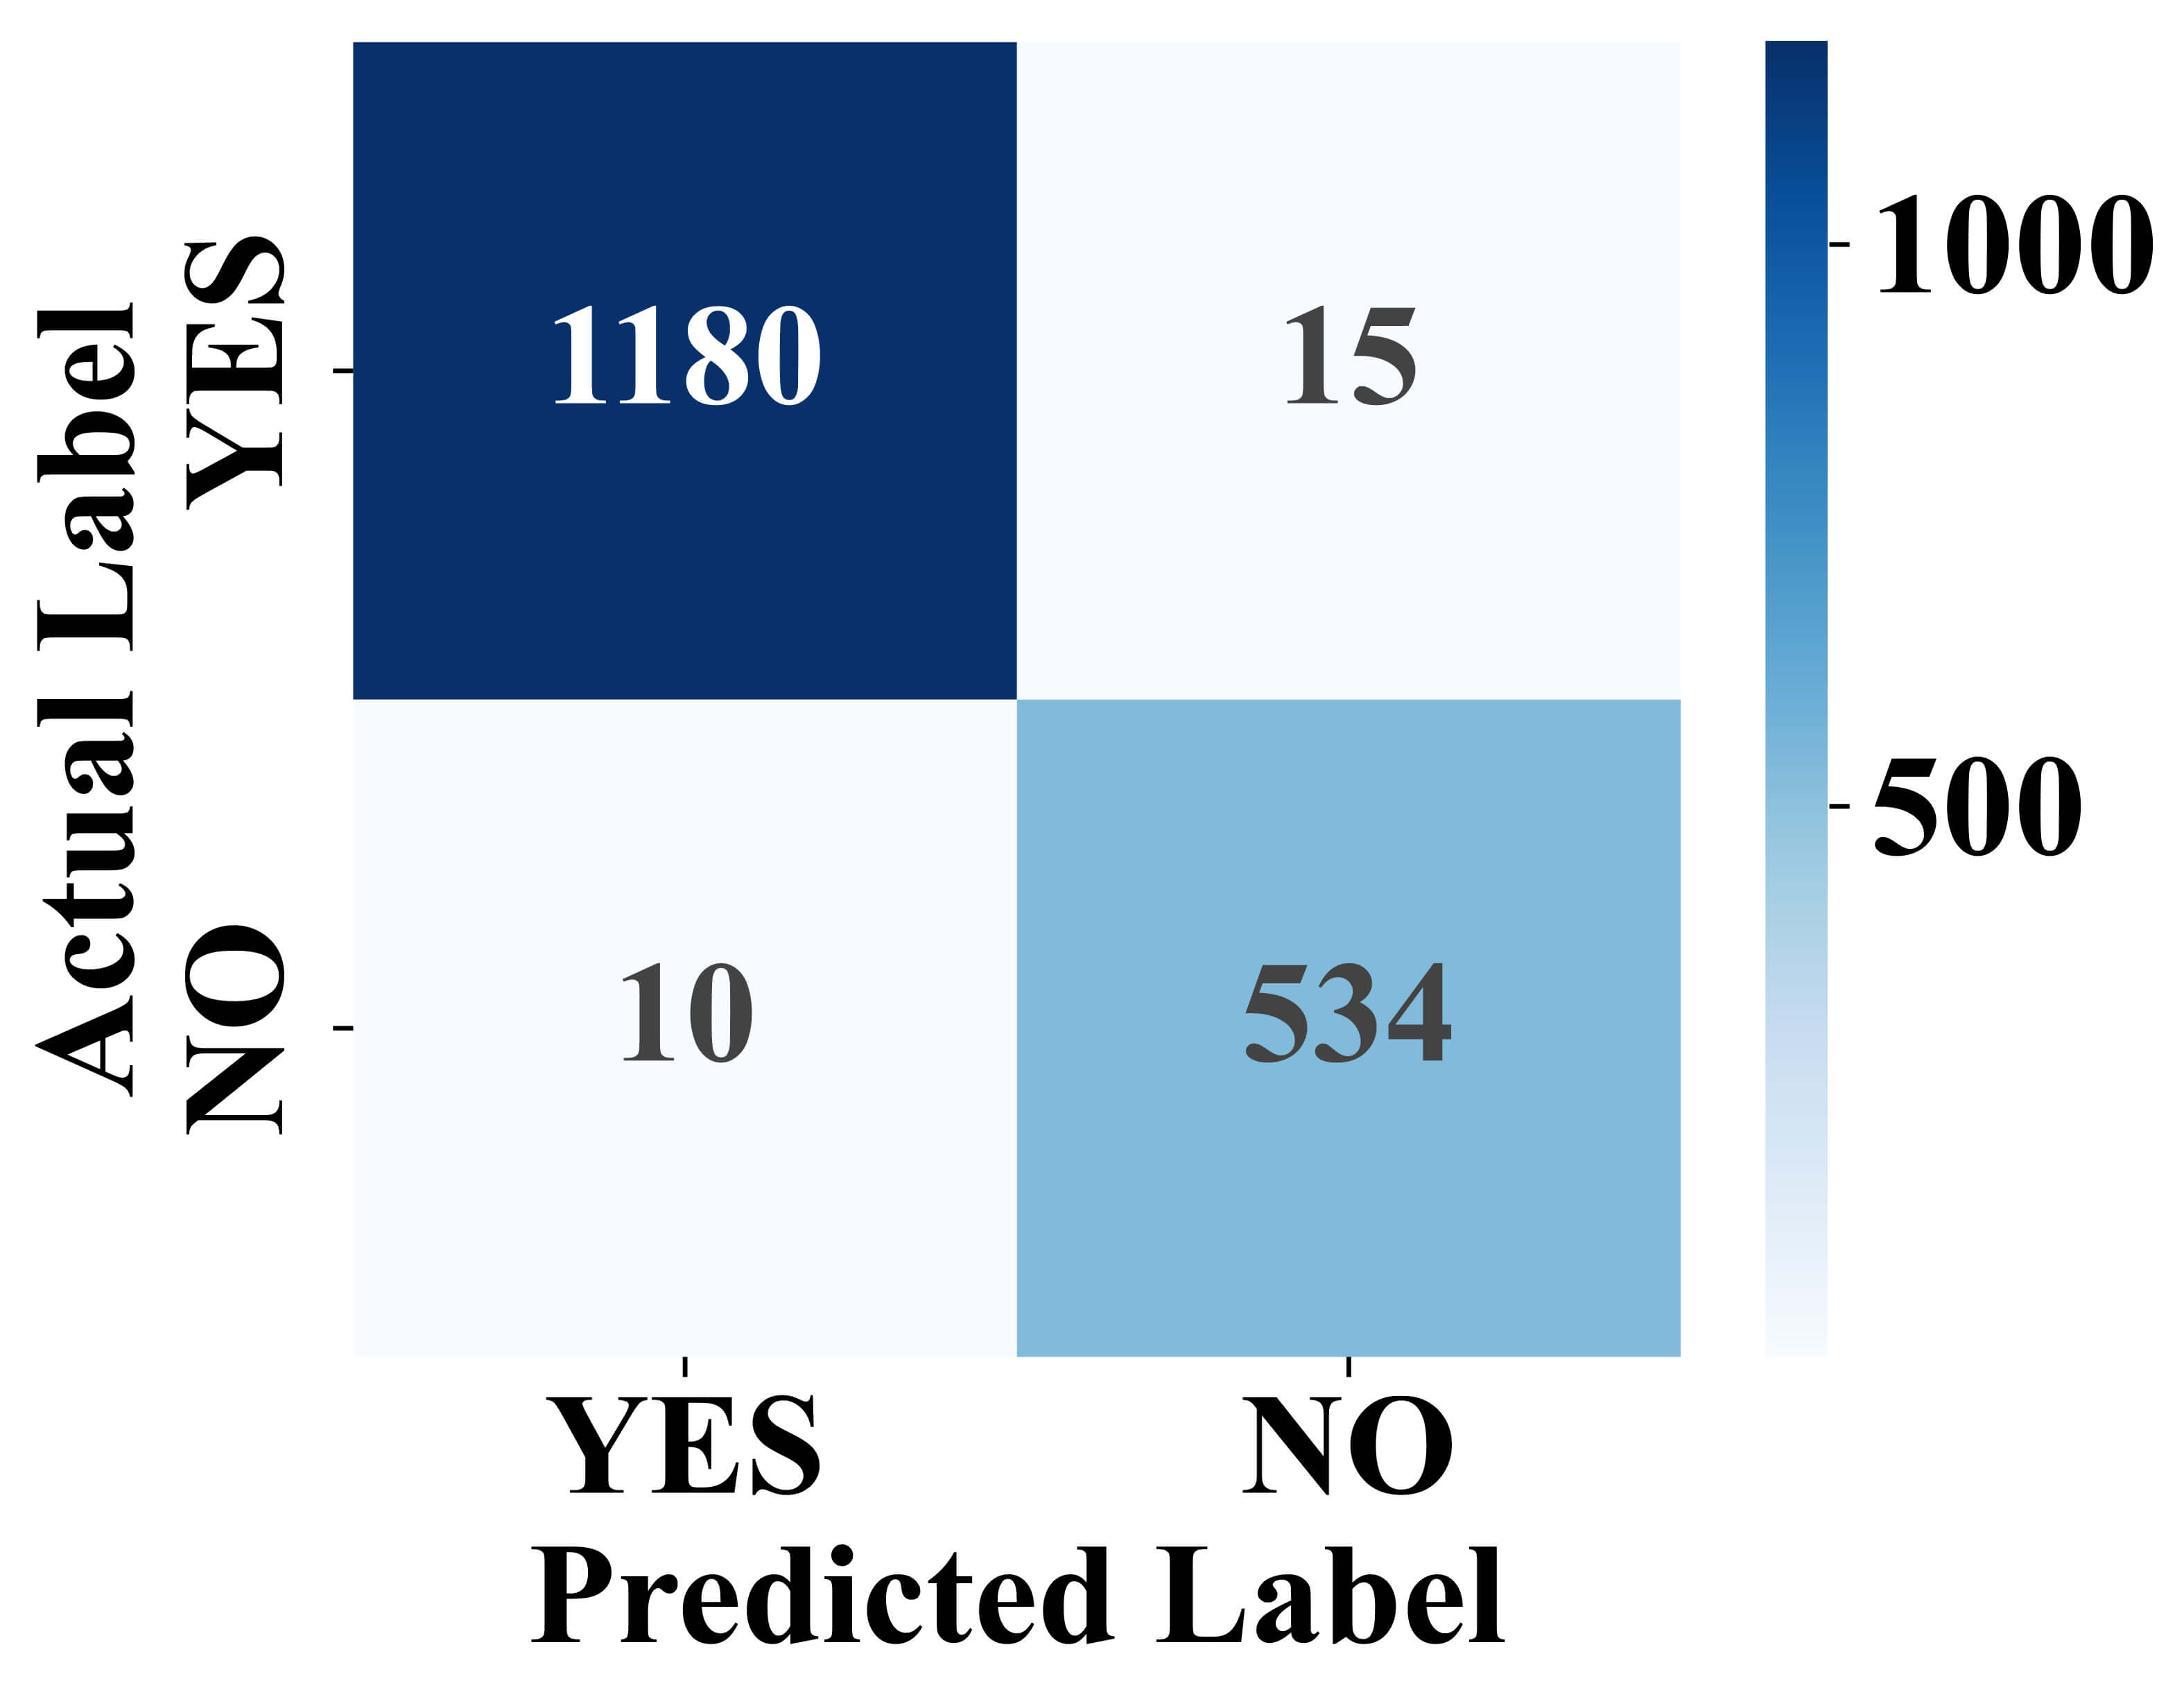 Fig. 6.
Confusion matrix of model classification results.
Fig. 7 presents the differences in time of detection (minutes) and compared between PD and control participants. The PD group has a greater range of variability in detection time with interquartile range distributed around a higher median than controls. Outliers show evidence of particularly early or late detections for individuals in the PD group. In contrast, the control group’s distribution is narrow around zero, indicating a stable time of detection. The red dashed line at zero serves as a reference baseline highlighting the deviation of PD patients from healthy controls. These results show the model’s sensitivity to identify variations in motor states in PD subjects, whereas the controls stay relatively stable.
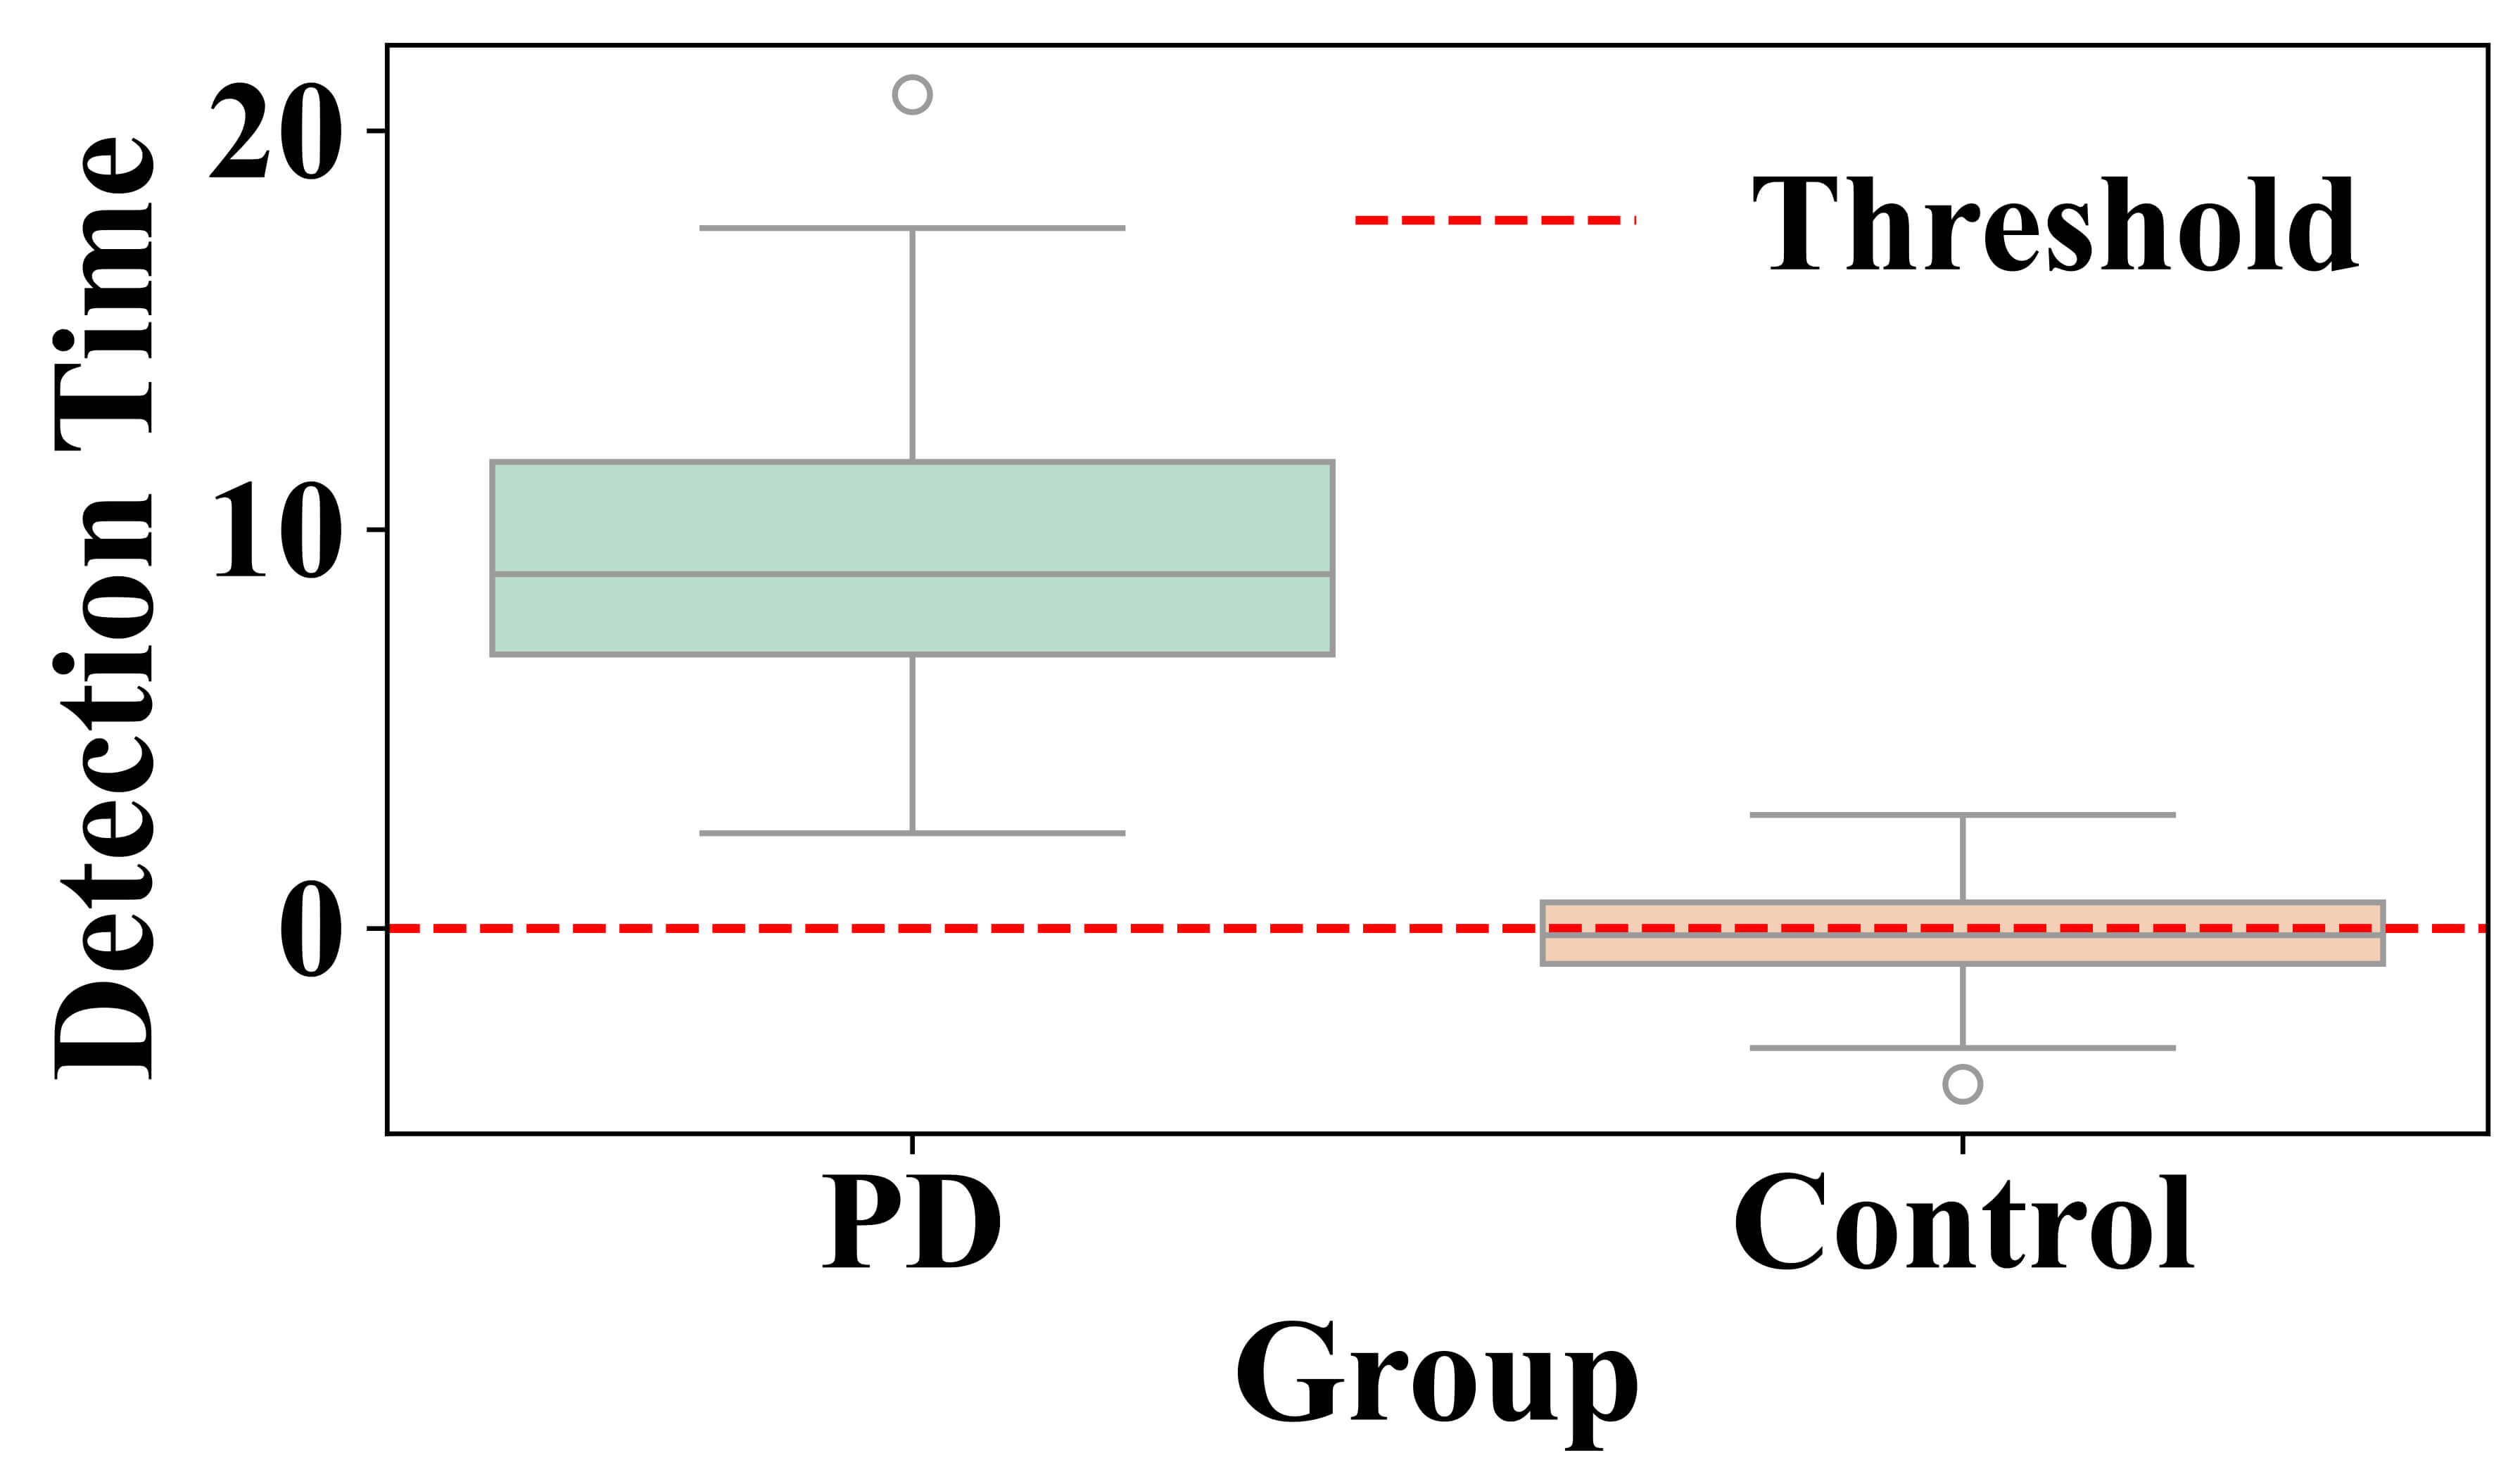 Fig. 7.
Detection time difference between Parkinson’s Disease and control groups for motor state variations in PD subjects.
Fig. 8 shows longitudinal variations in motor symptom severity detection over four sessions. Each line represents a separate subject (blue lines represent PD patients, green lines represent control subjects). PD patients display higher detected severity scores, reflected in greater variability across sessions, in line with the variable nature of their motor symptoms. Control subjects indicated low severity score near zero across sessions with minimal variation. This clearly shows that the proposed framework can discriminate subjects between Parkinson’s and control groups as well as account for session-to-session changes and variation in symptom severity in PD subjects.
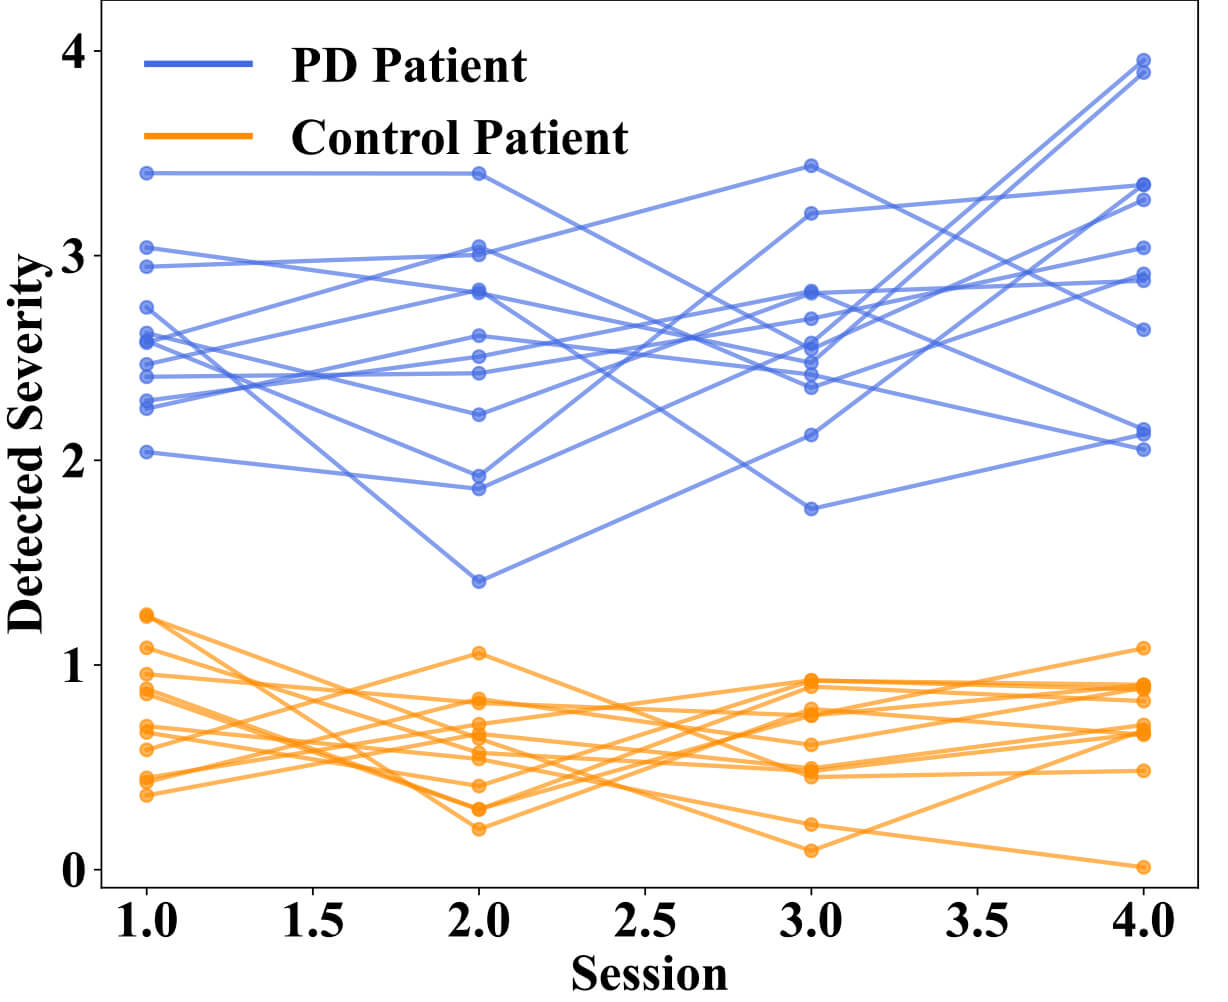 Fig. 8.
Longitudinal variation in detected motor symptom severity across multiple sessions between Parkinson’s Disease patients and control patients.
Fig. 9 illustrates the relationship between the model-predicted severity values and the clinician-rated MDS-UPDRS motor scores. Each blue point represents an individual observation, while the red regression line with its 95% confidence interval highlights the strong linear relationship (r = 0.94, 95% CI = [0.88, 0.97], p = 0.0000032) between detected and clinically scored severity. The strong positive correlation indicates that the model reliably reflects overall motor symptom severity. Notably, the model captures subtle session-to-session fluctuations in tremor, rigidity, and bradykinesia, which likely correspond to underlying dopaminergic variability within the basal ganglia-thalamocortical loops. These findings suggest that the severity scores not only correlate with clinical ratings but also provide a continuous and sensitive representation of motor dysfunction, offering potential utility for tracking disease progression or monitoring therapeutic response in real-world settings. Fig. 10 displays the variation in severity estimation errors among patient groups, highlighting the model’s generalizability. Fig. 10a indicates the median, quartiles, and outlying errors for each group, while Fig. 10b shows the full error density. The result indicates that early-stage PD patients and healthy controls had the lowest errors, indicating accurate severity estimation when symptoms are minimal or absent.
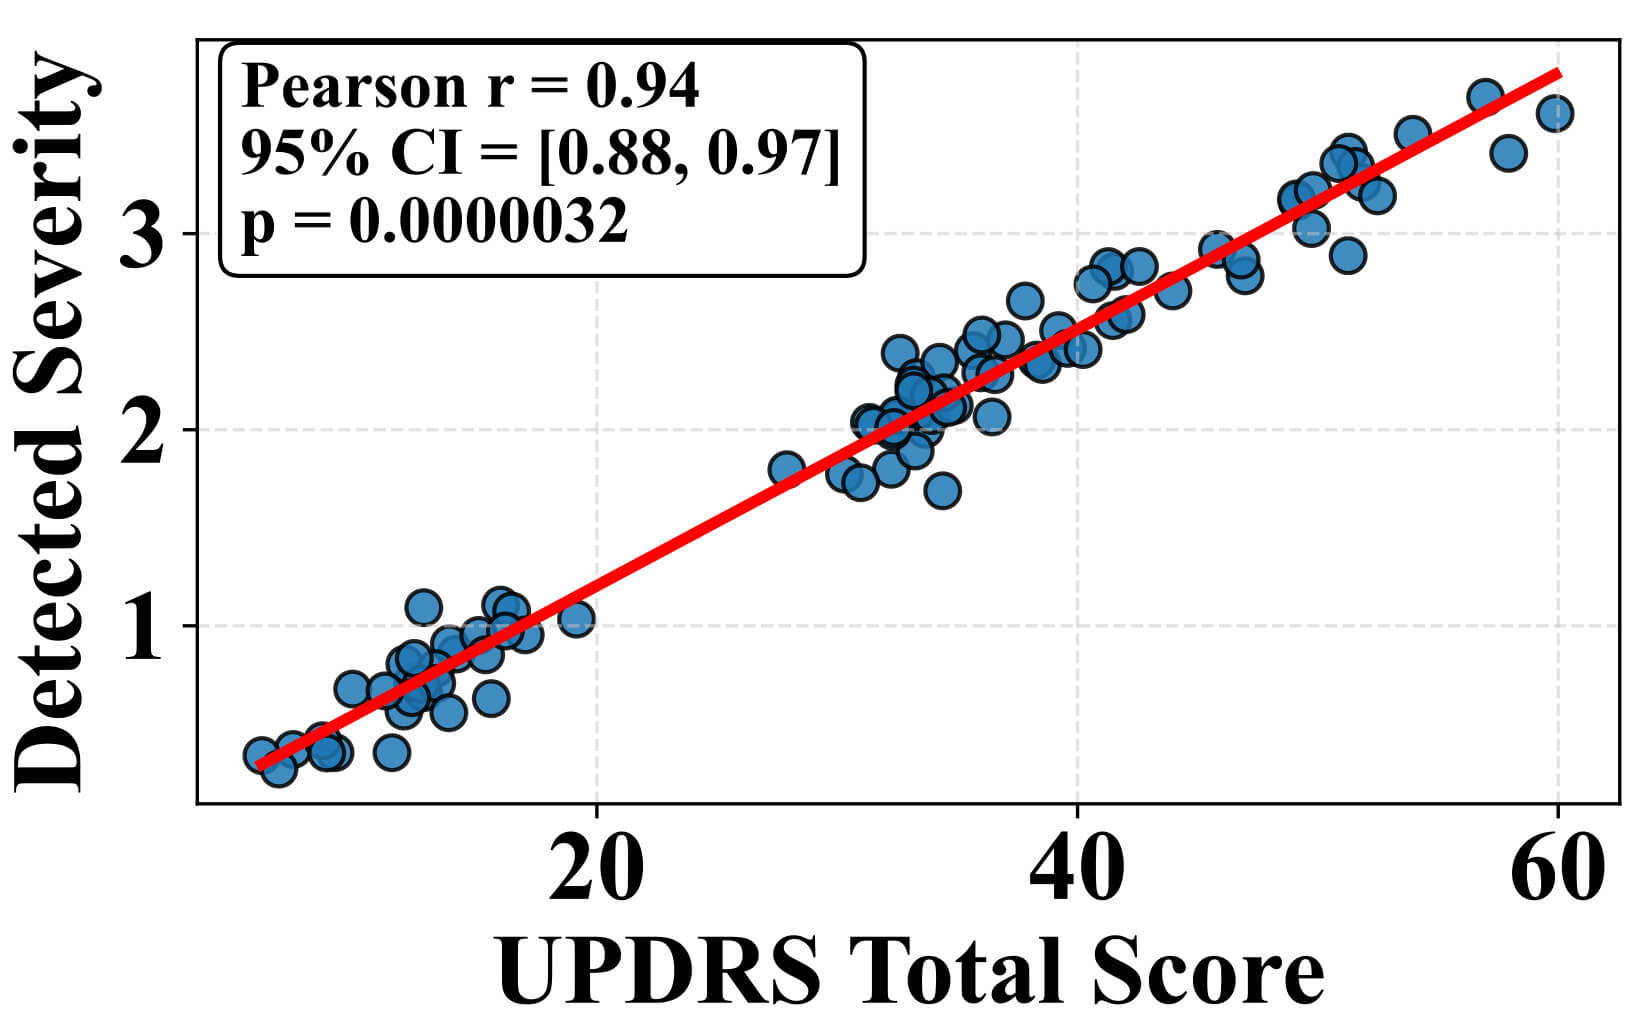 Fig. 9.
Correlation between detected severity score from the MS-TATNet model and unified Parkinson’s Disease rating scale total scores clinical ratings. CI, confidence interval.
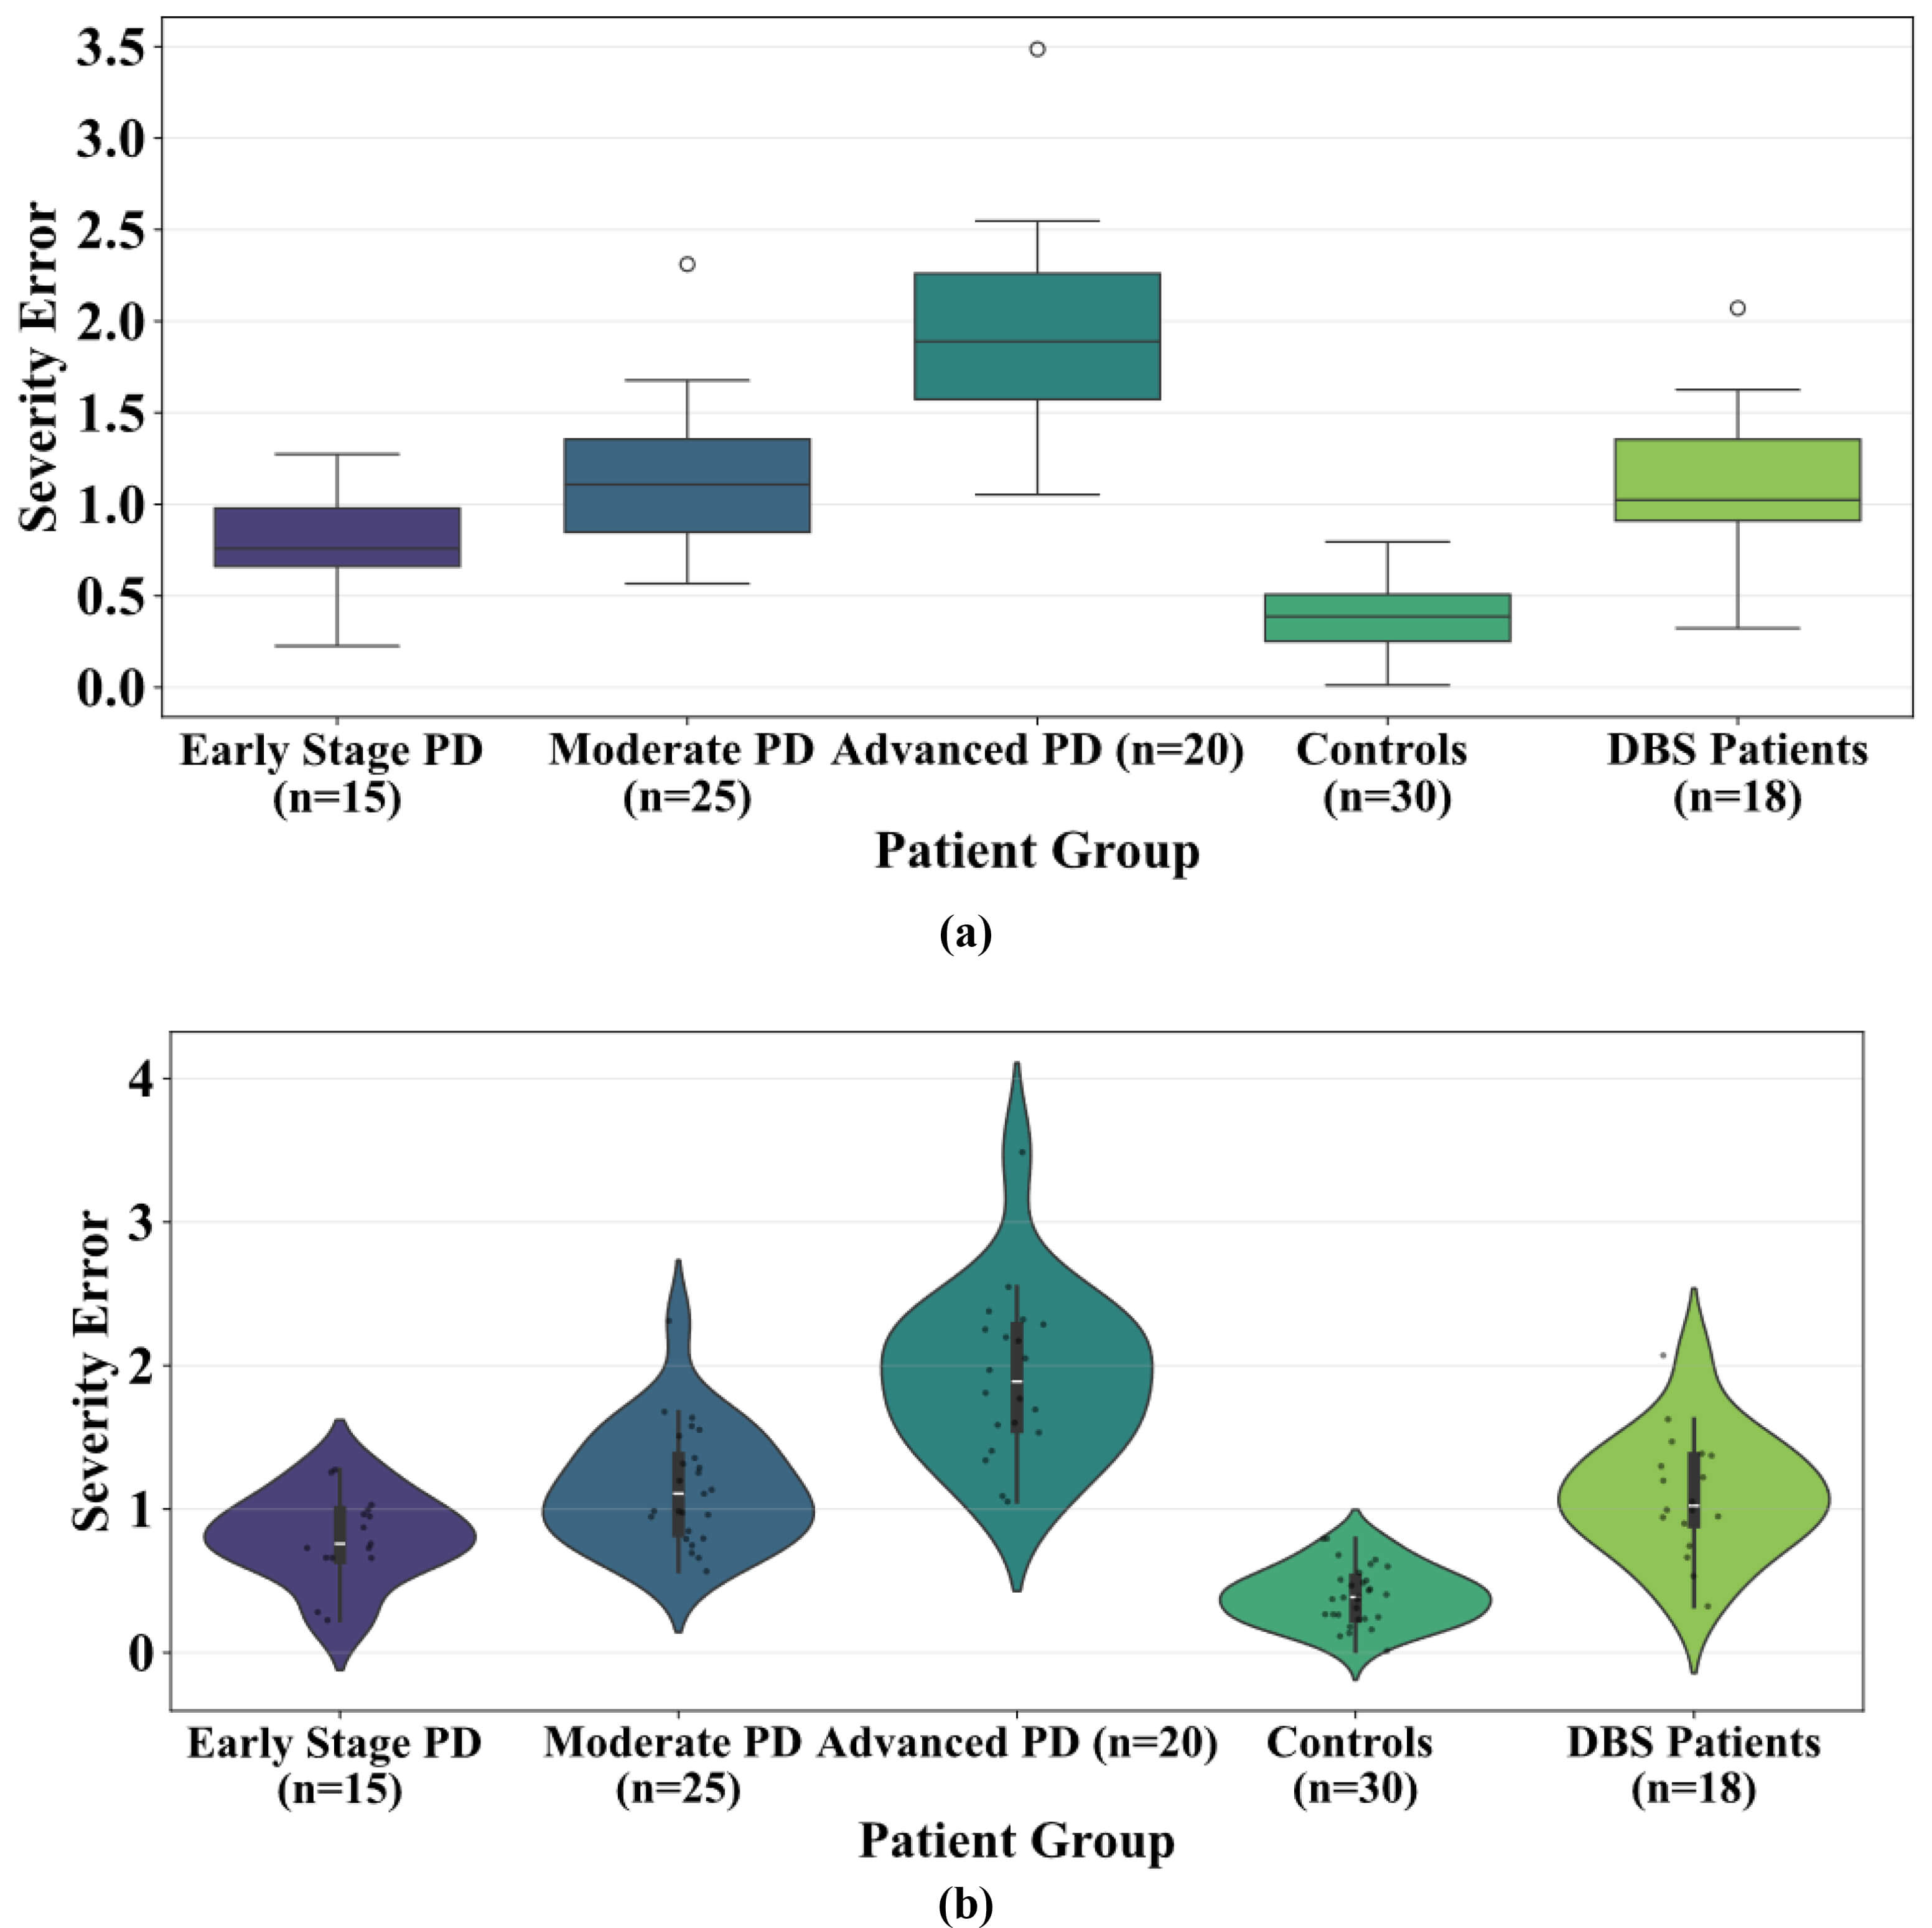 Fig. 10.
Severity estimation error. Severity estimation error across individual’s patient groups, including early-stage PD, moderate PD, advanced PD, controls, and Deep Brain Stimulation (DBS) patients (a) distribution highlighting median and variance (b) showing density and spread.
Table 4 presents the key performance metrics of the model including Accuracy, F1-Score, Recall, Specificity, R2 Score, and Mean Absolute Error (MAE), along with their 95% confidence intervals. The confidence intervals indicate the range within which the true metric values are expected to fall, providing a measure of statistical reliability. High metric values paired with narrow confidence intervals demonstrate that the model performs consistently and reliably across different samples.
| Metrics | Mean score | 95% CI low | 95% CI high |
| Accuracy | 0.97 | 0.95 | 0.99 |
| F1-Score | 0.96 | 0.93 | 0.98 |
| Recall | 0.94 | 0.91 | 0.97 |
| Specificity | 0.97 | 0.94 | 0.99 |
| R2 Score | 0.95 | 0.93 | 0.97 |
| MAE | 0.15 | 0.13 | 0.17 |
Table 5 indicate that the model performs steadily and consistently across several data splits and has a low standard deviation. These results demonstrate the model’s durability and dependability while validating its strong and reliable performance. These findings suggest that the model is not too reliant on any subset of data. This mitigates concerns regarding overfitting and data uniformity.
| Fold | Accuracy (%) | Precision (%) | Recall (%) | F1-score (%) | R2-score (%) | Std Dev | 95% confidence score (%) |
| Fold 1 | 99.61 | 99.29 | 99.46 | 99.00 | 96.35 | 1.18 | 99.46–99.76 |
| Fold 2 | 99.58 | 99.31 | 99.42 | 99.62 | 96.32 | 1.15 | 99.42–99.73 |
| Fold 3 | 99.65 | 99.36 | 99.50 | 99.67 | 96.39 | 1.18 | 99.50–99.80 |
| Fold 4 | 99.69 | 99.38 | 99.53 | 99.68 | 96.42 | 1.19 | 99.54–99.82 |
| Fold 5 | 99.62 | 99.27 | 99.45 | 99.63 | 96.34 | 1.17 | 99.46–99.77 |
| Fold 6 | 99.59 | 99.28 | 99.40 | 99.61 | 96.30 | 1.16 | 99.44–99.74 |
| Fold 7 | 99.66 | 99.35 | 99.51 | 99.66 | 96.38 | 1.18 | 99.51–99.82 |
| Fold 8 | 99.60 | 99.30 | 99.48 | 99.61 | 96.33 | 1.16 | 99.43–99.75 |
| Fold 9 | 99.64 | 99.33 | 99.48 | 99.65 | 96.37 | 1.17 | 99.49–99.78 |
| Fold 10 | 99.67 | 99.37 | 99.52 | 99.68 | 96.38 | 1.19 | 99.52–99.82 |
In this section, an ablation analysis is performed to assess the impact of MS-TCN, SDPA mechanism, stack transformer encoder with MHSA, and temporal pooling on MS-TATNet model for classifying PD motor symptoms. We compare the model’s performance with and without these techniques and different combinations of these techniques to analyze the impact of the techniques in the MS-TATNet framework. To validate our findings, we employ several evaluation measures, including accuracy, precision, recall, and F1-score, along with R2 Score and SD value. The findings, illustrated in Table 6, validate the efficacy of these techniques, resulting in more reliable classification outcomes.
| Variant | Accuracy (%) | Precision (%) | Recall (%) | F1-score (%) | R2 score (%) | Std Dev |
| Without MS-TCN | 99.26 | 99.00 | 99.10 | 99.03 | 96.15 | 0.98 |
| Without attention | 99.05 | 98.80 | 98.90 | 98.85 | 96.06 | 0.97 |
| Without transformer encoder with MHSA | 99.10 | 98.90 | 99.00 | 98.95 | 96.08 | 0.95 |
| Without pooling | 98.91 | 98.70 | 98.80 | 98.75 | 95.98 | 0.97 |
| Only with MS-TCN | 98.50 | 98.20 | 98.35 | 98.27 | 95.78 | 1.11 |
| Only with transformer | 98.85 | 98.60 | 98.75 | 98.67 | 95.96 | 0.99 |
| Only with pooling | 95.15 | 94.07 | 94.50 | 94.25 | 94.03 | 1.93 |
| With MS-TCN without attention, transformer, pooling | 98.20 | 97.90 | 98.00 | 97.95 | 95.63 | 1.15 |
| With transformer, without MS-TCN, attention, pooling | 97.95 | 97.60 | 97.75 | 97.65 | 95.50 | 1.19 |
| With pooling without MS-TCN, attention, transformer | 97.70 | 97.40 | 97.50 | 97.45 | 95.38 | 1.23 |
| With MS-TCN and pooling without attention and transformer | 98.35 | 98.05 | 98.15 | 98.10 | 95.70 | 1.10 |
| With transformer and pooling without MS-TCN and attention | 98.60 | 98.30 | 98.40 | 98.35 | 95.83 | 1.05 |
| With MS-TCN and attention without transformer and pooling | 99.12 | 98.75 | 98.85 | 98.78 | 96.03 | 0.90 |
| With MS-TCN and transformer without attention and pooling | 99.15 | 98.90 | 99.00 | 98.95 | 96.10 | 0.84 |
| With MS-TCN, transformer, attention without pooling | 99.42 | 99.18 | 99.30 | 99.25 | 96.23 | 0.79 |
| Proposed (MS-TCN, attention, transformer, pooling, classifier, regression) | 99.63 | 99.34 | 99.50 | 99.67 | 96.38 | 0.82 |
Table 7 summarizes the trade-offs between different input modalities, including RGB video, 3D skeleton, and the 2D skeleton utilized in the MS-TATNet model. It presents identity exposure, data stored, reconstruction risk, hardware requirements, model accuracy, inference latency per sequence, and real-time capability. The result highlight that the 2D skeleton approach achieves the highest accuracy while maintaining very low privacy risk and real-time performance on CPU hardware, whereas RGB video and 3D skeleton modalities which either compromise privacy or require more specialized hardware.
| Method | Identity exposure | Data stored | Reconstruction risk | Hardware needed | Accuracy (%) | Device latency per sequence (ms) | Real-time capable |
| RGB video | Very High | Full video | High (face + background) | RGB camera | 94.38 | 81 | No |
| 3D skeleton | Medium | XYZ joints | Medium | Depth camera | 95.76 | 48 | Partially |
| 2D skeleton (proposed) | Low | 2D joints only | Very Low | RGB camera | 99.63 | 27 | Yes |
RGB, red, green, and blue.
This section evaluates the effectiveness of the MS-TATNet model in comparison to various existing methods for classifying PD.
Table 8 (Ref. [14, 17, 19, 21, 23, 24]) compares the MS-TATNet with existing models, such as Support Vector Machine with Recursive Feature Elimination (SVM-RFE), DNN, Support Vector Machine with Radial Basis Functions (SVM-RBF), ML based approaches, ST-GCN and Global Temporal-difference Shift Network (GTSN). Previous models achieved accuracies ranging from 71–95%, while the MS-TATNet achieved high performance of 99.63% accuracy, 99.50% recall and 99.33% specificity. Overall, this demonstrates the MS-TATNet superior ability to capture motor state fluctuation with both high sensitivity and generalization. This is due to its capability to extract short- and long-range temporal dependencies across skeletal pose data while preserving privacy. This enables robust generalization across patients and relatively more reliable motor state detection of motion-state fluctuations.
| Reference | Method | Accuracy (%) | Recall (%) | Specificity (%) |
| Wu et al. [14] (2024) | SVM-RFE | 84.21 | 89.47 | 89.47 |
| Davidashvilly et al. [17] (2024) | DNN | 84.6 | 96.20 | 96.90 |
| Rodriguez et al. [19] (2024) | SVM-RBF | 88 | 90 | 96 |
| Brien et al. [21] (2023) | ML-based approaches | 95 | 83 | 78 |
| Zeng et al. [23] (2023) | ST-GCN | 71.25 | 71.10 | 85.30 |
| Liu et al. [24] (2023) | Global Temporal-difference Shift Network | 90.6 | 85 | 85 |
| Proposed | MS-TATNet | 99.63 | 99.50 | 99.33 |
SVM-RFE, Support Vector Machine with Recursive Feature Elimination; DNN, Deep Neural Network; SVM-RBF, Support Vector Machine with Radial Basis Functions; ML, Machine Learning; ST-GCN, Spatio-Temporal Graph Convolutional Network.
Parkinson’s motor symptoms originate from dopaminergic loss in the substantia nigra and abnormal modulation of the basal ganglia–thalamocortical motor circuits. These pathological changes produce bradykinesia, rigidity, impaired turning, and variability in sit-to-stand transitions patterns that are directly captured in the temporal dynamics of the 2D skeleton pose data. The MS-TATNet identifies reduced joint velocity, decreased movement amplitude, hesitation, and tremor-like oscillations, which are biomechanical correlates of these neural circuit abnormalities.
The continuous severity score generated by the regression module shows strong alignment with clinically evaluated components of the MDS-UPDRS Part III motor subscale, including bradykinesia, tremor intensity, gait, and postural control. Higher predicted severity values correspond to physiologically meaningful impairment and reflect dopaminergic ON/OFF fluctuations rather than only a statistical trend. Thus, the model provides a clinically interpretable, objective, and fine-grained digital biomarker that aligns with established PD motor circuit dysfunction.
In addition, the model’s ability to detect continuous fluctuations in severity has direct implications for PD therapy and disease management. Dopaminergic medications such as levodopa produce characteristic pharmacodynamic cycles, including wearing-off, delayed-ON, and dose-failure that manifest as measurable changes in movement amplitude, speed, and tremor patterns. The model captures these transitions, allowing potential real-time monitoring of medication response. Because symptom trajectories vary across early, moderate, and advanced PD, the fine-grained severity output can support longitudinal tracking of neurodegenerative progression. Moreover, such continuous monitoring could aid adaptive therapy strategies, such as optimizing levodopa dosing schedules or informing closed-loop DBS systems with objective, high-frequency motor state information.
In this work, we introduce the MS-TATNet, a privacy-preserving and real-time framework that monitor motor symptoms of PD, utilizing 2D skeleton pose data. The framework successfully employs a dilated MS-TCN to capture short, medium, and long-term temporal dependencies, SDPA that emphasizes informative features and stacks transformer encoder blocks with MHSA to provide advanced sequence modeling. The framework used temporal pooling layer to generate compact representations that were fed through two task-specific modules to produce accurate medication ON/OFF state classification of the patient and estimate disease severity. Experiments result on the REMAP dataset show the framework demonstrates excellent performance, achieving an accuracy of 99.63%, specificity of 99.33%, and recall of 99.50%, with a strong correlation to UPDRS scores and robust severity estimation across patients. Overall, this work provides a clinically relevant, scalable, privacy-preserving monitoring motor symptoms of PD, significantly improving upon the state-of-the-art for automated neurological assessment beyond wearable or video-based approaches. This study used only the REMAP dataset because comparable PD skeletal-movement datasets are not publicly available. Future work will validate the model on external datasets when they become accessible.
The dataset used in this study is publicly available and was obtained from the referenced source.
BV and SK contributed to the conception of the problem setting and overall design of the work. BV built the conceptualization and methodology, and SK implemented the work. BV and SK contributed to validation. Both authors contributed to editorial changes in the manuscript. Both authors read and approved the final manuscript. Both authors have participated sufficiently in the work and agreed to be accountable for all aspects of the work.
Not applicable.
Not applicable.
This research received no external funding.
The authors declare no conflict of interest.
References
Publisher’s Note: IMR Press stays neutral with regard to jurisdictional claims in published maps and institutional affiliations.